growth, water relations, and accumulation of organic and ...growth, water relations, and...
TRANSCRIPT

Plant Physiol. (1997) 113: 881-893
Growth, Water Relations, and Accumulation of Organic and lnorganic Solutes in Roots of Maize
Seedlings during Salt Stress'
Humberto González Rodríguez', Justin K. M. Roberts, Wayne R. Jordan, and Malcolm C. Drew*
Department of Soil and Crop Sciences (H.G.R., W.R.J.), and Department of Horticultural Sciences (M.C.D.), Texas A&M University, College Station, Texas 77843; and Department of Biochemistry, University of California,
Riverside, California 92521 (J.K.M.R.)
Seedlings of maize (Zea mays L. cv Pioneer 3906), hydroponically grown in the dark, were exposed to NaCl either gradually (salt acclimation) or in one step (salt shock). In the salt-acclimation treatment, root extension was indistinguishable from that of un- salinized controls for at least 6 d at concentrations up to 100 mM NaCI. By contrast, salt shock rapidly inhibited extension, followed by a gradual recovery, so that by 24 h extension rates were the same as for controls, even at 150 mM NaCI. Salt shock caused a rapid decrease in root water and solute potentials for the apical zones, and the estimated turgor potential showed only a small decline; similar but more gradual changes occurred with salt acclimation. The 5-bar decrease in root solute potential with salt shock (150 mM NaCI) during the initial 1 O min of exposure could not be accounted for by dehydration, indicating that substantial osmotic adjustment occurred rapidly. Changes in concentration of inorganic solutes (Na+, K+, and CI-) and organic solutes (proline, sucrose, fructose, and glucose) were measured during salt shock. The contribution of these solutes to changes in root solute potential with salinization was estimated.
Salinity, whether natural or induced by agriculture, is a widespread environmental stress that can limit growth and development of salt-sensitive plants (Greenway and Munns, 1980; McWilliam, 1986). Studies of responses of vegetative plants to salt stress have focused mainly on leaf tissue (Neumann et al., 1988; Thiel et al., 1988; Myers et al., 1990; Cramer and Bowman, 1991), so there is less informa- tion pertinent to growing roots. However, the root is the first organ of the plant to become exposed to salinity, and in some instances it plays a role in exclusion of salt from the leaves (Yeo et al., 1977; Lauchli, 1984). Additionally, the response of the root apical zone to salt stress is critica1 to further growth and development of the root system.
Root responses to salt stress have been less well charac- terized than responses to relatively impermeant osmotica or to water-deficient media. All three stresses involve some degree of dehydration and therefore the likely loss of W,,
This research was supported in part by the Texas Water Re- sources Institute and by the Texas Agriculture Experiment Station.
Permanent address: Universidad Autónoma de Nuevo León, Monterrey, Nuevo LeÓn, México.
* Corresponding author; e-mail [email protected]; fax 1-409- 845-0627.
88 1
but salinity also exposes roots to high concentrations of ions that are readily transported into cells. Can lowering the W, account for inhibition of root extension with all three stresses? With osmotic stress (mannitol), a drop in T, appeared to be an important determinant of extension rate in wheat roots (Pritchard et al., 1990), although cell walls in the proximal region of the growing zone became harder, i.e. Y had increased and/or wall extensibility had de- creased (Pritchard et al., 1991). With maize (Zea mays L.) roots, sudden exposure to mannitol or to KC1 (Frensch and Hsiao, 1994) caused an immediate decrease in W, and extension rate, followed by their parallel recovery within the next 30 min. However, Y had decreased during that time, so that extension could resume as soon as qP ex- ceeded the new (lower) value of Y.
With salinity, slower root extension in maize seedlings was not attributed to changes in qP, which remained at control (unsalinized) levels, but to a greater hardening of cell walls (Neumann et al., 1994). However, seedlings were exposed to salinity (100 mM NaCI) for 24 h before obser- vations began, so that early responses to salt shock were not recorded. The concentration of Caz+ in the root envi- ronment is well recognized as critica1 to the response to NaCl (Cramer et al., 1988; Evlagon et al., 1992; Zhong and Lauchli, 1993, 1994); extension rates in salt-shocked maize roots (Cramer et al., 1988), monitored continuously over 6 h, remained at control levels provided that 10 mM Ca2+ was in the externa1 solution. At low Ca2+, inhibition of extension by 75 mM NaCl was almost immediate.
Osmotic adjustment helps cells of higher plants to with- stand salt stress and water deficit by maintaining sufficient turgor for growth to proceed (Zimmermann, 1978), and involves transport, accumulation, and compartmentation of inorganic ions and organic solutes (Wyn Jones, 1981; Weimberg et al.] 1984; McNulty, 1985; Hajibagheri et al., 1987; Binzel et al., 1988; Gibbs et al., 1988; Premachandra et al., 1989; Voetberg and Sharp, 1991; Spickett et al., 1992). Under saline conditions, osmotic withdrawal of water from enlarging cells can cause their W, to drop below Y. Cells must then develop a sufficiently low qs to reverse the flow
Abbreviations: 'Pp, pressure potential or turgor; 'Ps, solute or osmotic potential; qW, water potential; RWC, relative water con- tent; Y, yield stress threshold.
www.plantphysiol.orgon June 3, 2020 - Published by Downloaded from Copyright © 1997 American Society of Plant Biologists. All rights reserved.

882 Rodríguez et al. Plant Physiol. Vol. 11 3, 1997
of water, either by uptake of ions from the medium or by synthesis and transport of organic osmotica; otherwise, cell enlargement will stop (Kurth et al., 1986). Osmotic adjust- ment requires the regulation of the intracellular levels of severa1 carbon compounds (carbohydrates, sugar alcohols, and organic acids) and nitrogenous compounds (amino acids, Gly betaine, choline, and polyamines), many of which are assumed to be compartmented mainly in the cytoplasm, whereas inorganic ions (principally Na+, K', and C1-) are sequestered in the vacuoles or distributed between the vacuole and cytoplasm (Jeschke et al., 1986; Hajibagheri et al., 1987; Voetberg and Sharp, 1991). Organic solutes in the cytosol contribute to intracellular osmotic balance when inorganic ion concentrations are high in the vacuole, and they may also protect cytosolic enzymes when ion concentrations increase (Greenway and Munns, 1980). Osmotic adjustment in the root apical zone in maize seed- lings exposed to drying conditions is accompanied by a decline in the rate of tissue expansion and an increase in the rate of Pro deposition, i.e. there is a net addition of Pro to the osmotic pool (Voetberg and Sharp, 1991). The in- crease in concentration of hexose sugars is without in- creased deposition and results from the slowing of growth. With salinity, it is evident that maize roots are able to lower the \Ir, of the cell sap (Evlagon et al., 1992; Neumann et al., 1994), and in root tips of cotton, osmotic adjustment in- volved an increased deposition rate of total osmotica and Nat (Zhong and Lauchli, 1994). However, the time course of osmotic changes and the identity of the principal inor- ganic and organic solutes do not appear to have been examined in the same experimental system in previous reports.
The present research was undertaken to improve under- standing of the response of maize primary roots to either a sudden imposition of salt stress (salt shock) or to a more gradual increase in salinity (salt acclimation) that might allow roots to adjust progressively. Specifically, our objec- tives were to: (a) determine whether salt shock and salt acclimation at the same final concentration of NaCl had equally damaging effects on root extension; (b) quantify changes in osmotic relations of root tips during salt stresses to determine whether there were marked losses in Tp that alone might account for inhibition of extension; and (c) estimate the contributions of inorganic solutes, including Nat and C1-, and organic solutes to changes in root \Irs. These were examined specifically in relation to salt shock because of the rapid changes in root extension and qS that were found. We focused attention on the apical 10-mm zone, which comprises the zones of cell division and cell elongation, and where cells show a transition from being highly cytoplasmic with small vacuoles close to the root tip to being almost fully vacuolate when cell expansion has ceased.
MATERIALS A N D METHODS
Plant Material, Germination, and Crowth Conditions
Caryopses of hybrid maize (Zea mays L. cv Pioneer 3906), generously supplied by Pioneer Hi-Bred International
(Johnston, IA), were treated with Captan fungicide (Gustafson Inc., Plano, TX), surface-sterilized with 1% (v/v) fresh NaOCl solution for 5 min, and rinsed thor- oughly with deionized water. Caryopses were allowed to imbibe for about 15 h in aerated, 1.0 mM CaSO,, and then germinated in the dark at 27°C between sheets of absorbent germination paper rolled into cylinders and placed verti- cally in 3-L plastic containers containing about 1.50 mL of 1 miu Caso, for continuous wetting. The tops of the contain- ers were covered with plastic wrap to minimize evapora- tion from the germination paper. At the end of this period, the primary seminal root of typical seedlings was about 15 cm long.
Eighty-four hours from the start of imbibition, groups of eight seedlings of uniform root length were placed in fresh, full-strength nutrient solution with or without the addition of NaCl in 3-L plastic containers fitted with lids. Circular holes were cut in the lids so that each seedling could be supported around the shoot base with foam rubber. Plastic tubes were passed through the lid to pro- vide aeration with a volume flow of 0.3 L min-'. The standard nutrient solution was composed of (in mM): 1.0 KNO,, 4.0 Ca(NO,),, 1.0 NH,H,PO,/ (NH,),HPO, (pH 5.0), 0.5 MgSO,, and 0.05 Fe(II1)-EDTA (monosodium salt), with the micronutrients (in piu) 9.22 H,BO,, 0.16 CuSO,, 14.1 KC1, 3.6 MnSO,, 0.016 (NH,),Mo,O,,, and 0.77 ZnSO,. Seedlings were grown at 25 2 2°C in the dark to minimize transpiration and the transfer of salts to the leaves; this was to reduce the possibility of an indirect effect of salinity on root growth because of damage to shoot metabolism. A11 experiments described below were repeated at least once.
Salinization Treatments
NaCl was added to the standard nutrient solution to make concentrations of 50, 100, and 150 mM. The controls received no NaCl additions. Salinization treatments were imposed using two different protocols. In salt acclimation, the NaCl concentration was raised by 25 mM once every 24 h until the desired concentration was attained. In salt shock, NaCl was raised to the final concentration in one step. Values of 1v, ( = \ I r s ) for the nutrient solutions, deter- mined by thermocouple psychrometry, in order of increas- ing salt concentration, were -0.6, -3.0, -5.5, and -8.0 bar.
Measurement of Crowth
Extension rates of primary seminal roots of intact seed- lings were measured by marking the root 10 mm from the tip with charcoal powder using a fine brush and measur- ing the increase in length from this reference mark. No elongation occurred at distances greater than 10 mm from the tip.
Measurement of Root W, and Ws Y, and Ys of root tips were measured by thermocouple
psychrometry using sample chambers (model C-52, Wes- cor, Logan, UT) and a microvoltmeter (HR-33T, Wescor) attached to a chart recorder to read microvolt output.
www.plantphysiol.orgon June 3, 2020 - Published by Downloaded from Copyright © 1997 American Society of Plant Biologists. All rights reserved.

Growth and Water Relations of Salinized Maize Roots 883
Calibration was at 25°C with 50-pL volumes of NaCl solutions of known molality. For qw determinations, groups of eight root sections were excised with a razor blade on filter paper moistened with the medium in which they had been growing, quickly blotted with dry filter paper, and immediately placed in the sample chamber to equilibrate. Because the root cells may have expanded after excision, values of qw could have been affected by cell wall relaxation (Neumann et al., 1994). Steady values were obtained by 75 to 90 min of equilibration, and the 90-min period was used for a11 reported results. Prelimi- nary trials showed that with fewer than eight root tips per chamber, equilibration was not complete in 90 to 120 min and estimates of Vr, and Vrs were erroneously lower. After readings, the tissue was removed from the chamber, sealed in a vial, and plunged into liquid N,. The frozen tissue was allowed to thaw and then quickly returned to the chamber for 1v, determination. Readings were taken after >30 min of equilibration. qP was calculated as the difference between Yw and Ys. No correction of root Y, was made for apoplastic water or solutes.
In an initial series of experiments to examine water and osmotic relations over a wide range of NaCl concentra- tions, root segments were excised at O to 5 and 5 to 10 mm from the tip. In subsequent work to examine the accumu- lation of solutes in the apical zone, we worked with seg- ments excised at O to 3 and 3 to 10 mm from the tip. These zones were chosen because they comprise, respectively, a population of cells that are more densely cytoplasmic, with many microvacuoles, and a population of vacuolating to fully vacuolate cells. This distinction is a first approxima- tion because cell structure in the root apical zone is not uniform, either radially or axially.
RWC
To determine RWC, 84-h-old seedlings were transferred to fresh standard nutrient solution for about 12 h to ensure full turgidity and uniform root growth rate. Root sections then were excised at O to 5 and 5 to 10 mm from the apex and transferred in groups of 20 to fresh, aerated standard nutrient solution. After about 3 h at room temperature under dim light, the turgid weight was determined and root segments were subjected to 100 and 150 mM NaCl salt shock for 5 h. During that time, root fresh weight was monitored by blotting segments and reweighing at inter- vals of 30 min. At the conclusion of the experiment, root segments were frozen in liquid N,, lyophilized at -70°C for at least 36 h, and dry-weighed. RWC was calculated from:
RWC (%) 1 [(FW - DW)/(TW - DW)]lOO,
where FW is fresh weight, DW is dry weight, and TW is turgid weight. This protocol can lead to estimates of RWC greater than 100% if cells continue to expand and absorb water during the 5-h period.
Root Sampling and Elemental Analyses
Seminal roots were excised from the caryopses and rinsed in deionized water (two rinses each of 1 min), and
each was cut into segments O to 3 mm and 3 to 10 mm from the root tip and the remainder of the root axis (>10 mm). Fresh weights were recorded immediately and seg- ments were frozen in liquid N,, lyophilized for at least 36 h, and ground to a fine powder. Each sample com- prised 24 segments for the O- to 3-mm and the 3- to 10-mm zones and four segments for the >10-mm zone. To ana- lyze C1-, Na+, and K+, ground, freeze-dried root seg- ments were placed in a glass vial with 0.4 N HNO,, allowed to stand for about 30 min, suspended in an ul- trasonic bath for 3 min, and then placed in a water bath at 80°C for 15 min. The suspension was filtered or centri- fuged and the supernatant was stored frozen until as- sayed. Determination of C1- was by potentiometry using a digital chloridometer (model 4425000, Haake Buchler Instruments, Saddle Brook, NJ). Assays of Nat and Kf were done on the same tissue extract as well as on reagent blanks by atomic absorption spectrophotometry.
Analyses of Organic Osmolytes
Natural abundance I3C-NMR was used to identify car- bon compounds that accumulated in response to saliniza- tion. Analyses were made of root segments excised from plants that had been exposed to 100 mM NaCl shock for 48 h. The two root zones were analyzed to identify os- molytes that might be associated predominantly with the more densely cytoplasmic cells close to the root tip (0-3 mm) or the more vacuolated ones (3- -10-mm zone). The fresh weight of the root segment samples was about 3.0 g each. Details of the perchloric acid extraction and NMR methods are given elsewhere (Chang and Roberts, 1989; Roberts et al., 1992).
GC was used to quantify carbohydrates identified by 13C-NMR. The GC method is more sensitive, allowing smaller samples to be used for quantitative analysis, and it is better suited to analysis of multiple samples. For GC analysis root segments in groups of about 48 per sample were excised from the seminal roots, blotted, fresh- weighed, frozen in liquid N,, and stored at -80°C. To prepare ethanol extracts, weighed, lyophilized segments were ground to a powder using a mortar and pestle at room temperature, and then reground in 500 pL of 80% (v / v) ethanol. The suspension was quantitatively trans- ferred to an Eppendorf tube by rinsing with small volumes of 80% ethanol, and microfuged for 15 min. The superna- tant was transferred to a test tube and the pellets were extracted two more times (1 mL each) with 80% ethanol. The combined supernatant volume was about 3.5 mL, to which was added 3.5 mL each of water and chloroform for lipid / sugar partitioning. The samples were mixed after adding each component and allowed to stand at room temperature for about 1 h to allow phase separation. The aqueous upper phase containing the sugars was removed, transferred to a test tube, frozen in liquid N,, and lyophi- lized for at least 24 h. The sugars were derivatized as described by Ferguson et al. (1979). Separation of silylated sugars by GC was essentially as described by Zimmerman and Cobb (1989).
www.plantphysiol.orgon June 3, 2020 - Published by Downloaded from Copyright © 1997 American Society of Plant Biologists. All rights reserved.
884 Rodríguez et al. Plant Physiol. Vol. 11 3, 1997
Calculated Contribution to O,
qs for each measured concentration of solute was calcu- lated according to the van't Hoff equation (Nobel, 1991), which applies strictly to ideal dilute solutions:
Ps= -nRT .
Where n = posmol (g H,O)-', R = 8.314 X l O P 5 m3 bar mol-I K-l, and T = 298.2 K. For n, we based values on measurements of pmol mL-l solution.
RESULTS
Effect of NaCl on Root Extension and Root Water Relations
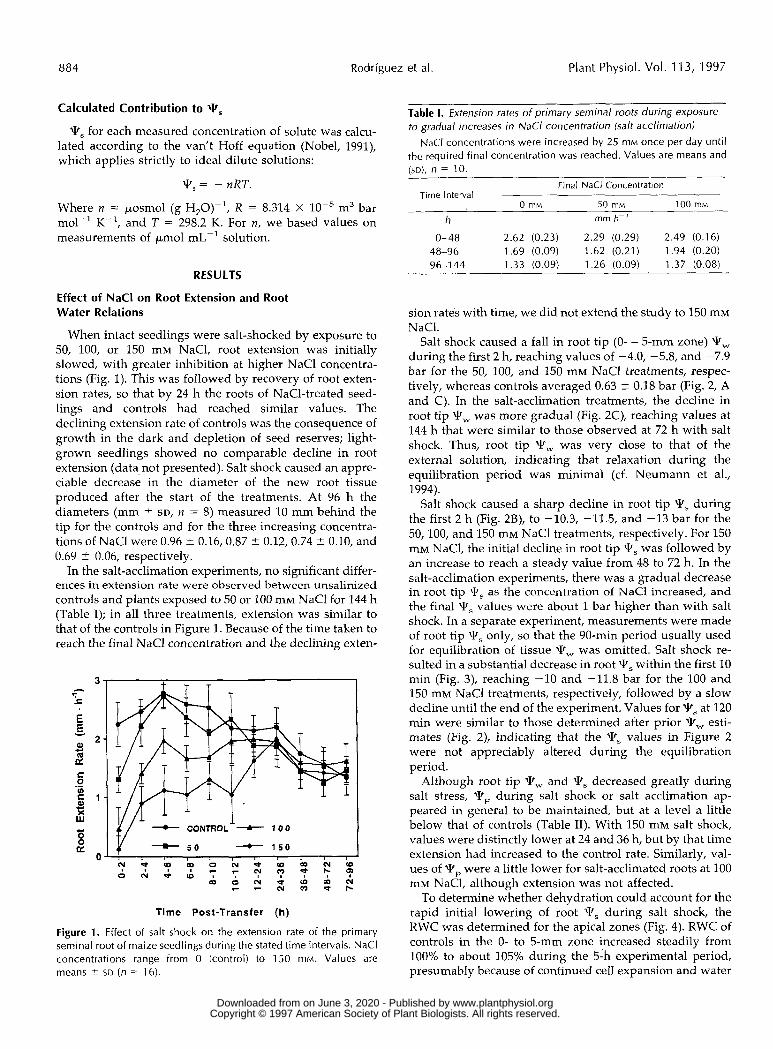
When intact seedlings were salt-shocked by exposure to 50, 100, or 150 mM NaC1, root extension was initially slowed, with greater inhibition at higher NaCl concentra- tions (Fig. 1). This was followed by recovery of root exten- sion rates, so that by 24 h the roots of NaC1-treated seed- lings and controls had reached similar values. The declining extension rate of controls was the consequence of growth in the dark and depletion of seed reserves; light- grown seedlings showed no comparabIe decline in root extension (data not presented). Salt shock caused an appre- ciable decrease in the diameter of the new root tissue produced after the start of the treatments. At 96 h the diameters (mm t- SD, n = 8) measured 10 mm behind the tip for the controls and for the three increasing concentra- tions of NaCl were 0.96 t 0.16,0.87 t 0.12, 0.74 t- 0.10, and 0.69 2 0.06, respectiveIy.
In the salt-acclimation experiments, no significant differ- ences in extension rate were observed between unsalinized controls and plants exposed to 50 or 100 IIIM NaCl for 144 h (Table I); in a11 three treatments, extension was similar to that of the controls in Figure 1. Because of the time taken to reach the final NaCl concentration and the declining exten-
Time Post-Transfer (h)
Figure 1. Effect of salt shock o n the extension rate of the primary seminal root of maize seedlings during the stated time intervals. NaCl concentrations range from O (control) to 150 mM. Values are means % SD ( n = 16).
Table I. Extension rates of primary seminal roots during exposure to gradual increases in NaCl concentration (salt acclimationl
NaCl concentrations were increased by 25 mM once per day until the required final concentration was reached. Values are means and (SD), n = 10.
Final NaCl Concentration Time lnterval
0 mM 50 mM 100 mM
h mm h-'
0- 48 2.62 (0.23) 2.29 (0.29) 2.49 (0.16) 48-96 1.69 (0.09) 1.62 (0.21) 1.94 (0.20) 96-1 44 1.33 (0.09) 1.26 (0.09) 1.37 (0.08)
sion rates with time, we did not extend the study to 150 mM NaCl.
Salt shock caused a fall in root tip (O- - 5-mm zone) P, during the first 2 h, reaching values of -4.0, -5.8, and -7.9 bar for the 50, 100, and 150 mM NaCl treatments, respec- tively, whereas controls averaged 0.63 2 0.18 bar (Fig. 2, A and C). In the salt-acclimation treatments, the decline in root tip ?Ir, was more gradual (Fig. 2C), reaching values at 144 h that were similar to those observed at 72 h with salt shock. Thus, root tip Tw was very close to that of the externa1 solution, indicating that relaxation during the equilibration period was minimal (cf. Neumann et al., 1994).
Salt shock caused a sharp decline in root tip VIs during the first 2 h (Fig. 2B), to -10.3, -11.5, and -13 bar for the 50, 100, and 150 mM NaCl treatments, respectively. For 150 mM NaC1, the initial decline in root tip Ts was followed by an increase to reach a steady value from 48 to 72 h. In the salt-acclimation experiments, there was a gradual decrease in root tip T, as the concentration of NaCl increased, and the final W, values were about 1 bar higher than with salt shock. In a separate experiment, measurements were made of root tip Ps only, so that the 90-min period usually used for equilibration of tissue qw was omitted. Salt shock re- sulted in a substantial decrease in root VIs within the first 10 min (Fig. 3), reaching -10 and -11.8 bar for the 100 and 150 mM NaCl treatments, respectively, followed by a slow decline until the end of the experiment. Values for 'Ps at 120 min were similar to those determined after prior VI, esti- mates (Fig. 2), indicating that the Ts values in Figure 2 were not appreciably altered during the equilibration period.
Although root tip VIw and VIs decreased greatly during salt stress, qp during salt shock or salt acclimation ap- peared in general to be maintained, but at a leve1 a little below that of controls (Table 11). With 150 mM salt shock, values were distinctly lower at 24 and 36 h, but by that time extension had increased to the control rate. Similarly, val- ues of qp were a little lower for salt-acclimated roots at 100 mM NaC1, although extension was not affected.
To determine whether dehydration could account for the rapid initial lowering of root T, during salt shock, the RWC was determined for the apical zones (Fig. 4). RWC of controls in the O- to 5-mm zone increased steadily from 100% to about 105% during the 5-h experimental period, presumably because of continued cell expansion and water
www.plantphysiol.orgon June 3, 2020 - Published by Downloaded from Copyright © 1997 American Society of Plant Biologists. All rights reserved.

Growth and Water Relations of Salinized Maize Roots 885
h L m e !z
9
-4
-6
-1 o ---i--- yNTRYL I
-1 6
' " I I I I I I I I I I I I I I
O 2 4 6 8 10 12 O 24 48 72 96 120 144
Time Post-Transfer (h)
uptake. Imposition of 100 or 150 mM NaCl salt shock resulted in a decrease to 98 and 88%, respectively, within the first 30 min. Thereafter, RWC increased gradually for the 150 mM shock treatment, reaching 94% at the conclu- sion of the experiment. Similar changes in RWC were found for the 5- to 10-mm zone, except that dehydration was somewhat greater at 150 mM NaCl (Fig. 4B), lowering the RWC to 83%.
To compare the salt-shock response in the highly cyto- plasmic cells near the root tip with that of more vacuolated root tissue, and to evaluate the contribution of different osmolytes in these zones, additional water-relation mea- surements were made for the apical O- to 3-mm and 3- to 10-mm zones. Cell expansion is complete within the apical 10 mm of maize seminal roots, and even if salt shock
--C CONTROL
- 2
-6-
-8-
-10-
-12 -
-1 4 -
-16 ! I O 1 5 30 4 5 6 0 7 5 9 0 1 0 5 120
Time Post-Transfer (min)
Figure 3. lnitial changes in Ts in the apical 5-mm zone of primary seminal roots of seedlings exposed to salt shock. NaCl concentra- tions range from O (control) to 150 mM. Each value represents a single determination.
Figure 2. Effect of NaCl on Vw (A and C) and P, ( B and D) in the apical 5-mm zone of primary seminal roots during salt shock (SS) and salt acclimation (SA): A and 6 show the initial 12-h response to salt shock only. Values are means 2 SD (n = 2).
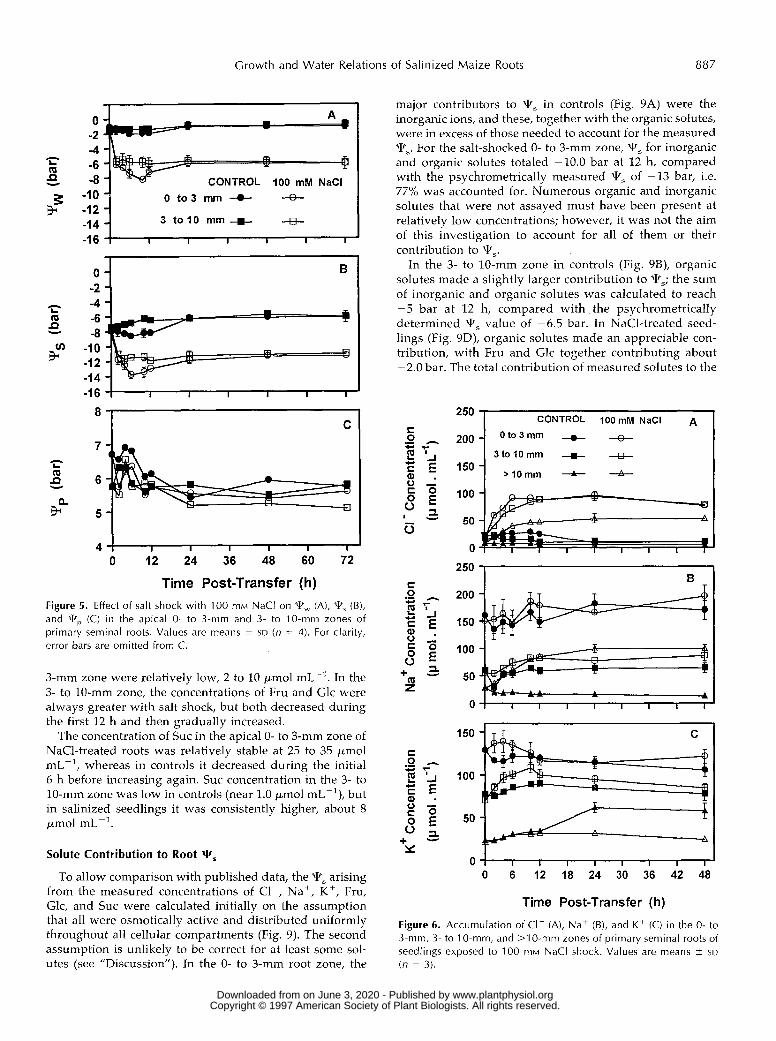
causes cell expansion to become more localized toward the tip, as happens with water deficit (Sharp et al., 1988) or with salt-stressed cotton roots (Zhong and Lauchli, 1993), the two zones would still effectively separate contrasting populations of cells. We chose to work with a single NaCl concentration (100 mM) and to focus on the salt-shock response because of the rapid changes in root Y s it pro- voked. With salinization (Fig. 5), a rapid decrease in root Tw was observed for both zones, with the O- to 3-mm zone showing transiently a greater decrease, and qs was low- ered approximately in parallel to Tw. Tp remained be- tween 5 and 7 bar in both controls and salinized roots (Fig. 5C), even within the first 2 h, when Vr, of salt-shocked seedlings dropped rapidly. Vrp for the 3- to 10-mm zone was lower at 24 to 72 h, but extension had resumed by that time. However, analysis of variance showed that there was a significant (P < 0.01) lowering of Tp in salt-shocked root tips (5.7 bar) compared with controls (6.5 bar) at 2 h, and throughout the initial 6 h of salinization qP averaged 0.77 bar less than in controls (P < 0.01). The 3- to 10-mm zone failed to show a significant effect of salt shock on Tp at any time (P = 0.58).
Effect of NaCl on lnorganic Solute Accumulation
Concentrations of C1-, expressed on a tissue water basis, increased rapidly in response to salt shock (100 mM NaCI), with greater accumulation in the O- to 3-mm and 3- to 10-mm root zones than in the remainder of the root (Fig. 6A). Compared with unsalinized seedlings, the net in- creases in C1- content at 12 h were 63, 77, and 43 pmol mL-' for the O- to 3-, 3- to 10-, and >10-mm zones, respec- tively. Measurements were made for the >lO-mm zone because most literature on ion fluxes in roots is with whole
www.plantphysiol.orgon June 3, 2020 - Published by Downloaded from Copyright © 1997 American Society of Plant Biologists. All rights reserved.

886 Rodríguez et ai. Plant Physiol. Vol. 1 1 3, 1997
Table II. Roof Vr, with time for the apical 5-mm zone of primary seminal roots of maize seedlings exposed to salt shock or salt acclimation
Values are means and (sD). n = 2. ~
Treatment
Salt shock
Salt acclimation
O mM NaCl 50 mM NaCl 100 mM NaCl 150 mM NaCl
h
O 6.3 (0.9) 2 6.1 (1 .1) 4 6.9 (0.4) 6 nd" 8 6.6 (0.0)
10 nd 1 2 6.3 (0.3) 24 5.6 (1 . I ) 36 6.0 (0.0) 48 5.1 (0.7) 72 4.9 (0.7)
O 5.7 (0.4) 48 5.4 (0.4) 96 5.4 (0.1)
144 5.1 (0.1)
a nd, N o t determined.
bar
5.8 (0.7) 6.3 (0.7) 6.3 (0.0) 6.2 (0.8) 6.0 (1.0) 5.2 (0.5) 5.3 (1.0) 5.0 (0.4) 5.8 (0.3) 5.6 (0.6) 5.9 (0.4)
5.8 (0.3) 5.8 (0.1) 6.7 (0.9) 5.3 (0.1) 5.6 (0.3) 5.5 (0.1) 5.8 (0.5) 5.3 (0.0) 6.3 (0.0) 6.4 (0.3) 6.4 (0.0)
5.7 (0.4) 5.7 (0.4) 5.1 (0.3) 4.7 (1.0) 4.4 (0.9) 4.6 (0.1) 4.7 (0.3) 4.4 (1.1)
5.8 (0.3) 5.4 (0.1) 5.4 (0.1) 6.1 (1.2) 5.3 (0.6) 6.2 (0.4) 5.6 (0.5) 4.4 (0.2) 4.4 (0.3) 5.2 (0.3) 5.3 (0.3)
nd nd nd nd
root systems. In the apical O- to 3-mm zone, the Na* concentration was 160 to 180 pmol mLpl, regardless of treatment, and it remained essentially constant (Fig. 6B). In the 3- to 10-mm zone, the Na+ concentration increased over that in controls by about 26 pmol mL-' at 12 h, whereas in the >lO-mm zone, the Na+ concentration increased by 70
110 I , A
100 .I - E 9 0 - o
6 CONTROL 2 80-
'"1 I , I, , , I 60
110 B
1 O0
E 90 o
80 -B CONTROL 70i2LJ 60 O 60 120 180 240 300
Time Post-Transfer (min)
Figure 4. Effect of salt shock on RWC in the apical O- to 5-mm (A) and 5- to 10." (8) zones of primary seminal roots. NaCl concentrations range from O (control) to 150 mM. Values are means 2 SD (n = 2 ) .
pmol mL-I, a 4.5-fold increase. The high concentration of Nat in the O- to 3-mm zone and its failure to increase with exposure to NaCl was unexpected, but the same result was obtained in three independent experiments. Analytical ar- tifacts seem very unlikely because the extracts analyzed for Na+ were also analyzed for K+ and C1- and showed no unusual features for those ions; furthermore, the effect was not observed in the older root zones, in which, as expected, Na* uptake clearly occurred with time.
The K+ concentration in the O- to 3-mm zone of both control and salinized roots was about 125 pmol mL-' at 24 h (Fig. 6C). A transient increase in K" concentration occurred during the first 4 to 6 h with salt shock, but thereafter tissue concentrations were similar with time for both treatments. For the 3- to 10-mm zone, the K* concen- tration also tended to increase during the first 10 h with salt shock. For the >lO-mm zone, K' concentration in both treatments (about 32 pmol mLpl) was lower than for the other zones, and in the salinized roots it did not increase with time as it did in controls.
Effect of NaCl on Organic Solute Accumulation
13C-NMR measurements identified the main organic sol- utes that accumulated in response to salt shock with 100 mM NaC1. A11 13C-NMR peaks that increased during salin- ization were assigned. At 48 h, only Fru, Glc, SUC, and Pro showed detectable changes (Fig. 7). Regardless of the treat- ment, SUC and Pro concentrations were higher in the O- to 3-mm zone, whereas Fru and Glc accumulated to higher concentrations in the 3- to 10-mm zone. Further experi- ments measured changes in concentrations of the three sugars over shorter times using GC (Fig. 8). Values ob- tained by GC were within the range found by NMR. In both treatments, concentrations of Fru and Glc in the O- to
www.plantphysiol.orgon June 3, 2020 - Published by Downloaded from Copyright © 1997 American Society of Plant Biologists. All rights reserved.
Growth and Water Relations of Salinized Maize Roots 887
O -2
h L o -8
O t o 3 mm + -8-
3 t o 1 0 mm+ + -14 I -16 I I I I I I I
-2 B I
-16 ! I I I I I I '
8 C
7-1
O 12 24 36 48 60 72
Time Post-Transfer (h) Figure 5. Effect of salt shock with 100 mM NaCl on Ww (A), W, (B), and Wp (C) in the apical O- to 3-mm and 3- to 10." zones of primary seminal roots. Values are means 2 SD ( n = 4). For clarity, error bars are omitted from C.
3-mm zone were relatively low, 2 to 10 pmol mL-'. In the 3- to 10-mm zone, the concentrations of Fru and Glc were always greater with salt shock, but both decreased during the first 12 h and then gradually increased.
The concentration of SUC in the apical O- to 3-mm zone of NaC1-treated roots was relatively stable at 25 to 35 pmol mL-', whereas in controls it decreased during the initial 6 h before increasing again. SUC concentration in the 3- to 10-mm zone was low in controls (near 1.0 pmol mL-'), but in salinized seedlings it was consistently higher, about 8 kmol mL-'.
Solute Contribution to Root Vr,
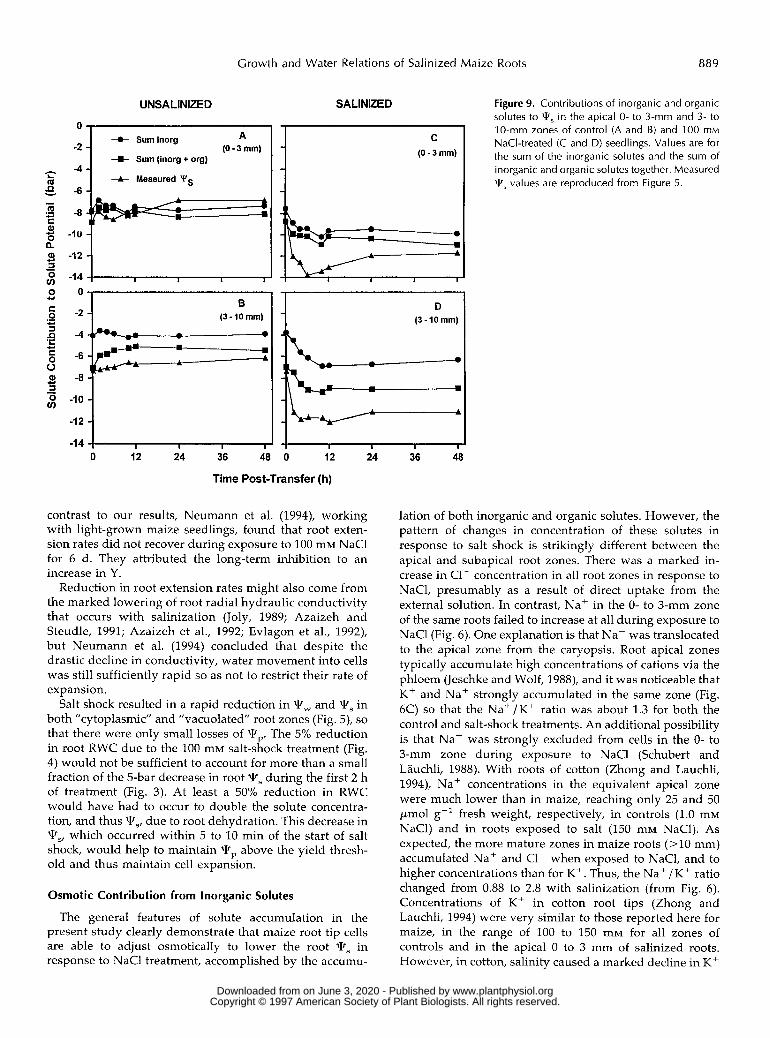
To allow comparison with published data, the Ts arising from the measured concentrations of C1-, Nat, K+, Fru, Glc, and SUC were calculated initially on the assumption that a11 were osmotically active and distributed uniformly throughout a11 cellular compartments (Fig. 9). The second assumption is unlikely to be correct for at least some sol- utes (see "Discussion"). ln the O- to 3-mm root zone, the
major contributors to qs in controls (Fig. 9A) were the inorganic ions, and these, together with the organic solutes, were in excess of those needed to account for the measured 1v,. For the salt-shocked O- to 3-mm zone, lvs for inorganic and organic solutes totaled -10.0 bar at 12 h, compared with the psychrometrically measured qs of -13 bar, i.e. 77% was accounted for. Numerous organic and inorganic solutes that were not assayed must have been present at relatively low concentrations; however, it was not the aim of this investigation to account for all of them or their contribution to qs,
In the 3- to 10-mm zone in controls (Fig. 9B), organic solutes made a slightly larger contribution to Ts; the sum of inorganic and organic solutes was calculated to reach -5 bar at 12 h, compared with the psychrometrically determined Ts value of -6.5 bar. In NaC1-treated seed- lings (Fig. SD), organic solutes made an appreciable con- tribution, with Fru and Glc together contributing about -2.0 bar. The total contribution of measured solutes to the
250 I I B -
200
150
1 O0
50
I I I I I I I
150 C
S .- 0 - E j 100 E €
o E 50 o a
+I-
0 . v - c o
+ - Y
O O 6 12 18 24 30 36 42 48
Time Post-Transfer (h)
Figure 6. Accumulation of CI- (A), Nat (B), and K + (C) in the O- to 3-mm, 3 - to Io-mm, and >10-mm zones of primary seminal roots of seedlings exposed to 100 mM NaCl shock. Values are means ? SD
( n = 3 ) .
www.plantphysiol.orgon June 3, 2020 - Published by Downloaded from Copyright © 1997 American Society of Plant Biologists. All rights reserved.

888 Rodríguez et al.
calculated W, was -9.0 bar, compared with the measured root W, of -12 bar.
DISCUSSION
Root Elongation and Water Relations
The present work reveals the remarkable ability of maize roots to continue extension when gradually exposed to increasing concentrations of NaC1, and to resume extension during salt shock, even at concentrations (100 mM and greater) that eventually prove very injurious to leaves of intact, transpiring plants as salts accumulate in them (Drew et al., 1988). Roots of dark-grown cotton seedlings that had acclimated to 150 mM NaCl were also highly tolerant, extending at 60 to 80% of the rate of unsalinized controls (Zhong and Lauchli, 1994).
The degree and duration of the reduced root growth rate during salt shock, which depended on the concentration of NaCl in the nutrient solution (Fig. I), are likely to be related to the properties of elongating cells. In the leaves of maize plants with the roots exposed to long-term saliniza- tion, inhibition of extension was attributed to increases in Y, and not to cell wall extensibility, hydraulic conductance, or Wp (Cramer and Bowman, 1991; Neumann, 1993). How- ever, in bean leaves salinity inhibited leaf expansion, mainly by lowering turgor (Neumann et al., 1988). In our experiments with roots, we could not detect any major losses in turgor, but our technique was inadequate to re- solve short-term changes. Using a pressure probe, Frensch and Hsiao (1994) recorded transient changes in Wp when maize roots were suddenly exposed to KCI or mannitol
CONTROL A 0-3 mm
100mMNaCl
30
., e! f 50 2.-
40
30
20
10
O
8
Glucose Fructose Sucrose Proline
Osmolyte
Figure 7. Concentrations of soluble sugars and Pro, measured by 13C-NMR, in the apical O- to 3-mm (A) and 3- to 1 O-mm (B) zones of primary seminal roots of seedlings exposed to 100 mM NaCl shock for 48 h. Each value indicates the analysis of extracts from root segments totaling about 3.0 g fresh weight. ND, Not detectable.
Plant Physiol. Vol. 11 3 , 1997
^^
lZu 1 CONTROL 100 mM NaCl A I 100 1 I
60-l 3to10mm + 43- I 40
20
O
B 120 I
1
20 3
O I I I I 60
40
20
O O 6 12 18 24 30 36 42 48
Time Post-Transfer (h)
Figure 8. Fru (A), Glc (B), and Suc (C) concentrations in the apical 0- to 3-mm and 3- to 1 O-mm zones of primary seminal roots of seedlings with time of exposure to 1 O0 mM NaCl shock. Values are means ? SD
(n = 2). Concentrations are expressed per millil iter of tissue water.
solutions (Ps = -3 bar). Pp decreased almost immediately upon addition of the osmoticum, but recovered within the next 30 min to a new steady value that was only a little below the original one. During this time, Y quickly changed from an initial value of 6 to 4.5 bar. Root elonga- tion was inhibited only during the transient loss of qP, and recovered as soon as W, exceeded the new (lower) value of Y. Similar changes were observed by Pritchard et al. (1991) in wheat roots exposed to mannitol (Ws = -4.8 bar), in which an initial drop in Wp in the 2-mm apical zone and inhibition of extension were followed by a gradual recov- ery in about 3 h. However, at high concentrations of man- nitol (Ws = -9.6 bar), extension was strongly inhibited, and at 24 h W, was much lower in the apical zone, with signs of wall hardening, i.e. decreased extensibility. The present results are compatible with these earlier studies: with 100 mM NaCl shock, the O- to 3-mm zone showed a small but distinct decrease in Wp. It is possible that the driving force for cell expansion (Wp - Y) was appreciably lowered. In
www.plantphysiol.orgon June 3, 2020 - Published by Downloaded from Copyright © 1997 American Society of Plant Biologists. All rights reserved.
Growth and Water Relations of Salinized Maize Roots 889
UNSALINIZED SALlNlZED
-2
- - 4 k e -6
cI -a 'ij -10
2 -12
- m E 0
I l
3
.-
- -14
-e- Suminorg A (0-3")
+ Sum (inorg + org)
-A- Measured Ys
I O
-2 - (3-10mm) B
-4 4% - a
-6 - -a 1
-10 - -12 1
D (3 -10 mm)
-14 I O 12 24 36 48 o 12 24
Time Post-Transfer (h)
contrast to our results, Neumann et al. (1994), working with light-grown maize seedlings, found that root exten- sion rates did not recover during exposure to 100 mM NaCl for 6 d. They attributed the long-term inhibition to an increase in Y.
Reduction in root extension rates might also come from the marked lowering of root radial hydraulic conductivity that occurs with salinization (Joly, 1989; Azaizeh and Steudle, 1991; Azaizeh et al., 1992; Evlagon et al., 1992), but Neumann et al. (1994) concluded that despite the drastic decline in conductivity, water movement into cells was still sufficiently rapid so as not to restrict their rate of expansion.
Salt shock resulted in a rapid reduction in Vrw and Vrs in both "cytoplasmic" and "vacuolated" root zones (Fig. 5), so that there were only small losses of Vrp. The 5% reduction in root RWC due to the 100 mM salt-shock treatment (Fig. 4) would not be sufficient to account for more than a small fraction of the 5-bar decrease in root Vrs during the first 2 h of treatment (Fig. 3). At least a 50% reduction in RWC would have had to occur to double the solute concentra- tion, and thus Vr,, due to root dehydration. This decrease in Vrs, which occurred within 5 to 10 min of the start of salt shock, would help to maintain Wp above the yield thresh- old and thus maintain cell expansion.
Osmotic Contribution from lnorganic Solutes
The general features of solute accumulation in the present study clearly demonstrate that maize root tip cells are able to adjust osmotically to lower the root W, in response to NaCl treatment, accomplished by the accumu-
36 48
Figure 9. Contributions of inorganic and organic solutes to qS in the apical O- to 3-mm and 3- to 1 O-mm zones of control (A and B) and 1 O 0 mM NaCI-treated (C and D) seedlings. Values are for the sum of the inorganic solutes and the sum of inorganic and organic solutes together. Measured T5 values are reproduced from Figure 5.
lation of both inorganic and organic solutes. However, the pattern of changes in concentration of these solutes in response to salt shock is strikingly different between the apical and subapical root zones. There was a marked in- crease in C1- concentration in a11 root zones in response to NaC1, presumably as a result of direct uptake from the externa1 solution. In contrast, Naf in the O- to 3-mm zone of the same roots failed to increase at a11 during exposure to NaCl (Fig. 6). One explanation is that Nat was translocated to the apical zone from the caryopsis. Root apical zones typically accumulate high concentrations of cations via the phloem (Jeschke and Wolf, 1988), and it was noticeable that K+ and Na+ strongly accumulated in the same zone (Fig. 6C) so that the Na+/K+ ratio was about 1.3 for both the control and salt-shock treatments. An additional possibility is that Na+ was strongly excluded from cells in the O- to 3-mm zone during exposure to NaCl (Schubert and Lauchli, 1988). with roots of cotton (Zhong and Lauchli, 1994), Na+ concentrations in the equivalent apical zone were much lower than in maize, reaching only 25 and 50 pmol g.* fresh weight, respectively, in controls (1.0 mM NaC1) and in roots exposed to salt (150 mM NaC1). As expected, the more mature zones in maize roots (>10 mm) accumulated Na+ and C1- when exposed to NaCl, and to higher concentrations than for K+. Thus, the Na+/K+ ratio changed from 0.88 to 2.8 with salinization (from Fig. 6). Concentrations of K+ in cotton root tips (Zhong and Lauchli, 1994) were very similar to those reported here for maize, in the range of 100 to 150 mM for a11 zones of controls and in the apical O to 3 mm of salinized roots. However, in cotton, salinity caused a marked decline in K+
www.plantphysiol.orgon June 3, 2020 - Published by Downloaded from Copyright © 1997 American Society of Plant Biologists. All rights reserved.

890 Rodríguez et al. Plant Physiol. Vol. 11 3 , 1997
concentration at 10 mm from the apex. Differences in inor- ganic ion accumulation between the different root zones in these species presumably reflect differences in selectivity at the plasma membrane during ion uptake, in phloem trans- port of ions to the apex, and in ion compartmentation (Yeo et al., 1977; Hajibagheri et al., 1987).
To what extent does the change in concentration of in- organic solutes account for osmotic adjustment? For the 0- to 3-mm zone at 12 h of salt shock, inorganic ions contrib- uted -10.0 bar to qs, compared with -7.5 bar at the start of salinization (Fig. 9C). Higher concentrations of inorganic solutes thus accounted for a Ws change of 2.5 bar, compared with the psychrometrically measured change of about 5 bar. However, assuming that the volume occupied by vacuoles in the 0- to 3-mm zone is 50% (Lee et al., 1990), that K+ is equally distributed between the cytoplasm and vacuole (Flowers and Lauchli, 1983; Drew et al., 1990), and that Na+ and CI- are also equally distributed, having not yet been sequestered in the developing vacuoles of cells newly exposed to NaCl in the meristematic zone, the W, contributions for the vacuole become (bar): CI- (-2.3), Na+ (-4.8), and K+ (-3.4), totaling -10.5 (Table 111). Based on the foregoing assumptions, the additional concentra- tions of inorganic ions could barely account for osmotic adjustment in the vacuolar compartment, but the excess of cations over anions in the vacuole (-5.9 bar) is probably balanced by the dicarboxylic malic acid. Thus, a further -2.95 bar should be included, making a revised calculated Ws of -13.45 bar. Similarly, for the cytoplasm, the total calculated qs for the measured solutes is -12.4 bar. It is difficult to make an allowance for the excess of cations over anions (-5.9 bar) in the cytoplasm because some of the cations will be associated with proteins and organic acids, which would have a smaller osmotic impact than -5.9 bar. The question of concentrations of solutes in the cytoplasm will be discussed further below.
For the 3- to 10-mm zone, the W, contribution of the inorganic ions was -6.8 bar at 12 h of salinization com- pared with -4.0 bar in the controls, a change of 2.8 bar. The
measured change in tissue qs was 5 bar (Fig. 9). Because most cells would be fully vacuolated in this root zone, any refinements based on vacuolar compartmentation (about 95% of the volume) would have little effect on calculated Ts values. Thus, for the more mature root zone, inorganic ion accumulation accounted for the major part of osmotic adjustment of the vacuole (Table 111), but a contribution from other solutes, presumably inorganic and organic an- ions, is implicated because the total calculated W, (-9.3 bar) does not fully account for the measured fPs of -12.0 bar. The conclusion that CI-, Na+, and K+ accounted for a considerable proportion of the measured decrease in root Ws is in agreement with the general view that in nonhalo- phytes, inorganic ions provide the major contribution to cell sap Ws at high salinity (Greenway and Munns, 1980; Flowers and Lauchli, 1983).
Osmotic Contribution from Organic Solutes
The analyses of soluble sugars (Fru, Glc, and SUC) and Pro suggested that they play a relatively minor role during osmotic adjustment, based on the initial assumption that solutes were at the same concentration throughout the cell. For instance, in the 0- to 3-mm zone, Suc contributed at the most -1 bar to root Ws, whereas the contributions of Fru and Glc to osmotic adjustment were negligible. In contrast, in the 3- to 10-mm zone Fru and Glc provided about - 1 bar each to root W,, with a negligible contribution from SUC. These results are consistent with previous observations (Weimberg et al., 1984; Sharp et al., 1990) that sugars, particularly SUC, do not contribute materially to root os- motic adjustment in the apical zone. However, much higher contents of reducing sugars in the 3- to 10-mm root zone at low vermiculite Ww (-16 bar) were reported by Sharp et al. (1990), in which concentrations, expressed on a tissue water basis, reached up to 400 mM. In the cell sap of leaves of Z . mays plants exposed to water deficits, soluble sugars and K+ were the major osmotic contributors, total- ing about -5.4 bar (Premachandra et al., 1989), although
Table 111. Calculated solute contributions to 'Ir, of cytoplasmic and vacuolar compartments of maize roots exposed to 100 mM NaCl (salt shock) for 12 h
Calculations are based on data shown in Figures 7 and 8. Assumptions are listed below. Apical Zone (0-3 mm) T5 Subapical Zone (3-10 mm) Ts
Solute Cytoplasma Vacuoleb Cytoplasm' Vacuoled
bar
CI - Nat K + Fru Glc suc Pro' Total calculated W, Measured 'Ir<
-2.3 -4.8 -3.4
O O
-1.2 -0.7
-12.4
-2.3 -4.8 -3.4
O O O O
-10.5 13.6
O O
-2.8 O O
-4.4 -2.0 -9.2
-12.0
-2.4 -2.2 -2.8 -0.8 -1.1
O O
-9.3
Cytoplasm constitutes 50% of cell volume, Pro and Suc are compartmented in the cytoplasm, and Vacuole
Vacuole constitutes 95% Nat , CI-, and K+ are distributed at equal concentrations between cytoplasm and vacuole. constitutes 50% of cell volume. Cytoplasm constitutes 5% of cell volume. of cell volume and retains Fru and Glc. e Pro values are from Figure 7.
www.plantphysiol.orgon June 3, 2020 - Published by Downloaded from Copyright © 1997 American Society of Plant Biologists. All rights reserved.

Growth and Water Relations of Salinized Maize Roots 891
the individual sugars were not analyzed. Sugars were also identified as contributing appreciably to Ts in the leaves of cereal species during water deficit (Jones et al., 1980; Munns and Weir, 1981).
Concentrations of Pro rose markedly to >10 mM in re- sponse to salt stress (Fig. 7), but were always much lower than the concentration found in maize root tips by Voet- berg and Sharp (1991), in which values averaged about 100 mM for the apical O- to 3-mm zone in vermiculite at Ww -16 bar. Pro concentrations decreased strongly at higher qw (Voetberg and Sharp, 1991), but even at Tw of -5.5 bar (the W,,, for the nutrient solution containing 100 mM NaCI), Pro concentrations between 30 and 60 mM could be expected from interpolation of their data. This might suggest that Pro has a more important role in osmotic adjustment in response to water deficit than with salt stress, but a more likely explanation is that Voetberg and Sharp (1991) used much younger maize seedlings, in which roots had reached a length of only 5 cm and seed reserves to provide sub- strates for growth were more plentiful.
What would be the contribution to osmotic adjustment of the organic solutes if they were compartmented only in the cytoplasm? Without detailed information on cell structure along control and salinized roots (cf. Huang and van Steveninck, 1990; Sánchez-Aguayo and González-Utor, 1992), such a calculation is an approximation at best, but it is essential in forming an opinion regarding the signifi- cance of the organic solutes. If it is again assumed that the volume of cytoplasm is 50 and 5% for the 0- to 3-mm and 3- to 10-mm zones, respectively (see Lee et a1.,1990), and using data shown in Figures 7 and 8, the calculated cyto- plasmic concentrations of Glc, Fru, SUC, and Pro are as shown in Figure 10. In the O- to 3-mm zone, Suc and Pro accumulated to higher concentrations in response to salt shock and together made an appreciable contribution to osmotic adjustment. By contrast, in the 3- to 10-mm zone, Fru and Glc reached much higher calculated concentra- tions, equivalent to fPs values of -29 to -50 bar. Such values are clearly unrealistic in view of the actual root W, measurements (Fig. 9) of -7 bar (controls) to -12 bar (salinized). Thus, it seems reasonable to conclude that SUC and Pro could be compartmented within the cytoplasm, whereas Fru and Glc in the vacuolated cells must be pri- marily in the vacuole or distributed between vacuole and cytoplasm.
Our measurements of the principal organic solutes in immature and mature cells in the apical zone of maize roots agree with those of Sharp and co-workers, who found that at low vermiculite fPw the concentration of reducing sugars increased greatly in more basal (vacuo- lated) cells and were the largest component of Ts (Sharp et al., 1990; Voetberg and Sharp, 1991). However, in their experiments the increase in concentration of reducing sugars (presumably Fru and Glc) derived from a slower volumetric growth rate (i.e. roots had a smaller diameter), resulting in less dilution of solutes by expanding cells. Similar conclusions apply to the salinized roots we stud- ied. Although root extension recovered to control levels by 10 to 12 h of salt shock, the diameter was smaller along
0-3 mm CONTROL
80
60
C O 40
c .- 20
0 . o
.- 4-
$ -
o z
O 1000
500
O Glucose Fructose Sucrose Proline
Osmolyte
Figure 10. Estimated concentrations of soluble sugars and Pro as- sumed to be compartmented in the cytoplasm in the apical O- to 3-mm (A) and 3 - to 10." (6) zones of primary seminal roots of seedlings exposed to 1 O0 m M NaCl shock for 48 h. Values are based on those given in Figure 7 for Pro and Figure 8 for the other organic solutes. ND, Not detectable by 13C-NMR analysis.
the entire length of the new growth. The ratio of the new root tissue volumes is equal to the ratio of the squares of the radii. Based on the measured root diameters at differ- ent salt levels (see "Results"), the ratio of the square of the radius for control/salt-shocked (100 mM NaCI) roots was 1.68. Thus, concentrations of organic solutes must in- crease by more than 1.68-fold to provide evidence of an increase in deposition. Figure 8 shows that the deposition rates for Fru and Glc did not increase, whereas there was evidence of increased deposition for Suc in the 3- to 10-mm zone and for Pro (Fig. 7) in both the O- to 3-mm and 3- to 10-mm zones. Increased deposition rates of total osmotica and of Nat and lower deposition rates of Kf were found in root tips of cotton exposed to 150 mM NaCl (Zhong and Lauchli, 1994), but the contribution to Ts by individual solutes was not determined.
CONCLUSIONS
Inorganic ions contributed relatively more to Ts than did organic solutes. Rapid uptake of CI- on exposure to NaCl assisted in adjustment of fPs during the initial hours of salt shock, a contribution to Ts that would not normally occur during water deficit alone. Our results differ from those found when roots received an osmotic stress by exposure to mannitol, where it appears that organic sol- utes alone are involved in osmotic adjustment (Pritchard and Tomos, 1993). Seedling roots of maize responded to NaCl shock by maintaining higher concentrations of Suc and Pro in the O- to 3-mm apical zone and of Fru and Glc in the subapical 3- to 10-mm zone. Based on the concen-
www.plantphysiol.orgon June 3, 2020 - Published by Downloaded from Copyright © 1997 American Society of Plant Biologists. All rights reserved.

892 Rodríguez et al. Plant Physiol. Vol. 11 3 , 1997
trations of Pro a n d Suc i n the more cytoplasmic cells of the O- to 3-mm zone a n d the higher concentrations of Fru a n d Glc i n the vacuolated cells of the 3- to 10-mm zone, it seems reasonable t o conclude that Pro a n d Suc are com- par tmented i n the cytoplasm a n d Fru and Glc are com- par tmented i n the vacuole (or distributed throughout the cell), which agrees wíth the measurements of solute con- centration i n maize roots a t low qw (Voetberg and Sharp, 1991). Additionally, making assumptions about vacuolar size (Table 111), Pro a n d Suc would have m a d e a substan- tia1 contribution to cytoplasmic qs in the apical and sub- apical zone, whereas Fru a n d Glc could not possibly have been compartmented i n the cytoplasm i n the subapical zone. The inability to account for a11 of the root qs can be attributed t o the presence of other organic solutes a n d inorganic ions that were not quantitated.
ACKNOWLEDCMENTS
We are grateful to Dr. B.G. Cobb for providing advice and facilities for sugar analysis by GC and to Beijan Mei for able assistance with some of the experiments.
Received June 28, 1996; accepted November 20, 1996. Copyright Clearance Center: 0032-0889/97/ 113/0881/13.
LITERATURE ClTED
Azaizeh H, Gunse B, Steudle E (1992) Effects of NaCl and CaCl, on water transport across root cells of maize (Zen mays L.) seedlings. Plant Physiol 99: 886-894
Azaizeh H, Steudle E (1991) Effects of salinity on water transport of excised maize (Zea mays L.) roots. Plant Physiol97: 1136-1145
Binzel ML, Hess FD, Bressan RA, Hasegawa PM (1988) Intracel- lular compartmentation of ions in salt adapted tobacco cells. Plant Physiol 86: 607-614
Chang K, Roberts JKM (1989) Observation of cytoplasmic and vacuolar malate in maize root tips by I3C-NMR spectroscopy. Plant Physiol 89: 197-203
Cramer GR, Bowman DC (1991) Kinetics of maize leaf elongation. I. Increased yield threshold limits short-term, steady-state elon- gation rates after exposure to salinity. J Exp Bot 42: 1417-1426
Cramer GR, Epstein E, Lauchli A (1988) Kinetics of root elonga- tion of maize in response to short-term exposure to NaCl and elevated calcium. Plant Physiol 39: 1513-1522
Drew MC, Guenther J, Lauchli A (1988) The combined effects of salinity and root anoxia on growth and net Na+ and Kt accu- mulation in Zen mays grown in solution culture. Ann Bot 61:
Drew MC, Webb J, Saker LR (1990) Regulation of K uptake and transport to the xylem in barley roots: K distribution determined by electron probe X-ray microanalysis of frozen-hydrated cells.
Evlagon D, Ravina I, Neumann PM (1992) Effects of salinity stress and calcium on hydraulic conductivity and growth in maize seedling roots. J Plant Nutr 15: 795-803
Ferguson JE, Dickinson DB, Rhodes AM (1979) Analysis of en- dosperm sugars in a sweet corn inbred which contains the sugary enhancer (se) gene and comparison of se with other corn genotypes. Plant Physiol 63: 416420
Flowers TJ, Lauchli A (1983) Sodium versus potassium: substitu- tion and compartmentation. In A Lauchli, RL Bieleski, eds, En- cyclopedia of Plant Physiology, New Series, Vol 15. Springer- Verlag, Berlin, pp 651-681
41-53
J EXP Bot 41: 815-825
Frensch J, Hsiao TC (1994) Transient responses of cell turgor and growth of maize roots as affected by changes in water potential. Plant Physiol 104: 247-254
Gibbs J, Dracup M, Greenway H, McComb JA (1988) Effects of high NaCl on growth, turgor and interna1 solutes of tobacco callus. J Plant Physiol 134: 61-69
Greenway H, Munns R (1980) Mechanisms of salt tolerance in nonhalophytes. Annu Rev Plant Physiol 31: 149-190
Hajibagheri MA, Harvey DMR, Flowers TJ (1987) Quantitative ion distribution within root cells of salt-sensitive and salt- tolerant maize varieties. New Phytol 105: 367-379
Huang CX, van Steveninck RFM (1990) Salinity induced struc- tural changes in meristematic cells of barley roots. Plant Physiol
Jeschke WD, Aslam 2, Greenway H (1986) Effects of NaCl on ion relations and carbohydrate status of roots and on osmotic reg- ulation of roots and shoots of Atriplex amnicola. Plant Cell Envi- ron 9: 559-569
Jeschke WD, Wolf O (1988) Externa1 potassium supply is not required for root growth in saline conditions: experiments with Ricinus communis L. grown in a reciproca1 split-root system. J
Joly RJ (1989) Effects of sodium chloride on the hydraulic conduc- tivity of soybean root systems. Plant Physiol 91: 1262-1265
Jones MM, Osmond CB, Turner NC (1980) Accumulation of sol- utes in leaves of sorghum and sunflower in response to water deficits. Aust J Plant Physiol 7 193-205
Kurth E, Cramer GR, Lauchli A, Epstein E (1986) Effects of NaCl and CaCl, on root cell enlargement and cell production in cotton roots. Plant Physiol 82: 1102-1106
Lauchli A (1984) Salt exclusion: an adaptation of legumes for crops and pastures under saline conditions. In RC Staples, GH Toen- niessen, eds, Salinity Tolerance in Plants. John Wiley, New York,
Lee RB, Ratcliffe RG, Southon TE (1990) 31P NMR measurements of the cytoplasmic and vacuolar Pi content of mature maize roots: relationships with phosphorus status and phosphate fluxes. J Exp Bot 41: 1063-1078
McNulty IB (1985) Rapid osmotic adjustment by a succulent halo- phyte to saline shock. Plant Physiol 78: 100-103
McWilliam JR (1986) The national and international importance of drought and salinity. Aust J Plant Physiol 13: 1-13
Munns R, Weir R (1981) Contribution of sugars to osmotic adjust- ment in elongating and expanding zones of wheat leaves during moderate water deficits at two light levels. Aust J Plant Physiol
Myers BA, Neales TF, Jones MB (1990) The influence of salinity on growth, water relations and photosynthesis in Diplacknefusca (L.) P. Beauv. ex Roemer & Schultes. Aust J Plant Physiol 17:
Neumann PM (1993) Rapid and reversible modifications of exten- sion capacity of cell walls in elongating maize leaf tissues re- sponding to root addition and remova1 of NaCl. Plant Cell Environ 16: 1107-1114
Neumann PM, Azaizeh H, Leon D (1994) Hardening of root cell walls: a growth inhibitory response to salinity stress. Plant Cell Environ 17: 303-309
Neumann PM, Van Volkenburgh E, Cleland RE (1988) Salinity stress inhibits bean leaf expansion by reducing turgor, not wall extensibility. Plant Physiol 88: 233-237
Nobel PS (1991) Physiochemical and Environmental Plant Physi- ology. Academic Press, San Diego, CA
Premachandra GS, Saneoka H, Kanaya M, Ogata S (1989) Re- sponses of relative growth rate, water relations and solute ac- cumulation to increasing water deficits in maize. J Plant Physiol
Pritchard J, Tomos AD (1993) Correlating biophysical and bio- chemical control of root cell expansion. In JAC Smith, H Grif- fiths, eds, Water Deficit: Plant Responses from Cell to Commu- nity. Bios Scientific, Oxford, UK, pp 53-72
Pritchard J, Wyn Jones RG, Tomos AD (1990) Measurements of yield threshold and cell wall extensibility of intact wheat roots
115: 17-22
EXP Bot 39: 1149-1167
pp 171-187
8: 93-105
675-691
135: 257-260
www.plantphysiol.orgon June 3, 2020 - Published by Downloaded from Copyright © 1997 American Society of Plant Biologists. All rights reserved.

Growth and Water Relations of Salinized Maize Roots 893
under different ionic, osmotic and temperature treatments. J Exp Bot 277 669-675
Pritchard J, Wyn Jones RG, Tomos AD (1991) Turgor, growth, and rheological gradients of wheat roots following osmotic stress. J Exp Bot 42: 1043-1049
Roberts JKM, Hooks MA, Miaullis AP, Edwards S, Webster C (1992) Contribution of malate and amino acid metabolism to cytoplasmic pH regulation in hypoxic maize root tips studied using nuclear magnetic resonance spectroscopy. Plant Physiol 98: 480-487
Sánchez-Aguayo I, González-Utor AL (1992) Quantitative deter- mination of changes induced by NaCl in vacuoles and cellular size of Lycopersicon esculentum root cells. Plant Cell Environ 15:
Schubert S, Lauchli A (1988) Metabolic dependence of Na+ efflux from roots of intact maize seedlings. J Plant Nutr 133: 193-198
Sharp RE, Hsiao TC, Silk WK (1990) Growth of the maize primary root at low water potentials. 11. Role of growth and deposition of hexose and potassium in osmotic adjustment. Plant Physiol 93:
Sharp RE, Silk WK, Hsiao TC (1988) Growth of the maize primary root at low water potentials. I. Spatial distribution of expansive growth. Plant Physiol 87: 50-57
Spickett CM, Smirnoff N, Ratcliffe RG (1992) Metabolic re- sponses of maize roots to hyperosmotic shock. Plant Physiol99:
Thiel G, Lynch J, Lauchli A (1988) Short-term effects of salinity
867-870
1337-1346
856-863
stress on the turgor and elongation of growing barley leaves. J Plant Physiol 132: 38-44
Voetberg GS, Sharp RE (1991) Growth of the maize primary root at low water potentials. 111. Role of increased proline deposition in osmotic adjustment. Plant Physiol 96: 1125-1130
Weimberg R, Lerner HR, Poljakoff-Mayber A (1984) Changes in growth and water-soluble solute concentrations in Sorgkum bi- color stressed with sodium and potassium salts. Physiol Plant 62: 472480
Wyn Jones RG (1981) Salt tolerance. In CB Johnson, ed, Physio- logical Processes Limiting Plant Productivity. Butterworths, London, pp 271-292
Yeo AR, Kramer D, Lauchli A, Gullasch J (1977) Ion distribution in salt stressed mature Zea mays roots in relation to ultrastruc- ture and retention of sodium. J Exp Bot 28: 17-29
Zhong H, Lauchli A (1993) Spatial and temporal aspects of growth in the primary root of cotton seedlings: effects of NaCl and CaCl,. J Exp Bot 4 4 763-771
Zhong H, Lauchli A (1994) Spatial distribution of solutes, K, Na, Ca and their deposition rates in the growth zone of primary cotton roots: effects of NaCl and CaC1,. Planta 194: 3441
Zimmerman TW, Cobb BG (1989) Vitrification and soluble carbo- hydrate levels in petunia leaves as influenced by media Gelrite and sucrose concentrations. Plant Cell Rep 8: 358-360
Zimmermann U (1978) Physics of turgor- and osmo-regulation. Annu Rev Plant Physiol 29: 121-148
www.plantphysiol.orgon June 3, 2020 - Published by Downloaded from Copyright © 1997 American Society of Plant Biologists. All rights reserved.