growth projections for ottawa: prospects for …...the city of ottawa’s long-term growth...
TRANSCRIPT

DOCUMENT 2
Growth Projections for Ottawa: Prospects for Population, Housing, Employment and Land, 2014-2036
November 2016
Research and Forecasting UnitPlanning, Infrastructure and Economic Development Department

1Table of Contents
Table of Contents
Executive Summary ...................................................................................................................................... 2
Part I. Population Projections ....................................................................................................................... 4
Part II. Households and Housing ............................................................................................................... 18
Part III. Employment ................................................................................................................................... 27
Part IV. Demand for and Supply of Urban Residential Land to 2036 ........................................................ 31
Bibliography ................................................................................................................................................ 36
Appendix List ............................................................................................................................................... 37
Appendix 1 – Scenario Summaries ............................................................................................................. 38
Appendix 1 – Scenario Summaries ............................................................................................................. 39
Appendix 1 – Scenario Summaries ............................................................................................................. 40
Appendix 2 – Household, Dwelling and Employment Details, Reference Scenario ................................... 41
Appendix 3 – Population Projections for OMATO Municipalities ................................................................ 42
Appendix 4 – Population in Collectives ....................................................................................................... 43
Appendix 5 – Dwelling Types by Area - Reference Scenario ..................................................................... 44
Appendix 6 – Components of Population Growth - Low Scenario .............................................................. 45
Appendix 6 – Components of Population Growth - Reference Scenario .................................................... 46
Appendix 6 – Components of Population Growth - High Scenario ............................................................. 47
Appendix 7 – Village Residential Supply .................................................................................................... 48

2Executive Summary
Executive Summary
Projections of long-term change in population and associated housing and employment are fundamental to a community’s ability to plan for land use, housing needs, land requirements, transportation and infrastructure, financing, recreational and social needs, and other basic services.
The City of Ottawa’s long-term growth projections were last updated in 2007. Since then Ottawa’s actual population, housing, and employment have tracked well against these projections and have not required revision. However, after almost a decade it is appropriate that an update be undertaken. At the same time, the projections will be extended from the current 2031 horizon to 2036.
The purpose of this report is to:
a) Explain the methodology and assumptions used in the projections;
b) Present the results of the scenarios developed, including the recommended Reference Projection used to develop subsequent housing and employment projections;
c) Analyse the demand for urban and rural housing by unit type and the associated urban land requirements up to 2036; and
d) Compare the demand for urban housing land to the supply to assess whether there is a need to add urban land for 2036.
Population
The projections of population used a cohort-survival model, the widely-accepted best methodology and the same technique used in previous projections. Cohort survival separates population change into its basic components; births are added to the population, deaths are subtracted, net migration is incorporated and the existing population is aged to arrive at future population totals.
The new projections are based on the most recent detailed Statistics Canada data for the City of Ottawa. A base year of 2014 is used; the latest year for which reliable data are available.
Three scenarios were developed, summarized below.
Low Projection: Assumes a lower than recent rate of births, higher mortality and lower rates of in-migration. The above assumptions result in a 2036 population of 1,076,600, an increase of 130,000 (14%) from 2014.
Reference Projection: Assumes a slight increase in the birth rate based on recent trends, decreasing mortality in line with projected provincial forecasts, and in- and out-migration rates per 1,000 population based on averages for the past decade. Under this scenario the result is a 2036 population of 1,214,000, an increase of 267,000 (28%) from 2014.
High Projection: Assumes a ten percent increase in birth rates, accelerated declines in mortality, and higher than average in-migration rates. These result in a 2036 population of 1,305,000, an increase of 359,000 (38%) from 2014.
The proposed Reference Projection is slightly higher than the previous projection developed in 2007. Using 2031 for comparison, the new projection is 17,700 persons (1.6%) (1,153,500 compared to 1,135,800) higher.

3Executive Summary
Greater Ottawa-Gatineau Area
Growth in areas adjacent to Ottawa in both Ontario and Québec has generally been slower than projected in 2007. The projections, prepared in 2007, used the growth forecasts adopted by local municipalities in OMATO (Ontario Municipalities Adjacent To Ottawa). These have proved to be significantly higher than actual growth to date. Consequently, new projections for expected growth in OMATO are based on recent observed rates of growth.
Projections for the City of Gatineau and adjacent areas in Québec used the latest forecasts developed by the Québec government.
Overall, population in the greater area is projected to increase by almost 430,000 (+31%), from 1,368,000 in 2011 to 1,797,000 by 2036. The City of Ottawa is projected to account for 70% of this growth.
Housing
Projected housing requirements, based on 2011 headship rates and projected demand for different unit types by age group, show a need for 130,839 additional housing units over the 2014-2036 period, an increase of 34.2% from 2014. Projected new units by type are split 33% single-detached, 3% semi-detached, 28% rowhouses and 36% apartments.
Employment
Employment is based on projected labour force participation rates by age and sex for the Ottawa population. To this is added net in-commuting from adjacent areas. Unemployment is subtracted and a factor for multiple job-holders is applied to arrive at a final job figure.
Total jobs located within the city of Ottawa in 2036 are projected to be 745,000, an increase of 188,000 or 34% from the 2011 base year used for the employment projection.
Urban Land
Analysis of the demand for and supply of urban land is complex. The methodology used for the new analysis is similar to that used by the City of Ottawa at the 2012 Ontario Municipal Board hearing on projections and the urban boundary (Official Plan (OP) Amendment 76). That analysis concluded that due to changes in demographics and the housing market that there would be a shift from lower-density single-detached housing to higher-density housing forms such as apartments. In fact, the anticipated shift has occurred considerably more quickly than had been expected.
Comparing projected demand to dwelling unit supply to 2036 shows a potential shortfall for single-detached and semi-detached units. However, concurrent with this projections update is a review of employment lands and the potential conversion of some of these lands to alternative land uses. Pending the outcome of that review there may be opportunities to include additional residential land.

4Part I. Population Projections
Growth Projections for Ottawa; Prospects for Population, Housing, Employment and Land, 2014-2036
Projections of long-term population and associated housing and employment are fundamental to a community’s ability to plan for land use, housing needs, land requirements, transportation and infrastructure, financing, recreational and social needs, and other basic services.
Projections are always a challenge but in fact much of Ottawa’s demographic future has already been determined by the characteristics of its current population. Many of Ottawa’s current residents will still reside here in 20 years but will have aged by 20 years thereby changing their housing demands. The well-documented phenomenon of population aging will have major effects on Ottawa’s future as it will in other cities in Canada and in other countries.
The City of Ottawa’s long-term growth projections were last updated in 2007. Since then Ottawa’s actual population, housing, and employment have tracked well against these projections and have not required revision. However, after almost a decade it is appropriate that an update be undertaken. At the same time, the projections will be extended from the current 2031 Official Plan horizon to 2036.
The purpose of this report is to:
a) Explain the methodology and assumptions used in the projections;
b) Present the results of the population projection scenarios developed, including the recommended Reference Projection subsequently used to develop housing and employment projections;
c) Analyse the demand for urban and rural housing by unit type and the associated urban land requirements up to 2036; and
d) Compare the demand for urban housing land to the supply to assess whether there is a need to add urban land for 2036.
Part I. Population Projections
Methodology
The projections used a cohort-survival model, the widely-accepted best methodology for projections by age and gender. The same technique has been used in all previous (new) City of Ottawa and, prior to 2001, Region of Ottawa-Carleton projections since the 1980s. Cohort survival separates population change into its basic components; births are added, deaths are subtracted, and net migration (in and out migration from various sources) is added. Details for these factors are set out in the subsequent sections of the report.
The previous projections, completed in 2007, used the cohort survival component of a software program developed by Canada Mortgage and Housing Corporation (CMHC), called the Potential Housing Demand (PHD) model. For the new projections, staff of the Research and Forecasting unit of the Planning, Infrastructure and Economic Development Department constructed a new spreadsheet-based model that allows more flexibility in defining the inputs.
Base Year
Results of the 2016 Census, undertaken in May 2016 by Statistics Canada, are currently scheduled to be released starting in February 2017. Age/sex counts of the population will be available starting in May 2017 with further details being released later in 2017.

5Part I. Population Projections
While it may appear to be advantageous to incorporate 2016 Census counts into the updated projection, in fact the projections of population are not based directly on census data. As in past practice, base year population and age-sex data use Statistics Canada’s post-censal estimates. These are more accurate than the census in that they are designed to account for under- and over-counting in the census results.
Final post-censal counts for 2016 are not expected to be available until 2018. What is currently available are final and revised post-censal population data by age and sex for Ottawa for mid-2014. Counts for 2015 are preliminary and potentially subject to significant revision. Consequently, the updated projections presented in this report are based on Statistics Canada’s post-censal estimates for July 1, 20141. These are the most accurate detailed demographic data available at this time.
Figure 1 below illustrates the difference, by age, between the 2011 Census and Statistics Canada’s final post-censal estimates for 2011. Net underreporting in the census is concentrated among adults aged from approximately 18 to 40.
Figure 1 2011 Census Population by Age Compared to 2011 Post-Censal Data
0
2,000
4,000
6,000
8,000
10,000
12,000
14,000
16,000
18,000
0 3 6 9 12 15 18 21 24 27 30 33 36 39 42 45 48 51 54 57 60 63 66 69 72 75 78 81 84 87 90
Popu
latio
n
Age
2011 Census 2011 Post-censal Estimate
Source: Statistics Canada, data for City for 2011 Census and CANSIM Table 051-0062
Residents of collective establishments, which include hospitals, certain retirement homes2, shelters, prisons, etc, are separate from the “population in private households” (PIPH). Custom data on the age distribution of residents of collective dwellings were purchased from Statistics Canada for each of the past three censuses. Details are contained in Appendix 4.
1 While Statistics Canada’s 2014 population estimates are labelled “Revised”, and therefore subject to change before being declared Final, review of previous time series shows there to be little change between Revised and Final data. The 2014 estimates are therefore used in order to base the projections on the most recent year of reliable estimates.
2 Some retirement homes are classified as collective dwellings, while others are counted as private dwellings. The differentiating criterion appears to be the level of care provided on a unit basis within each building.

6Part I. Population Projections
Fertility
The best predictor of future births is the Total Fertility Rate (TFR), the average number of children per woman over her lifetime. Rates in Ottawa have historically been lower than the national and provincial averages, and continue to be lower according to the most recent data. Rates have risen over the past decade, but only slightly. The 2007 projections used a TFR of 1.43 based on the Ottawa average for 2001. That was held constant for all scenarios, given sensitivity testing that concluded variations had no significant effect on the overall outcome.
Based on average births by age of mother for 2010 to 2013, Ottawa’s calculated TFR for 2011 had risen slightly to 1.47. Following a steady rise over the past several years, the rate for the Reference projection was gradually increased to 1.50 by 2026 and held steady after that. The High scenario used a 10 percent higher TFR of 1.65, while the Low scenario incorporated a 10 percent lower TFR of 1.35. This is consistent with the approach taken by Statistics Canada to test different scenarios for their population projections.
For comparison, the Canadian TFR was 1.61 in 2011; in Ontario it was 1.55.
Mortality
Ottawa-specific life tables were developed for the projections. This is the first time that Ottawa life tables, which set out the annual probabilities for survival by single year of age and sex over the projection period, have been used for City projections. The tables are based on average Statistics Canada mortality by single year of age and sex over the five-year period from 2009 to 2013 for Ottawa. The base population on which mortality rates were calculated is Statistics Canada’s 2011 post-censal population estimate.
Projected life expectancy by sex was based on the proportionate difference between Ottawa and Ontario for 2011. Residents of Ottawa typically exhibit a longer life expectancy than the provincial average. In 2011, newborn Ottawa males could expect to live an average of 81.5 years compared to 79.8 years for Ontario and 79.4 years for Canada. Ottawa females averaged 85.2 years at birth compared to 84.0 years for Ontario and 83.6 years for Canada. The proportional difference between Ottawa and the province was applied to the projected Ontario life expectancies (using 2015 Statistics Canada data from Catalogue no. 91-620) interpolated to 2021, 2031 and 2036. Using this technique, life expectancy under the Reference scenario for Ottawa residents born in 2036 is expected to be 86.5 years for males and 88.3 years for females.
Recent and projected births and deaths under each of the three scenarios are shown in Figure 2.

7Part I. Population Projections
Figure 2 Births and Deaths for Three Scenarios, 2005-2036
0
2,000
4,000
6,000
8,000
10,000
12,000
14,000
16,000
2005 2008 2011 2014 2017 2020 2023 2026 2029 2032 2035
Num
ber o
f Per
sons
Year
Deaths (Actual)
Deaths (Low)
Deaths (Reference)
Deaths (High)
Births (Actual)
Births (Low)
Births (Reference)
Births (High)
Source: Statistics Canada, CANSIM Tables 051-0063 and 051-0064, and City projections
Migration
Migration is, and has been for many decades, the most important factor affecting changes in Ottawa’s population. Net migration, the number of people moving to Ottawa minus the number moving out, is the result of many processes. For the purposes of the projections, these are categorized into three primary migration streams; intra-provincial, inter-provincial, and international migration. Intra-provincial migration is the movement of people between the rest of Ontario and Ottawa, inter-provincial migration is the movement of people between Ottawa and the remainder of Canada excluding Ontario and international migration is the movement of people between Ottawa and all countries outside of Canada. International migration is further subdivided into immigrants, emigrants, returning emigrants, temporary emigrants, and non-permanent residents. (Non-permanent residents, or NPRs, are persons who have work, student or temporary resident permits, or persons claiming refugee status.)
Details for the five categories of international migrants are from Statistics Canada data, which are available starting only in 2001. Less detailed migration data back to 1987 are also published by Statistics Canada. This information, derived from tax records, is less complete for international migrants but offers a time series that is twice as long as the newer estimates beginning in 2001. The older data were used to examine whether net immigration rates to Ottawa have been increasing or decreasing over time.
For the projections, the approach adopted by Statistics Canada in their most recent projections for Canada and the provinces3 was adopted on the basis that it represents the most up-to-date methodology. A primary method in their projections is the use of migration rates per 1,000 persons. The strength of the method is that it puts historical data into context. For example, 1,000 in-migrants to Ottawa in 1991 would be the equivalent of 1,365 in 2015. Conversely, while 1,000 arrivals in both 1991 and 2015 would appear to be equal, it would require only 700 in-migrants in 1991 to have the same demographic weight proportional to the existing population.
3 Statistics Canada, Population Projections for Canada (2013 to 2063), and Provinces and Territories (2013 to 2038), Cat. 91-520, May 26, 2015

8Part I. Population Projections
Data available since 1987 show a declining trend in the net (arrivals minus departures) number of international movers to Ottawa per thousand population (Figure 3). Peaks occurred during 1992-93, when the national economy was in recession but the local economy was growing, and during the high-tech boom of 2000-2001. Since then the rate has dropped from 6.4 arrivals per thousand persons in the early 2000s to an average of 4.1 over the past two years.
Intra- and inter-provincial migration have tended to move together in response to the robustness of the local economy relative to the rest of the province and the country. Figure 3 shows intra- and inter-provincial migration and clearly illustrates the effects of federal job cuts in the mid-1990s, the high tech boom and subsequent bust, and the effects of the western Canada energy boom through 2010-2014.
Figure 3 Net Migration Rates per 1,000 Population, 1987-2014
-10
-5
0
5
10
15
20
1987
1989
1991
1993
1995
1997
1999
2001
2003
2005
2007
2009
2011
2013
Rate
per
100
0 Po
pula
tion
Year
Intra-prov
Inter-prov
Int'l
Source: Statistics Canada, Migration Estimates for Census Division 3506 (Ottawa)
Projections of Future Migration
International migration rates for the four primary streams (immigrants, emigrants, returning emigrants, and temporary emigrants) for the Scenario 2 (Reference) projection were based on the average of the past 10 years of data, similar to the approach adopted by Statistics Canada for the nation for its medium projections. The same rates per thousand were applied to Scenarios 1 and 3 (Low and High respectively), except for international migration. The Low scenario applies the same proportional difference between Statistics Canada’s low and medium projections to the 6.2 per thousand rate for Ottawa. That produces a Low scenario immigration rate of 4.1 per thousand. The High Scenario rate adopts the same approach for Statistics Canada’s high and medium projections. That produces a rate of 7.4 for Ottawa.
For inter- and intra-provincial migration, three variations of a constant annual numeric rate were developed. Again, this is similar to Statistics Canada’s approach to domestic migration. The Reference projection adopts the average levels of the past 10 years, the Low uses 27-year averages (the longest period for which there are available data) and the High projection uses rates 30 percent above the 10-year average.
The last migration component is non-permanent residents (NPRs). A non-permanent resident is a person in Canada who has a work or study permit, or who is a refugee claimant. All three scenarios assume a reduction to the 10-year average by 50 percent, from an 850 person annual average to 425 annually after 20214. This reflects anticipated reductions in the growth of the NPR population nationally. For example, Statistics Canada’s medium projection for Canada is that growth in the NPR population will fall to zero
4 The level of NPR migration has little effect on the projections because almost all in-migrants to Ottawa are student-aged. Outside of the roughly 18 to 25 population, there are net negative losses as people leave.

9Part I. Population Projections
over the next decade. Ottawa is projected to continue to attract some NPRs due to its educational institutions.
Assumptions for seven migration components, as well as births and deaths for all three scenarios are summarized in Figure 4.
Figure 4 Summary of Projection Assumptions for Three ScenariosComponent Scenario 1
LowScenario 2Reference
Scenario 3High
Rates/1,000 populationInternational immigrants 4.1 6.2 7.4Emigrants 3.0 3.0 3.0Returning emigrants 1.9 1.9 1.9Net temporary emigration 0.9 0.9 0.9
Annual numbersInter- and Intra- based on: 27-year average 10-year average Sc. 2 plus 30%Net interprovincial migration 1,183 1,227 1,595Net intraprovincial migration 126 1,502 1,953
Net non-permanent residents 850 to 450 850 to 450 850 to 450
Natural IncreaseTotal Fertility Rate (TFR) by 2026 1.35 1.50 1.65
Mortality projected Ontario rates
proportionate to Ott-Ont difference
double Ott-Ont difference
Projection Results
Results for the three scenarios are summarized in Figure 5. Relative to the current OP projection to 2031, the proposed Reference projection is higher by 17,700 persons or 1.6 percent.
Figure 5 Results for Three Scenarios compared to Official Plan, 2014-2031-2036Growth
Scenario 2014 2031 2036 2014-31 2014-36
Low 946,344 1,057,305 1,076,621 110,961 11.7% 130,277 13.8%Reference 946,344 1,153,535 1,213,553 207,191 21.9% 267,209 28.2%High 946,344 1,214,771 1,305,224 268,427 28.4% 358,880 37.9%
Official Plan 946,344 1,135,840 n/a 189,496 20.0% - -Note: 2014 is the current post-censal estimate for mid-2014
Figure 6 shows the age profiles of the three projections to 2036 at five-year intervals starting with the final post-censal figures for 2011. Scenario 1 (Low), with the lowest migration and births, has the highest share of population aged 65+ (24%) and the lowest share aged 19 and under (19.5%). Scenario 3 (High) is the reverse of this with 20.4% aged 65+ and almost 23 percent aged 19 and under. Scenario 2 (Reference) is between the two but slightly closer to the High scenario. Details of the projected age structure under each of the 3 scenarios can be found in Appendix 1.

10
Figure 6 Age Profile for the 3 Scenarios, 2011-2036
23.1% 21.6% 21.2% 20.9% 20.3% 19.5%
22.0% 22.5% 21.3% 19.1% 17.9% 17.7%
22.4% 20.2% 20.0% 21.0% 21.6% 20.8%
19.7% 20.6% 20.2% 18.9% 17.6% 17.9%
12.8% 15.0% 17.3% 20.1% 22.7% 24.1%
0%10%20%30%40%50%60%70%80%90%
100%
2011 2016 2021 2026 2031 2036
Scenario 1 (Low) - Age Profile
65+
50-64
35-49
20-34
0-19
23.1% 21.6% 21.2% 21.2% 21.2% 21.2%
22.0% 22.9% 22.6% 21.3% 20.1% 19.5%
22.4% 20.3% 20.2% 21.1% 21.9% 21.8%
19.7% 20.3% 19.0% 17.2% 15.9% 16.0%
12.8% 15.0% 17.0% 19.1% 20.9% 21.4%
0%10%20%30%40%50%60%70%80%90%
100%
2011 2016 2021 2026 2031 2036
Scenario 2 (Reference) - Age Profile
65+
50-64
35-49
20-34
0-19
Part I. Population Projections
23.1% 21.6% 21.4% 21.8% 22.3% 22.7%
22.0% 23.1% 23.2% 22.1% 20.8% 19.9%
22.4% 20.3% 20.2% 21.1% 21.9% 21.9%
19.7% 20.1% 18.5% 16.4% 15.0% 15.1%
12.8% 14.9% 16.8% 18.6% 20.0% 20.4%
0%
20%
40%
60%
80%
100%
2011 2016 2021 2026 2031 2036
Scenario 3 (High) - Age Profile
65+
50-64
35-49
20-34
0-19

11Part I. Population Projections
Another view of the change in age groups shares in each scenario is shown in Figure 7. This presents the changes as an index with 2011 set at 100. Values over 100 indicate increases; for example, total population in Scenario 1 is 118 at 2036, indicating an 18 percent increase. Values below 100 show declines; this occurs in only one age group, 20-34 in Scenario 1, with a 2036 population only 95 percent the size of 2011. The most striking observation from the values presented in Figure 7 is that the only age group growing at a rate faster than the total population is the 65+ cohort.
Figure 7 Index of Population by Age Group, Three Scenarios (2011 = 100)Scenario 1Age groups 2011 2016 2021 2026 2031 20360-19 100 99 101 103 102 10020-34 100 108 106 98 94 9535-49 100 95 98 106 112 11050-64 100 110 112 108 104 10765+ 100 123 147 177 205 221TOTAL 100 105 109 113 116 118Scenario 2Age groups 2011 2016 2021 2026 2031 20360-19 100 100 104 110 116 12220-34 100 110 116 116 116 11835-49 100 96 102 113 124 13050-64 100 109 109 105 102 10865+ 100 124 149 178 206 222TOTAL 100 106 113 120 126 133Scenario 3Age groups 2011 2016 2021 2026 2031 20360-19 100 100 106 117 128 14120-34 100 112 121 124 126 12935-49 100 97 104 116 131 14050-64 100 109 107 103 101 11065+ 100 124 150 179 208 228TOTAL 100 107 115 124 133 143
Dependency Ratio
The Dependency Ratio measures the ratio between the combined population aged 15 and under and over 64 to the population aged 15 to 64, traditionally the “working age” population. Under the Reference scenario, the ratio for Ottawa is projected to increase from 43.3 in 2014 to 59.4 in 2036. Almost 90 percent of the increase is due to growth in the older population. Although the Reference Projection has the working-age population continuing to increase to 2036, its growth rate is only about one quarter the rate of growth of the dependent population (15% compared to 58% respectively over 2014-36). However, Ottawa is far better placed than many countries; for example, as of 2015 the absolute size of the working-age population was declining in the European Union, Japan and China.5
Despite the projected hike in the dependency ratio, the Ottawa ratio will still be lower than the country overall; Statistics Canada projects a ratio of 65.0 nationally by 2036. An important reason for Ottawa’s lower dependency ratio is the rejuvenating effect of domestic and international migration.
5 Source: United Nations Population Division, 2015.

12Part I. Population Projections
Statistics Canada Projections for Canada
Statistics Canada published their latest projections for Canada and the provinces in May 20156. The medium (M1) scenario shows the Canadian population increasing by almost 24 percent over the 2013 to 2038 projection period from 35.2 million to 43.5 million. Ontario is projected to grow at a slightly lower rate, by 22 percent over the 25 years, from 13.5 to 16.5 million.
One way to assess the reasonableness of the Reference projection for Ottawa is to put it into a national and provincial context. Relative to Canada, Ottawa has steadily grown at a faster rate since 1951 except for the recession of the late 1970s. In 1988, 25 years prior to Statistics Canada’ base year of 2013, Ottawa accounted for 2.44 percent of the Canadian population and 6.67 percent of the province of Ontario. In 2013, the city had increased to 2.66 percent of Canada and 6.91 percent of Ontario. By 2038, using an extrapolation of the 2036 Reference figure, Ottawa would represent 2.85 percent of the nation and 7.48 percent of the province. Nationally that is a slight reduction from the historic rate, but is more than double the rate of increase relative to Ontario. This is explained by Ottawa being comparatively unaffected by any future declines in southern Ontario’s manufacturing sector.
Comparison to Ontario Ministry of Finance Projections
The provincial Ministry of Finance (MoF) produces projections annually for the province and each of the upper-tier municipalities, including Ottawa. The City of Ottawa has never used the MoF projections for a number of reasons. First, the projections change each year and can be subject to significant revision. Hence, depending upon which year’s projections are adopted there can be significantly different results. Secondly, the projections are strongly influenced by short term trends, approximately the preceding five years. Since the most important factor in projections, net migration, experiences upward and downward cycles, the projections may change significantly from year-to-year and a projection based on a 5 year picture can lead to significant fluctuation in the projected population.
By age cohort, the MoF population projections have consistently overestimated the 0 to 24 and 65 and over age cohorts while underestimating the 35 to 64 age category. Overall, the gap between the MoF projections and the OP projections has been widening for the past three projection cycles (2021, 2026 and 2031).
It is concluded that due to their volatility, the MoF projections are not a sound basis upon which to base long term municipal planning and subsequently are not used in this report.
Population Growth in Communities Adjacent to Ottawa
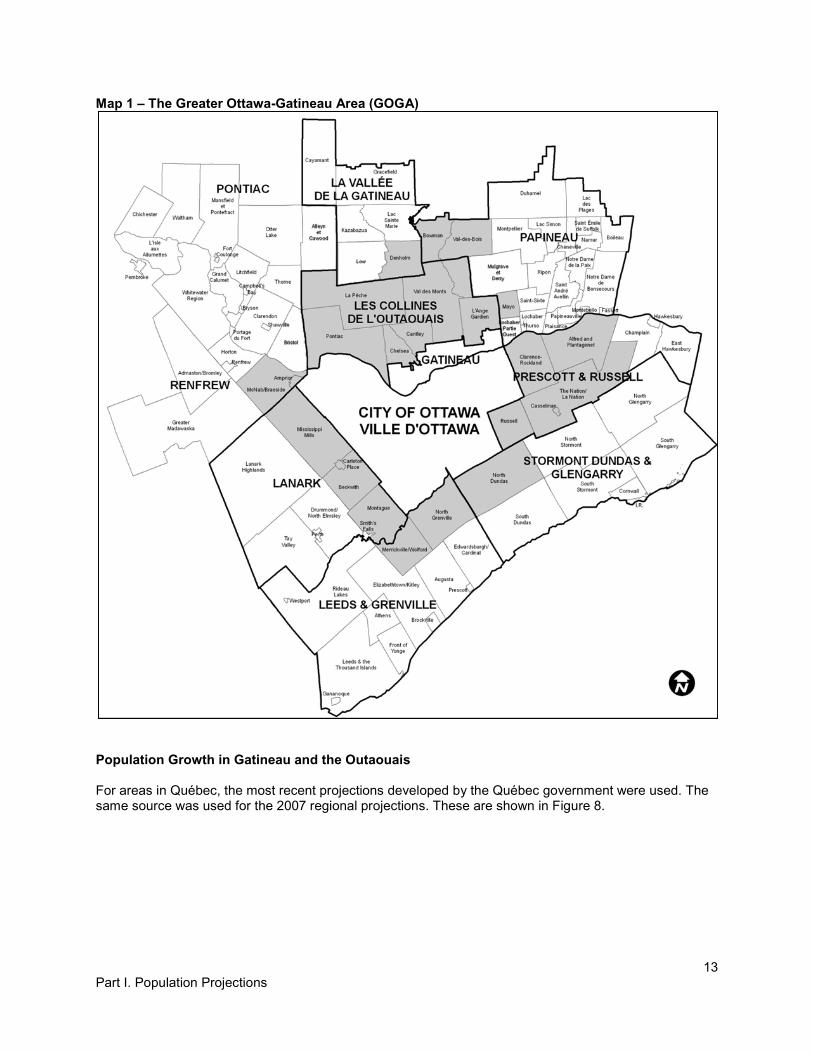
Ottawa has demographic and economic links to surrounding communities in both Ontario and Québec. Population growth in the areas adjacent to Ottawa must be examined and included in this analysis especially as it relates to future employment in Ottawa (discussed later in this report). Map 1 shows the area adjacent to Ottawa that is included in this analysis.
6 Statistics Canada, op. cit.
13 Part I. Population Projections
Map 1 – The Greater Ottawa-Gatineau Area (GOGA)
Population Growth in Gatineau and the Outaouais
For areas in Québec, the most recent projections developed by the Québec government were used. The same source was used for the 2007 regional projections. These are shown in Figure 8.

14Part I. Population Projections
Figure 8 Population Projections for the City of Gatineau and Rural Outaouais (MRC)Area 2011 2016 2021 2026 2031 2036Gatineau 268,838 280,923 300,878 315,997 328,731 339,080MRC 46,908 50,982 54,506 57,472 59,653 61,248Total 315,746 331,905 355,384 373,469 388,384 400,328
Increase 16,159 23,479 18,085 14,915 11,944% increase 5.1% 7.1% 5.1% 4.0% 3.1%
Source: Institut de la statistique du Québec, Perspectives démographiques des MRC du Québec, 2011-2036, released October 1, 2014.
Growth in Ontario Municipalities Adjacent To Ottawa (OMATO)
Population growth in the 14 Ontario Municipalities Adjacent To Ottawa (OMATO) municipalities has been the subject of ongoing monitoring for many years. Figure 9 shows percentage population growth in Ottawa and the OMATO communities for each five-year census period since 1971. Three things are especially noteworthy:
• The highest growth rates in OMATO occurred between 1986 and 1996, with growth in OMATO in the early 1990s occurring at twice the rate of Ottawa;
• Since 1996 growth in OMATO has slowed considerably, although rates in both Ottawa and OMATO increased between 2006 and 2011;
• Since 1996 Ottawa has consistently grown at a higher rate than the OMATO municipalities.
Figure 9 Population Growth in Ottawa and OMATO, 1971 to 2011
0%
2%
4%
6%
8%
10%
12%
14%
16%
18%
1971-76 1976-81 1981-86 1986-91 1991-96 1996-2001 2001-06 2006-11City of Ottawa OMATO
Source: Statistics Canada, Census of Canada, 1971 to 2011
Population growth in OMATO between 2001 and 2011 also displays a significant emphasis on pre-retirement and retirement age groups compared to Ottawa (Figures 10 and11):
• The 0-4 cohort increased by only two percent in OMATO, compared to 10 percent growth in Ottawa.
• The population aged 5 to 14 and 25 to 44 declined in absolute numbers in every one of the 14 OMATO municipalities.

15Part I. Population Projections
• Small increases in OMATO’s student-aged population (15 to 24) may reflect post-secondary students either living at home and studying in Ottawa or attending school elsewhere and being enumerated by the census at their parents’ home.
• All age cohorts 45 to 84 increased more rapidly in OMATO than in Ottawa, particularly those aged 55 to 74.
• Ages 85 and over increased more rapidly in Ottawa, likely due to the very elderly wanting to be close to advanced medical care.
Figure 10 OMATO Age Distribution, 2001 and 2011
0
5,000
10,000
15,000
20,000
25,000
30,000
35,000
0-4 5-14 15-19 20-24 25-44 45-54 55-64 65-74 75-84 85+
Num
ber o
f Per
sons
2001 2011
Source: Statistics Canada, Census of Canada, 2001 and 2011
Figure 11 Percentage Change by Age Group, Ottawa and OMATO, 2001-11
-20%
0%
20%
40%
60%
80%
0-4 5-14 15-19 20-24 25-44 45-54 55-64 65-74 75-84 85+Ottawa OMATO
Source: Statistics Canada, Census of Canada, 2001 and 2011
Projections adopted by local OMATO municipalities were used in the previous (2007) projections for the Ottawa region. These have proved to be too high in all but one of the 14 communities. Projections adopted by the Township of North Grenville, which includes Kemptville, were especially high, with a forecast 2011 population of almost 25,000, compared to a 2011 Census count of 15,085. Figure 12 shows projected OMATO population compared to 2011 Census figures.

16Part I. Population Projections
Figure 12 Projected Versus Census Population in OMATO, 2011
10,2
19
9,10
4
7,72
8 12,9
15
3,34
4
23,9
68
7,97
5
2,99
3 14,3
90
4,63
1 11,7
72
24,9
33
15,0
26
12,1
86
9,19
6
8,11
4
6,98
6
9,80
9
3,64
2
23,1
85
7,37
1
2,85
0
12,3
85
3,48
3
11,2
25
15,0
85
15,2
47
11,6
68
0
5,000
10,000
15,000
20,000
25,000
30,000
Alfr
ed &
Pla
ntag
enet
Arnp
rior
Beck
with
Carle
ton
Plac
e
Cass
elm
an
Clar
ence
-Roc
klan
d
McN
ab/B
raes
ide
Mer
rickv
ille-
Wol
ford
Miss
issip
pi M
ills
Mon
tagu
e.
Nor
th D
unda
s
Nor
th G
renv
ille
Russ
ell
The
Nat
ion
Num
ber o
f Per
sons
Projection Census
Source: Statistics Canada, Census of Canada, 2011 and OMATO Official Plans
New projections prepared by OMATO municipalities are presented in Figure 13. Based on past patterns these again appear to be too high in many cases, averaging almost double the observed rate of growth between 2001 and 2011.
Figure 13 Projected Population for OMATO, 2031
12,6
60
9,18
0
11,9
14
13,5
71
3,98
2
30,5
78
9,87
5
4,54
4 19,8
70
4,75
7
13,5
91
27,7
61
18,9
72
14,5
25
0
5,000
10,000
15,000
20,000
25,000
30,000
35,000
Alfr
ed &
Pla
ntag
enet
Arnp
rior
Beck
with
Carle
ton
Plac
e
Cass
elm
an
Clar
ence
-Roc
klan
d
McN
ab/B
raes
ide
Mer
rickv
ille-
Wol
ford
Miss
issip
pi M
ills
Mon
tagu
e
Nor
th D
unda
s
Nor
th G
renv
ille
Russ
ell
The
Nat
ion
Num
ber o
f Per
sons
Source: OMATO Official Plans

17Part I. Population Projections
In order to better reflect the recent growth trends in the OMATO municipalities, the projections for OMATO used in this report are based on the 2001-2011 rate of growth. The average five year rate of growth by municipality was modified to reflect a slowing rate of growth over the projection period. This was then was applied to the 2011 census population to derive future census year (2016, 2021, 2026, 2031 and 2036) municipal population totals. Because the projected rate of growth for Ottawa declines over the projection period, a declining rate of growth was also assumed for OMATO municipalities. The projected population figures for the OMATO municipalities are shown in Appendix 3.
Projections for the Greater Ottawa-Gatineau Area (GOGA) are shown in Figure 14. The region is projected to grow from 1.45 million in 2016 to almost 1.8 million by 2036, an addition of 350,000 people or a 24 percent increase.
Figure 14 Population Projections for the Greater Ottawa-Gatineau AreaArea 2011 2016 2021 2026 2031 2036Ottawa 912,248 969,066 1,028,481 1,090,970 1,153,535 1,213,553OMATO 140,246 146,374 155,041 164,180 173,602 183,498Gatineau 268,838 280,923 300,878 315,997 328,731 339,080QMAG 46,908 50,982 54,506 57,472 59,653 61,248Total 1,368,240 1,447,345 1,538,906 1,628,620 1,715,521 1,797,379
Increase 79,105 91,561 89,714 86,902 81,858% increase 5.8% 6.3% 5.8% 5.3% 4.8%
Relative shares of population over the period to 2036 are shown in Figure 15. Ottawa’s population share is projected to increase slightly, up 0.8% from 2011. OMATO is projected to decline slightly in share, while the City of Gatineau is projected to drop in share by 0.7%. Québec Municipalities Adjacent to Gatineau (QMAG) are projected to maintain their small share of the area.
Figure 15 Projected Distribution of Population, 2011 to 2036Area 2011 2016 2021 2026 2031 2036Ottawa 66.7% 67.0% 66.8% 67.0% 67.2% 67.5%OMATO 10.3% 10.1% 10.1% 10.1% 10.1% 10.2%Gatineau 19.6% 19.4% 19.6% 19.4% 19.2% 18.9%QMAG 3.4% 3.5% 3.5% 3.5% 3.5% 3.4%Total 100.0% 100.0% 100.0% 100.0% 100.0% 100.0%
Conclusion
By 2036, the Reference scenario projects a population of 1,213,553 for the City of Ottawa. This scenario was selected as the reference scenario because it incorporates the most reasonable set of assumptions when considering all of the information available. By 2036, Ottawa’s population will be older with more than 1 in 5 persons being aged 65 or older (compared to roughly 14% in 2011). There will be a slight decline in the population aged 0-14 but this is relatively small due to the effects of migration on the age structure of the population.

18Part II. Households and Housing
Part II. Households and Housing
Housing is the single largest consumer of urban land and consequently a vital component in determining future land requirements. Once the future population has been determined, the next step is to project the housing requirement of this population.
The methodology used to determine future housing demand follows standard best practices, and is similar to that used in 2007 and 2009:
1. Households are determined by applying a headship rate, the proportion of the population in each five-year age group that heads a household, to the projected population by age group.
2. Housing units by dwelling type are projected by applying the “propensity” for each household age group to choose a single-detached, semi-detached, row house or apartment. Rates for both household headship and housing propensities are based on census data.
3. A factor is added to allow for a vacancy rate in rental and ownership units and to replace demolished units.
Number of Households
Headship rates have been changing over time but are difficult to forecast accurately as changes revealed by census data are often inconsistent from census to census (Figure 16). Testing of projected headship rates resulted in relatively little change to the overall results while adding an extra degree of complexity7. Therefore, 2011 Census headship rates were applied to all future years. The same approach was used in the 2007 projections.
Figure 16 Headship Rates, 1981-2011, Ottawa
0.0
0.1
0.2
0.3
0.4
0.5
0.6
0.7
0.8
15-19 20-24 25-29 30-34 35-39 40-44 45-49 50-54 55-59 60-64 65-69 70-74 75+
1981 1986 1991 1996 2001 2006 2011
Source: Statistics Canada, Census of Canada custom tabulations
Before applying headship rates to population by age to determine the future number of households, an additional step is required to remove the population that does not live in private households from the projected population. Although that population is small, it has been growing and will continue to grow as
7 The 1995 projections prepared by the former Regional Municipality of Ottawa-Carleton used projected headship rates. Subsequent census data showed their accuracy to vary by age group with no overall increase in accuracy.

19Part II. Households and Housing
the size of the older adult population increases. The population not in private households has increased from 1.0% in 1996, to 1.67% in 2001, 1.83% in 2006 and 1.85% in 2011. For the projections, the 2011 rates by five-year age group were held constant. However, due to population aging, even unchanged rates by age group result in 3.0% of the population living in some form of collective dwelling by 2036.
The 2011 headship rates applied to the projected population in private households results in almost 506,000 households by 2036. This represents an increase of approximately 123,000 households or 32% during the 2014 to 2036 period. Adjustments for demolitions and vacancies are applied in later steps. Total households by age of the head of the household, for the reference scenario, can be found in Appendix 2.
Households By Dwelling Type
Housing Propensities
The proportion of each household age group occupying a given housing type is termed their “propensity” for that housing form. For example, according to the 2011 Census, 52 percent of households whose heads were aged 45 to 49 occupied single-detached units, 6 percent were in semi-detached, 21 percent chose row units and 20 percent lived in apartments.
Figure 17 shows housing propensities from the 2011 Census.
Figure 17 Housing Propensities, 2011, City of Ottawa
0.0
0.1
0.2
0.3
0.4
0.5
0.6
0.7
0.8
20-24 25-29 30-34 35-39 40-44 45-49 50-54 55-59 60-64 65-69 70-74 75 +
Shar
e of
Uni
t Typ
e by
Age
Gro
up
Single Semi Row Apartment
Source: Statistics Canada, 2011 Census custom tabulation
Before determining the future number of units by dwelling types, using housing propensities, it is necessary to look at factors that might impact housing choice in the future and how these will result in changes to historical propensities.
There are several factors to be considered in developing a projection of future housing choices by age group. They include:
- Trends over the past decade showing declining demand for single-detached housing- Census underreporting of population and the impact on housing propensities- Aging of the baby-boom and overall increases in older age groups- Declining household size

20Part II. Households and Housing
- Housing choices of the growing immigrant population- The popularity of the urban lifestyle- Household debt
As noted in the report “Residential Land Supply and Demand to 2031: 2012 Update”8, the housing market over the 2006-2012 period showed significant declines in the share of single-detached units and large increases in apartments. Since then, changes in the market have continued. As shown in Figure 18, in the five years 2011 to 2015 only 27% of new units in Ottawa have been single-detached, compared to a 42% apartment share.
Figure 18 Housing Starts plus Additions and Conversions, 2006-2016Single Semi Row Apt. Total
2006* 41.1% 6.1% 25.2% 27.6% 100.0%2007 41.4% 4.6% 30.1% 23.9% 100.0%2008 40.1% 3.1% 31.8% 25.0% 100.0%2009 39.2% 5.2% 33.6% 22.1% 100.0%2010 31.9% 5.5% 30.0% 32.7% 100.0%2011 34.2% 6.0% 32.3% 27.4% 100.0%2012 23.0% 4.5% 22.9% 49.6% 100.0%2013 22.7% 5.5% 23.9% 48.0% 100.0%2014 24.9% 4.2% 27.7% 43.2% 100.0%2015 30.7% 2.7% 23.6% 43.1% 100.0%2016* 37.5% 3.7% 37.0% 21.8% 100.0%Total 32.8% 4.6% 28.5% 34.1% 100.0%
2006-12 35.9% 4.8% 29.7% 29.6% 100.0%2011-15 26.9% 4.6% 26.0% 42.5% 100.0%2011-16* 27.5% 4.5% 26.7% 41.2% 100.0%
Source: CMHC housing starts plus additions and conversions from City of Ottawa building permits* Indicates last six months of 2006 and first six months of 2016.
Recent data have shown an even larger gap between the housing projection presented in the 2012 report and actual construction. The 2012 document foresaw a singles share over the 2006-2031 time period of 35.9%; since 2011 it has been 27.5%. The 2012 update projected a 31.2% apartment share; since 2011 it has been 41.2%.
Census data for housing propensities are available for each census back to 1981. While very useful, the census data have the limitation that they do not cover all of the population because, on average, between three and four percent of the population are not included in the census. In 2011, net underreporting amounted to almost 29,000 people, or 3.3 percent of Ottawa’s census population.
As noted on page 5 of the 2012 report, net underreporting in the 2011 Census was concentrated among adults aged approximately 18 to 40. Much of this group has relatively high propensities for apartments.
Comparing new occupied units added between 2006 and 2011 based on census data to estimated actual new units from housing starts and building permits shows a significant shortfall in apartment units and an overstatement in all other unit types (Figure 19a). Some of this difference is due to units that have been built but are vacant. However, the size of the difference, (1,159 fewer singles and semis, 1,274 fewer row units and 1,738 more apartments than the census), cannot be explained by lags in occupancy or changes in vacancy rates (as reported in CMHC vacancy surveys). Although it is not possible to be precise, this suggests that:
8 Report dated November 2012. Presented to Planning Committee, November 27, 2012; to Council December 19, 2012.

21Part II. Households and Housing
1. Census data may overstate the actual number of occupied single- and semi-detached units, and2. Undercount the number of apartment units
The end result would then be that the census overstates single-detached propensity and understates apartment propensity.
Figure 19a New Housing Units, 2006-2011, Comparing Census and Estimated ActualSingle Semi Row Apt. Total
2006 Census 139,730 17,950 61,520 101,900 321,1002011 Census 152,410 19,940 72,445 108,425 353,220
Increase 2006-2011:Census 12,680 1,990 10,925 6,525 32,120
Estimated actual 11,992 1,519 9,651 8,263 31,425Difference -688 -471 -1,274 1,738 -696
Figure 19b New Housing Units, 2006-2011, Comparing Census and Estimated Actual
0
2,000
4,000
6,000
8,000
10,000
12,000
14,000
Single Semi Row Apt.
Num
ber o
f Uni
ts
Census 2006-11
Actual 2006-11
Source: Statistics Canada, Census of Canada for 2006 and 2011, and CMHC housing starts plus additions and conversions from City of Ottawa building permits
As a further attempt to understand the gap between observed and census new housing units in the period of 2006-2011, 2011 Census population by age group and Statistics Canada’s final 2011 post censal population by age group were compared in order to derive an age profile of the population not enumerated in the census (Figure 1). It was then theoretically assumed that the entire non-enumerated population lived in apartments and that they had the same headship rate as the census population. This resulted in an increase in the number of new apartments from 2006-2011 but this increase still fell short of accounting for the gap between the observed new apartments and the number reported in the census, as shown in Figure 19b.
The above, indicating that census data overstate the propensity for single-detached and understate apartments, was one consideration in developing projections of future housing propensities.
The aging of the baby boom (those born from 1946 to 1965), and the overall aging of the population, will change the demand for single-detached units. As can be seen in Figure 17, the propensity for singles peaks at the 50-54 age group and then declines. The baby boom is currently aged 50 to 70; the youngest will have aged out of the peak single demand age group by 2021.

22Part II. Households and Housing
The overall aging of the population will change the demand for dwellings by type. In 2011 almost 13% of the population was aged 65+, this is projected to increase to approximately 21% by 2036 (see Figure 6). As we live longer, there will be increasing incidences of disability and mobility restrictions which will make moving to smaller, single floor accommodation a logical choice for an increasing number of seniors.
Housing in newer suburbs offers challenges to “aging in place”. Property maintenance can become an issue, transportation is more difficult and medical and other services are not as readily available as in more central locations. These considerations will result in some people making the decision to re-locate.
Smaller households do not require large houses and as the number of persons per unit continues to decline this will result in a decrease in the demand for single-detached units. In 2001, 58.8% of all Ottawa households were occupied by 1 or 2 persons, this share rose to 61.2% by 2011. While some of these smaller households will remain in their existing single-detached homes, some will downsize with the result being an increase in demand for non-single unit types.
Immigration will assume a growing share of Ottawa’s population. From 2001 to 2011, the immigrant share of Ottawa’s population rose from 21.8% to 23 % (from 2001 and 2011 census data). Immigrant households are more likely to rent and occupy apartments and as they take on a larger share of the population this will impact housing propensities.
As stated above, it is expected that seniors will move to more central locations where the services they need or want are more readily available. In addition to this attraction, people of all ages will also be attracted to these more central locations by the appeal of the “urban lifestyle”. This will result in an increased demand for apartments.
Household debt loads are at an all time high in Canada. In September 2016 Statistics Canada reported that household liabilities rose to 100.5% of GDP, the first time it had exceeded the size of its economy. The financial pressure resulting from this, along with increasing pressure on pensions, will lead some to sell their singles and buy or rent smaller, less-expensive units.
Taken as a whole, all of the above factors, from recent trends to social and economic considerations, suggest that the future demand for single-detached units will decline and will result in an increased demand for non-single units. While much of this will be off-set by an increased demand for apartments, it is expected that there will also be a greater demand for row units. Row units are seen as a more affordable option to first time home buyers. At the same time they provide more living space for young families than apartments. According to the 2011 Census, only about 10% of apartments in Ottawa have more than 2 bedrooms and this share has been declining over time as fewer large apartments are being built. Of the apartments built from 1991 to 2006 only 7% had more than 2 bedrooms; this fell to about 4.5% for apartments built from 2006-2011. In addition, row units are seen as a means to fulfill the space requirements of those downsizing while being more affordable than singe-detached units and offering a transition or option for those downsizing from their single –detached home but who are not quite ready to make the move to an apartment.
Housing Projections to 2036
Projected housing propensities were used to determine the number of households by dwelling type for the projection period. Headship rates were applied to the projected population by age to determine the number of households by age group; propensities were then used to determine the number of households by dwelling type by age group. The sum of these across all age groups then yielded the total housing demand for the projected population.
The following describes past (2001-2011) and projected housing propensities (2016-2036) by age group.

23Part II. Households and Housing
Figure 20 Past and Projected Propensity for Single-detached Units, 2001-2036
0%
10%
20%
30%
40%
50%
60%
20-24 25-29 30-34 35-39 40-44 45-49 50-54 55-59 60-64 65-69 70-74 75 +
2001 2006 2011 2016 2021 2026 2031 2036
Source: Statistics Canada, Census of Canada 2001, 2006, 2011 custom tabulations, and City projections
Census data for the 2001-2011 decade shows a general decline in the propensity for single-detached among many household age groups even without taking into account the possible over-reporting of singles propensity as shown in the previous section (Figure 20). Taking the above housing propensity factors into consideration, the propensity for single-detached units is projected to decline for all age groups over the projection period.
Figure 21 Past and Projected Propensity for Semi-detached Units, 2001-2036
0%
2%
4%
6%
8%
10%
20-24 25-29 30-34 35-39 40-44 45-49 50-54 55-59 60-64 65-69 70-74 75 +
2001 2006 2011 2016 2021 2026 2031 2036
Source: Statistics Canada, Census of Canada 2001, 2006, 2011 custom tabulations, and City projections
Semi-detached units represent a small fraction of the Ottawa housing market and this is not expected to change in the future. As such, semi-detached units are not expected to have a significant effect on overall housing demand. Generally, propensities for semis have been in decline since 2001 and are projected to continue losing share at a gradual rate (Figure 21).

24Part II. Households and Housing
Figure 22 Past and Projected Propensity for Row Units, 2001-2036
0%
5%
10%
15%
20%
25%
30%
35%
20-24 25-29 30-34 35-39 40-44 45-49 50-54 55-59 60-64 65-69 70-74 75 +2001 2006 2011 2016 2021 2026 2031 2036
Source: Statistics Canada, Census of Canada 2001, 2006, 2011 custom tabulations, and City projections
Propensities for row units have seen significant gains over the 2001-11 decade among several age groups. However, significant increases for households under 35 stopped after 2006 and dropped slightly for the 65-69 cohort. Row units are projected to continue gaining in share as a more affordable substitute to new single-detached housing but at a somewhat reduced rate of increase (Figure 22). This reflects the observed decline in the rate of increase in the second half of the 10 year period from 2001-2011 in many of the age groups.
Figure 23 Past and Projected Propensity for Apartment Units, 2001-2036
0%
10%
20%
30%
40%
50%
60%
70%
80%
20-24 25-29 30-34 35-39 40-44 45-49 50-54 55-59 60-64 65-69 70-74 75 +2001 2006 2011 2016 2021 2026 2031 2036
Source: Statistics Canada, Census of Canada 2001, 2006, 2011 custom tabulations, and City projections
Apartment propensities have been in decline for many years but census data and housing market activity since 2001 indicate that a degree of turnaround is occurring. The apartment share of new construction in Ottawa since 2011(see Figure 18) suggests a change in apartment propensity post-2011 Census that has not yet appeared in census results. In addition, as discussed above, the census under-states apartment propensity. The projections anticipate increases among younger adults, moderate or little increase for

25Part II. Households and Housing
middle-aged households to reflect the observed trend. Small declines in the apartment propensity among the population over 70 (Figure 23) are expected as seniors remain in the workforce longer and at increasing rates (discussed in Part III Employment), take advantage of services that allow them to remain in their current unit type and remain healthier as they age.
Figure 24 shows the overall effect of the above changes and assumptions. Projected declines in single-detached propensity are expected to be largely offset by higher propensities for row units. Apartment propensity increases among younger adults and declines slightly among the elderly.
Figure 24 Housing Propensities, 2011 Census and 2036 Projected
0%
10%
20%
30%
40%
50%
60%
70%
80%
20-24 25-29 30-34 35-39 40-44 45-49 50-54 55-59 60-64 65-69 70-74 75 +
Hous
ing
Prop
ensi
ty
2011 Single 2011 Semi 2011 Row 2011 Apartment
2036 Single 2036 Semi 2036 Row 2036 Apartment
Source: Statistics Canada, Census of Canada 2001, 2006, 2011 custom tabulations, and City projections
Demolitions and Vacancies
Housing demand was adjusted by allowing for the replacement of 300 demolished units annually based on the number of demolitions over the past five years (from City of Ottawa issued building permits). The projected split by unit type was 70 percent singles, 4 percent semis, 4 percent row units and 22 percent apartments and is consistent with past projections.
A further adjustment was made to allow for a vacancy rate in new units. Ownership units were assumed to have a 0.5 percent vacancy, the same assumption as was used in the 2007 projections. Rental units were assumed to have a 3.0 percent vacancy, again as was used in the 2007 projections. This figure represents what is often referred to as a balanced rental market.
Overall, demolition replacements and vacancy allowances are estimated to add 8,000 units to housing needs between 2014 and 2036 (Figure 25). Vacancies in row units appear low because the number of vacant rental units in 2014 exceeded the three percent target and therefore fewer vacant row units are needed in the future to reach the vacancy target.
26Part II. Households and Housing
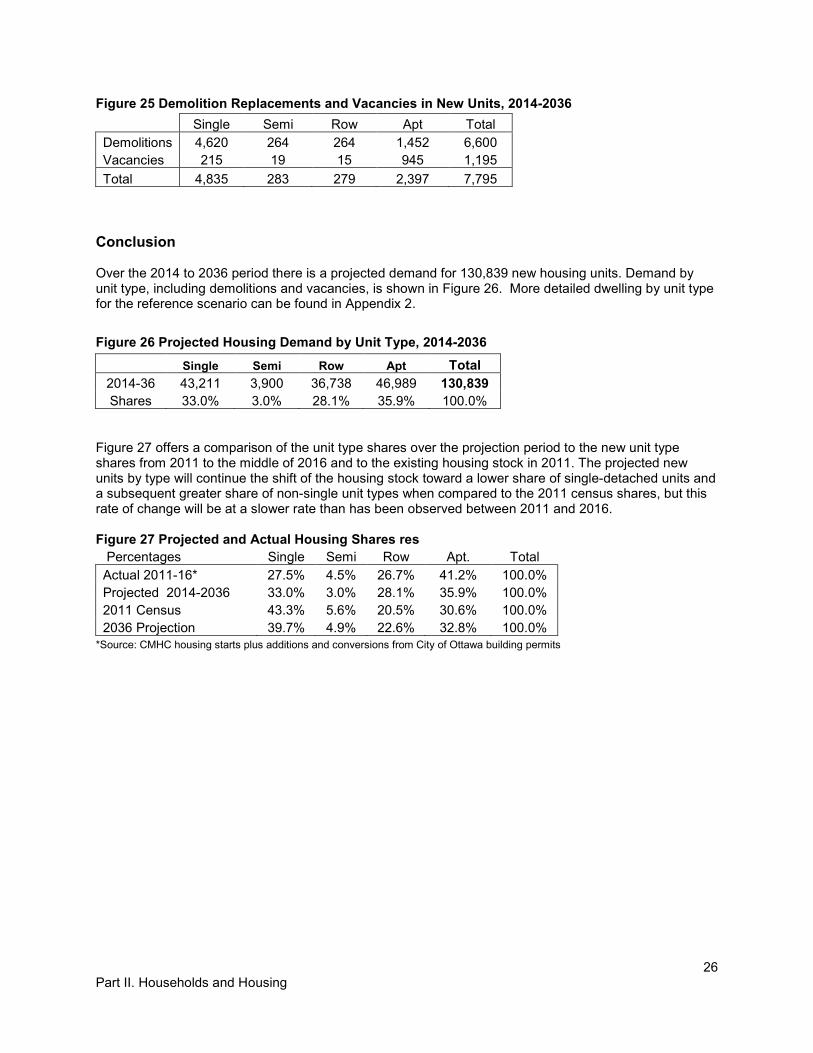
Figure 25 Demolition Replacements and Vacancies in New Units, 2014-2036Single Semi Row Apt Total
Demolitions 4,620 264 264 1,452 6,600Vacancies 215 19 15 945 1,195Total 4,835 283 279 2,397 7,795
Conclusion
Over the 2014 to 2036 period there is a projected demand for 130,839 new housing units. Demand by unit type, including demolitions and vacancies, is shown in Figure 26. More detailed dwelling by unit type for the reference scenario can be found in Appendix 2.
Figure 26 Projected Housing Demand by Unit Type, 2014-2036Single Semi Row Apt Total
2014-36 43,211 3,900 36,738 46,989 130,839Shares 33.0% 3.0% 28.1% 35.9% 100.0%
Figure 27 offers a comparison of the unit type shares over the projection period to the new unit type shares from 2011 to the middle of 2016 and to the existing housing stock in 2011. The projected new units by type will continue the shift of the housing stock toward a lower share of single-detached units and a subsequent greater share of non-single unit types when compared to the 2011 census shares, but this rate of change will be at a slower rate than has been observed between 2011 and 2016.
Figure 27 Projected and Actual Housing Shares resPercentages Single Semi Row Apt. TotalActual 2011-16* 27.5% 4.5% 26.7% 41.2% 100.0%Projected 2014-2036 33.0% 3.0% 28.1% 35.9% 100.0%2011 Census 43.3% 5.6% 20.5% 30.6% 100.0%2036 Projection 39.7% 4.9% 22.6% 32.8% 100.0%
*Source: CMHC housing starts plus additions and conversions from City of Ottawa building permits

27Part III. Employment
Part III. Employment
Employment projections are based on the projected population characteristics of Ottawa and the surrounding areas. The economic zone of Ottawa is the entire Ottawa-Gatineau Census Metropolitan Area (CMA) plus adjacent municipalities in Ontario that are not included in the CMA. Map 1 shows the Greater Ottawa-Gatineau area.
Labour force participation rates by age and sex were applied to the age-sex structure of the projected population to produce an estimate of the resident labour force. This number is adjusted by assumed unemployment rates to produce the number of employed residents. The number of net in-commuters from adjacent municipalities, the difference between the number of Ottawa residents who hold jobs outside of the City and the number of people who reside outside of Ottawa but hold jobs in Ottawa, is added to the projected resident labour force to project the total number of jobs located in Ottawa. A multiple job holder rate is applied to account for people holding more than one job.
Participation Rates
The labour force participation rate (LFPR) is the percentage of the population 15 and over that is in the labour force, either working or seeking work. Two primary factors influence the total LFPR; the health of the overall economy and the age/sex structure of the population. Higher economic growth attracts more people into the labour force, raising the rate. The effect of demographic change is more complex. Generally, rates among young adults are lower than for “working age” adults (25-54) due to school attendance and lack of experience. Rates among the older population 55 and over have historically also been lower due to retirements and health limitations.
Recently, however, there have been changes in these patterns. The LFPR has fallen among people under 25 over the past eight years (see Figure 28) and has increased significantly for women 60 to 74 and for men 65 to 75+.
Figure 28 Change in Labour Force Participation Rate, 2006-07 to 2014-15
-10
-5
0
5
10
15
Perc
enta
ge C
hang
e in
LFP
R
Both Male Female
Source: Statistics Canada, Labour Force Survey for Ottawa CMA, custom tabulation
Looking forward, the 2014-15 decline among young adults, attributed to the recent slowdown in the local economy, is not expected to last into the long term. The increase in rates among older adults, however, is expected to continue to grow due to longer and healthier life-spans, impending labour force shortages
28Part III. Employment
(see the discussion of the dependency ratio on Page 11 of this report) and pressure on pension systems, both stemming from projected large increases in the older adult population.
As a result, rates for 2016 were based on the average for 2006 to 2015 for age groups under 55 (men) and 60 (women) and on the average of the past four years (2012-15) for ages 55 and over (men) and 60 and over (women). This was done because the increase in older adult participation rates are more evident over the past four years and are expected to continue into the future.
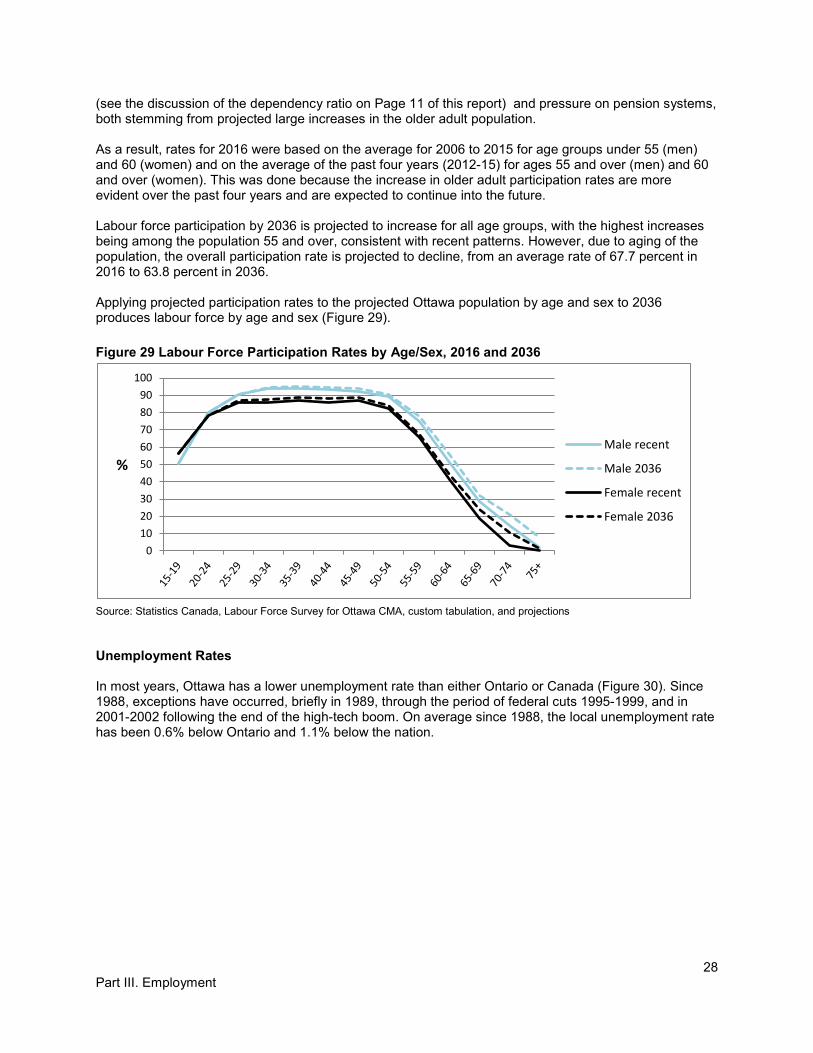
Labour force participation by 2036 is projected to increase for all age groups, with the highest increases being among the population 55 and over, consistent with recent patterns. However, due to aging of the population, the overall participation rate is projected to decline, from an average rate of 67.7 percent in 2016 to 63.8 percent in 2036.
Applying projected participation rates to the projected Ottawa population by age and sex to 2036 produces labour force by age and sex (Figure 29).
Figure 29 Labour Force Participation Rates by Age/Sex, 2016 and 2036
0102030405060708090
100
%Male recent
Male 2036
Female recent
Female 2036
Source: Statistics Canada, Labour Force Survey for Ottawa CMA, custom tabulation, and projections
Unemployment Rates
In most years, Ottawa has a lower unemployment rate than either Ontario or Canada (Figure 30). Since 1988, exceptions have occurred, briefly in 1989, through the period of federal cuts 1995-1999, and in 2001-2002 following the end of the high-tech boom. On average since 1988, the local unemployment rate has been 0.6% below Ontario and 1.1% below the nation.

29Part III. Employment
* Year-to-date April
Figure 30 Unemployment Rates, Ottawa, Ontario and Canada, 1988-2016
0%
2%
4%
6%
8%
10%
12%
Ottawa-Gatineau Ontario Canada
Source: Statistics Canada, Labour Force Survey
It is expected that unemployment rates will decline over time as the supply of labour becomes constrained by a significant portion of the population aging out of the workforce. For the projection, an unemployment rate of 6.7 percent for 2016 was used based on current data for the year. For 2021 and 2026 a rate of 6.0% and 5.5% was adopted, dropping to 5.0% for 2031 and 2036 based on an expected tightening of the labour supply. This produces an Ottawa projected employed labour force as shown in Figure 31.
Figure 31 Employed Labour Force Projections, Ottawa, 2016-20362016 2021 2026 2031 2036
Unemployment Rate 6.7% 6.0% 5.5% 5.0% 5.0%Employed Labour Force 514,787 539,938 564,331 591,204 618,915
Net In-Commuting
A feature of the Ottawa labour market is that the city attracts a large number of workers from surrounding municipalities. The largest net in-commuting is from Gatineau and adjacent Outaouais communities. Data from the 2011 National Household Survey shows that 18,100 Ottawa residents worked in Québec, while 57,200 Québec residents worked in Ottawa (Figure 32). The net inflow to Ottawa of 39,100 represents 7.4 percent of total jobs located in Ottawa9. Commuting from adjacent Ontario (OMATO) communities is also very significant, with 3,100 out-bound workers from Ottawa compared to 31,600 in-bound to the City. The net 28,500 in-commuters represent 5.4 percent of total Ottawa jobs. Minimal changes to the commuting relationships are expected to 2036.
Place of Work
Statistics Canada separates employed residents by their place of work. For the purpose of this report, Ottawa’s employed labour force includes all workers with usual place of work, no fixed place of work, and
9 Calculated before provision for multiple jobholders is made since there are no data on their location.

30Part III. Employment
those who work at home. It is assumed that the majority of workers with no fixed place of work (such as landscape contractors and salespersons) conduct most of their business within Ottawa and therefore they should be counted as part of the employed labour force. For net in-commuting calculation, only those with usual place of work are included.
Multiple Jobholders
To project the total number of jobs located in Ottawa, people with multiple jobs must be taken into account. This is calculated using a multiple jobholder rate. In 2015, the Ontario multiple job holder rate was 5.4 percent. This projection exercise adopts the Ontario rate as the 2016 baseline rate for Ottawa and is projected to increase to 5.8 percent by 2036 as part of the growing trend of decreasing full-time employment and increasing part-time and non-permanent employment in Ontario (Figure 32).
Figure 32 Commuters to Ottawa, 2011-2036Census Proj Proj Proj
2011 2021 2031 20361. Employed Labour Force, Ottawa10 463,625 539,938 591,204 618,9152. Out-commutes to Gatineau -17,700 -20,613 -22,452 -23,5043. In-commutes from Gatineau 49,380 57,503 62,632 65,5684. Out-commutes to OMATO -3,120 -3,634 -3,958 -4,1435. In-commutes from OMATO 31,575 36,772 40,052 41,9296. Out-commutes to QMAG -390 -454 -495 -5187. In-commutes from QMAG 7,770 9,071 9,880 10,343Total number of jobs in Ottawa 531,140 618,583 676,863 708,589Multiple Jobholders in Ottawa11 26,146 29,697 33,699 35,921Including Multiple Jobs 557,286 648,280 710,562 744,510
Source: 2011 National Household Survey, Labour Force Survey for multiple jobs, and projections
10 Ottawa’s employed labour force includes employed Ottawa residents that work from home and residents with no fixed workplace address.
11 Calculated as a percentage of Ottawa’s employed labour force, From Statistics Canada Cansim-282-0148
Conclusion
Employment opportunities remain a key indicator of a healthy community. From 2011 to 2036, the total number of jobs in Ottawa is expected to increase by 34 percent to 744,500, faster than the population growth rate of 32 percent. The unemployment rate for Ottawa is projected to remain below provincial and national averages and will decrease to a low of 5 percent by 2036. However, employment growth will continue to be constrained by the aging population and the number of people reaching retirement. Even with an increase in participation rates by the older adult population, the overall labour force participation rate is expected to decrease from 68 percent in 2016 to 64 percent in 2036, due to the aging of the population and the increased proportion of seniors in the labour force.

31Part IV. Demand for and Supply of Urban Residential land to 2036
Part IV. Demand for and Supply of Urban Residential Land to 2036
The number of households was determined by applying the age-specific headship and dwelling unit type propensities to the projected population by age. After accounting for demolition replacements and vacant units, the result was the projected housing demand for the period from 2014 to 2036 for the City of Ottawa. These unit totals are shown in Figure 33.
Figure 33 Projected City-Wide Housing Demand by Unit Type, 2014-2036Single Semi Row Apt Total
2014-36 43,211 3,900 36,738 46,989 130,839Shares 33.0% 3.0% 28.1% 35.9% 100.0%
The next step is to assess the demand for urban residential land and compare this to the supply of urban residential land. Before this can be done, growth in rural areas and units added through intensification must be removed from future demand so that the supply can be measured against the units that will be built on greenfields.
Rural Demand
Growth in rural units was maintained at a nine percent share of total units for the projection period, consistent with historical trends. Projected unit types were revised to indicate a larger share of row and apartment units recognizing recent development trends and the assumption that older residents looking to age-in-place will lead to higher row and apartment starts in villages (Figure 34).
Figure 34 New Rural Units by Unit Type, City of Ottawa, 2006-2015Single Semi Row Apt Total
2006 95% 1% 4% 0% 100%2007 97% 2% 1% 0% 100%2008 90% 2% 9% 0% 100%2009 95% 3% 2% 0% 100%2010 99% 0% 1% 0% 100%2011 74% 1% 25% 0% 100%2012 86% 3% 0% 11% 100%2013 97% 3% 0% 0% 100%2014 90% 10% 0% 0% 100%2015 96% 1% 3% 0% 100%
2006-2015 92% 2% 5% 1% 100%2011-2015 86% 3% 8% 2% 100%
Source: CMHC Housing Starts, 2006-2015
Rural Supply
In Section 2.2.1 of the Ottawa OP, policy 9 requires that sufficient residential land is provided within village boundaries to provide for a 10-year supply. Appendix 7 provides the details of the analysis that was undertaken to ensure that this requirement was met when examining the rural residential demand and supply to 2036.

32Part IV. Demand for and Supply of Urban Residential land to 2036
Urban Demand
After removing rural potential, urban units total 119,063 over the projection period. The detailed urban units by dwelling type are shown in Figure 35.
Figure 35 Projected Urban and Rural Housing Demand by Unit Type, 2014-2036Single Semi Row Apt Total
Total Units 43,211 3,900 36,738 46,989 130,839Minus Rural Units 9,844 82 1,260 589 11,775
Urban Units 33,367 3,817 35,478 46,401 119,063
Intensification Target
Intensification targets in Section 2.2.2 policy 3 of the OP extend only to 2031. A rate for 2031 to 2036 was developed by adding to the 44 percent target for 2027-2031 the same two percent rate of increase as in previous five-year periods. That produced a 2031-2036 target of 46 percent. Over the entire 2014 to 2036 period, the intensification target averages 42.4 percent. This number is considered conservative when compared to the recent intensification figures observed in the City. From 2011 to 2015, the average rate of intensification was 51.3 percent of total urban units (Figure 36).
Figure 36 Percentage of Urban Intensification, City of Ottawa, 2006-2015
0.0%10.0%20.0%30.0%40.0%50.0%60.0%70.0%
2006
2007
2008
2009
2010
2011
2012
2013
2014
2015
Source: City of Ottawa, Building Permits
Between 2006 and 2015, apartment units as a total share of intensification units increased from 65.8 percent to 85.4 percent, with a five-year average of 82.3 percent between 2011 and 2015 (Figure 37). Similar to city-wide housing propensity, there is a shifting preference from single and semi-detached units to row units. The changing unit composition can be observed in several large scale redevelopment projects such as the Former Canadian Forces Base Rockcliffe redevelopment and the Oblates redevelopment project.

33Part IV. Demand for and Supply of Urban Residential land to 2036
Figure 37 Intensification Units by Unit Type, City of Ottawa, 2006-2015
Single Semi Row Apt Total2006 12.9% 6.1% 15.2% 65.8% 100.0%2007 7.9% 3.8% 14.9% 73.4% 100.0%2008 7.4% 3.4% 17.0% 72.1% 100.0%2009 9.1% 5.3% 23.7% 61.9% 100.0%2010 5.5% 3.1% 9.5% 82.0% 100.0%2011 6.3% 3.1% 10.7% 80.0% 100.0%2012 3.1% 4.4% 7.6% 84.8% 100.0%2013 6.9% 6.0% 7.3% 79.8% 100.0%2014 4.9% 2.7% 10.6% 81.7% 100.0%2015 7.4% 2.5% 4.7% 85.4% 100.0%
2006-2015 6.7% 3.8% 11.3% 78.1% 100.0%2011-2015 5.6% 3.6% 8.4% 82.3% 100.0%Source: City of Ottawa, Building Permits
Shares by unit type were revised to show a higher proportion of apartments for the 2014-36 period than previous projections up to 2031 given that higher shares of apartments can be expected in the future as opportunities for lower density units decline. Figure 38 shows the intensification units, based on the 42.4% share of new units and the dwelling unit shares by type (also shown in Figure 38).
Figure 38 Intensification 2014-2036, Unit Type Shares and Total Units by TypeSingle Semi Row Apt Total
Share 5.5% 3.0% 10.5% 81% 100%Units 2,774 1,513 5,296 40,856 50,440
Greenfield Demand
Removing intensification units from total urban units produces a demand for 68,624 units on greenfield suburban land over the projection period. Figure 39 shows this greenfield demand by unit type.
Figure 39 Greenfield Demand 2014-2036, Units by TypeSingle Semi Row Apt Total
Urban Units 33,367 3,817 35,478 46,401 119,063Minus Intensification Units 2,774 1,513 5,296 40,856 50,440
Greenfield Units 30,593 2,304 30,182 5,545 68,624
Greenfield Supply
Since 1982, the Vacant Urban Residential Land Survey (VURLS) has monitored the supply of vacant residential land in Ottawa’s suburban areas. Development potential on the vacant residential parcels is determined based on their development status or status in approved planning documents. From the most specific to the most general, these documents and approvals include site plan, plan of subdivision and condominium, the zoning by-law, Community Design Plans (CDP’s), and the Ottawa Official Plan. The VURLS 2015 update includes all amendments approved by Council up to December 2015, which includes lands within the urban boundary and urban expansion areas from Official Plan Amendment 76 but excludes proposed Employment Land conversion areas as recommended in the Employment Land

34Part IV. Demand for and Supply of Urban Residential land to 2036
Review. Any recommended Employment Land conversions for residential purposes will be added to the residential supply in a future step.
To determine the unit by type for each individual parcel, different methods are used depending upon the current status of the parcel. For VURLS parcels currently under a planning approval process (e.g. subdivision, site plan), the proposed unit by type is assigned. For vacant parcels not yet in the approval process but within the geographic area of a CDP, unit by type is calculated using CDP guidelines. For those parcels not currently in the planning approval process a development density is assigned based on observed 5-year housing start densities for the relevant suburban area (e.g. South Nepean, Orleans)12
and on the observed unit split of current applications within CDP areas city-wide.
In order to assess greenfield housing supply against projected demand, the 2014 mid-year residential greenfield supply needs to be established. The 2015 VURLS report was used as the starting point to determine 2014 mid-year supply. This was done because the 2015 survey provides more accurate data with updated development information. A series of adjustments were made to the 2015 survey to improve data quality and to address the timing issue:
1. In order to improve accuracy, additional updates were performed on lands with new development applications or recent revisions to known plans (updated to July 2016).
2. To align with the demand projection’s starting point of mid-2014, housing starts between mid-2014 to end of 2015 outside the Greenbelt were added back to the supply.
3. Furthermore, units under construction in the suburban areas at the end of 2015 were included in the supply because these units had already been removed in the survey as starts, but had yet to be occupied.
These revisions provide the total supply of vacant Greenfield residential land at mid-year 2014. The mid-2014 supply is 85,100 units comprised of 30,700 singles, 2,200 semis, 31,300 rows, and 20,900 apartments (Figure 40).
Figure 40 Vacant Greenfield Supply, Mid-Year 2014
Area Single Semi Row Apt. TotalKanata-Stittsville 10,797 798 11,289 4,084 26,968South Nepean 3,187 212 3,248 8,651 15,298Riverside South 6,162 0 5,579 3,077 14,818Leitrim 1,921 72 2,019 635 4,648Orleans 5,651 940 5,989 3,896 16,477Supply (year-end 2015) 27,718 2,023 28,124 20,343 78,208+ Housing Starts(mid-2014 to year-end 2015) 1,924 98 1,994 266 4,282+ Under Construction 1,057 56 1,166 336 2,615Greenfield Supply (mid-2014) 30,699 2,176 31,284 20,945 85,104
Source: City of Ottawa Vacant Urban Residential Land Survey 2015 Update, CMHC Starts and Completions Survey
Supply and Demand Analysis
The comparison of greenfield demand and supply is summarized in Step 10 of Figure 41. At mid-2036 there is projected to be a nominal surplus of 106 single-detached, a deficit of 128 semi-detached, a surplus of 1,100 rowhomes, and a surplus of 15,400 apartments. Although there is a total surplus of 16,480 units, the Provincial Policy Statement (PPS) requires that capacity be assessed by individual housing types to provide an appropriate range and mix of housing. The deficit in semi-detached units and
12 As reported in the Vacant Urban Residential Land Survey, 2015 Update, Table 8

35Part IV. Demand for and Supply of Urban Residential land to 2036
a marginal surplus in single-detached units points to a potential shortfall to 2036. Because single and semi-detached units are often grouped together as low-density development under CDP’s and proposed concept plans, columns are included in Figure 41 to review them separately and then combined.
Figure 41 Urban Land Requirements Analysis, 2014-2036
Step Single Semi
Single +
Semi13 Row Apt. Total1 New dwellings required, 2014-2036 43,211 3,900 47,111 36,738 46,989 130,8392 % split by unit type 33.0% 3.0% 36.0% 28.1% 35.9% 100.0%3 Rural dwellings (9% of total) 9,844 82 9,927 1,260 589 11,7754 Rural split 83.6% 0.7% 84.3% 10.7% 5.0% 100.0%5 Urban dwellings (1 minus 3) 33,367 3,817 37,184 35,478 46,401 119,0636 Intensification (42.4%) 2,774 1,513 4,287 5,296 40,856 50,4407 Intensification split 5.5% 3.0% 8.5% 10.5% 81.0% 100.0%8 Greenfield Demand (5 minus 6) 30,593 2,304 32,897 30,182 5,545 68,6249 Greenfield Supply 30,699 2,176 32,875 31,284 20,945 85,104
10 Greenfield Supply minus Demand 106 -128 -22 1,102 15,400 16,480
13 Single-detached and semi-detached units are often classified together as low density development in various concept plans. As a result, a separate column is produced to review their combined supply and demand.
The City is currently undertaking the Building Better and Smarter Suburbs (BBSS) initiative, which seeks to improve land efficiency, liveability, and cost effectiveness in new suburban communities. This includes a review of existing design standards for roads, stormwater management, school sites and parks. Once completed, the BBSS recommendations will likely result in a series of land efficiencies leading to a higher net-to-gross ratio on the City’s vacant residential lands. A higher net-to-gross ratio means that more lands within a subdivision will become available for residential development, in turn increasing the total greenfield housing supply. However, because this project has not been finalised, the calculations for greenfield supply in Figure 41, Step 9 above, did not incorporate assumptions based on BBSS.
Conclusion
In conclusion, a very small potential shortfall of land for single and semi-detached dwellings is anticipated by 2036 when taking into account the projected housing demand of the 2036 population as compared to the existing designated urban supply and the planned supply in the remaining identified Urban Expansion Study Areas. The PPS requires the designation of enough land to accommodate projected needs for up to 20 years and to utilize intensification and redevelopment opportunities to accommodate the projected needs.
Concurrent with this projections update is a review of employment lands with the potential for conversion of some vacant employment lands to alternative uses. Consistent with the PPS these conversions will increase the residential land supply that will then have the potential to provide a sufficient supply of housing for at least the next 20 years.
An addendum report will assess the additional supply from potential employment land conversions and the overall ability to accommodate the 2036 household projections based on the existing urban supply, the planned Urban Expansion Study Areas supply and the recommended employment land conversion supply for residential uses.

Bibliography 36
Bibliography
Statistics Canada, Population Projections for Canada (2013 to 2063), Provinces and Territories (2013 to 2038), Catalogue no. 91-520, May 26, 2015
Statistics Canada, Population Projections for Canada (2013 to 2063), Provinces and Territories (2013 to 2038): Technical Report on Methodology and Assumptions, Catalogue no. 91-620, May 26, 2015
Statistics Canada, Methods for Constructing Life Tables for Canada, Provinces and Territories, Demography Division, Catalogue no. 84-538, 2012
Statistics Canada, Life Tables, Canada, Provinces and Territories, 2009 to 2011, Demography Division, Catalogue no. 84-537, 2013
Ontario Ministry of Finance, Ontario Population Projections Update, Spring 2016, June 2016, and previous annual editions of the same report
City of Ottawa, History of Population Projections, Planning Branch, February 2009
City of Ottawa, Growth Projections for Ottawa: Prospects for Population, Housing and Jobs 2006-2031, Planning Branch, November 2007
City of Ottawa, Residential Land Strategy for Ottawa 2006-2031, Planning Branch, February 2009
Institut de la Statistique du Québec, Perspectives démographiques des MRC du Québec, 2011-2036, Gouvernement du Québec, 2014
City of Ottawa, Vacant Urban Residential Land Survey, 2015 Update, Planning and Growth Management, April 2016
City of Ottawa, Rural Residential Land Survey, 2013-2014 Update, Planning and Growth Management, June 2015
City of Ottawa, Employment Land Review, Final Report, Hemson Consulting, Urban Strategies Inc and Stantec Consulting, 2016

Appendix List 37
Appendix List
1. Ottawa Population Detail for Low, Reference and High Scenario
2. Household and Employment Detail for the Reference Scenario
3. OMATO Population Detail
4. Population by Age and Sex in Collective Dwellings
5. Dwelling Units by Type by Area for the Reference Scenario
6. Population Details for the Low, Reference and High Scenario
7. Village Residential Supply

Appendix 1 – Scenario Summaries 38
Appendix 1 – Scenario Summaries Scenario 1 - Low
City of Ottawa 2014 2016 2021 2026 2031 2036 Change 2014-2036
Population (mid-year) 946,344 961,634 998,269 1,031,050 1,057,305 1,076,621 130,277Average annual increase 7,645 7,327 6,556 5,251 3,863 5,922Average annual percentage change 0.8% 0.8% 0.7% 0.5% 0.4% 0.6%
Population by Age Group0-4 50,305 50,750 52,317 51,693 48,585 46,109 -4,1965-9 50,709 51,698 52,104 53,669 53,072 49,985 -72410-14 50,053 50,647 53,385 53,830 55,427 54,854 4,80115-19 58,194 55,021 54,053 56,605 57,093 58,723 52920-24 74,080 69,371 60,294 58,725 61,319 61,842 -12,23825-34 139,869 147,008 151,870 138,095 127,682 128,852 -11,01735-44 129,004 129,045 135,909 151,806 156,852 143,265 14,26145-54 141,984 138,873 128,751 128,413 135,465 151,341 9,35755-64 117,405 124,733 136,902 131,407 122,218 122,348 4,94365+ 134,741 144,490 172,684 206,807 239,592 259,302 124,561
0-19 22.1% 21.6% 21.2% 20.9% 20.3% 19.5% 0.2%20-34 22.6% 22.5% 21.3% 19.1% 17.9% 17.7% -10.9%35-54 28.6% 27.9% 26.5% 27.2% 27.6% 27.4% 8.7%55-64 12.4% 13.0% 13.7% 12.7% 11.6% 11.4% 4.2%65+ 14.2% 15.0% 17.3% 20.1% 22.7% 24.1% 92.4%

Appendix 1 – Scenario Summaries 39
Appendix 1 – Scenario Summaries Scenario 2 - Reference
City of Ottawa 2014 2016 2021 2026 2031 2036 Change 2014-2036
Population (mid-year) 946,344 969,066 1,028,481 1,090,970 1,153,535 1,213,553 267,209Average annual increase 11,361 11,883 12,498 12,513 12,004 12,146Average annual percentage change 1.2% 1.2% 1.2% 1.1% 1.0% 1.3%
Population by Age Group0-4 50,305 50,660 55,173 60,023 62,150 62,421 12,1165-9 50,709 52,018 52,533 57,115 62,067 64,295 13,58610-14 50,053 51,002 54,650 55,282 59,982 65,050 14,99715-19 58,194 55,864 55,807 59,343 60,103 64,926 6,73220-24 74,080 73,701 69,563 68,988 72,657 73,552 -52825-34 139,869 148,149 163,285 163,858 159,756 163,410 23,54135-44 129,004 130,996 141,932 160,353 176,025 177,126 48,12245-54 141,984 138,146 128,736 132,705 143,846 162,266 20,28255-64 117,405 123,589 132,467 124,590 116,043 120,220 2,81565+ 134,741 144,942 174,334 208,713 240,906 260,286 125,545
0-19 22.1% 21.6% 21.2% 21.2% 21.2% 21.2% 22.7%20-34 22.6% 22.9% 22.6% 21.3% 20.1% 19.5% 10.8%35-54 28.6% 27.8% 26.3% 26.9% 27.7% 28.0% 25.2%55-64 12.4% 12.8% 12.9% 11.4% 10.1% 9.9% 2.4%65+ 14.2% 15.0% 17.0% 19.1% 20.9% 21.4% 93.2%

Appendix 1 – Scenario Summaries 40
Appendix 1 – Scenario Summaries Scenario 3 - High
City of Ottawa 2014 2016 2021 2026 2031 2036 Change 2014-2036
Population (mid-year) 946,344 973,179 1,045,837 1,127,195 1,214,771 1,305,224 358,880Average annual increase 13,418 14,532 16,272 17,515 18,091 16,313Average annual percentage change 1.4% 1.5% 1.6% 1.6% 1.5% 1.7%
Population by Age Group0-4 50,305 50,822 58,056 67,384 73,368 75,341 25,0365-9 50,709 52,258 53,220 60,581 70,084 76,254 25,54510-14 50,053 51,275 55,601 56,743 64,302 74,013 23,96015-19 58,194 56,284 56,916 61,190 62,538 70,308 12,11420-24 74,080 75,269 73,118 73,298 77,790 79,371 5,29125-34 139,869 149,098 169,045 175,373 174,377 180,048 40,17935-44 129,004 131,955 145,150 165,860 186,702 193,981 64,97745-54 141,984 137,942 129,100 135,188 148,674 169,500 27,51655-64 117,405 123,072 130,428 121,616 113,614 119,869 2,46465+ 134,741 145,205 175,202 209,963 243,322 266,538 131,797
0-19 22.1% 21.6% 21.4% 21.8% 22.3% 22.7% 41.4%20-34 22.6% 23.1% 23.2% 22.1% 20.8% 19.9% 21.3%35-54 28.6% 27.7% 26.2% 26.7% 27.6% 27.8% 34.1%55-64 12.4% 12.6% 12.5% 10.8% 9.4% 9.2% 2.1%65+ 14.2% 14.9% 16.8% 18.6% 20.0% 20.4% 97.8%

Appendix 2 – Household, Dwelling and Employment Details 41
Appendix 2 – Household, Dwelling and Employment Details, Reference Scenario
City of Ottawa 2014 2016 2021 2026 2031 2036 Change 2014-2036
Households (Total) 382,912 395,014 424,538 453,172 480,306 505,957 123,045Households by Age Group of Head< 25 years 16,887 16,749 15,887 15,858 16,640 16,949 6225-34 years 64,306 68,019 75,296 75,930 73,890 75,400 11,09435-44 years 69,557 70,616 76,488 86,395 94,886 95,533 25,97645-54 years 82,412 80,191 74,663 76,940 83,377 94,036 11,62455-64 years 70,072 73,763 79,062 74,361 69,259 71,753 1,68165+ years 79,679 85,677 103,143 123,689 142,254 152,286 72,607Average Persons per Household 2.47 2.45 2.42 2.41 2.4 2.4
Dwellings (Total) 383,125 396,138 427,400 457,758 486,607 513,964 130,839Average annual new housing units 6,507 6,252 6,072 5,770 5,471 5,947Single Detached 160,863 164,766 174,686 185,335 195,341 204,074 43,211Semi Detached 21,216 21,687 22,781 23,693 24,463 25,116 3,900Row 79,670 82,890 91,585 100,040 108,205 116,408 36,738Apartment 121,375 126,794 138,348 148,690 158,598 168,365 46,990
Labour Force & EmploymentPopulation 15+ 795,277 815,386 866,124 918,550 969,336 1,021,786 226,509Participation Rate 67.7% 67.7% 66.3% 65.0% 64.2% 63.8% ----Labour Force 538,124 551,754 574,402 597,175 622,320 651,489 113,365Unemployment Rate 6.6% 6.7% 6.0% 5.5% 5.0% 5.0% ----Unemployed Persons 35,516 36,968 34,464 32,845 31,116 32,574 -2,942Employment 502,608 514,787 539,938 564,331 591,204 618,915 116,3075-Year Absolute Change 12,179 25,151 24,393 26,873 27,711 ----Total Employed by Place of Work* 589,769 618,583 646,529 676,863 708,589 ----Multiple Jobholder Rate 5.4% 5.4% 5.5% 5.6% 5.7% 5.8% ----Multiple Jobholder 27,141 27,798 29,697 31,603 33,699 35,921 8,780*Projected in-commuting numbers for 2016 and forward (no 2014)

Appendix 3 – Population Projections for OMATO Municipalities 42
Appendix 3 – Population Projections for OMATO Municipalities
County/Municipality
2006*
*Census
2011*
*Census 2016 2021 2026 2031 2036
% Growth 2011-2036
Renfrew CountyArnprior, Town 7,158 8,114 8,497 9,032 9,589 10,155 10,740 32.4McNab/Braeside, Township 7,222 7,371 7,580 7,868 8,160 8,450 8,743 18.6
14,380 15,485 16,077 16,900 17,749 18,605 19,483 25.8Lanark CountyMississippi Mills, Town 11,734 12,385 12,674 13,069 13,467 13,860 14,254 15.1Carleton Place, Town 9,453 9,809 10,097 10,494 10,898 11,299 11,705 19.3Beckwith Township 6,387 6,986 7,386 7,950 8,545 9,156 9,796 40.2Montague, Township 3,595 3,483 3,417 3,331 3,249 3,173 3,100 -11.0
31,169 32,663 33,574 34,844 36,159 37,488 38,855 19.0Leeds & Grenville United CountiesMerrickville-Wolford, Village 2,867 2,850 2,938 3,059 3,182 3,304 3,428 20.3North Grenville, Township 14,198 15,085 15,700 16,555 17,436 18,325 19,237 27.5
17,065 17,935 18,638 19,614 20,618 21,629 22,665 26.4Stormont, Dundas & Glengarry United CountiesNorth Dundas, Township 11,095 11,225 11,304 11,411 11,516 11,617 11,717 4.4Prescott and Russell United CountiesRussell, Townshop 13,883 15,247 16,528 18,385 20,404 22,549 24,865 63.1Casselman, Village 3,294 3,642 3,979 4,471 5,012 5,592 6,225 70.9The Nation Municipality 10,643 11,668 12,101 12,701 13,317 13,935 14,567 24.8Alfred & Plantagenet, Township 8,654 9,196 9,433 9,759 10,088 10,414 10,743 16.8Clarence-Rockland, City 20,790 23,185 24,739 26,956 29,317 31,775 34,378 48.3
57,264 62,938 66,780 72,272 78,138 84,265 90,778 44.2OMATO TOTAL 130,973 140,246 146,373 155,041 164,180 173,604 183,498 30.8SummaryRenfrew County 14,380 15,485 16,077 16,900 17,749 18,605 19,483 25.8Lanark County 31,169 32,663 33,574 34,844 36,159 37,488 38,855 19.0Leeds & Grenville United Counties 17,065 17,935 18,638 19,614 20,618 21,629 22,665 26.4Stormont, Dundas & Glengarry United Counties 11,095 11,225 11,304 11,411 11,516 11,617 11,717 4.4Prescott and Russell United Counties 57,264 62,938 66,780 72,272 78,138 84,265 90,778 44.2
130,973 140,246 146,373 155,041 164,180 173,604 183,498 30.8ShareRenfrew County 11.0% 11.0% 11.0% 10.9% 10.8% 10.7% 10.6%Lanark County 23.8% 23.3% 22.9% 22.5% 22.0% 21.6% 21.2%Leeds & Grenville United Counties 13.0% 12.8% 12.7% 12.7% 12.6% 12.5% 12.4%Stormont, Dundas & Glengarry United Counties 8.5% 8.0% 7.7% 7.4% 7.0% 6.7% 6.4%Prescott and Russell United Counties 43.7% 44.9% 45.6% 46.6% 47.6% 48.5% 49.5%

Appendix 4 – Population Collectives 43
Appendix 4 – Population in Collectives
2001 2006 2011Age Group Male Female Total Male Female Total Male Female Total0-4 40 35 75 25 45 70 60 55 1155-9 35 30 65 35 35 70 40 45 8510-14 80 70 150 75 40 115 80 45 12515-19 260 150 410 170 120 290 280 280 56020-24 285 175 460 250 120 370 255 190 44525-29 330 160 490 230 135 365 220 110 33030-34 395 130 525 375 155 530 230 120 35035-39 455 140 595 385 145 530 290 115 40540-44 510 170 680 465 135 600 405 125 53045-49 460 150 610 465 165 630 460 160 62050-54 345 190 535 430 210 640 510 205 71555-59 230 150 380 420 200 620 465 190 65560-64 185 170 355 290 240 530 345 255 60065-69 170 235 405 210 265 475 255 265 52070-74 265 425 690 245 480 725 275 410 68575-79 355 830 1,185 380 950 1,330 410 755 1,16580-84 470 1,385 1,855 620 1,620 2,240 620 1,655 2,27585-89 400 1,485 1,885 595 1,925 2,520 825 2,290 3,11590+ 270 1,310 1,580 390 1,815 2,205 630 2,360 2,990Total 5,540 7,390 12,930 6,055 8,800 14,855 6,655 9,630 16,285Source: Statistics Canada 2001-2011 Census

Appendix 5 – Dwelling Types by Area 44
Appendix 5 – Dwelling Types by Area - Reference Scenario
Single Semi Row Apt Total2014-2016 Urban Units 2,924 462 3,095 5,361 11,842
Intensification 247 135 472 3,645 4,500Greenfield 2,676 327 2,622 1,716 7,341
Rural Units 979 8 125 59 1,171Total Units 3,903 471 3,220 5,419 13,012
2016-2021 Urban Units 7,568 1,075 8,394 11,416 28,448Intensification 625 341 1,194 9,208 11,368
Greenfield 6,942 734 7,200 2,208 17,084Rural Units 2,352 20 301 141 2,814Total Units 9,920 1,095 8,695 11,556 31,266
2021-2026 Urban Units 8,365 893 8,161 10,206 27,626Intensification 638 348 1,217 9,390 11,592
Greenfield 7,727 545 6,944 816 16,033Rural Units 2,284 19 292 137 2,732Total Units 10,649 912 8,454 10,342 30,357
2026-2031 Urban Units 7,835 752 7,887 9,778 26,252Intensification 635 346 1,212 9,348 11,541
Greenfield 7,200 406 6,675 430 14,712Rural Units 2,171 18 278 130 2,596Total Units 10,005 771 8,165 9,908 28,849
2031-2036 Urban Units 6,675 636 7,940 9,644 24,894Intensification 629 343 1,201 9,266 11,440
Greenfield 6,046 293 6,739 378 13,455Rural Units 2,058 17 263 123 2,462Total Units 8,734 653 8,203 9,767 27,357
2014-2036 Total
Urban Units 33,367 3,817 35,478 46,401 119,063Intensification 2,774 1,513 5,296 40,856 50,440
Greenfield 30,593 2,304 30,182 5,545 68,624Rural Units 9,844 82 1,260 589 11,775Total Units 43,211 3,900 36,738 46,989 130,839
*Numbers may not add due to rounding

Appendix 6 – Components of Growth – Low Scenario 45
Appendix 6 – Components of Population Growth - Low Scenario
Year* Start Births Deaths Natural Increase
Net Migration
End
2015 946,344 10,177 6,503 3,674 4,041 954,0212016 954,021 10,251 6,617 3,634 4,015 961,6342017 961,634 10,311 6,733 3,578 3,989 969,1652018 969,165 10,365 6,845 3,520 3,963 976,6132019 976,613 10,391 6,955 3,436 3,937 983,9502020 983,950 10,410 7,068 3,342 3,910 991,1692021 991,169 10,429 7,179 3,250 3,883 998,2692022 998,269 10,409 7,294 3,115 3,855 1,005,2072023 1,005,207 10,377 7,419 2,958 3,870 1,012,0022024 1,012,002 10,300 7,546 2,754 3,884 1,018,6082025 1,018,608 10,176 7,674 2,502 3,898 1,024,9762026 1,024,976 10,008 7,813 2,195 3,911 1,031,0502027 1,031,050 9,825 7,960 1,865 3,924 1,036,8082028 1,036,808 9,729 8,116 1,613 3,936 1,042,3252029 1,042,325 9,644 8,280 1,364 3,948 1,047,6052030 1,047,605 9,536 8,453 1,083 3,959 1,052,6162031 1,052,616 9,387 8,635 752 3,970 1,057,3052032 1,057,305 9,261 8,824 437 3,979 1,061,6912033 1,061,691 9,161 9,019 142 3,989 1,065,7902034 1,065,790 9,106 9,220 -114 3,997 1,069,6422035 1,069,642 9,067 9,426 -359 4,005 1,073,2572036 1,073,257 9,017 9,635 -618 4,013 1,076,621* Population figures are mid-year
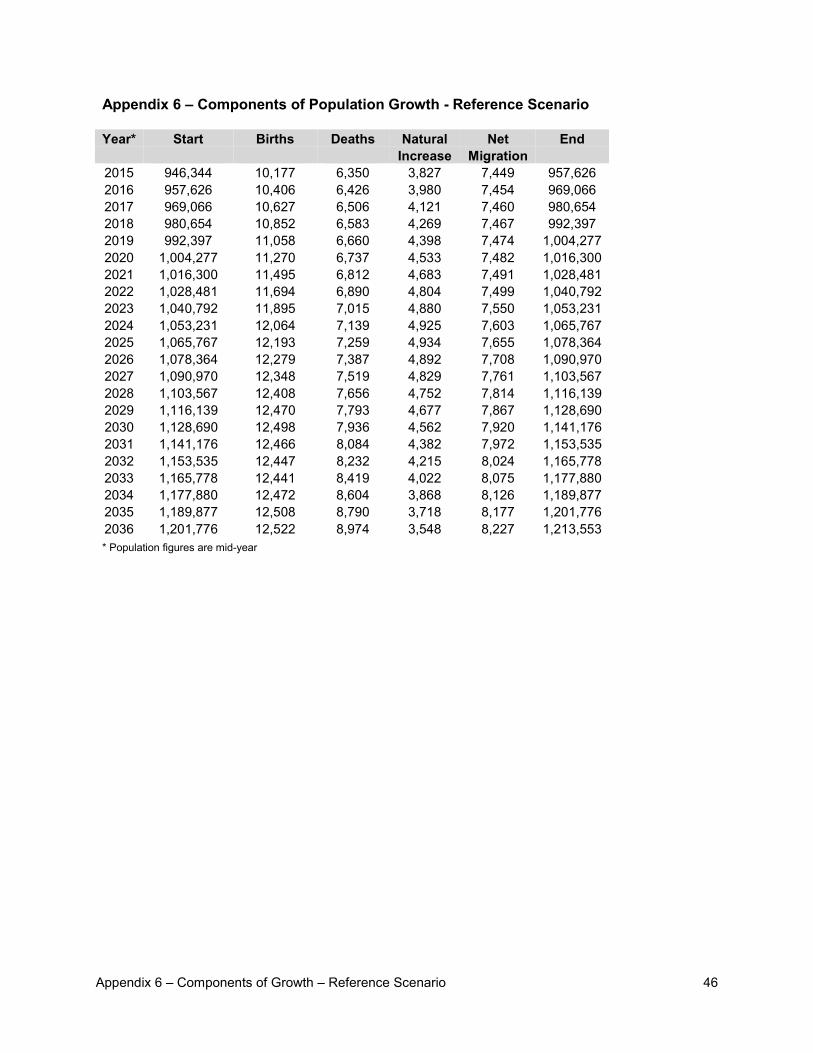
Appendix 6 – Components of Growth – Reference Scenario 46
Appendix 6 – Components of Population Growth - Reference Scenario
Year* Start Births Deaths Natural Increase
Net Migration
End
2015 946,344 10,177 6,350 3,827 7,449 957,6262016 957,626 10,406 6,426 3,980 7,454 969,0662017 969,066 10,627 6,506 4,121 7,460 980,6542018 980,654 10,852 6,583 4,269 7,467 992,3972019 992,397 11,058 6,660 4,398 7,474 1,004,2772020 1,004,277 11,270 6,737 4,533 7,482 1,016,3002021 1,016,300 11,495 6,812 4,683 7,491 1,028,4812022 1,028,481 11,694 6,890 4,804 7,499 1,040,7922023 1,040,792 11,895 7,015 4,880 7,550 1,053,2312024 1,053,231 12,064 7,139 4,925 7,603 1,065,7672025 1,065,767 12,193 7,259 4,934 7,655 1,078,3642026 1,078,364 12,279 7,387 4,892 7,708 1,090,9702027 1,090,970 12,348 7,519 4,829 7,761 1,103,5672028 1,103,567 12,408 7,656 4,752 7,814 1,116,1392029 1,116,139 12,470 7,793 4,677 7,867 1,128,6902030 1,128,690 12,498 7,936 4,562 7,920 1,141,1762031 1,141,176 12,466 8,084 4,382 7,972 1,153,5352032 1,153,535 12,447 8,232 4,215 8,024 1,165,7782033 1,165,778 12,441 8,419 4,022 8,075 1,177,8802034 1,177,880 12,472 8,604 3,868 8,126 1,189,8772035 1,189,877 12,508 8,790 3,718 8,177 1,201,7762036 1,201,776 12,522 8,974 3,548 8,227 1,213,553* Population figures are mid-year

Appendix 6 – Components of Growth – High Scenario 47
Appendix 6 – Components of Population Growth - High Scenario
Year* Start Births Deaths Natural Increase
Net Migration
End
2015 946,344 10,177 6,329 3,848 9,403 959,6062016 959,606 10,535 6,406 4,129 9,433 973,1792017 973,179 10,894 6,489 4,405 9,464 987,0592018 987,059 11,265 6,569 4,696 9,497 1,001,2632019 1,001,263 11,624 6,647 4,977 9,532 1,015,7812020 1,015,781 11,998 6,727 5,271 9,568 1,030,6302021 1,030,630 12,393 6,802 5,591 9,606 1,045,8372022 1,045,837 12,772 6,879 5,893 9,646 1,061,3842023 1,061,384 13,163 6,967 6,196 9,730 1,077,3182024 1,077,318 13,528 7,050 6,478 9,816 1,093,6192025 1,093,619 13,856 7,125 6,731 9,904 1,110,2602026 1,110,260 14,142 7,205 6,937 9,993 1,127,1952027 1,127,195 14,411 7,283 7,128 10,085 1,144,4122028 1,144,412 14,562 7,362 7,200 10,178 1,161,7942029 1,161,794 14,711 7,433 7,278 10,272 1,179,3462030 1,179,346 14,817 7,504 7,313 10,367 1,197,0272031 1,197,027 14,853 7,571 7,282 10,462 1,214,7712032 1,214,771 14,897 7,630 7,267 10,558 1,232,5952033 1,232,595 14,951 7,678 7,273 10,654 1,250,5212034 1,250,521 15,040 7,713 7,327 10,751 1,268,5972035 1,268,597 15,131 7,736 7,395 10,848 1,286,8372036 1,286,837 15,193 7,749 7,444 10,947 1,305,224
* Population figures are mid-year

Appendix 7 – Village Residential Supply 48
Appendix 7 – Village Residential Supply
Rural residential supply in the villages was determined based on the City’s most current Rural Residential Land Survey (2013-14). The data from this report were modified to account for units in villages with private servicing that might develop on 0.4 hectare lots. Factors that might affect a villages’ ability to accommodate development, such as servicing and development history, were then examined to determine if the full potential of the units anticipated in each village could be accommodated. Based on this analysis, the total unit potential for specific villages was adjusted and a revised village potential was determined. The current supply of residential potential in the villages is 6,860 units, most of which can be found in the larger villages of Manotick, Greely, Richmond and Carp.
To determine residential demand in villages to 2036, a 55% share or rural demand was assumed. This figure is based on the observed village share from 2010-2015 from CMHC housing starts. This share was 16% higher than the 39% average share in villages prior to the 2009 moratorium on country lot subdivisions.
The overall demand for rural units is projected to be 11,775 by 2036. With 55% of the rural share villages are expected to accommodate 6,476 units. Figure 1 compares the demand and supply to 2036. Over the 2014-2036 projection period, this is an average of 294 units per year. At this rate of consumption, the villages would have sufficient residential supply for 23.3 years. This supply exceeds the Official Plan target minimum of at least a 10-year supply of land for residential development in the villages.
Figure 1 Village Demand and Supply, 2014-2036
6,200
6,300
6,400
6,500
6,600
6,700
6,800
6,900
Village Units
Village Demand
Village supply
Source: City of Ottawa Rural Residential Land Survey, 2013-14 Update