growth performance of fruits production in the era of
TRANSCRIPT

Indian Journal of Economics and Development, March 2019, Vol 7 (3) ISSN (online): 2320-9836 ISSN (Print): 2320-9828
Growth performance of fruits production in the era of globalisation in West Bengal: a comparative study
Saddam Hossain Mondal*, Arup Kumar Chattopadhyay**
*Research Scholar, ** Professor of Economics Department of Economics, University of Burdwan, Burdwan, West Bengal, India- 713104
[email protected], [email protected]
Abstract
Objectives: Fruits production plays a significant role for improvement of economic wellbeing in the country. We have examined growth and instability of selected fruit crops and crop-groups namely, mango, banana, papaya, guava, litchi, other fruit groups, all fruits combined, total foodgrains, total non-food grains and all crops combined in West Bengal vis-a-vis India and also in Burdwan, a district of West Bengal during 2000-01 to 2014-15. Methods: Here unconditional and conditional annual compound growth rates have been measured by fitting appropriate trend equations when the underlying series are found to be respectively stationary and non-stationary. Instability of those selected crops has been measured by using Cuddy-Della Valle index. The secondary data on area, production and productivity are collected from different issues of Statistical Abstract of West Bengal, Statistical abstract of India, Horticultural Handbook of India and RBI Handbook. Findings: The production growth rates of crop-groups are found to be significantly positive in West Bengal and India. But in case of all fruits combined, Burdwan experienced significantly positive growth in its production. The production growth rate of papaya is significantly positive in Burdwan, West Bengal and also in India. The production growth rates of mango and litchi are significantly found to be positive in the country as well as in the state. Application: The production instability of crop-groups except non-food grains is low compared to the individual fruit crops in our study areas. No positive relationship between growth and instability is found here in fruits farming. Keywords: Conditional Growth, Unconditional Growth, ADF Test of Unit Root, Instability, Cuddy-Della Valle Index.
1. Introduction
Fruits aremost important nutritious foods as source of vitamins like, vitamin-A, vitamin-B1, vitamin-B2, vitamin-B6, vitamin-C and folic acid, carbohydrates and proteins. In Pre-liberalisation period horticulture did not played any important role in West Bengal. After liberalisation the area of fruit crops increases because the Government of India took some policies namely: National Horticultural Mission, New National Agricultural Policy, Kissan Call Centre, Seed Bank, Farm Credit Package and Agricultural Product Market for improving agriculture sector in general and horticulture in particular. Further in recent times, the productivities of the traditional crops remain low or stagnant but the productivities of horticultural crops keep on increasing steadily those results into change in cropping pattern in favour of fruits farming [1].
Three fourth of total fruits in India is producing only in its 10 states namely, Andhra Pradesh (13%), Maharashtra (11%), Uttar Pradesh (11%), Gujarat (9%), Karnataka (8%), Tamil Nadu (7%), Madhya Pradesh (6%), Bihar (5%), West Bengal (4%) and Telangana (4%) during 2014-15 ( Horticultural Statistics at a Glance 2015). India is the second largest fruits producing country in the world. 17.4% of world population lived in India and a larger part of its farming community is engaged in horticultural farming. The country also exports large amount of fruits and earns nearly 41053.76 lakh amounts of foreign currency (i.e., US $) in 2013-14. The share of horticultural farming is more than 33% of total agricultural share in GDP of India (Ministry of Agriculture, GOI).

Indian Journal of Economics and Development, March 2019, Vol 7 (3) ISSN (online): 2320-9836 ISSN (Print): 2320-9828
West Bengal is the 9th fruits producing state in the country. The State supplies nearly 4% share of the country’s total fruits production during 2014-15. Many types of fruits are produced in this State, which are Mango, Banana, Papaya, Guava, Litchi etc. Mango is the main fruit of the State. The area of fruits cultivation is 228.25 thousand hectors out of total Gross cropped area of 9689.92 thousand hectors and net cropped area of 5238.39 thousand hectors in West Bengal in 2014-15. Total production of fruits is 3313.70 thousand tonnes in the State in 2014-15. Again in the district of Burdwan in West Bengal (which is our study area) irrigation facility is well developed, because there are so many rivers and canals passing through this district. Further, so many other types of irrigation facility like, deep tube well, shallow well etc. are also available here. It is to be noted here that Burdwan is traditionally known as rice bowl of the State; so the present state of fruits cultivation is an interesting area for study here.
We want to find out the production trends and variability in major fruit crops in Burdwan vis-à-vis West Bengal and India when the country is a developing labour surplus economy. Unemployment is the main problem of this country due to population pressures, lack of establishment of new industries and fixed amount of crop land. Fruits farming are a labour intensive cultivation. Further, the growth rate of fruit crops holds acceleration hypothesis in recent time in India when deceleration hypothesis operates here for traditional crops. If fruits farming increases in India and West Bengal, it helps reduce the main problem i.e., unemployment, hunger, food insecurity and deficit in the balance of payment in the country as well as the respective state.
2. Literature survey
Notable Scholars like [2-11], measured growth and variability of different types of crop in India. From these studies we have seen that the production growth rates of different types of foodgrains like wheat and rice increased after the Green Revolution period (i.e., after mid 1960s). But with the application of modern technology of seed-fertilizer-irrigation no significant effect has been observed in regard to increased production growth rates of other types of cash crops as well as horticultural crops during post 1965-66. In recent times the production growth rates of traditional crops began to decrease over time. But after the liberalization period, possibly due to market expansion and removal of barriers and restrictions farmers produce more and more horticultural crops resulting to acceleration in growth process in horticultural farming during the recent time period. However, we do not observe any earlier study that measured growth and variability in fruit crops in the region like Burdwan or West Bengal in this country. This research study is devoted to capture that literature gap.
3. Data base and Methodology
The study depends on time series secondary data during the period 2000-01 to 2014-15. The data are collected on area, production and productivity for major fruit crops namely, Mango, Banana, Papaya, Guava and Litchi, Other fruits and Total combined fruits in India, West Bengal and Burdwan from different issues of Statistical Hand Book, BAES, and Horticultural Hand Book of India. The index forms of data on area, production and productivity of Food grains, Non-Foodgrains and All Crops Combined are collected from different issues of Statistical Abstract in West Bengal and RBI Handbook.
Augmented Dicky-Fuller unit root test has been used for measurement of stationarity in agricultural time series data using the following equation: ∆𝑌𝑡 = 𝛼 + 𝛽𝑌𝑡−1 + 𝛾𝑡 + ∑ Q ∆Yt−jj +∈t……….(I)j=1 is taken as our
study period is short and as in most cases AIC (Akaike’s Information Criterion) is fulfilled for one period time lag. Further, as objective is to measure trend growth, here we have included trend component t along with intercept term in ADF test expression (1). Here the coefficient of 𝑌𝑡−1 represents the presence or absence of stationarity. More specifically, if 𝛽 is found to be insignificant, it implies the presence of unit root; otherwise, the series would be stationary. Results of ADF test is not reported here separately because the stationarity (non-stationarity) of the series can be identified from its measured unconditional (conditional) growth rate. More specifically using ADF test if any series is found to be stationary we have applied the conventional trend analysis (fitting exponential trend: ln Yt = α + βt + ϵt) to measure growth rate. But in the presence of unit root in the data series one should not apply the usual trend equation analysis by OLS method for measuring growth rate.
Indian Journal of Economics and Development, March 2019, Vol 7 (3) ISSN (online): 2320-9836 ISSN (Print): 2320-9828
In that situation, we have estimated the conditional growth rate using the following equation 𝑙𝑛𝑌𝑡 = 𝛼 +𝛽𝑙𝑛𝑌𝑡−1 + 𝛾𝑡 + 𝜀𝑡………….(II)
Where, 𝛾represents the conditional growth. More specifically, here the conditional growth rate is 𝛾 × 100. The instability has been measured by using Cuddy-Della Valle index.
CDI = CV√1 − 𝑅2 where, CV is the coefficient of variation and 𝑅2 is the coefficient of determination obtained from the estimation of the relevant trend equation.
4. Results and Discussion
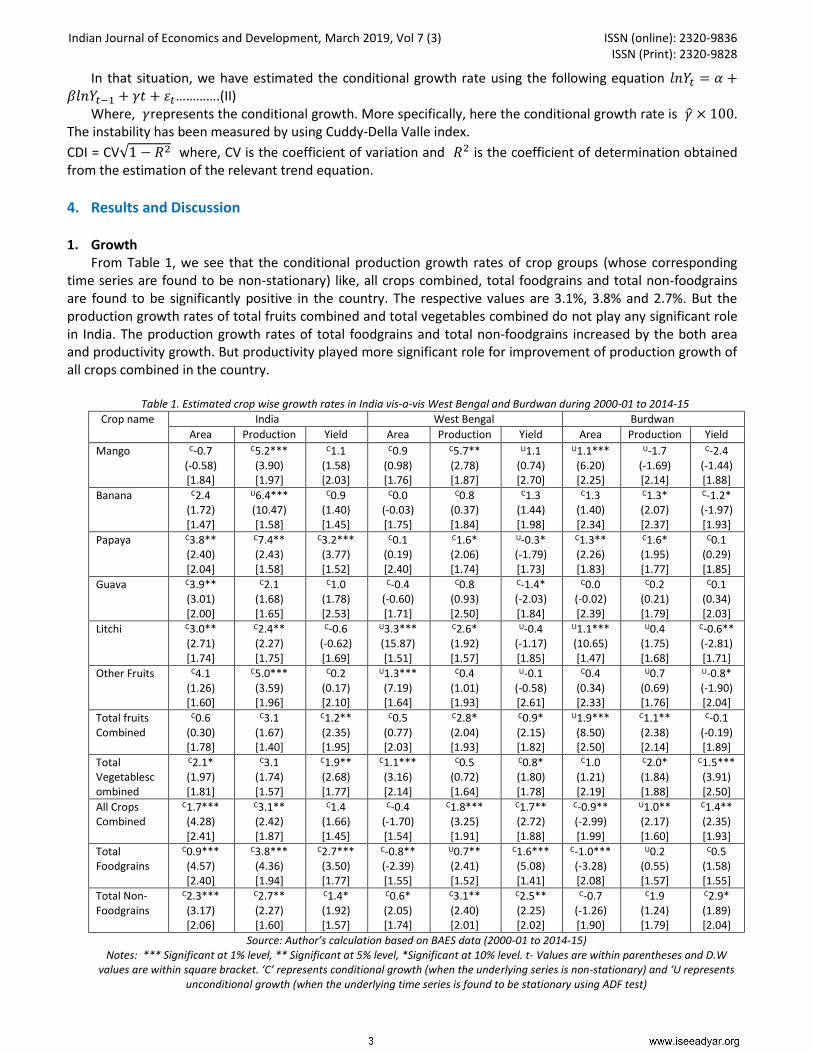
1. Growth From Table 1, we see that the conditional production growth rates of crop groups (whose corresponding
time series are found to be non-stationary) like, all crops combined, total foodgrains and total non-foodgrains are found to be significantly positive in the country. The respective values are 3.1%, 3.8% and 2.7%. But the production growth rates of total fruits combined and total vegetables combined do not play any significant role in India. The production growth rates of total foodgrains and total non-foodgrains increased by the both area and productivity growth. But productivity played more significant role for improvement of production growth of all crops combined in the country.
Table 1. Estimated crop wise growth rates in India vis-a-vis West Bengal and Burdwan during 2000-01 to 2014-15
Crop name India West Bengal Burdwan
Area Production Yield Area Production Yield Area Production Yield
Mango C-0.7
(-0.58) [1.84]
C5.2*** (3.90) [1.97]
C1.1 (1.58) [2.03]
C0.9 (0.98) [1.76]
C5.7** (2.78) [1.87]
U1.1 (0.74) [2.70]
U1.1*** (6.20) [2.25]
U-1.7 (-1.69) [2.14]
C-2.4 (-1.44) [1.88]
Banana C2.4 (1.72) [1.47]
U6.4*** (10.47) [1.58]
C0.9 (1.40) [1.45]
C0.0 (-0.03) [1.75]
C0.8 (0.37) [1.84]
C1.3 (1.44) [1.98]
C1.3 (1.40) [2.34]
C1.3* (2.07) [2.37]
C-1.2* (-1.97) [1.93]
Papaya C3.8** (2.40) [2.04]
C7.4** (2.43) [1.58]
C3.2*** (3.77) [1.52]
C0.1 (0.19) [2.40]
C1.6* (2.06) [1.74]
U-0.3* (-1.79) [1.73]
C1.3** (2.26) [1.83]
C1.6* (1.95) [1.77]
C0.1 (0.29) [1.85]
Guava C3.9** (3.01) [2.00]
C2.1 (1.68) [1.65]
C1.0 (1.78) [2.53]
C-0.4 (-0.60) [1.71]
C0.8 (0.93) [2.50]
C-1.4* (-2.03) [1.84]
C0.0 (-0.02) [2.39]
C0.2 (0.21) [1.79]
C0.1 (0.34) [2.03]
Litchi C3.0** (2.71) [1.74]
C2.4** (2.27) [1.75]
C-0.6 (-0.62) [1.69]
U3.3*** (15.87) [1.51]
C2.6* (1.92) [1.57]
U-0.4 (-1.17) [1.85]
U1.1*** (10.65) [1.47]
U0.4 (1.75) [1.68]
C-0.6** (-2.81) [1.71]
Other Fruits C4.1 (1.26) [1.60]
C5.0*** (3.59) [1.96]
C0.2 (0.17) [2.10]
U1.3*** (7.19) [1.64]
C0.4 (1.01) [1.93]
U-0.1 (-0.58) [2.61]
C0.4 (0.34) [2.33]
U0.7 (0.69) [1.76]
U-0.8* (-1.90) [2.04]
Total fruits Combined
C0.6 (0.30) [1.78]
C3.1 (1.67) [1.40]
C1.2** (2.35) [1.95]
C0.5 (0.77) [2.03]
C2.8* (2.04) [1.93]
C0.9* (2.15) [1.82]
U1.9*** (8.50) [2.50]
C1.1** (2.38) [2.14]
C-0.1 (-0.19) [1.89]
Total Vegetablescombined
C2.1* (1.97) [1.81]
C3.1 (1.74) [1.57]
C1.9** (2.68) [1.77]
C1.1*** (3.16) [2.14]
C0.5 (0.72) [1.64]
C0.8* (1.80) [1.78]
C1.0 (1.21) [2.19]
C2.0* (1.84) [1.88]
C1.5*** (3.91) [2.50]
All Crops Combined
C1.7*** (4.28) [2.41]
C3.1** (2.42) [1.87]
C1.4 (1.66) [1.45]
C-0.4 (-1.70) [1.54]
C1.8*** (3.25) [1.91]
C1.7** (2.72) [1.88]
C-0.9** (-2.99) [1.99]
U1.0** (2.17) [1.60]
C1.4** (2.35) [1.93]
Total Foodgrains
C0.9*** (4.57) [2.40]
C3.8*** (4.36) [1.94]
C2.7*** (3.50) [1.77]
C-0.8** (-2.39) [1.55]
U0.7** (2.41) [1.52]
C1.6*** (5.08) [1.41]
C-1.0*** (-3.28) [2.08]
U0.2 (0.55) [1.57]
C0.5 (1.58) [1.55]
Total Non-Foodgrains
C2.3*** (3.17) [2.06]
C2.7** (2.27) [1.60]
C1.4* (1.92) [1.57]
C0.6* (2.05) [1.74]
C3.1** (2.40) [2.01]
C2.5** (2.25) [2.02]
C-0.7 (-1.26) [1.90]
C1.9 (1.24) [1.79]
C2.9* (1.89) [2.04]
Source: Author’s calculation based on BAES data (2000-01 to 2014-15) Notes: *** Significant at 1% level, ** Significant at 5% level, *Significant at 10% level. t- Values are within parentheses and D.W
values are within square bracket. ‘C’ represents conditional growth (when the underlying series is non-stationary) and ‘U represents unconditional growth (when the underlying time series is found to be stationary using ADF test)

Indian Journal of Economics and Development, March 2019, Vol 7 (3) ISSN (online): 2320-9836 ISSN (Print): 2320-9828
The conditional production growth rates of all crops combined (1.8%), total non-foodgrains (3.1%) and total fruits combined (2.8%) are found to be significantly positive in West Bengal. In case of total foodgrains whose time series is found to be stationary, the unconditional production growth in the State is significantly positive (0.7%). The production growth rates of all crops combined, total foodgrains and total fruits combined increase due to mainly their productivity growth. But the production growth rate of total non-foodgrains is contributed by the both area and productivity growth in the State.
In case of Burdwan, the production growth rates of total fruits combined (1.1%) and total vegetables combined (2.0%) are found to be significantly positive but the growth rates of two other crop groups like, total foodgrains and total non-foodgrains remain insignificant. The unconditional production growth rate of all crops combined is significantly positive with value 1.0%. The production growth rates of total vegetables combined and all crops combined increase due to mainly productivity growth. The production growth rate of total fruits combined contributed mainly by the acreage growth in the district.
We get clear picture by extending this analysis crop wise. In case of India, we observe from Table 1 that the conditional growth rate in papaya production is significantly high at 5% level of significance with 7.4% growth, followed by mango with 5.2%, ‘other fruits’ with 5.0% and litchi with 2.4% in the country over the study period. The time series on banana production being stationary generates unconditional growth of 6.4% in the country. The production growth rate took place mainly due to area growth for litchi but we have seen that both area and productivity played significant role for the production growth of papaya. In the country we do not get any clear picture of area and /or productivity growth for production growth of a few fruits like, mango, banana and ‘other fruits’. The relative contributions of area and productivity are found to be mostly positive but all insignificant for these fruits in the country.
In case of West Bengal, we see (Table 1) that the conditional production growth rates of three types of fruit namely, mango, papaya and litchi are significantly positive with values 5.7%, 1.6% and 2.6% respectively over the study period. Further, the conditional production growth rates of some other fruits, like banana, guava and ‘other fruits’ in West Bengal are found to be positive but insignificant. The conditional growth rates in production of litchi take place due to area growth. In the state we do not get any clear picture of area and /or productivity growth for production growth of mango and papaya.
In case of Burdwan, the conditional production growth rate of papaya is found to be significantly positive with 1.6% followed by the growth rate of banana with 1.3%. The conditional production growth rates are found to be positive but insignificant for guava but the unconditional production growth rates are found to be insignificant for two other crops namely, litchi and ‘other fruits’ of the district. The production growth rates of papaya took place due to area growth in the district.
2. Instability Production instability has been measured by using Cuddy-Della Valle (CDV) index. We have divided the
production instability into three classes namely, low instability, medium sized instability and high instability. 1. When CDV index takes the value from 1 to 8, it is recognized as low instability. 2. For medium sized instability the value of this index is taken from 8 to 15. 3. High instability is identified when CDV index takes the value from 15 to 22.
From Table 2, we see that the production instability of crop-groups like, all crops combined (6.20), total foodgrains (5.43), total non-foodgrains (6.92), total fruits combined (3.46) and total vegetables combined (4.25) are found to belong to the category of low values in the country.
The production instability of total vegetables combined is very low with CDV index value 1.29 followed by all crops combined (4.59), total foodgrains (4.69) and total fruits combined (6.60) but the production instability of total non-foodgrains (11.20) is found to be of medium size in the State. The production volatility of only total non-foodgrains is found to belong in the category of high values with CDV index value 18.47 but for all other crop groups like, all crops combined (7.13), total foodgrains (6.88), total fruits combined (4.14) and total vegetables combined (6.51) the production instability is found to be low in the district.

Indian Journal of Economics and Development, March 2019, Vol 7 (3) ISSN (online): 2320-9836 ISSN (Print): 2320-9828
Table 2. Estimated crop wise instability in India vis-a-vis West Bengal and Burdwan during 2000-01 to 2014-15
Crop name India West Bengal Burdwan
Area Production Yield Area Production Yield Area Production Yield
Mango 5.12 6.06 9.75 2.56 19.84 20.19 3.70 15.23 19.69
Banana 5.21 8.75 5.84 4.28 8.36 6.89 5.42 5.08 6.06
Papaya 9.20 15.98 7.20 2.46 3.26 4.88 5.49 6.40 3.29
Guava 4.98 7.64 6.02 2.14 2.62 3.31 5.04 3.44 5.92
Litchi 3.40 9.62 13.44 4.02 9.88 5.92 4.27 12.71 2.51
Other Fruits 18.88 9.44 15.92 3.67 4.25 2.51 15.42 17.81 7.34
Total fruitsCombined 6.85 3.46 5.76 1.78 6.60 4.70 4.61 4.14 4.16
Total Vegetablescombined 2.79 4.25 2.35 0.92 1.29 1.27 8.08 6.51 2.74
All Crops Combined 2.19 6.20 4.71 2.76 4.59 4.06 3.70 7.13 5.70
TotalFoodgrains 1.75 5.43 4.34 3.25 4.69 1.73 3.66 6.88 3.71
Total Non-Foodgrains 3.56 6.92 6.50 2.44 11.20 11.15 7.25 18.47 17.13
Source: Author’s calculation based on BAES data (2000-01 to 2014-15) Note: Values are estimated crop wise using CDV index
In regard to individual crops, the production instability of papaya is highest in the country with CDV index
value 15.98. The production instability of mango (6.06) belongs to the category of low values followed by guava (7.64). Three other crops namely, banana (8.75), litchi (9.62) and ‘other fruits’ (9.44) are within the medium class of instability in the country. In case of West Bengal we see that the production instability of mango is very high (19.84). The production instability of two other crops namely, banana (8.36) and litchi (9.88) are found to belong in medium class, while the production volatility of guava is very low with CDV index value 2.62 preceded by papaya (3.26) and‘other fruits’ (4.25).In case of Burdwan, other fruits played more volatile role in production with CDV index value 17.81 followed by mango (15.23). The production instability of a few other crops namely, banana (5.08), papaya (6.40) and guava (3.44) are found to be in low class, while the production instability of litchi (12.71) is found to be of medium size in the district. Further, from Table 3 we see that out of 33 numbers of cases 13 cases represent that there is an inverse relationship between growth and instability, while only 2 other cases show a positive relation. Rest 18 cases represent that there is no relationship between growth and instability in fruits production. From this scenario we may come to the conclusion that the growth and instability are either negatively related to each other or they are independent for fruit crops production.
5. Conclusion
The production growth rates of crop-groups like, all crops combined, total foodgrains and total non-foodgrains have been significantly positive in India and West Bengal, while only all crops combined played a significant role in the district. The production growth rate of all fruits combined has been significantly positive both in Burdwan and West Bengal. The production growth rates of crop-groups occur due to both area and productivity growth in the country, while productivity played a vital role for improvement of production growth rate in Burdwan and West Bengal.
Table 3. Association between growth and instability in agricultural production in India vis-a-vis West Bengal and Burdwan during 2000-01 to 2014-15
Low Instability Medium Instability High Instability
Significantly positive growth
India: [Mango, Total Foodgrains, Total Non-Foodgrains, All Crops Combined]West Bengal: [Papaya, All Crops Combined, Total Foodgrains, Total Fruits Combined] Burdwan: [Total Fruits Combined, Papaya, Banana, Total Vegetables Combined, All Crops Combined] Total Number of cases: 13
India: [Banana, Litchi, ‘Other Fruit’]West Bengal: [Litchi, Total Non-Foodgrains ] Total number of cases: 5
India: [Papaya] West Bengal: [Mango]Total number of cases: 2
Insignificant growth
India: [Total Fruits Combined, Total Vegetables Combined] West Bengal: [Guava, ‘Other Fruits’, Total Vegetables Combined] Burdwan: [Guava, Total Foodgrains] Total number of cases: 7
West Bengal: [Banana] Burdwan: [Litchi]Total number of cases: 2
India: [Guava] Burdwan: [Mango, ‘Other Fruits’, Total Non-Foodgrains] Total number of cases: 4
Significantly negative growth
Source: Author’s calculation based on BAES data (2000-01 to 2014-15)

Indian Journal of Economics and Development, March 2019, Vol 7 (3) ISSN (online): 2320-9836 ISSN (Print): 2320-9828
The production growth rate of all fruits combined takes place due to productivity growth in West Bengal but acreage growth is more responsible component for betterment of its production growth rate in the district. The production instability of all fruits combined is found to be low compared to that of individual crops or crop-groups. The fruits are, in general, high valued and nutritious crops compared to the traditional crops. Most of the farmers in the country are aware of the profitability of fruits farming but they are remaining still stuck in traditional crop farming. However, fruits cultivation is comparatively costly than traditional farming. Many types of cost are involved in fruits farming like, irrigation cost, marketing cost, storage cost, transportation cost etc. more over fruits are perishable in nature. Most of the Indian farmers belong to marginal group. It resulted that they cannot afford these types of cultivation cost. But fruits farming produce opposite result in Burdwan and West Bengal which are also dominated by marginal farmers. This result may occur due to availability of steady local markets for fruits. From this scenario we may come to conclusions that the farmers of West Bengal and Burdwan are more price responsive and consciousness about the nutritious foods. The acreage growth rate of all fruits combined increases in the district. It is implied that the farmers begin to change the cropping pattern from traditional crops to fruit crops in the district.
6. Reference
1. S.H. Mondal, A.K. Chattopadhyay. Pattern of growth and instability in crop production in Burdwan during 2000 to 2013: a comparative study. Research Bulletin. 2018; 43(4).
2. V. Saravanapandeeswari, B. Vanitha. Growth of area, production and productivity of banana (Musa paradisiaca) cultivation in Theni District, Tamil Nadu – an analysis by component elements. Indian Journal of Agriculture Research. 2018; 52(2), 107-110.
3. N.A. Patil, R.A. Yeledhalli. Growth and instability in area, production and productivity of different crops in Bengaluru division. International Journal of Agriculture, Enviroment and Biotechnology. 2016; 9(4), 599-611.
4. S. Ali, A. Jabbar. Growth and variability in area, production and yield of selected fruit crops in khyber Pakistan. Pakistan Journal of Agricultural Research. 2015; 28(1), 64-69.
5. K. Vinayaka, S. Lokapur, R. Gurikar, R. Hosali. Growth and instability analysis of fruit crops in india – an economic analysis. Journal of Enviromental Science, Computer Science and Engineering and Technology. 2014; 3(4),1808-1813.
6. T.A. Bhat, T. Choure. Study of growth and instability in raw silk production and marketing in India. European Journal of Business and Management. 2014; 6(14), 1-5.
7. B. Krisnan, A. Chanchal. Agricultural growth and instability in western himalaya region: an analysis of Himachal Pradesh, India. Journal of Agriculture and Life Sciences. 2014; 1(1), 1-7.
8. R.P. Sing, N. Rani. To study growth rate of area, production and productivity of fruit crops in Jharkhand. Journal of Economics and Social Development. 2013; 9(1), 1-9.
9. S. Rani, H. Shah, A. Ali, B. Rehman. Growth, instability and price flexibility of major pulses in Pakistan. Asian Journal of Agriculture and Rural Development. 2012; 2(2), 107-112.
10. M.P. Wasim. Trends, growth and variability of major fruit crops in Balochistan - Pakistan: 1989-2009. ARPN Journal of Agricultural and Biological Science. 2011; 6(12), 1-10.
11. R.C. Kumawat, P.C. Meena. Growth and instability in area, production and yield of major spice crops in Rajasthan. Journal of Spices and Aromatic Crops. 2005; 6(14), 1-10.
Received on: 08/01/2019 Accepted on: 31/01/2019
The Publication fee is defrayed by Indian Society for Education and Environment (www.iseeadyar.org) Cite this article as: Saddam Hossain Mondal, Arup Kumar Chattopadhyay. Growth performance of fruits production in the era of globalisation in West Bengal: a comparative study. Indian Journal of Economics and Development. March 2019, Vol 7 (3), 1-6.