growth opportunities india - cantonfair.org.cn€¦ · all values from gfk panel market in town...
TRANSCRIPT

Canton Fair-April’15 1
Growth Opportunities – India
April 2015

Canton Fair-April’15 2
AGENDA
4 Premium Segment Analysis
2 Economic Overview
3 MDA Overview
1 Emerging Middle Class
5 Key Highlights
3Canton Fair-April’15
Emerging Middle Class

Canton Fair-April’15 4
Emerging Middle Class – some global numbers first.
According to the OECD Development Center,
the size of the middle class1 worldwide could increase from …
1 OECD, defines middle-class as those with daily expenditures between USD10 and USD100 per person in purchasing power parity terms
1.8 3.2 4.9

5Canton Fair-April’15
We will see an explosion of the Middle Class in Asia
Global regional distribution of the Middle Class (all regions = 100%)
Source: Kharas, Gertz. The New Global Middle Class: A Cross-Over from West to East. Wolfensohn Center for Development at Brookings
2009 2020 2030
18%
10%
36%
28%
6%
10%
2%8%
22%
54%
5%
7%
6%
14%
66%

Canton Fair-April’15 6
58 into Lagos
Urbanization drives redistribution of people to mega
cities
By 2015 …
By 2020, 75% will live in Urban Areas.
39 into Jakarta
42 into Mumbai
50 into Dhaka
32 people an hour will be moving into Shanghai

Canton Fair-April’15 7
Factors conducive for Appliances growth - India
Source: Govt. Of India Census 2001 and 2011.
2001 2011
1029
1210Population of India
2001 2011
192
247
No. of Households in Mn.Increasing
Population
Increasing
Households
9380
5436
22
618
41
43
36
1 2 419
32
0 0 1 1 90 0 0 1 2
1985 1995 2005 2015 2025
Globals
Strivers
Seekers
Aspirers
Deprived
755 928 1107 1278 1429Population in
million
Share of population by annual income bracket
(adjusted for inflation)
Growing
Middle
Class
Increasing
nuclear
families
Number of Nuclear Families
increased by 32% in 2011/2001
10.
6%
Delhi
11.
7%
Ahmedabad
18
%
Kolkata
18
%
Mumbai
20
%
Chennai
25
%
Bangalore
% of female workers (of total females)
Growth of
Modern
Retail
Organized Retail growing by ~23% in
2014/2013 (GfK)
Increasing
working
women

Canton Fair-April’15 8
………..favorable Economic & Political factors fueling growth

Canton Fair-April’15 9
3 3 1 16 4
127 4 5
7 6 11
8
618 142 2
0 1 3 2 1 2
96
2
3
22
42 46
81 81
59
80
3940
4146 26 37 23
21
24 24
1 0
19
9
44 40
31 31
3429
2530
3 3
14 16
1
1
1 11 2
0
18 17
4 3
18
714 15 12 11
18 1829 29
Y13.. Y14.. .. Y13 Y14 Y13 Y14 Y13. Y14. . Y13. Y14. . Y13 Y14 . Y13 . Y14 .
CE
SDA
MDA
SMART-MOBILEPHONES
MEDIATABLETS
MOBILE COMPUTING
DESK COMPUT.IN
~1/4th of Consumer’s wallet expenditure is on Appliances…..
…contribution has remained constant even after increased spends on mobile phones.
<=123 USD 123 -206 USD 206-309 USD 309-412 USD 412-514 USD >514 USDTOTAL
One of the
highest spends
in these price
brackets is on
MDA
GfK Report for Urban India TC 1-4
10Canton Fair-April’15
Growth Opportunities in MDA

Canton Fair-April’15 11
‘000 units. All values from GfK Panel Market in Town Classes 1-4
Value growth was higher at 18%, driven by higher ASPs in domestic
appliances such as Refrigerators and ACs
3.9
11.0
3.7
9.6
19.4
26.2
45.8
89.9
85.7
58.9
173.9
119.6
458.8
98.4
Home Audio
Microwave Ovens
DVD Players
CRT TV
Digital Cameras
Media Tablets
Desktop PC
Mobile PC
AC
Washing …
PTV
Refrigerators
Smart Phones
Feature Phones
2014 Sales Value (INR Billion)
-8%
7%
-29%
-52%
3%
15%
-1%
-8%
26%
15%
18%
17%
48%
-19%
Y-o-Y Change
Total value = INR 1,205 bn
(USD 20 Bn)

Canton Fair-April’15 12
Bulk of sales still comes from the top 35 Cities (1M+ Pop) across
majority of products…
61%
45%51%
61%47%
AIR
C
ON
DIT
ION
ER
RE
FR
IGE
RA
TO
RS
WA
SH
ING
M
AC
HIN
ES
MIC
RO
WA
VE
O
VE
NS
KIT
CH
EN
A
PP
LIA
NC
ES
Contribution from Top 35 Cities

Canton Fair-April’15 13
More than 50% of MDA sales comes from 1 Million+ population cities……
…Lower town classes showing significant growth….next potential area!!

Canton Fair-April’15 14

Canton Fair-April’15 15
High temperature in Q2 acts as a growth driver for compressor
categories
43
46
57
84
91
181
Faridabad
Jaipur
Allahabad
Patna
Lucknow
Surat
Total India Panel Market grew by 26% over PY and it grew by 36% in April to June over PY
AC
Growth Rate Q2’14/13
34
41
53
54
70
78
Faridabad
Baroda
Surat
Nagpur
Lucknow
Nasik
Cooling
Growth Rate Q2’14/13
Cities growth more than All India growth in compressor categories

Canton Fair-April’15 16
Lower energy cost promises helps in formation of AAP government
in Delhi
http://www.abplive.in/india/2015/02/25/article511496.ece/AAP-government-announces-cheaper-power-free-water-for-Delhi
https://www.bijlibachao.com/news/domestic-electricity-lt-tariff-slabs-and-rates-for-all-states-in-india-in-2015.html
0-200 Units
INR 2.00
Multi-step Electricity Pricing
201-400 Units
INR 2.98
401-800
INR 7.3
801-1200
INR 8.1
1201&Above
INR 8.75
Inverter AC Trend
1.2 4
9
2012 2013 2014
Canton Fair-April’15 17
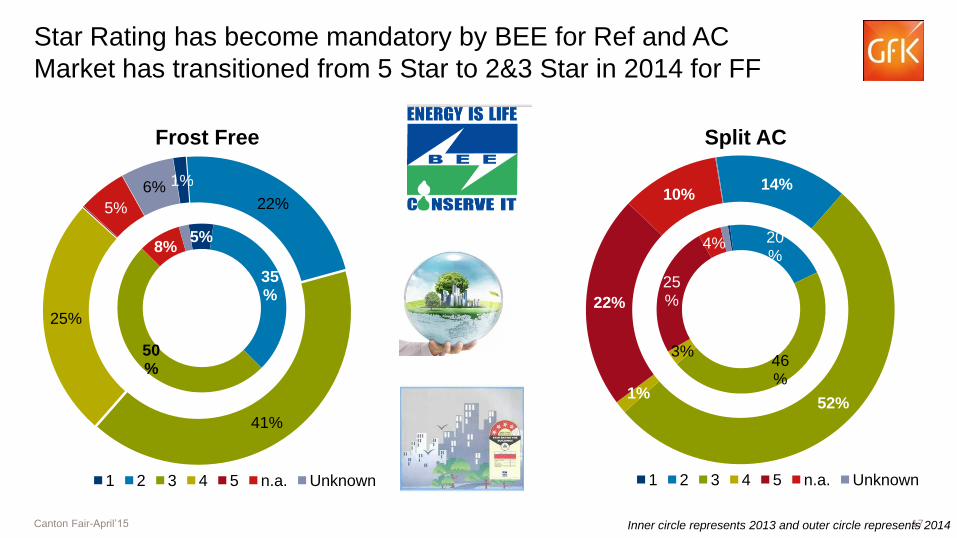
Frost Free
Inner circle represents 2013 and outer circle represents 2014
1%
22%
41%
25%
5%
6%
1 2 3 4 5 n.a. Unknown
5%
35%
50%
8%
Split AC
Star Rating has become mandatory by BEE for Ref and AC
Market has transitioned from 5 Star to 2&3 Star in 2014 for FF
14%
52%1%
22%
10%
1 2 3 4 5 n.a. Unknown
20%
46%
3%
25%
4%

Canton Fair-April’15 18
Growth by Sectors
Funding From Domestic Investment
Rising of Service Sector in India’s GDP
Reasons for Affluency in India

Canton Fair-April’15 19
Changing Pattern of Private final
consumer expenditureGrowth in Private final consumer expenditure
Increasing Consumer Expenditure in India

Canton Fair-April’15 20
2 Dr Frz Top
Side By Side
+45%
249-300 Ltrs
75 new launches made by industry in 249-
300ltrs in 2014 vis a vis 55 launches in 2013
>399 Ltrs
39 launches made by industry in >399Ltrs
in 2014 vis a vis 23 launches in 2013
2 Dr Frz Top
1 out of 10 FF is SBS .
Korean brands cover 90% of the SBS market
24 new launches made by industry in 2014
Side By Side
+14%
2Dr Frz Top and SBS Capacity Trend
25%

Canton Fair-April’15 21
• Higher Price bracket (>500 USD) has gained significant contribution from Jan-Dec’12 to Jan-Dec’14
• Owing to festive season and discounts, lower price brackets(75-420USD) gained contribution in
second half of year

Canton Fair-April’15 22
Category Mix >500USD
87%
13% 10
18.8
17.6
Window AC
Split AC
AC
Growth % 2014/13
44.4
14
17.1
16.7
3+ Doors
2 Dr. Frz Top
1 Door
Cooling
Split AC
Window AC
DC
FF
61%
39%
Shift towards premium categories like energy efficient products, inverter AC and SBS, higher
price brackets witnessing growth.

23Canton Fair-April’15
23 % in value
Every 3rd Washing
Machine sold in
India is FATL 35% 41%
23%
FATL
FAFL
SATT
WM Segment
Contribution>401 USD to <=562
USD Price Class is more
than 1/3 of Total FATL
FAFL is growing
by 12 % in
Value

Canton Fair-April’15 24
Channel Mix

Canton Fair-April’15 25
Organized retail sector has a significant part of the Value for these
categories...
31%
23%
42%
33%
14%
40%
0%
5%
10%
15%
20%
25%
30%
35%
40%
45%
AC COOLING MICROWAVE OVEN
WASHING MACHINE
KITCHEN APPLIANCES
PERSONAL CARE
Contribution to Sales value in 2014

Canton Fair-April’15 26
< -15≥ -15< -10
≥ -10< -5
≥ -5< -3
≥ -3< -1
≥ -1< 1
≥ 1< 3
≥ 3< 5
≥ 5< 10
≥ 10< 15
≥ 15 n.a.
ValueLCGrowthMDA TOTAL
year 2015WorldForecast 2015
India Major Domestic Appliances on a high growth path

27Canton Fair-April’15
Key Highlights

28Canton Fair-April’15
Emerging Economy
• Increasing middle class and growing urbanization
• Higher consumer spending
• Attractive market with numerous opportunities
• 2nd Highest growth in MDA.
New Trends - MDA
• Shift towards premium segments
• Shift towards higher energy efficient products
• Increasing contribution of higher price classes
• ¼ of the consumers wallet expenditure is on MDA
Premium Segment
• SBS is growing by 45%
• Dominated by 550-600 Ltrs.
• 90% market is covered by Korean brands
• 2 door Frz Top dominated by 3 & 4 star segment
• Inverter AC contribution to total AC market has doubled in a year
• Fully Automatic 6-6.5kg driving growth for Washers.
Organized Retail
• Increased Modern retail
• Excellent launch pad for premium and innovative products
• High visibility and appropriate exposure
Key Highlights

Canton Fair-April’15 29

30© GfK 2015 | Global survey | Consumers’ attitudes towards, and time spent cooking
Cooking: Consumers’ attitudes towards,
and time spent cookingGlobal GfK survey
March 2015

31© GfK 2015 | Global survey | Consumers’ attitudes towards, and time spent cooking
Global results

32© GfK 2015 | Global survey | Consumers’ attitudes towards, and time spent cooking
Cooking: Consumers’ attitudes and time spent cooking
33© GfK 2015 | Global survey | Consumers’ attitudes towards, and time spent cooking
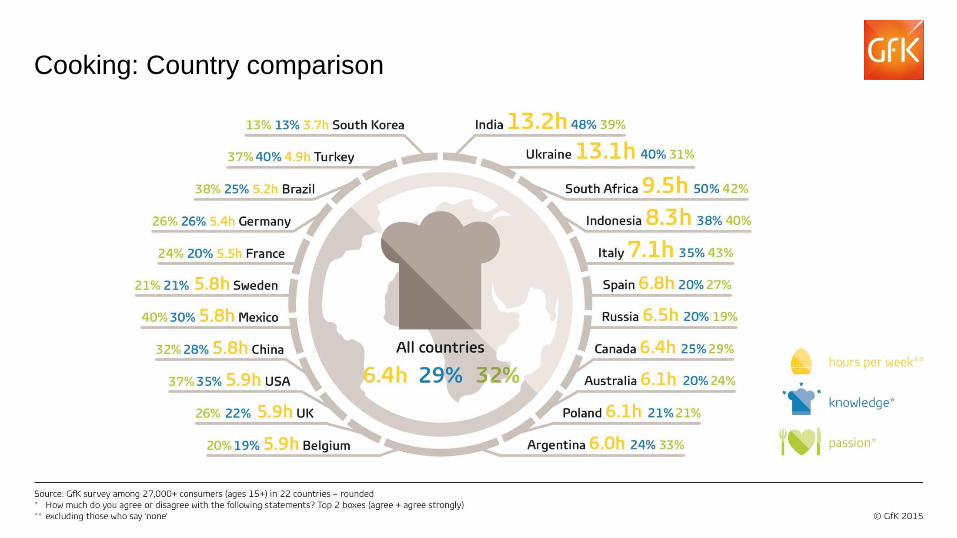
Cooking: Country comparison

34© GfK 2015 | Global survey | Consumers’ attitudes towards, and time spent cooking
India
35© GfK 2015 | Global survey | Consumers’ attitudes towards, and time spent cooking
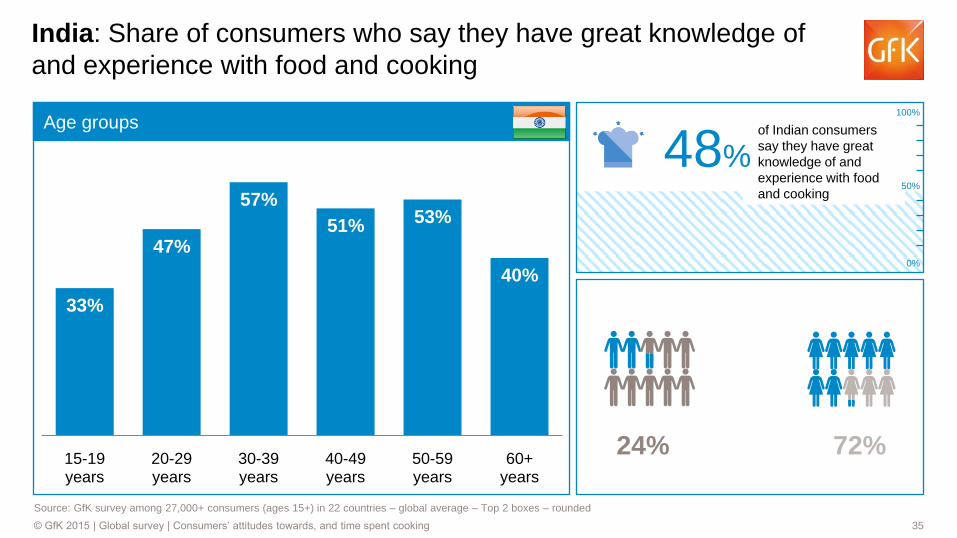
India: Share of consumers who say they have great knowledge of
and experience with food and cooking
33%
47%
57%
51%53%
40%
15-19 years
20-29years
30-39 years
40-49 years
50-59 years
60+ years
Source: GfK survey among 27,000+ consumers (ages 15+) in 22 countries – global average – Top 2 boxes – rounded
of Indian consumers
say they have great
knowledge of and
experience with food
and cooking
48%
Age groups100%
0%
50%
72%24%

36© GfK 2015 | Global survey | Consumers’ attitudes towards, and time spent cooking
100%
0%
50%
Age groups
29%
40%
47%
42%38%
30%
15-19 years
20-29years
30-39 years
40-49 years
50-59 years
60+ years
Source: GfK survey among 27,000+ consumers (ages 15+) in 22 countries – global average – Top 2 boxes – rounded
of Indian consumers
say they are really
passionate about food
and cooking39%
India: Share of consumers who say they are really passionate
about food and cooking
57%20%

37© GfK 2015 | Global survey | Consumers’ attitudes towards, and time spent cooking
7.2hours
12.5hours
14.6hours
16.2hours
13.1hours 11.4
hours
15-19 years
20-29years
30-39 years
40-49 years
50-59 years
60+ years
Age groups
13.2 hours
Age groups
India: Average number of hours per week spent cooking,
amongst those who cook
Average hours per week
Indian consumers spent
cooking, amongst those
who cook
Source: GfK survey among 27,000+ consumers (ages 15+) in 22 countries – global average – mean number of hours consumers spend on cooking weekly (excluding those who say ‘none’)
14.2 hours
5.9 hours

38© GfK 2015 | Global survey | Consumers’ attitudes towards, and time spent cooking
Typical Indian kitchen
Traditional Type Modular Type

39© GfK 2015 | Global survey | Consumers’ attitudes towards, and time spent cooking
Indian lady is juggling across multiple roles… and spends ~2 hr per day in the kitchen
as she likes to cook
40© GfK 2015 | Global survey | Consumers’ attitudes towards, and time spent cooking
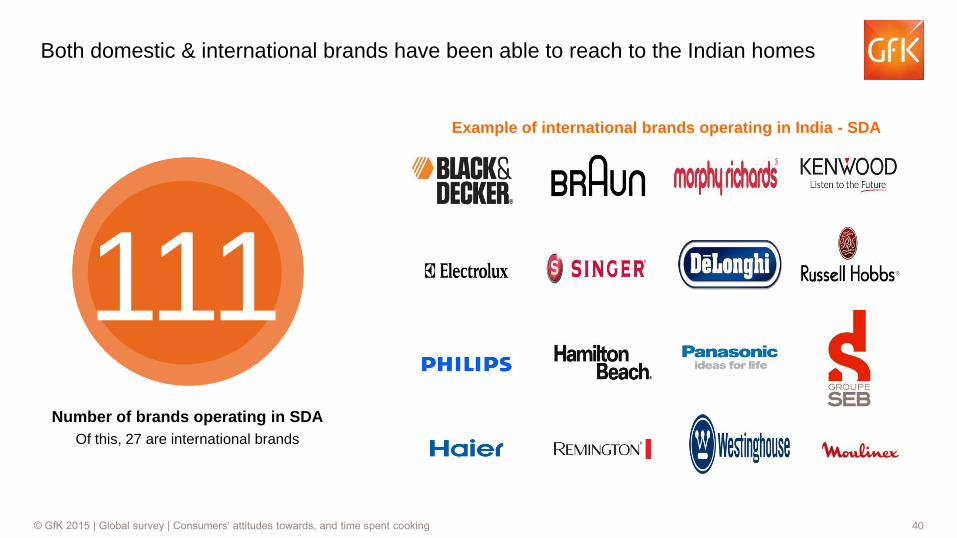
Both domestic & international brands have been able to reach to the Indian homes
111Number of brands operating in SDA
Of this, 27 are international brands
Example of international brands operating in India - SDA

41© GfK 2015 | Global survey | Consumers’ attitudes towards, and time spent cooking
Sales value growth | Apr-Dec 2014 vs. Apr-Dec 2013+13%
Overall growth
Love for cooking, beauty, and health concerns driving the growth of SDA
+12% +15% +53%
+28%+3%
+38%+31%
+11%
Garment Care Kitchen Appliances Personal Care
IronsJuice
extractorShaving/Epilation
Hair DryerLiquidiser
Hair StylerKitchen
machines
Rice Cooker
Consumables
Water Purifier +40%

42© GfK 2015 | Global survey | Consumers’ attitudes towards, and time spent cooking
MDA Other SDA CE IT Smart Phone
DSC Personal Care
1 2 2
68
10
20
% Volume Contrb. of Online sales – GfK Est (2014).
Online channel also adding to this growth of SDA
Love for deal & convenience driving online shopping…especially for personal care
Manufactures launching their products on online channel as well
Some models/brands are launched for online channel only
Even the offline players (distributors/retailers) are placing their
products online – resulting into multiple sellers of the same products

43© GfK 2015 | Global survey | Consumers’ attitudes towards, and time spent cooking
Premium/luxury products riding on this growth too… targeting mix of offline & online
channels
Air FryerIn last 1 year itself, atleast
7-8 new brands entered
the market
Slow Juicer
Air PurifierEpilator – premium range
(INR >8K)

44© GfK 2015 | Global survey | Consumers’ attitudes towards, and time spent cooking
Stay in touch
Ushpreet Singh Bawa
Account Director SDA &
Lighting
+91 9582333189
photo