growth of juvenile red king crab (paralithodes ...fishbull.noaa.gov/994/loh.pdf · 572...
TRANSCRIPT

572
Abstract–An analysis of in situ growth rate was conducted for juvenile red king crab (Paralithodes camtschaticus) in Bristol Bay, Alaska. Growth of early juveniles (~2–40 mm CL; age 0–3 yr) was determined by fitting seasonalized Gompertz growth models to length-frequency data. The parameters of the growth model and resulting size-at-age estimates were compared with those from studies conducted at Unalaska and Kodiak Islands by fitting the same growth model to published length-frequency data from separate sources. Growth of late juvenile and early reproductive crabs, ~30–100 mm carapace length (CL), was examined by analyzing length-frequency data from the National Marine Fisheries Service annual Bering Sea trawl survey from 1975 through 1999. Mean CL associated with strong size modes of crabs in Bristol Bay length-frequency distributions was resolved by using the FiSAT software package (FAO-ICLARM Stock Assessment Tools) to track the modal size progression of strong year classes and assign mean size-at-age characteristics to the stock.
Growth of early juvenile crabs was slower in Bristol Bay than that observed by other researchers at Unalaska or Kodiak. Sizes at 1, 2, and 3 years after settlement were estimated to be ~9 mm, 23 mm, and 47 mm CL in Bristol Bay compared with 16 mm, 38 mm, and 66 mm CL at Unalaska; at Kodiak, estimated sizes of 12 mm and 42 mm were obtained for age-1 and age-2 crabs, respectively. Within the Bristol Bay trawl survey data, a total of 24 modes were identified for both males and females <~100 mm CL, which included the modal progression of two year classes that presumably settled in 1976 and 1990. The 1976 year class grew slowly and would not have recruited to the reproductive stock until ~9 years after settlement, whereas the 1990 year class appeared to recruit at ~8 years after settlement. Both estimates indicate that Bristol Bay red king crabs are older at reproductive maturity than the ~6 years after settlement presently assumed. An attempt to resolve discrete mean size-at-age from the length-frequency data met with little success because variability in growth between year classes markedly obscured size-at-age characteristics in the stock.
Manuscript accepted 20 March 2001. Fish. Bull. 99:572–587 (2001).
Growth of juvenile red king crab (Paralithodes camtschaticus) in Bristol Bay (Alaska) elucidated from field sampling and analysis of trawl-survey data
Timothy Loher David A. Armstrong School of Fisheries and Aquatic SciencesBox 355020University of WashingtonSeattle, Washington 98195Present address (for T. Loher): International Pacific Halibut Commission
P.O. Box 95009 Seattle, Washington 98145-2009
E-mail address (for T. Loher): [email protected]
Bradley G. Stevens AFSC Kodiak LaboratoryKodiak Fisheries Research CenterNational Marine Fisheries Service301 Research CourtKodiak, Alaska 99615
Population abundance of red king crab Present assumptions regarding red (Paralithodes camtschaticus) in Bristol king crab growth rates suggest that Bay, Alaska (Fig. 1) is typified by great Bristol Bay crabs recruit to the revariability. The maximum abundance productive stock at an age of approxof harvestable male crabs in the stock imately 6 years after settlement (i.e. over the last 25 years has fluctuated ~seven years following egg fertilization; by over an order of magnitude, peak- Zheng et al., 1995a, 1995b), which coring at nearly 60 million individuals in responds to mean sizes of 105 mm car1977, and has fallen to less than 3 mil- apace length (CL) and 97 mm CL for lion from 1983 to 1985 (Loher et al., males and females, respectively. These 1998; Zheng and Kruse1). Strong fish- size-at-age values are based on Steeries in the late 1970s and early 1980s vens and Munk (1990), Weber (1967), were followed by substantially reduced and Balsiger (1974). However, none of abundance in recent years, and fishery these sources represents a comprehenclosures in 1981 and 1994, leading to sive treatment of growth from settleconcern over the status of the popula- ment through maturity based entirely tion by both management agencies and on field-collected data from the Bristol fishermen. Such concern prompted the Bay region. Balsiger’s (1974) growth Alaska Department of Fish and Game to develop a detailed harvest-based recovery plan for the fishery (Zheng et
1 Zheng, J., and G. H. Kruse. 1999. Status of king crab stocks in the eastern Bering
al.2) that considers the stock to be fully Sea in 1999. Alaska Department of Fish recovered once it reaches an effective and Game, Reg. Inf. Rep. 5J99-09. Division spawning biomass of 55 million pounds. of Commercial Fisheries, Alaska Depart-
This biomass has not occurred in Bris- ment of Fish and Game, P.O. Box 25526, Juneau, Alaska, 99801.
tol Bay since 1981 (Zheng and Kruse1; 2 Zheng, J., M. C. Murphy, and G. H. Kruse.Zheng et al.2), but it was chosen as an 996. Overview of population estimationappropriate rebuilding level primarily methods and recommended harvest straton the basis of length-based recruit- egy for red king crabs in Bristol Bay. ment models that, in turn, rely on the Alaska Department of Fish and Game,
Reg. Inf. Rep. 5J96-04. Division of Cominferred underlying stock-recruitment mercial Fisheries, Alaska Department ofrelationship for the population (Zheng Fish and Game, P.O. Box 25526, Juneau, et al., 1995a, 1995b). Alaska, 99801.
Loher et al.: Growth of Paralithodes camtschaticus 573
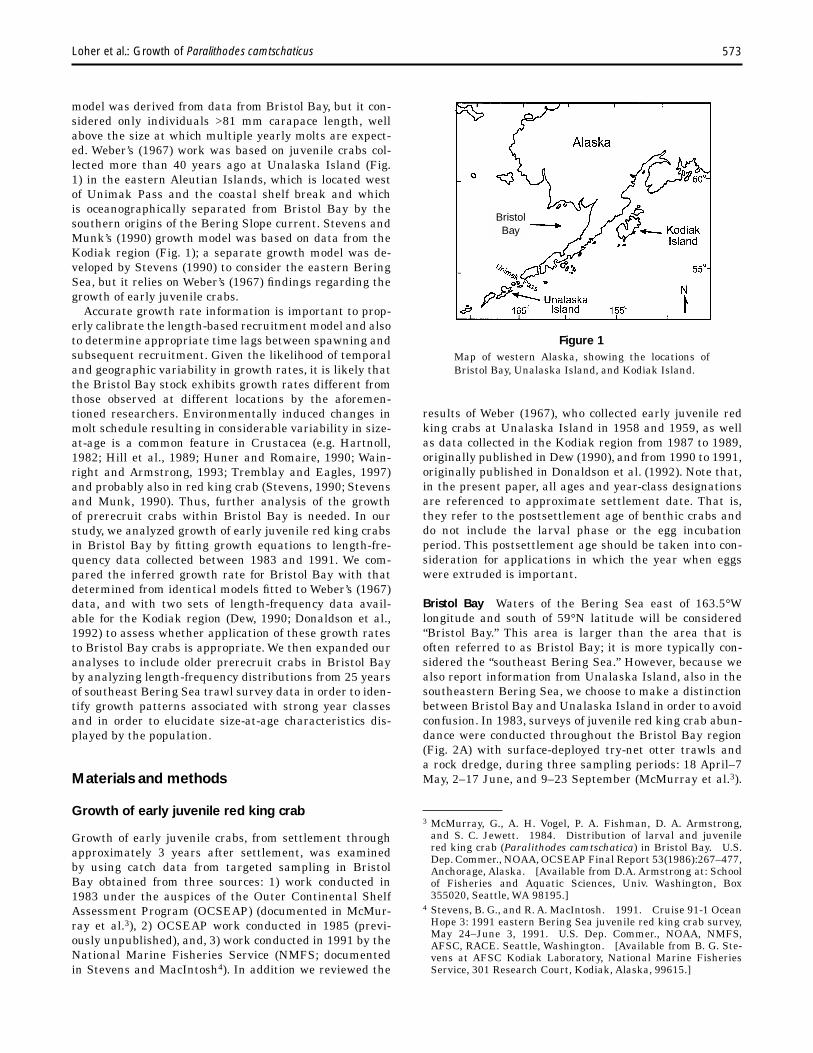
model was derived from data from Bristol Bay, but it considered only individuals >81 mm carapace length, well above the size at which multiple yearly molts are expected. Weber’s (1967) work was based on juvenile crabs collected more than 40 years ago at Unalaska Island (Fig. 1) in the eastern Aleutian Islands, which is located west of Unimak Pass and the coastal shelf break and which is oceanographically separated from Bristol Bay by the southern origins of the Bering Slope current. Stevens and Munk’s (1990) growth model was based on data from the Kodiak region (Fig. 1); a separate growth model was developed by Stevens (1990) to consider the eastern Bering Sea, but it relies on Weber’s (1967) findings regarding the growth of early juvenile crabs.
Accurate growth rate information is important to properly calibrate the length-based recruitment model and also to determine appropriate time lags between spawning and subsequent recruitment. Given the likelihood of temporal and geographic variability in growth rates, it is likely that the Bristol Bay stock exhibits growth rates different from those observed at different locations by the aforementioned researchers. Environmentally induced changes in molt schedule resulting in considerable variability in sizeat-age is a common feature in Crustacea (e.g. Hartnoll, 1982; Hill et al., 1989; Huner and Romaire, 1990; Wainright and Armstrong, 1993; Tremblay and Eagles, 1997) and probably also in red king crab (Stevens, 1990; Stevens and Munk, 1990). Thus, further analysis of the growth of prerecruit crabs within Bristol Bay is needed. In our study, we analyzed growth of early juvenile red king crabs in Bristol Bay by fitting growth equations to length-frequency data collected between 1983 and 1991. We compared the inferred growth rate for Bristol Bay with that determined from identical models fitted to Weber’s (1967) data, and with two sets of length-frequency data available for the Kodiak region (Dew, 1990; Donaldson et al., 1992) to assess whether application of these growth rates to Bristol Bay crabs is appropriate. We then expanded our analyses to include older prerecruit crabs in Bristol Bay by analyzing length-frequency distributions from 25 years of southeast Bering Sea trawl survey data in order to identify growth patterns associated with strong year classes and in order to elucidate size-at-age characteristics displayed by the population.
Materials and methods
Growth of early juvenile red king crab
Growth of early juvenile crabs, from settlement through approximately 3 years after settlement, was examined by using catch data from targeted sampling in Bristol Bay obtained from three sources: 1) work conducted in 1983 under the auspices of the Outer Continental Shelf Assessment Program (OCSEAP) (documented in McMurray et al.3), 2) OCSEAP work conducted in 1985 (previously unpublished), and, 3) work conducted in 1991 by the National Marine Fisheries Service (NMFS; documented in Stevens and MacIntosh4). In addition we reviewed the
Bristol Bay
Figure 1 Map of western Alaska, showing the locations of Bristol Bay, Unalaska Island, and Kodiak Island.
results of Weber (1967), who collected early juvenile red king crabs at Unalaska Island in 1958 and 1959, as well as data collected in the Kodiak region from 1987 to 1989, originally published in Dew (1990), and from 1990 to 1991, originally published in Donaldson et al. (1992). Note that, in the present paper, all ages and year-class designations are referenced to approximate settlement date. That is, they refer to the postsettlement age of benthic crabs and do not include the larval phase or the egg incubation period. This postsettlement age should be taken into consideration for applications in which the year when eggs were extruded is important.
Bristol Bay Waters of the Bering Sea east of 163.5°W longitude and south of 59°N latitude will be considered “Bristol Bay.” This area is larger than the area that is often referred to as Bristol Bay; it is more typically considered the “southeast Bering Sea.” However, because we also report information from Unalaska Island, also in the southeastern Bering Sea, we choose to make a distinction between Bristol Bay and Unalaska Island in order to avoid confusion. In 1983, surveys of juvenile red king crab abundance were conducted throughout the Bristol Bay region (Fig. 2A) with surface-deployed try-net otter trawls and a rock dredge, during three sampling periods: 18 April–7 May, 2–17 June, and 9–23 September (McMurray et al.3).
3 McMurray, G., A. H. Vogel, P. A. Fishman, D. A. Armstrong, and S. C. Jewett. 1984. Distribution of larval and juvenile red king crab (Paralithodes camtschatica) in Bristol Bay. U.S. Dep. Commer., NOAA, OCSEAP Final Report 53(1986):267–477, Anchorage, Alaska. [Available from D.A. Armstrong at: School of Fisheries and Aquatic Sciences, Univ. Washington, Box 355020, Seattle, WA 98195.]
4 Stevens, B. G., and R. A. MacIntosh. 1991. Cruise 91-1 Ocean Hope 3: 1991 eastern Bering Sea juvenile red king crab survey, May 24–June 3, 1991. U.S. Dep. Commer., NOAA, NMFS, AFSC, RACE. Seattle, Washington. [Available from B. G. Stevens at AFSC Kodiak Laboratory, National Marine Fisheries Service, 301 Research Court, Kodiak, Alaska, 99615.]

574 Fishery Bulletin 99(4)
A B
50 m
100 m
50 m
100 m
Figure 2 Location of survey stations in Bristol Bay (east of 163.5° west longitude) visited during 1983 OCSEAP studies (A), 1985 OCSEAP studies (B, open squares), and by Stevens and MacIntosh in 1991 (B, closed circles).
Try nets had a headrope length of 5.4 m and either wooden or aluminum doors measuring 0.4 m wide × 0.9 m tall. The rock dredge was constructed of a rigid steel frame with a mouth opening 0.9 m wide × 0.4 m tall. The 1985 survey was conducted from 19 July to 2 August, nearshore (generally inside the 50-m isobath), along the north Aleutian Shelf from Unimak Pass through the Port Moller region (Fig. 2B) also with try net and rock dredge. The 1991 survey (Stevens and MacIntosh4) was conducted from 26 May to 1 June along the North Aleutian Shelf from Port Moller to Kvichak Bay (Fig. 2B) with a 3.1-m wide beam trawl. The carapace length (CL) of all red king crab captured in the above surveys was measured and recorded onboard the vessels.
For each sampling period, length-frequency histograms were constructed to identify individual age classes (cohorts) within the data. Male and female crabs were pooled because sex-specific growth rates are not apparent until reproductive age (Weber, 1967; Dew, 1990), and the combined length-frequency data were analyzed by using the FiSAT software package (Gayanilo and Pauly, 1997) to determine the mean size (±1 SD) for each identifiable cohort. FiSAT employs a combination of Bhattacharya’s method (Bhattacharya, 1967) and NORMSEP (Hasselblad, 1966; Pauly and Caddy5) to decompose complex size-frequency distributions into a series of best-fit normal curves that represent each cohort within the data set. In our study, the “mean size” of a cohort refers to the mean (±1 SD) of its associated best-fit normal curve, as determined by FiSAT size-frequency decomposition.
5 Pauly, D., and J. F. Caddy. 1985. A modification of Bhattacharya’s method for the analysis of mixtures of normal distributions. FAO Fisheries Circular 781, Sales and Marketing Group, Information Division, FAO, Viale delle Terme di Caracalla, 00100 Rome.
Postsettlement age, in Julian days, was then calculated for each cohort. For each year’s length-frequency histogram, the cohort with the smallest mean CL was assigned age 0, and the subsequent sizes assigned age 1 and age 2 (Fig. 3). The age of each cohort (in days) was calculated as the time from settlement in the cohort’s settlement year until the median sampling date for the survey period. Settlement was estimated to be 15 July of each year because numerous 2-mm-CL individuals occurred in late July during the 1983 surveys, and a carapace length of 2 mm is typical of the first benthic instar (Kurata, 1961; Donaldson et al., 1992; Loher and Armstrong, 2000). Postsettlement age was plotted against the associated mean CL and two growth curves were fitted to the data. The first curve was a seasonalized version of the von Bertalanffy growth model obtained from Anastacio and Marques (1995), where growth in carapace length is expressed as
1(t tmin )+C × ( K × D/2Π) × sin 2Π t× −Lt = Lmax {1 − e −[ K × D× − (t ts )]} ( / D)
, (1)
The second curve was a seasonalized Gompertz model, where growth in carapace length is expressed as
Lt = Lmax { e− e −[ K × (t− tmin ) + C × ( K /2Π ) × sin2 Π t × (t− ts ) ] } , (2)
where (in both models) Lt = carapace length at time t; Lmax = maximum carapace length;
t = given time; tmin = time at which the carapace
length is the minimum size for the life-stage of interest (in this case, minimum size for benthic red king crab=2 mm);

Loher et al.: Growth of Paralithodes camtschaticus 575
ATAS
ATAS
ATAS
ATAS
ATAS
Figure 3 Length-frequency histograms of early juvenile red king crabs captured in Bristol Bay from 1983 to 1991. Each age class is denoted by shading: open bars = age 0+; shaded bars = age 1+; closed bars = age 2+. For each sampling date an average time after settlement (ATAS) is reported. The ATAS is the number of days estimated to have elapsed between 15 July of the sampling year (the most recent settlement event) and the median sampling date. For example, the ATAS for crabs sampled on 15 September was 62 days. This value corresponds to the estimated age of age 0+ crabs in that sample, whereas age 1+ crab would have been ~365 days older than the ATAS, and age 2+ crabs ~730 days older than the ATAS. Note that the June samples fell at nearly one calendar year following the previous year’s settlement; hence, age 0+ crab in those samples were nearly age 1. Arrows indicate the mean CL of each size cohort, as determined with FiSAT; mean values were used to fit the growth curve.
July–August, 1985
April–May, 1983
May–June, 1991
ts = lag-time between the start of growth and the first seasonal growth oscillation; oscillations are sinusoidal with a one-year period;
K = intrinsic growth rate; C = parameter ranging from 0 to 1 that controls the
strength of the seasonal growth oscillation; 0 = no seasonal signature; 1 = strong seasonality with a brief period each year during which growth ceases; and
D = parameter expressing metabolic deviation from the von Bertalanffy 2/3 metabolic rule (in our study, D = 1 [no deviation]).
Unalaska and Kodiak islands Growth rate of early juvenile red king crab at Unalaska Island was assessed by
using data published in Weber (1967). In that study immature crabs were collected, primarily with SCUBA, during four sampling periods in 1958 (22 April–17 May; 30 May–6 June; 13 July; 17 September–1 October) and two periods in 1959 (11–24 February; 24 May–2 June). Two data sources were used that originated in Kodiak Island: 1) Donaldson et al. (1992), who documented growth of red king crab in artificial habitat collectors for approximately one year after settlement between June 1990 and May 1991, and; 2) Dew (1990) who collected data on podding age 1+ to 2+ red king crab using SCUBA observations between 20 November 1987 and 3 June 1989. The data in Weber (1967) and Dew (1990) were used to construct length-frequency histograms (males and females pooled) and the characteris-
576 Fishery Bulletin 99(4)
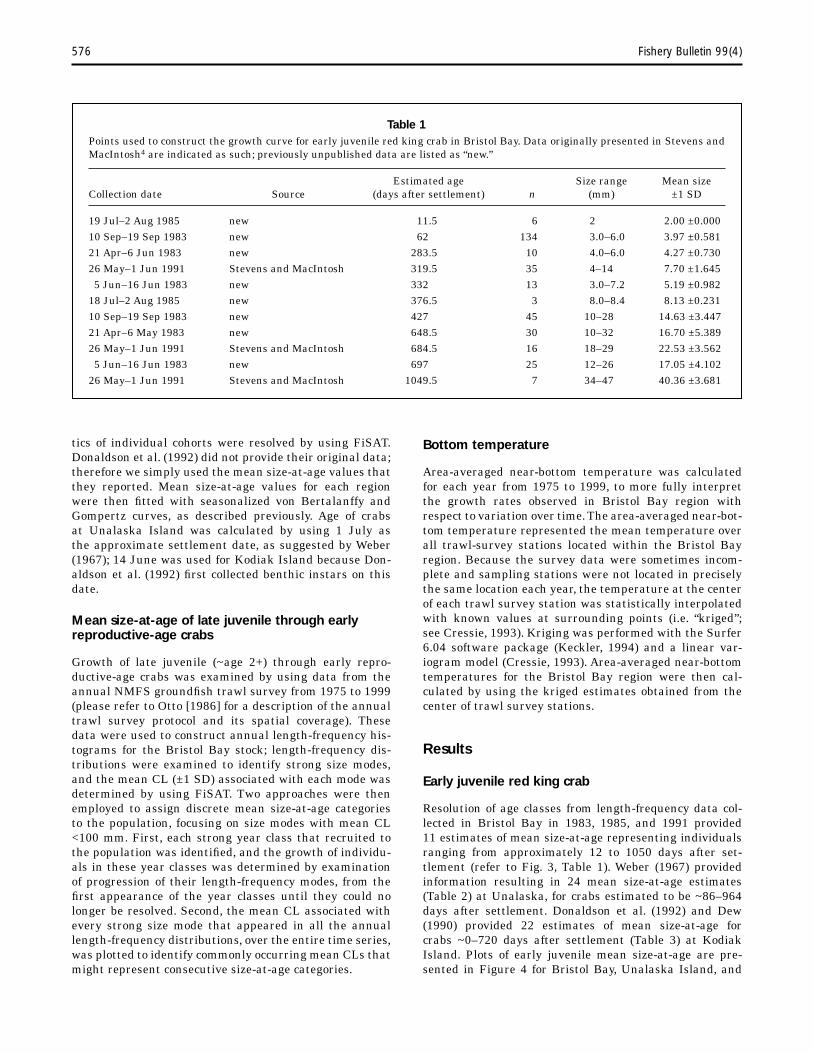
Table 1 Points used to construct the growth curve for early juvenile red king crab in Bristol Bay. Data originally presented in Stevens and MacIntosh4 are indicated as such; previously unpublished data are listed as “new.”
Estimated age Size range Mean size Collection date Source (days after settlement) n (mm) ±1 SD
19 Jul–2 Aug 1985 new 11.5 6 2 2.00 ±0.000 10 Sep–19 Sep 1983 new 62 134 3.0–6.0 3.97 ±0.581 21 Apr–6 Jun 1983 new 283.5 10 4.0–6.0 4.27 ±0.730 26 May–1 Jun 1991 Stevens and MacIntosh 319.5 35 4–14 7.70 ±1.645 5 Jun–16 Jun 1983 new 332 13 3.0–7.2 5.19 ±0.982
18 Jul–2 Aug 1985 new 376.5 3 8.0–8.4 8.13 ±0.231 10 Sep–19 Sep 1983 new 427 45 10–28 ±3.447 21 Apr–6 May 1983 new 648.5 30 10–32 ±5.389 26 May–1 Jun 1991 Stevens and MacIntosh 684.5 16 18–29 ±3.562 5 Jun–16 Jun 1983 new 697 25 12–26 ±4.102
26 May–1 Jun 1991 Stevens and MacIntosh 1049.5 7 34–47 ±3.681
14.63 16.70 22.53 17.05 40.36
tics of individual cohorts were resolved by using FiSAT. Donaldson et al. (1992) did not provide their original data; therefore we simply used the mean size-at-age values that they reported. Mean size-at-age values for each region were then fitted with seasonalized von Bertalanffy and Gompertz curves, as described previously. Age of crabs at Unalaska Island was calculated by using 1 July as the approximate settlement date, as suggested by Weber (1967); 14 June was used for Kodiak Island because Donaldson et al. (1992) first collected benthic instars on this date.
Mean size-at-age of late juvenile through early reproductive-age crabs
Growth of late juvenile (~age 2+) through early reproductive-age crabs was examined by using data from the annual NMFS groundfish trawl survey from 1975 to 1999 (please refer to Otto [1986] for a description of the annual trawl survey protocol and its spatial coverage). These data were used to construct annual length-frequency histograms for the Bristol Bay stock; length-frequency distributions were examined to identify strong size modes, and the mean CL (±1 SD) associated with each mode was determined by using FiSAT. Two approaches were then employed to assign discrete mean size-at-age categories to the population, focusing on size modes with mean CL <100 mm. First, each strong year class that recruited to the population was identified, and the growth of individuals in these year classes was determined by examination of progression of their length-frequency modes, from the first appearance of the year classes until they could no longer be resolved. Second, the mean CL associated with every strong size mode that appeared in all the annual length-frequency distributions, over the entire time series, was plotted to identify commonly occurring mean CLs that might represent consecutive size-at-age categories.
Bottom temperature
Area-averaged near-bottom temperature was calculated for each year from 1975 to 1999, to more fully interpret the growth rates observed in Bristol Bay region with respect to variation over time. The area-averaged near-bottom temperature represented the mean temperature over all trawl-survey stations located within the Bristol Bay region. Because the survey data were sometimes incomplete and sampling stations were not located in precisely the same location each year, the temperature at the center of each trawl survey station was statistically interpolated with known values at surrounding points (i.e. “kriged”; see Cressie, 1993). Kriging was performed with the Surfer 6.04 software package (Keckler, 1994) and a linear variogram model (Cressie, 1993). Area-averaged near-bottom temperatures for the Bristol Bay region were then calculated by using the kriged estimates obtained from the center of trawl survey stations.
Results
Early juvenile red king crab
Resolution of age classes from length-frequency data collected in Bristol Bay in 1983, 1985, and 1991 provided 11 estimates of mean size-at-age representing individuals ranging from approximately 12 to 1050 days after settlement (refer to Fig. 3, Table 1). Weber (1967) provided information resulting in 24 mean size-at-age estimates (Table 2) at Unalaska, for crabs estimated to be ~86–964 days after settlement. Donaldson et al. (1992) and Dew (1990) provided 22 estimates of mean size-at-age for crabs ~0–720 days after settlement (Table 3) at Kodiak Island. Plots of early juvenile mean size-at-age are presented in Figure 4 for Bristol Bay, Unalaska Island, and
Loher et al.: Growth of Paralithodes camtschaticus 577
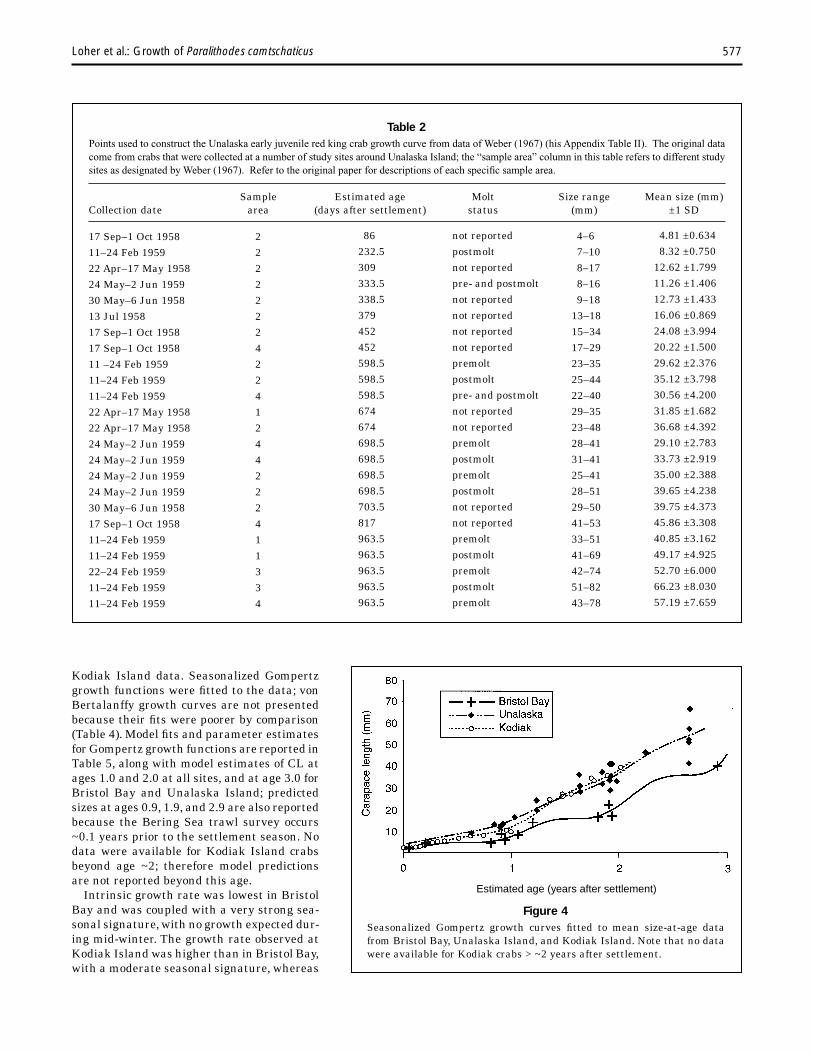
Table 2 Points used to construct the Unalaska early juvenile red king crab growth curve from data of Weber (1967) (his Appendix Table II). The original data
come from crabs that were collected at a number of study sites around Unalaska Island; the “sample area” column in this table refers to different study
sites as designated by Weber (1967). c sample area.
Sample Estimated age Molt Size range Mean size (mm) Collection date area (days after settlement) status (mm) ±1 SD
17 Sep–1 Oct 1958 11–24 Feb 1959 22 Apr–17 May 1958 24 May–2 Jun 1959 30 May–6 Jun 1958 13 Jul 1958 17 Sep–1 Oct 1958 17 Sep–1 Oct 1958 11 –24 Feb 1959 11–24 Feb 1959 11–24 Feb 1959 22 Apr–17 May 1958 22 Apr–17 May 1958 24 May–2 Jun 1959 24 May–2 Jun 1959 24 May–2 Jun 1959 24 May–2 Jun 1959 30 May–6 Jun 1958 17 Sep–1 Oct 1958 11–24 Feb 1959 11–24 Feb 1959 22–24 Feb 1959 11–24 Feb 1959 11–24 Feb 1959
2 2 2 2 2 2 2 4 2 2 4 1 2 4 4 2 2 2 4 1 1 3 3 4
4–6 7–10 8–17 8–16 9–18
13–18 15–34 17–29 23–35 25–44 22–40 29–35 23–48 28–41 31–41 25–41 28–51 29–50 41–53 33–51 41–69 42–74 51–82 43–78
86 232.5 309 333.5 338.5 379 452 452 598.5 598.5 598.5 674 674 698.5 698.5 698.5 698.5 703.5 817 963.5 963.5 963.5 963.5 963.5
4.81 ±0.634 8.32 ±0.750
12.62 ±1.799 11.26 ±1.406 12.73 ±1.433 16.06 ±0.869 24.08 ±3.994 20.22 ±1.500 29.62 ±2.376 35.12 ±3.798 30.56 ±4.200 31.85 ±1.682 36.68 ±4.392 29.10 ±2.783 33.73 ±2.919 35.00 ±2.388 39.65 ±4.238 39.75 ±4.373 45.86 ±3.308 40.85 ±3.162 49.17 ±4.925 52.70 ±6.000 66.23 ±8.030 57.19 ±7.659
not reported postmolt not reported pre- and postmolt not reported not reported not reported not reported premolt postmolt pre- and postmolt not reported not reported premolt postmolt premolt postmolt not reported not reported premolt postmolt premolt postmolt premolt
Refer to the original paper for descriptions of each specifi
Kodiak Island data. Seasonalized Gompertz growth functions were fitted to the data; von Bertalanffy growth curves are not presented because their fits were poorer by comparison (Table 4). Model fits and parameter estimates for Gompertz growth functions are reported in Table 5, along with model estimates of CL at ages 1.0 and 2.0 at all sites, and at age 3.0 for Bristol Bay and Unalaska Island; predicted sizes at ages 0.9, 1.9, and 2.9 are also reported because the Bering Sea trawl survey occurs ~0.1 years prior to the settlement season. No data were available for Kodiak Island crabs beyond age ~2; therefore model predictions are not reported beyond this age.
Intrinsic growth rate was lowest in Bristol Bay and was coupled with a very strong seasonal signature, with no growth expected during mid-winter. The growth rate observed at Kodiak Island was higher than in Bristol Bay, with a moderate seasonal signature, whereas
Estimated age (years after settlement)
Figure 4 Seasonalized Gompertz growth curves fitted to mean size-at-age data from Bristol Bay, Unalaska Island, and Kodiak Island. Note that no data were available for Kodiak crabs > ~2 years after settlement.

578 Fishery Bulletin 99(4)
Table 3 Points used to construct the Kodiak early juvenile red king crab growth curve. Data from Donaldson et al. (1992) come directly from their Table 1; data from Dew (1990) are compiled from his Figures 7 and 8.
Estimated age Size range Mean size (mm) Collection date (days after settlement) (mm) ±SD
Donaldson et al. (1992) 14 Jun 1990 28 Jun 1990 13 Jul 1990 26 Jul 1990 10 Aug 1990 23 Aug 1990 7 Sep 1990
21 Sep 1990 16 Oct 1990 4 Dec 1990
11 Feb 1991 27 Mar 1991 14 May 1991 29 May 1991
Dew (1990) 6 Oct 1988
18 Nov 1988 20 Nov 1987 18 Dec 1987 24 Feb 1989 8 Mar 1988
19 Apr 1988 3 Jun 1988
1.9–2.4 1.8–2.6 2.0–3.3 2.5–3.4 2.4–4.2 2.6–5.4 3.4–5.1 4.2–6.4 3.4–6.1 4.6–7.9 4.6–9.0 6.1–10.3 8.7–13.0 8.6–9.9
17.5–34.0 19.0–35.5 22.0–32.5 22.0–27.4 25.0–43.0 22.0–41.5 26.5–44.5 31.0–49.0
0 14 29 42 57 70 85
109 124 173 212 257 335 350
480 523 525 553 621 641 675 720
2.18 ±0.118 2.18 ±0.171 2.61 ±0.363 2.84 ±0.152 3.64 ±0.408 3.78 ±0.362 4.47 ±0.421 4.98 ±0.605 5.29 ±0.491 6.58 ±0.703 7.71 ±1.201 7.95 ±0.769
10.46 ±1.079 9.33 ±0.474
25.67 ±2.446 27.87 ±2.795 26.93 ±2.572 28.10 ±2.726 35.27 ±3.693 34.09 ±3.688 36.49 ±3.176 40.18 ±3.361
growth rate observed at Unalaska Island was most similar to that at Kodiak Island, and very little seasonal signature could be detected. Estimated mean size at age 2 at Unalaska Island (37.6 mm CL) was much closer to the value estimated for Kodiak Island (42.2 mm CL) than for Bristol Bay (22.7 mm CL, Table 5); at age 3, Bristol Bay crabs were expected to average ~20 mm smaller than crabs observed at Unalaska Island. It is important to note that the choice of settlement dates for the models had negligible effect on size-at-age estimates, except where such changes caused cohorts to be re-assigned to younger age classes than seemed reasonable (i.e. if early spring settlement dates had been chosen, very small crabs would have been assigned to late age 0, instead of being considered immediately postsettlement crabs). Changes in settlement date primarily affected estimated size-at-age over the first few months but had little impact on estimation of size at 1, 2, or 3 years after settlement.
Late juvenile through early reproductive-age crabs
Male red king crabs collected in NMFS trawl surveys from 1975 to 1999 ranged from 6 to 201 mm CL, and all
Table 4 Comparison of coefficient of determination (r2) goodnessof-fit values associated with seasonalized Gompertz and von Bertalanffy growth curves fitted to early juvenile red king crab size-at-age data.
Region von Bertalanffy
Bristol Bay 0.968 0.842 Unalaska Island 0.922 0.863 Kodiak Island 0.995 0.919
Gompertz
sizes between 23 and 198 mm CL were observed. Female red king crabs ranged from 7 to 192 mm CL; all sizes between 24 and 165 mm CL. Over the entire time series, two particularly strong year classes recruited to the Bristol Bay population whose growth and size-at-age characteristics could be tracked by modal size progression. The first year class was evident from 1979 to 1984, first appearing as size modes with mean CL = ~32 mm and

Loher et al.: Growth of Paralithodes camtschaticus 579
~30 mm for males and females, respectively (Fig. 5, Table 6); these crabs were most likely ~2.9 years of age and represented the year class that settled in 1976. Males of this year class grew to a mean CL = ~88 mm by 1983 and the mode became indistinguishable in 1984; females grew to a mean CL = ~84 mm by 1983, and ~92 mm by 1984 (Fig. 5, Table 6). The second strong year class was evident from 1994 to 1999 (Fig. 6, Table 6) and first appeared at larger sizes than did the 1976 year class. Males first appeared at a mean CL = ~54 mm and grew to a mean CL = ~137 mm in 1999; females first appeared at ~53 mm CL in 1994 and grew to ~109 mm in 1999. This year class first appeared at sizes that were essentially equivalent to the sizes that individuals from the 1976 year class had attained at age 3.9. Thus, this second year class most likely represented crabs that settled in 1990.
For both year classes, growth of males and females was similar up to ~85 mm CL, after which females grew more slowly than males. However, the growth rates of the two year classes were not equivalent: the 1976 year class grew slower than the 1990 year class (Fig. 7) because the 1976 year class required two years (from 1980 to 1982) to progress from a mean CL = ~50 mm to mean CL = ~70 mm, whereas the 1990 year class achieved this level of growth within a single year (from 1994 to 1995). Mean sizes during the following two years of growth (from 1982 to 1984 for the 1976 year class; 1995 to 1997 for the 1990 year class, Table 6) were similar between year classes.
Within all of the annual length-frequency distributions, considering only size modes with mean CL <100 mm, 24 modes were identified for both males and for females. These included the modes presented previously for the 1976 and 1990 year classes, and an additional 16 modes could not be tracked for a substantial period of time. for males, and 14 modes for females. The additional modes The mean CL (±1 SD) of all 24 male and female modes represent other year classes whose modal progression is presented in Figure 8, plotted sequentially by increas-
Table 5 Characteristics of seasonalized Gompertz growth curves fitted to size-at-age data from Bristol Bay, Unalaska Island, and Kodiak Island. Values are reported for ages 0.9, 1.9, and 2.9 because these ages roughly correspond to trawl survey data: the trawl survey typically occurs in late May, ~0.9 years following the previous year’s settlement. For all curves, Lmax = 200 mm CL. See “Materials and methods” section for definitions of model parameters.
Model Unalaska Kodiak parameters y Island Island
r2 (fit) K C ts (year) tmin (year)
Length estimates from the models age 0.0 age 0.9 age 1.0 age 1.9 age 2.0 age 2.9 age 3.0
Slowest growth in January January February
0.968 0.922 0.995 0.415 0.421 0.634 1.000 0.275 0.599 0.553 0.535 0.680
–3.922 –3.286 –2.659
3.1 3.6 2.7 7.0 14.5 9.9 8.5 16.4 11.7
19.5 38.0 22.7 42.2 41.9 — 46.7 66.4 —
Bristol Ba
34.5 37.6 62.7
Table 6 Summary of mean size (±1 SD) of the cohorts depicted in size-frequency progression plots (Figs. 5 and 6), as determined with FiSAT.
Male mean size (mm) Female mean size (mm) Age Year class Year ±1 SD ±1 SD (years after settlement)
1976
1990
31.9 ±2.79 50.7 ±4.10 63.2 ±5.06 70.1 ±7.50 88.4 ±14.74
cohort indistinct
54.1 ±4.67 73.4 ±4.90 86.5 ±8.01
104.2 ±8.44 117.8 ±11.40 136.5 ±11.92
29.6 ±2.04 50.2 ±3.40 64.0 ±5.73 71.4 ±8.20 83.5 ±11.23 92.3 ±4.84
52.7 ±3.75 71.9 ±7.28 83.5 ±5.89 97.4 ±3.62
105.3 ±8.01 109.3 ±7.79
2.9 3.9 4.9 5.9 6.9 7.9
3.9 4.9 5.9 6.9 7.9 8.9
1979 1980 1981 1982 1983 1984
1994 1995 1996 1997 1998 1999

580 Fishery Bulletin 99(4)
Num
ber
of o
bser
vatio
ns
Carapace length (mm)
Figure 5 Yearly length-frequency histograms for male (left) and female (right) Bristol Bay region red king crabs <130 mm CL, 1979–1984, revealing mean size-at-age of the 1976 year class by modal progression. Arrows indicate the cohort’s mean CL each year, as determined with FiSAT; dark shading indicates CLs within 1 SD of the mean. The vertical lines located at 105 mm CL and 97 mm CL indicate size at reproductive recruitment for males and females, respectively, as defined by Zheng et al. (1995a, 1995b). Note that the 1979 histograms have been truncated at n = 80 observations in order to make the relevant size modes more visible. The 1984 male size mode was not resolved with FiSAT; we considered this size mode to be too indistinguishable from the surrounding data to yield an accurate result.
ing mean CL. This figure represents an attempt to iden- separated from the remaining observations, and likely tify commonly occurring sizes that may represent the ex- representing a single age class; for females, two observapected CLs of consecutive age classes. For male crabs, tions occurred at the same approximate size, separated a cluster of three observations occurred at ~35 mm CL, from the remaining modes. Considering the estimated age
Loher et al.: Growth of Paralithodes camtschaticus 581
Num
ber
of o
bser
vatio
ns
Carapace length (mm)
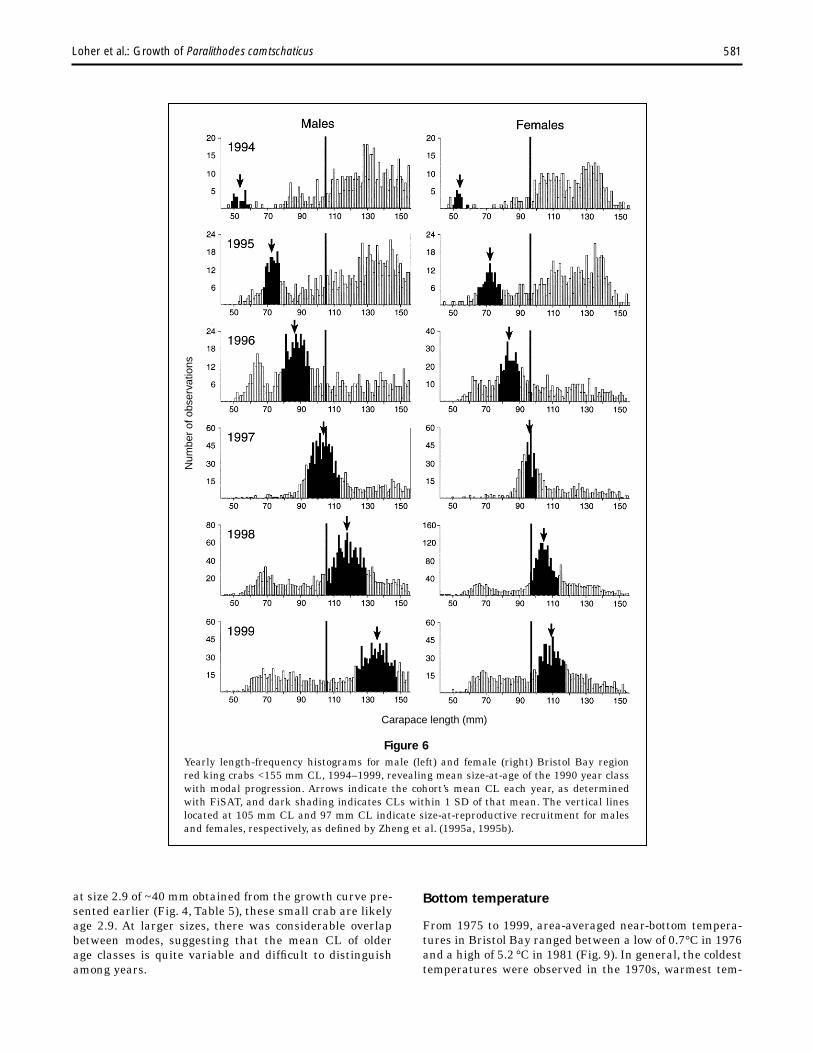
Figure 6 Yearly length-frequency histograms for male (left) and female (right) Bristol Bay region red king crabs <155 mm CL, 1994–1999, revealing mean size-at-age of the 1990 year class with modal progression. Arrows indicate the cohort’s mean CL each year, as determined with FiSAT, and dark shading indicates CLs within 1 SD of that mean. The vertical lines located at 105 mm CL and 97 mm CL indicate size-at-reproductive recruitment for males and females, respectively, as defined by Zheng et al. (1995a, 1995b).
at size 2.9 of ~40 mm obtained from the growth curve pre- Bottom temperature sented earlier (Fig. 4, Table 5), these small crab are likely age 2.9. At larger sizes, there was considerable overlap From 1975 to 1999, area-averaged near-bottom temperabetween modes, suggesting that the mean CL of older tures in Bristol Bay ranged between a low of 0.7°C in 1976 age classes is quite variable and difficult to distinguish and a high of 5.2 °C in 1981 (Fig. 9). In general, the coldest among years. temperatures were observed in the 1970s, warmest tem-

582 Fishery Bulletin 99(4)
Carapace length (mm)
Pro
port
ion
of m
axim
um o
bser
ved
abun
danc
e
Figure 7 Best-fit normal curves, as determined with FiSAT, of the length-frequency modes associated with male and female red king crabs of the 1976 (solid curves) and 1990 (dashed curves) year classes, from age 3.9 to 6.9, demonstrating the divergence in size-at-age between the two year classes. In particular, note the large difference in apparent molt increment displayed by the year classes between ages 3.9 and 4.9. All curves have been standardized to a uniform height in order to facilitate their comparison, because the number of crabs that were observed differed between years.
1976 year class
1990 year class
1976 year class
1990 year class
peratures during the early 1980s, and moderate temperatures from the mid-1980s through the late 1990s.
Discussion
Our analyses demonstrate that Bristol Bay red king crab grow slower than previously assumed. The present stockrecruitment relationship used to manage this population is based on growth models (Weber, 1967; Balsiger, 1974; Stevens and Munk, 1990) that suggest a time lag of six years between settlement and subsequent recruitment (i.e. seven years after fertilization), where reproductive recruitment is defined to occur at ~97 mm and ~105 mm CL for females and males, respectively (Zheng et al., 1995a, 1995b). Our results indicate that mean age at full reproductive recruitment is likely 8–9 years after settlement. Crabs that settled in 1990 began to reach reproductive size in 1997, at 7 years after settlement, and at this age only ~50% of the individuals were at or above the reproductive size cut-off; the mode did not become fully recruited for an additional 1 to 2 years. Individuals of the 1976 year class grew even slower and, on average, were still slightly smaller than reproductive size at 8 years after settlement. This year class would not have begun to contribute substantially to the reproductive stock until at least 9 years after settlement.
The discrepancy between our estimates of mean ageat-recruitment and presently accepted values is due in part to incorrect assumptions of the latter regarding the growth of early juveniles in Bristol Bay. Weber (1967) conducted one of the few comprehensive in situ studies of early juvenile size-at-age in Alaskan waters and clearly demonstrated that red king crab should be expected to reach a mean CL = ~66 mm CL three years after settlement. This conclusion contrasted sharply with earlier data from Bristol Bay that showed strong size modes with means of 4 mm, 9 mm, and 17 mm CL in early summer samples in 1956, 1957, and 1958, respectively (Fisheries Agency of Japan6), apparently representing the modal progression of the 1956 year class, and suggesting a much slower growth rate. More recent studies conducted in Kodiak (Dew, 1990; Donaldson et al., 1992) have supported Weber’s (1967) conclusions; thus, the observations made by the Fisheries Agency of Japan6 have been largely ignored. Our results suggest that the data from Kodiak is in good accord with Weber’s (1967) conclusions, but that mean CLs of 4 mm,
6 Fisheries Agency of Japan. 1959. Report of research on king crab in the eastern Bering Sea. Int. N. Pac. Fish. Comm. Annu. Rep., p. 71–78. [Available from Secretariat, North Pacific Anadromous Fish Commission, Suite 502, 889 West Pender Street, Vancouver, British Columbia, V6C 3BC.]

Loher et al.: Growth of Paralithodes camtschaticus 583
Figure 8 Mean CL ±1 SD of all strong size modes of Bristol Bay red king crabs appearing in the annual lengthfrequency data from NMFS Bering Sea trawl surveys, 1975–1999; only modes with mean CL <100 mm are plotted. Size modes are plotted in length-sequential order along the x-axis, starting with the smallest observed mean CL. The numbers adjacent to each mode indicate the year during which that mode was observed. A grouping of modes separate from the remaining data, indicated by the dashed line and the arrow, likely represents a discrete age class; these small crabs are most likely age 2.9 (refer to Fig. 4). The remaining observations are continuous; substantial size overlap between consecutive modes suggest that discrete size-at-age categories are lacking at >~40 mm mean CL.
Modal mean carapace length
Ran
k or
der
of m
odal
mea
n ca
rapa
ce le
ngth
Annual values
Five-year running averages
Figure 9 Area-averaged June bottom temperatures in the Bristol Bay region from 1975 to 1999. The five-year running averages represent a five-year period that includes the plotted date and the four years preceding it; for example, the five-year average temperature plotted at 1981 (3.0°C) represents mean area-averaged temperature from 1977 to 1981.
584 Fishery Bulletin 99(4)
9 mm, and 17 mm are consistent with sizes at age 0, 1, and 2, respectively, within Bristol Bay. This may be due, in part, to reduced molt frequency in Bristol Bay: the data obtained from Weber (1967) indicate that mid-winter molting was not uncommon during his study, whereas our data suggest that this may not be typical in Bristol Bay. It is difficult to determine whether the discrepancies represent actual regional differences, or simply differences between different studies conducted at different sites and at different times, but our results indicate that it is probably inappropriate to apply the early juvenile growth rate obtained by Weber (1967) to the Bristol Bay stock; use of the faster growth rate likely results in lower estimates of ageat-recruitment than the population displays.
Variable growth of older juveniles (age 3+) may further delay age-at-recruitment. This variability is evident when comparing growth of the 1976 year class to that of the 1990 year class; age-at-recruitment was 1–2 years greater in the former, due to slow growth of prerecruits. In particular, note that females of the 1976 year class, averaging 83.5 mm CL in 1983, displayed a mean increase in carapace length during molting (molt increment [MI]) of ~9 mm during the 1984 spring molt, whereas females of the 1990 year class, also averaging 83.5 mm CL in 1996, exhibited a mean MI of ~14 mm during the 1997 spring molt. As a result, females from the 1976 year class required four years to grow from a mean CL = ~50 mm to a mean CL = ~92 mm CL and at ~8 years after settlement were still slightly smaller than the estimated size for full reproductive recruitment (Zheng et al., 1995a, 1995b). Females from the 1990 year class were able to accomplish slightly more mean growth, from ~53 mm to ~97 mm CL, in only three years.
The large difference in growth rate between the 1976 and 1990 year classes may have been caused by water temperature differences during the two time periods. Molt schedules and growth rates can be strongly influenced by ambient temperature (Kurata, 1960, 1961; Nakanishi, 1985), and considerable variability in size at maturity has been observed over the species’ geographic range in both males (Paul et al., 1991) and females (see review in Blau, 1990; Otto et al., 1990). Though a number of factors may contribute to the observed variability, reduced growth associated with colder bottom temperatures has been invoked to explain the smaller size-at-maturity observed in the Norton Sound population as compared with other Bering Sea stocks (Blau, 1990; Otto et al., 1990), and modeling suggests that regional and temporal variation in temperature can have broad effects on age-at-recruitment (Stevens, 1990; Stevens and Munk, 1991). June bottom temperature profiles in Bristol Bay suggest that the 1976 year class was subjected to lower temperatures than the 1990 year class, primarily at early juvenile ages. Although a detailed analysis of temperature-dependent growth would require year-round temperature records, which are not available for this region, June temperatures in Bristol Bay may serve as a proxy for thermal conditions throughout the year. Bottom temperatures in Bristol Bay are linked to seasonal sea ice, that in some years covers much of Bristol Bay (NIC, 1994; Wyllie-Echeverria, 1995; Neibauer, 1998),
and the development of sea ice can have strong effects on bottom temperature conditions throughout the year. “Cold pool” bottom waters (<1°C) produced in the winter during ice formation may persist well into the summer, and potentially into the following winter, once insulated from surface heating by the development of the summer thermocline (Azumaya and Ohtani, 1995).
In many Crustacea, temperature primarily affects the molt schedule and has little influence on the magnitude of the MI (Hartnoll, 1982; Wainright and Armstrong, 1993), but laboratory studies conducted with red king crab indicate substantial variability in MI-at-age, across ranges of temperatures, as well as under stable environmental conditions. Rearing crabs ~6.3 mm CL under constant temperatures of ~10°C, Molyneaux and Shirley (1988) reported changes in CL at molt that ranged from –4.4% to 52.2%; similarly, for juvenile premolt crabs 33–36 mm CL, reared at ~5.0°C, Gharrett (1986) observed MIs ranging from 3 to 8 mm. At reproductive age, Weber and Miyahara (1962) observed that MI varied between 5 and 23 mm CL per molt in adult males, and large variability in MI associated with water temperatures between 0° and 12°C has been demonstrated for ovigerous females (Shirley et al., 1990).
Because the changes in mean CL the we observed for the Bristol Bay stock were determined through modal analysis of the entire population, it is reasonable to suspect that apparent differences in growth between years and cohorts do not represent MI variability but may be explained as variability in the number of molted versus unmolted crab within particular survey years. This is reasonable to assume, considering that red king crab may skip molting so that the annual molt schedule is replaced by a biennial or triennial cycle (Weber and Miyahara, 1962; McCaughran and Powell, 1977; Balsiger, 1974). However, closer examination of the trawl survey data indicates that, of the 23 size modes of crab observed, none comprised less than 94% new-shelled crabs that had recently molted (senior author, unpubl. data). A high proportion of newly molted crabs was characteristic of nearly all the identifiable size modes (senior author, unpubl. data): of the 53 modes identified, 35 comprised entirely new-shelled crabs, 17 comprised 94–99% new-shelled crabs, and only one comprised >10% old-shell individuals (the female cohort with mean CL=~94mm CL in 1982; population=11.4% old-shell). Thus, the difference in growth rates observed between the two year classes of late juveniles cannot be explained by variations in molt frequency; the trawl survey data support the conclusion that variability in MI is a characteristic shared by both sexes across a range of ages.
Substantial variability in MI is an important life history characteristic that confounds attempts to assign discrete size-at-age categories to a population. The greater the variability in MI among individuals and over time, the greater will be the range of sizes associated with crabs in a given year class, making modes more difficult to resolve from one another. Size-at-age values presently used for Bristol Bay red king crabs were derived from studies consisting of 1–4 years of data (Weber and Miyahara, 1962; Weber, 1967; McCaughran and Powell, 1977; Incze et al., 1986), but our analyses show that a strong tenden-

Loher et al.: Growth of Paralithodes camtschaticus 585
cy toward specific mean size-at-age is not apparent if longer time scales are considered. Size-at-age characteristics may be different depending on which year class is considered, and among crabs >~40 mm CL, mean CLs of identifiable cohorts displayed a fairly continuous distribution with considerable overlap between adjacent size modes; we could not identify specific mean CLs that could be consistently assigned to various age classes. In addition to confounding age estimates, variable MI may cause different year classes to recruit at different ages, over different time spans, and increase the number of year classes that constitute each year’s new recruitment. These issues have been treated elsewhere with respect to variable intermolt period (Stevens, 1990); variability in MI will produce the same effects.
We explored the possibility that overlap between size modes might be attributable to changes in growth rate within the population over time. That is, because bottom temperatures in Bristol Bay were colder during the 1970s than they have been more recently, growth was expected to be slower in the 1970s than later in the time series (Stevens, 1990). Thus, one might expect size modes to fall closer together early in the time series and to be spaced farther apart later. However, we were unable to resolve a clear temporal component in the data; even consecutive year classes sometimes had different mean size-at-age and growth increment characteristics. For example, the 1976 year class displayed a mean CL = ~51 mm (range: 44–57 mm) and ~63 mm CL (range: 56–71mm) in 1980 and 1981, respectively. These represented clear and well-separated size modes at ages 3.9 and 4.9, respectively. However, note the occurrence of a strong mode in the 1979 data, with a mean CL = ~58mm CL (range=50–65 mm); this mode probably represents a single year class, settled in 1975, which would be expected to have mean size-at-age characteristics similar to those of the 1976 year class. Yet, this mode of the 1975 year class fell almost precisely between, and its range encompassed the mean sizes of both age 3.9 and age 4.9 crabs from the 1976 year class. Such features were not uncommon in the length frequencies that were presented. For applications requiring accurate size-at-age information, the onerous task of year-by-year and yearclass-by-year-class assessments may be necessary.
In summary, our results demonstrate that both male and female red king crab in Bristol Bay reach maturity at least one year later than presently assumed (i.e. at ~7 years after settlement) due to slower growth from settlement through age 3. Furthermore, variability in MI in late juveniles can result in further reduction in growth rate such that reproductive recruitment is delayed by an additional 1–2 years (i.e. reproductive recruitment at ~8–9 years after settlement). From a management perspective, variable MI is a life-history characteristic that should be considered in growth- and length-based models of recruitment. Present models attempt to simulate MI variability (Zheng et al., 1995a), but little information exists on the magnitude of that variability and its changes over time and space. Such information will be valuable to managers to calibrate recruitment models with respect to lag times between spawning and subsequent recruitment, as well as
to predict how year classes enter the spawning population and the fishery; more research in this area is warranted. Inappropriate growth rate and lag-time assumptions have resulted in assigning the wrong year’s spawning stock biomass to subsequent recruitment levels in the Bristol Bay stock-recruitment curve; spawning stock abundances are presently offset ~1–2 years from the recruitment levels that they generated. This offset may affect the precise shape of the stock-recruitment curve and alter some of the models associated with it. Such changes may prove negligible with respect to actual harvest strategies, but it may be prudent to make the appropriate adjustments given knowledge of greater age at reproductive recruitment.
The Bristol Bay red king crab stock has been typified by large fluctuations in fishable abundance and by relatively rare, strong recruitment pulses generating the bulk of the fishery. Most recently, relatively strong catches from 1997–99, yielding a combined landed catch of ~35 million pounds of crabs with an exvessel value estimated at over $137 million (Morrison et al.7), were supported almost entirely by the 1990 year class (i.e. were spawned by the 1989 reproductive stock). Former assumptions would have led us to assign this pulse to the 1990 spawning stock and assume that the planktonic larval phase and settlement occurred during 1991. From a management standpoint, the ramifications of such an error may be negligible because estimated effective spawning biomass was similar in both 1989 and 1990 (Zheng and Kruse1). However, as we try to elucidate the mechanisms that generated this strong year class, it is crucial that we accurately determine when those crabs were larvae, early benthic individuals, and later stage crabs. Physical forcing, for example, has been shown to play a large role in determining recruitment variability in a number of commercially important crustacean species worldwide (e.g. Polovina and Mitchum, 1992; Polovina et al., 1993; McConnaughey et al., 1994; Rothlisberg et al., 1994; Jones and Epifanio, 1995; McConnaughey and Armstrong, 1995; Rozenkranz et al., 1998). Similar correlations between recruitment and physical parameters have been attempted for king crabs (Zheng and Kruse, 2000), but our ability to identify causes of recruitment variability relies upon associating the correct life history stages with physical forcing events. Even seemingly minor errors in growth-rate assumptions can have serious impacts on our understanding of population dynamics.
Acknowledgments
Funding for preparation of this manuscript was provided by the University of Washington, Seattle, through a Victor and Tamara Loosanoff Fellowship. We wish to thank Julie
7 Morrison, R., F. Bowers, R. Gish, E. Wilson, W. Jones, and B. Palach. 2000. Annual management report for shellfish fisheries of the Bering Sea. In Annual management report for shellfish fisheries of the westward region, 1999, p. 147–261. Regional Information Report 4KOO-55, Kodiak. Division of Commercial Fisheries, Alaska Department of Fish and Game, P.O. Box 25526, Juneau, Alaska, 99801.

586 Fishery Bulletin 99(4)
Keister, P. Sean MacDonald, and our anonymous reviewers for thoughtful suggestions that improved the quality of this manuscript, and Steven Hare (International Pacific Halibut Commission) and Gary Walters (NMFS, AFSC) for providing near-bottom temperature data.
Literature cited
Anastacio, P. M., and J. C. Marques. 1995. Population biology and production of the red swamp
crayfish Procambarus clarkii (Girard) in the lower Mendego River Valley, Portugal. J. Crustacean Biol. 15(1):156–168.
Azumaya, T., and K. Ohtani. 1995. Effect of winter meteorological conditions on the for
mation of the cold bottom water in the eastern Bering Sea Shelf. J. Oceanogr. 51:665–680.
Balsiger, J. W. 1974. A computer simulation model for the eastern Bering
Sea king crab population. Ph.D. diss., School of Fisheries, Univ. Washington, Seattle, WA, 197 p.
Bhattacharya, C. G. 1967. A simple method of resolution of a distribution into
Gaussian components. Biometrics 23:115–135. Blau, S. F.
1990. Size at maturity of female red king crabs (Paralithodes camtschatica) in the Adak management area, Alaska. In Proceedings of the international symposium on king and Tanner crabs, p. 105–116. Univ. Alaska Sea Grant Report 90-04, Anchorage, AK.
Cressie, N. A. C. 1993. Statistics for spatial data. John Wiley and Sons,
New York, NY, 900 p. Dew, B.
1990. Behavioral ecology of podding red king crab, Paralithodes camtschatica. Can. J. Fish. Aquat. Sci. 47:1944–1958.
Donaldson, W. E., S. C. Beyersdorfer, D. Pengilly, and S. F. Blau. 1992. Growth of red king crab, Paralithodes camtschaticus
(Tilesius, 1815), in artificial habitat collectors at Kodiak, Alaska. J. Shellfish Res. 11(1):85–89.
Gayanilo, F. C., Jr., and D. E. Pauly. 1997. FAO-ICLARM stock assessment tools (FiSAT): ref
erence manual. FAO Computerized Information Series (Fisheries) 8, FAO, Rome, 262 p.
Gharrett, J. A. 1986. Effects of a hydrocarbon-contaminated diet on sur
vival, feeding, growth, and molting of juvenile red king crab, Paralithodes camtschatica (Tilesius). M.S. thesis. Univ. Alaska, Juneau, AK, 178 p.
Hartnoll, R. G. 1982. Growth. In The biology of Crustacea, volume 2:
embryology, morphology, and genetics (L. B. Ebele, ed.), p. 111–196. Academic Press. New York, NY.
Hasselblad, V. 1966. Estimation of parameters for a mixture of normal dis
tributions. Technometrics 8:431–444. Hill, J., D. L. Fowler, and M. J. VanDenAvyle
1989. Species profiles: life histories and environmental requirements of coastal fishes and invertebrates (mid-Atlantic): blue crab. Biol. Rep. US Fish Wildl. Serv., 27 p.
Huner, J. V., and R. P. Romaire. 1990. Crawfish culture in the southeastern USA. World
Aquaculture 21:58–66. Incze, L. S., R. S. Otto, and M. K. McDowell.
1986. Recruitment variability of juvenile red king crab,
Paralithodes camtschatica, in the southeast Bering Sea. In North Pacific workshop on stock assessment and management of invertebrates (G. S. Jamieson, and N. Bourne, eds.), p. 370–378. Can. Spec. Pub. Fish. Aquat. Sci. 92.
Jones, M. B., and C. E. Epifanio. 1995. Settlement of brachyuran megalopae in Delaware
Bay: an analysis of time series data. Mar. Ecol. Prog. Ser. 125:67–76.
Keckler, D. 1994. Surfer for Windows: user’s manual. Golden Soft
ware, Golden, CO, 428 p. Kurata, H.
1960. Studies on the larvae and postlarvae of Paralithodes camtschatica. III. The influence of temperature and salinity on growth of the larvae. Bull. Hokkaido Reg. Fish. Res. Lab. 17:9–14.
1961. Studies on the larvae and postlarvae of Paralithodes camtschatica. IV. Growth of the postlarvae. Bull. Hokkaido Reg. Fish. Res. Lab. 18:1–9.
Loher, T., and D. Armstrong. 2000. Effects of habitat complexity and relative larval supply
on the establishment of early benthic phase red king crab (Paralithodes camtschaticus Tilesius, 1815) populations in Auke Bay, Alaska. J. Exp. Mar. Biol. Ecol. 245(1):83–109.
Loher, T., P. S. Hill, G. A. Harrington, and E. Cassano. 1998. Management of Bristol Bay red king crab: a critical
intersections approach to fisheries management. Rev. Fish. Sci. 6(3):169–251.
McCaughran, D. A., and G. C. Powell. 1977. Growth model for Alaskan king crab (Paralithodes
camtschatica). J. Fish. Res. Board Can. 34: 989–995. McConnaughey, R. A., and D. A. Armstrong.
1995. Potential effects of global climate change on Dungeness crab (Cancer magister) populations in the northeast Pacific Ocean. In Climate change and northern fish populations (R. J. Beamish, ed.), p. 291–306. Can. Spec. Pub. Fish. Aquat. Sci. 121.
McConnaughey, R. A., D. A. Armstrong, B. M. Hickey, and D. R. Gunderson.
1994. Interannual variability in coastal Washington Dungeness (Cancer magister) populations, larval advection and the coastal landing strip. Fish. Oceanogr. 3:22–38.
Molyneaux, D. B., and T. C. Shirley. 1988. Molting and growth of eyestalk-ablated juvenile red
king crabs, Paralithodes camtschatica (Crustacea: Lithodidae). Comp. Biochem. Physiol. 91:245–251.
Nakanishi, T. 1985. The effect of the environment on the survival rate,
growth and respiration of eggs, larvae and post-larvae of king crab (Paralithodes camtschatica). In Proceedings of the international king crab symposium, p. 167–185. Univ. Alaska Sea Grant Report 85-12, Anchorage, AK.
Neibauer, H. J. 1998. Variability on Bering Sea ice cover as affected
by a regime shift in the north Pacific in the period 1947–1996. J. Geophys. Res. 103(C12):27717–27737.
NIC (National Ice Center). 1994. Navy/NOAA National Ice Center (NIC) weekly sea
ice concentrations and extents, 1972–1994. National Ice Center, Washington, D.C. [Compact disc.]
Otto, R. S. 1986. Management and assessment of Bering sea king crab
stocks. In North Pacific workshop on stock assessment and management of invertebrates (G. S. Jamieson and N. Bourne, eds.), p. 195–227. Can. Spec. Pub. Fish. Aquat. Sci. 92.
Loher et al.: Growth of Paralithodes camtschaticus 587
Otto, R. S., R. A. MacIntosh, and P. A. Cumminskey. 1990. Fecundity and other reproductive parameters of
female red king crab (Paralithodes camtschatica) in Bristol Bay and Norton Sound. In Proceedings of the international symposium on king and Tanner crabs, p. 65–90. Univ. Alaska Sea Grant Report 90-04, Anchorage, AK.
Paul, J. M., A. J. Paul, R. S. Otto, and R. A. MacIntosh. 1991. Spermatophore presence in relation to carapace length
for eastern Bering Sea blue king crab (Paralithodes platypus, Brandt, 1850) and red king crab (Paralithodes camtschaticus (Tilesius, 1815)). J. Shellfish Res. 10:157–163.
Polovina, J. J., W. R. Haight, R. B. Moffit, and F. A. Parrish. 1993. The role of benthic habitat, oceanography, and fish
ing on the population dynamics of the spiny lobster, Panulirus marginatus (Decapoda, Palinuridae), in the Hawaiian Achipelago. In Proceedings of the fourth annual workshop on Lobster Biology and Management. Crustaceana 68:203–212.
Polovina, J. J., and G. T. Mitchum 1992. Variability in spiny lobster recruitment and sea
level in the northwestern Hawaiian Islands. Fish. Bull. 90:483–493.
Rothlisberg, P. C., J. A. Church, and C. B. Fandry. 1994. A mechanism for near-shore concentration and estua
rine recruitment of post-larval Penaeus plebejus Hess (Decapoda, Penaeidae). Estuarine Coastal Shelf Sci. 40:115–138.
Rozenkranz, G. E., A. V. Tyler, G. H. Kruse, and H. J. Neibauer. 1998. Relationship between wind and year class strength of
Tanner crabs in the southeast Bering Sea. Alaska Fish. Res. Bull. 5:18–24.
Shirley, T. C., S. M. Shirley, and S. Korn. 1990. Incubation period, molting and growth of female red
king crabs: effects of temperature. In Proceedings of the international symposium on king and Tanner crabs, p. 51–63. Univ. Alaska Sea Grant Report 90-04, Anchorage, AK.
Stevens, B. G. 1990. Temperature-dependent growth of juvenile red king
crab (Paralithodes camtschatica) and its effect on size-at
age and subsequent recruitment in the eastern Bering Sea. Can. J. Fish. Aquat. Sci. 47:1307–1317.
Stevens, B. G., and J. E. Munk. 1990. A temperature-dependent growth model for juvenile
red king crab, Paralithodes camtschatica, in Kodiak, Alaska. In Proceedings of the international symposium on king and Tanner crabs, p. 293–304. Univ. Alaska Sea Grant Report 90-04, Anchorage, AK.
Tremblay, M. J., and M. D. Eagles. 1997. Molt timing and growth of the lobster, Homarus amer
icanus, off northeastern Cape Breton Island, Nova Scotia. J. Shellfish Res. 16:383–394.
Wainwright, T. C., and D. A. Armstrong. 1993. Growth pattern in Dungeness crab (Cancer magister
Dana): synthesis of data and comparison of models. J. Crustacean Biol. 13:36–50.
Weber, D. D. 1967. Growth of the immature king crab Paralithodes camts
chatica (Tilesius). Bull. Int. N. Pac. Fish. Comm. 21:21–53. Weber, D. D., and T. Miyahara.
1962. Growth of the adult male king crab Paralithodes camtschatica (Tilesius). Fish. Bull. 62:53–75.
Wyllie-Echeverria, T. 1995. Sea ice conditions and the distribution of walleye pol
lock (Theragra chalcogramma) on the Bering and Chukchi Sea Shelf. In Climate change and northern fish populations (R. J. Beamish, ed.), p. 131–136. Can. Spec. Publ. Fish. Aquat. Sci. 121.
Zheng, J. M., and G. H. Kruse. 2000. Recruitment patterns of Alaskan crabs in relation to
decadal shifts in climate and physical oceanography. ICES J. Mar. Sci. 57:438–451.
Zheng, J., M.C. Murphy, and G. H. Kruse. 1995a. A length-based population model and stock-recruit
ment relationships for red king crab, Paralithodes camtschaticus, in Bristol Bay. Can. J. Fish. Aquat. Sci. 52:1229–1246.
1995b. Updated length-based population model and stockrecruitment relationship for red king crab in Bristol Bay, Alaska. Alsk. Fish. Res. Bull. 2:114–124.