growth management for technology companies high tech management program module 5
TRANSCRIPT
Growth Management for Technology Companies
High Tech Management Program
Module 5

DESCRIBING THE CURRENT CORPORATE PORTFOLIO OF
PRODUCTS, MARKETS, OPERATIONS AND
PROCESSES

LISTING PRODUCTS, SERVICES MARKETS AND OPERATIONS
• Product/Service A– Markets:
• Market A.1 Export through agent– Segment A.1.1 Export through distributors– Segment A.1.2
• Market A.2 Manufacturing through outsourcer, selling through own selling personnel
• Market A.3 Licensing
• Product/Service B– Markets
• Market B.1 Basic Research, selling through agent– Segment B.1.1– Segment B.1.2
• Market B.2– Segment B.2.1
LISTING PRODUCTS, SERVICES MARKETS AND OPERATIONS
• Product/Service A
• Product/Service B
• Product/Service C
• Product/Service D

Strategic Importance/Profitability Product Portfolio Map
Pro
fita
bil
ity Positive
Negative
Strategic Importance
HighLow

CREATE YOUR OWN PRODUCT PORTFOLIO MAPS
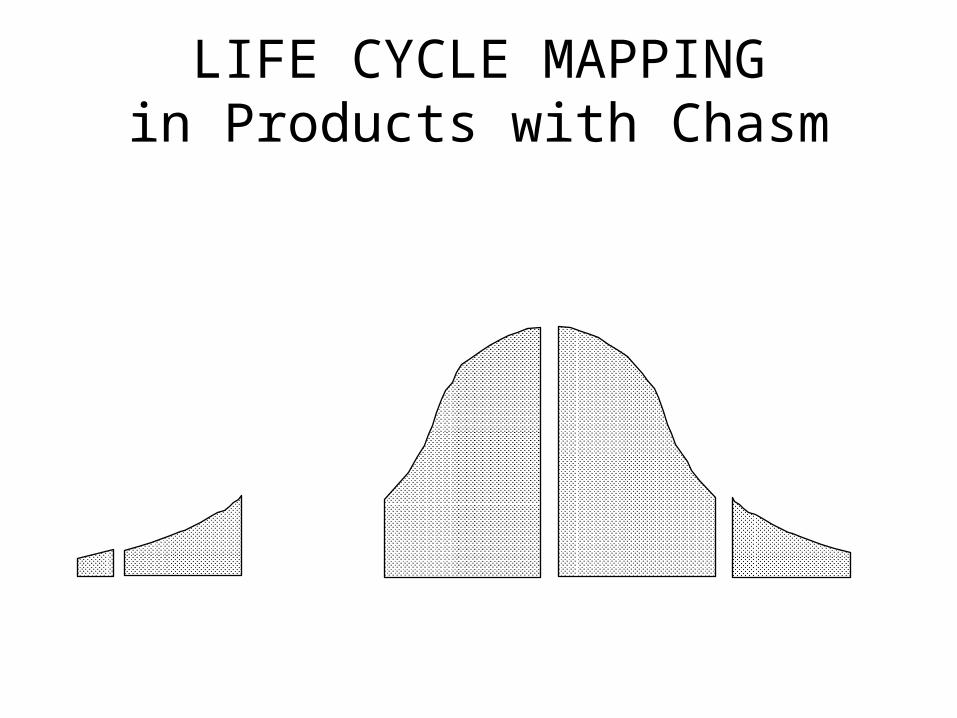
LIFE CYCLE MAPPINGin Products with Chasm
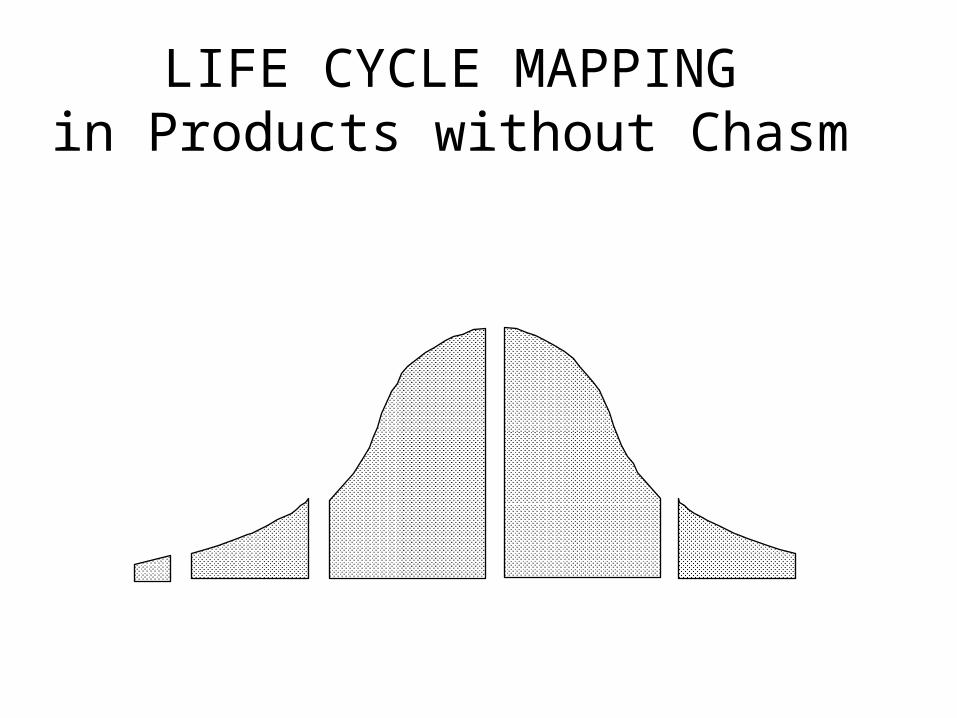
LIFE CYCLE MAPPINGin Products without Chasm
THE PROCESS OF EXCELLENCE
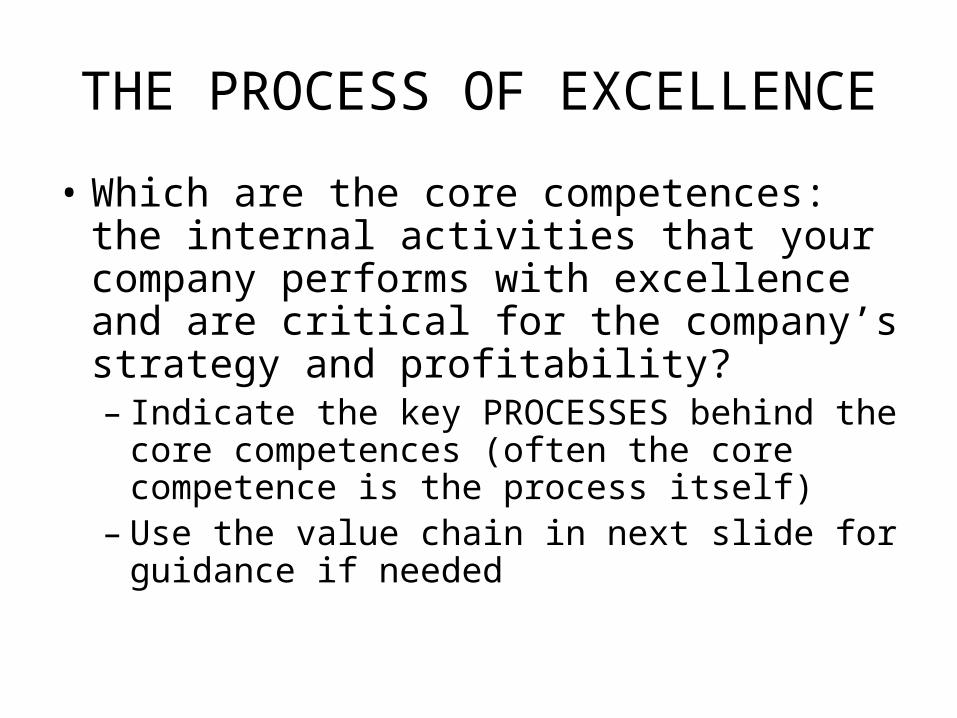
• Which are the core competences: the internal activities that your company performs with excellence and are critical for the company’s strategy and profitability?– Indicate the key PROCESSES behind the
core competences (often the core competence is the process itself)
– Use the value chain in next slide for guidance if needed
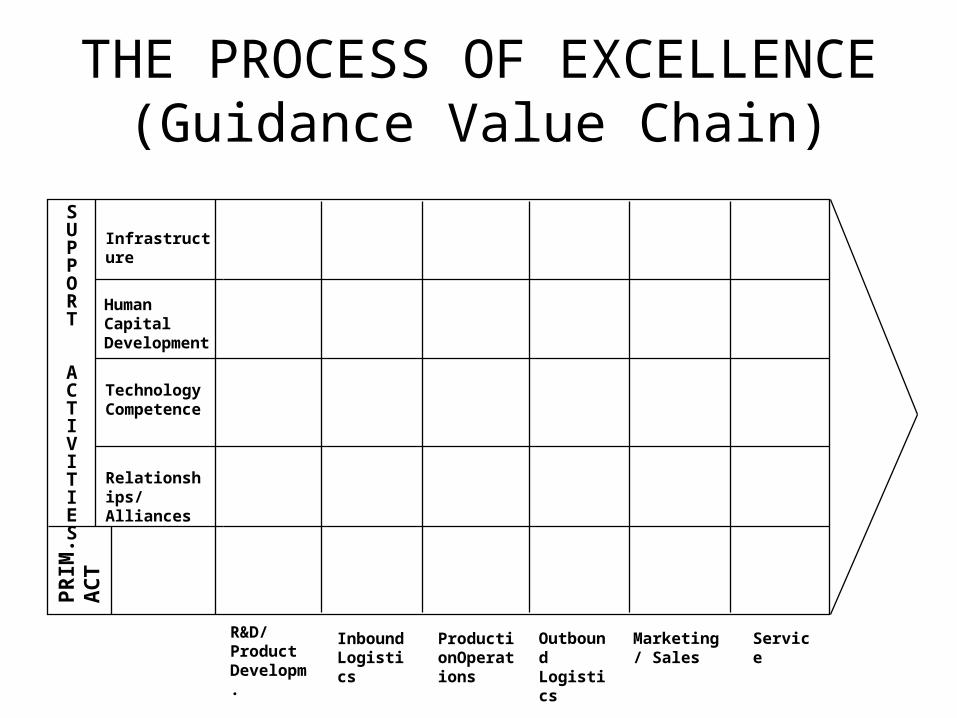
THE PROCESS OF EXCELLENCE (Guidance Value Chain)
SUPPORT
ACTIVITIES
Infrastructure
Human Capital Development
Technology Competence
Relationships/Alliances
PR
IM.
AC
T
Inbound Logistics
ProductionOperations
Outbound Logistics
Marketing / Sales
ServiceR&D/ Product Developm.
• Core Competences– A)
• Processes:– – –
– B)• Processes
– – –
– C)• Processes
– – –
–
THE PROCESS OF EXCELLENCE
BUSINESS UNIT X / COMPANY X GROWTH INTENSITY CHART
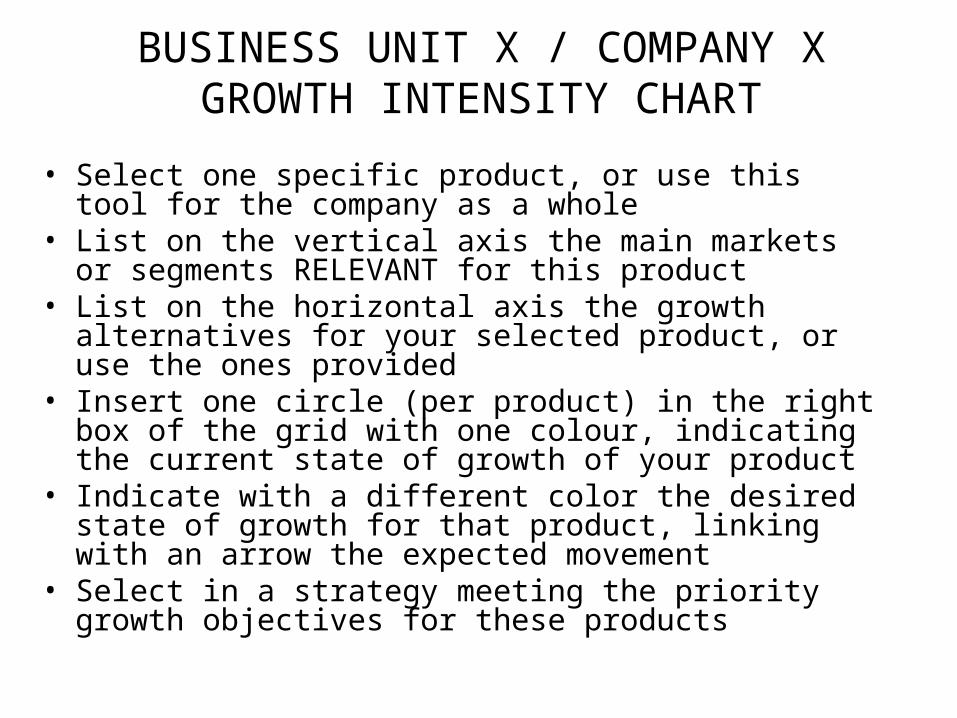
• Select one specific product, or use this tool for the company as a whole
• List on the vertical axis the main markets or segments RELEVANT for this product
• List on the horizontal axis the growth alternatives for your selected product, or use the ones provided
• Insert one circle (per product) in the right box of the grid with one colour, indicating the current state of growth of your product
• Indicate with a different color the desired state of growth for that product, linking with an arrow the expected movement
• Select in a strategy meeting the priority growth objectives for these products
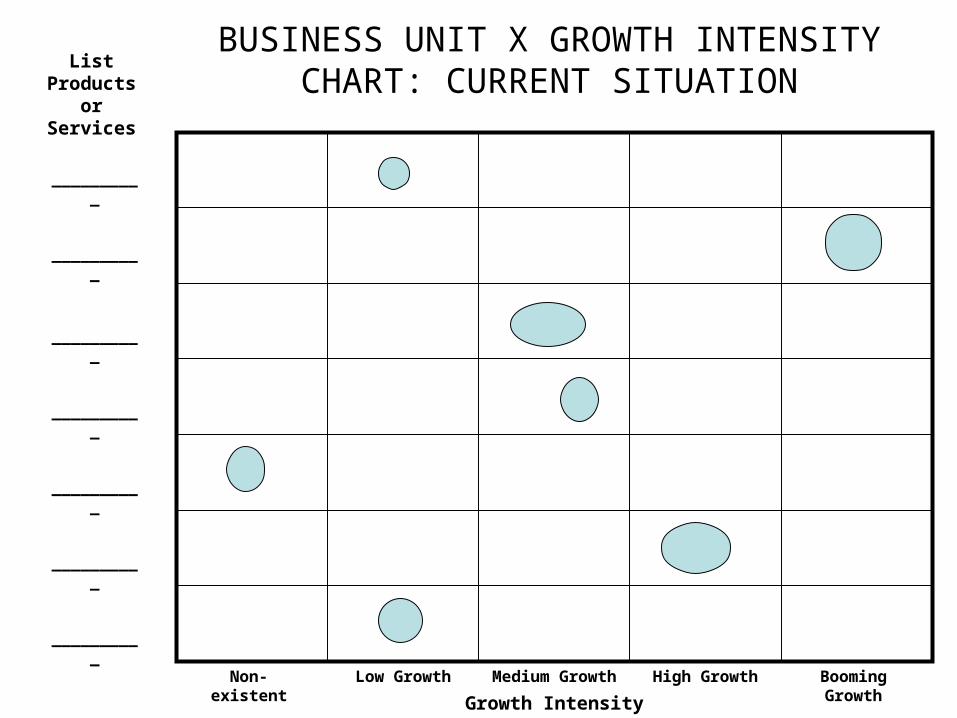
BUSINESS UNIT X GROWTH INTENSITY CHART: CURRENT SITUATION
__________
Non-existent Low Growth Medium Growth High Growth Booming GrowthGrowth Intensity
__________
__________
__________
__________
__________
__________
List Products or
Services
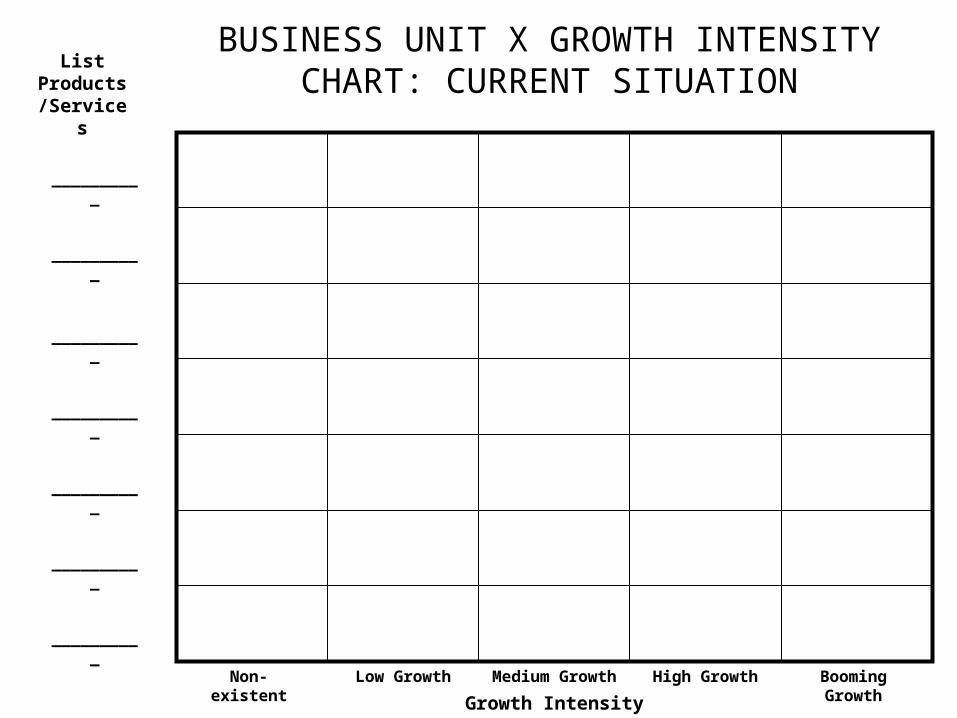
__________
Non-existent Low Growth Medium Growth High Growth Booming GrowthGrowth Intensity
__________
__________
__________
__________
__________
__________
List Products/Services
BUSINESS UNIT X GROWTH INTENSITY CHART: CURRENT SITUATION
CREATING GROWTH THROUGH A PORTFOLIO
OF PROJECTS
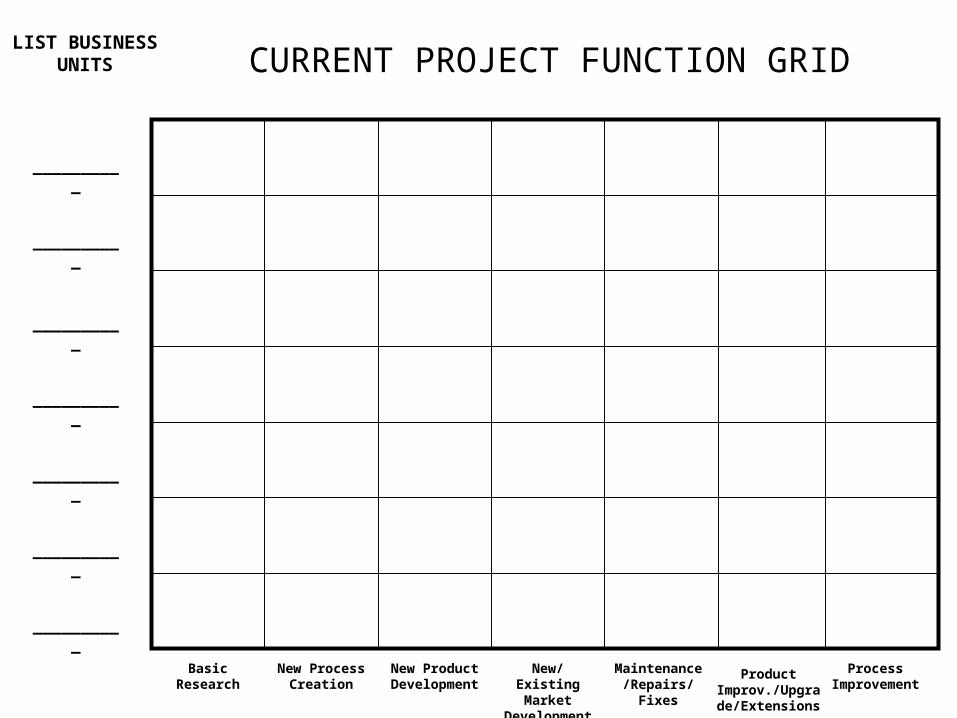
CURRENT PROJECT FUNCTION GRID
__________
Basic Research
__________
__________
__________
__________
__________
__________
LIST BUSINESS UNITS
Process Improvement
Product Improv./Upgrade
/Extensions
New Process Creation
New Product Development
Maintenance/Repairs/Fixes
New/Existing Market
Development
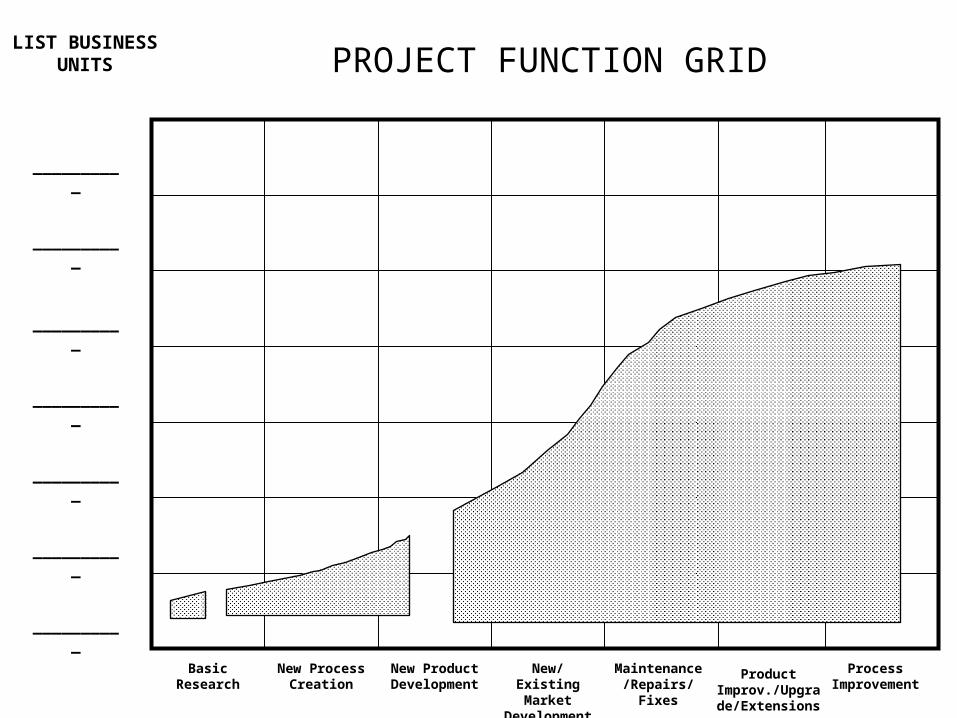
PROJECT FUNCTION GRID
__________
Basic Research
__________
__________
__________
__________
__________
__________
LIST BUSINESS UNITS
Process Improvement
Product Improv./Upgrade
/Extensions
New Process Creation
New Product Development
Maintenance/Repairs/Fixes
New/Existing Market
Development
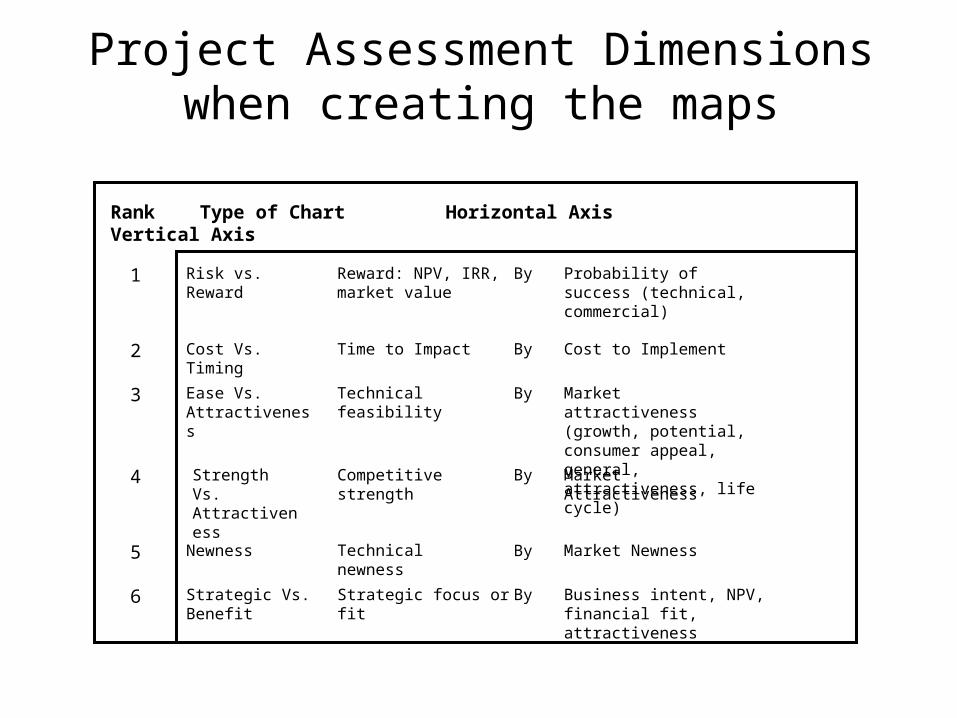
Project Assessment Dimensions when creating the maps
Rank Type of Chart Horizontal Axis Vertical Axis
1
2
4
3
5
6
Risk vs. Reward Reward: NPV, IRR, market value
By Probability of success (technical, commercial)
Cost Vs. Timing Time to Impact By Cost to Implement
Ease Vs. Attractiveness
Technical feasibility By Market attractiveness (growth, potential, consumer appeal, general, attractiveness, life cycle)
Strength Vs. Attractiveness
Competitive strength Market Attractiveness
Newness Technical newness Market Newness
Strategic Vs. Benefit
Strategic focus or fit Business intent, NPV, financial fit, attractiveness
By
By
By
CREATE YOUR OWN PROJECT PORTFOLIO ASSESSMENT MAPS

CREATE YOUR OWN PROJECT PORTFOLIO ASSESSMENT MAPS

CREATE YOUR OWN PROJECT PORTFOLIO ASSESSMENT MAPS

Basic Research Project Ranking
PROJECTProbability of
Technical Success
Probability of High Growth
Platform
Technical gap with
competition
Compatible with existing
skill base
Time to completion
Availability of technical resources and skills
Technical simplicity
Financial resources required
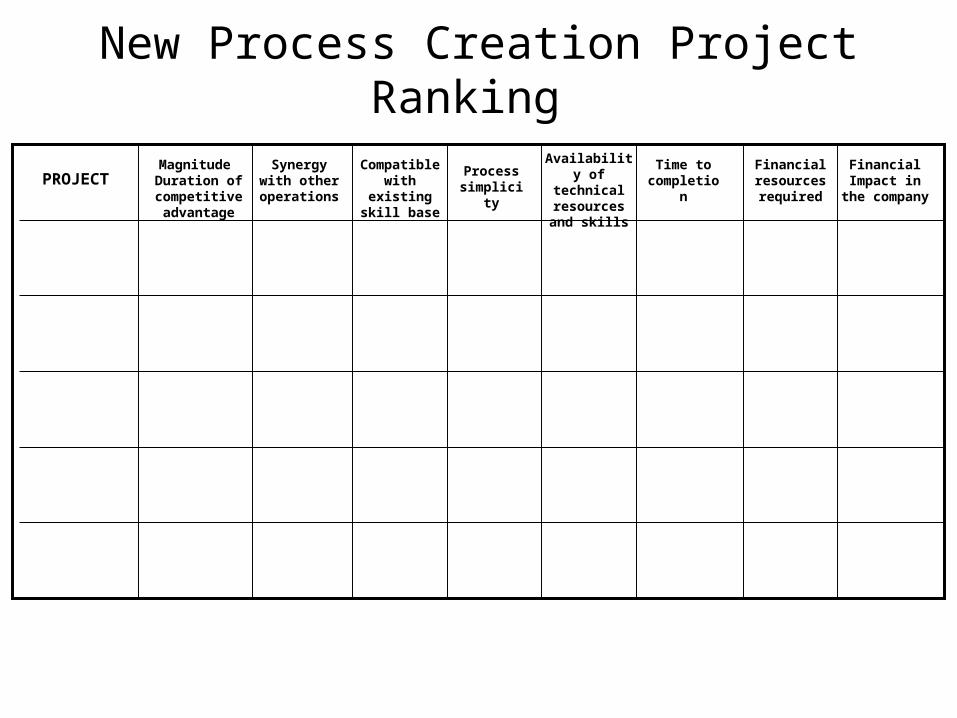
New Process Creation Project Ranking
PROJECTFinancial
Impact in the company
Magnitude Duration of competitive advantage
Synergy with other
operations
Compatible with existing
skill base
Time to completion
Availability of technical resources and skills
Process simplicity
Financial resources required

New Product Development Project Ranking (I)
PROJECTStrategic
Impact in the company
Possibility of proprietary
position
Platform for growth
Durability of competitive advantage
Technolog. simplicity
Availability of technical resources and skills
Synergy with other products
Market need

New Product Development Project Ranking (II)
PROJECTEase of
Competition in that market
Predictability of
commercial success
Compliance with legal /
social regulations
Time to completion
Financial Resources Required
Financial Impact in
the company

Market Development Project Ranking
PROJECTImpact in the
companyMarket Size Market
growth potential
High Margin potential
Market simplicity
Time to completion
Synergy with other marketing operations
Financial resources required
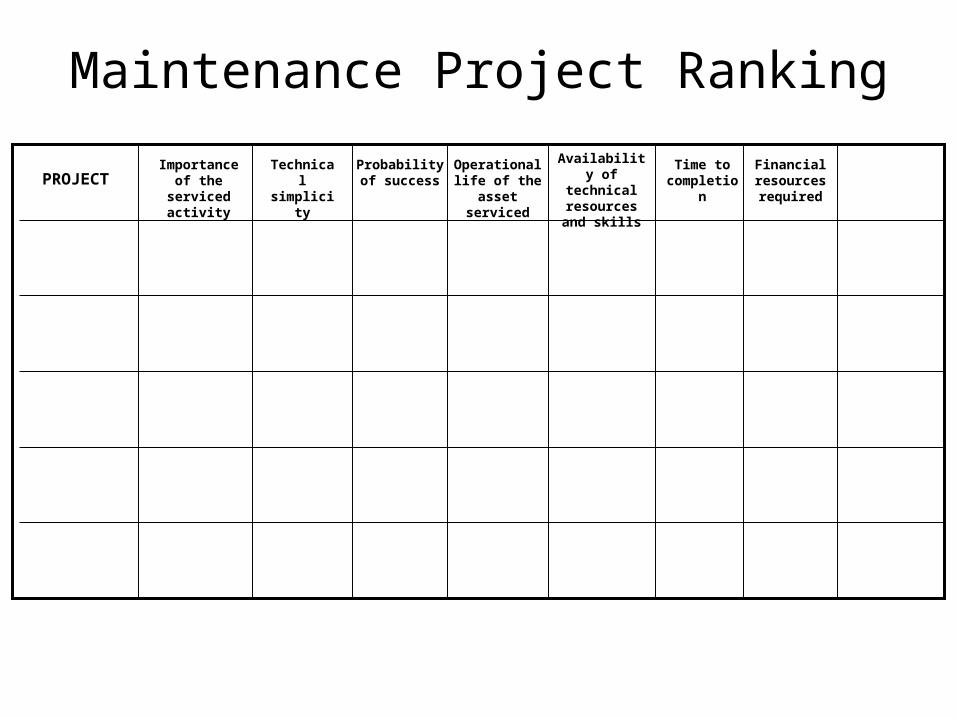
Maintenance Project Ranking
PROJECTImportance of the serviced
activity
Probability of success
Operational life of the
asset serviced
Time to completion
Availability of technical resources and skills
Technical simplicity
Financial resources required
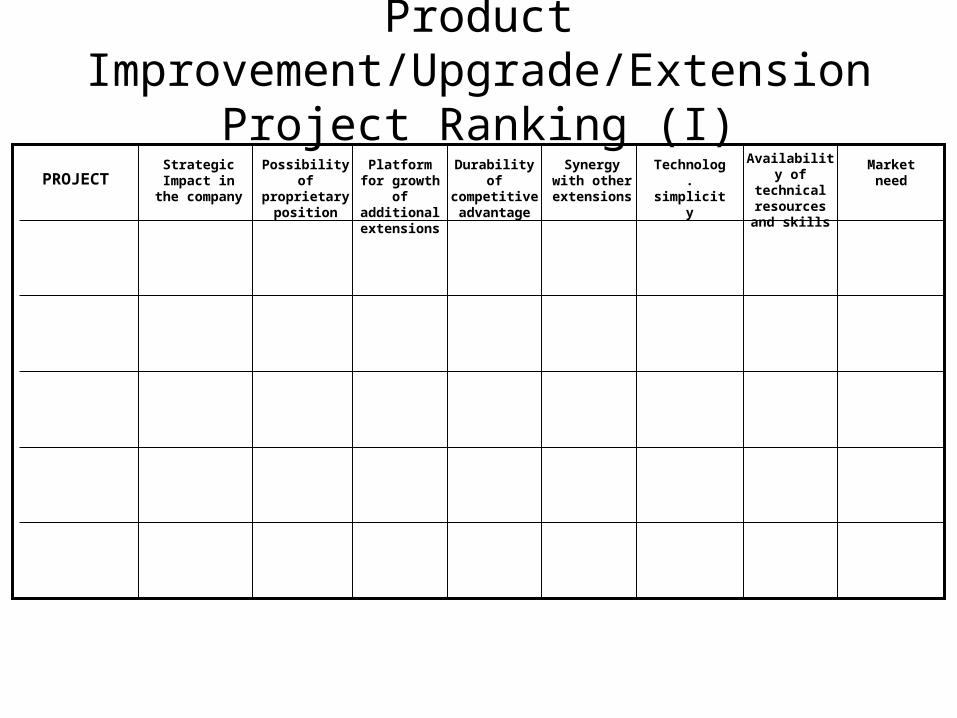
Product Improvement/Upgrade/Extension Project Ranking (I)
PROJECTStrategic
Impact in the company
Possibility of proprietary
position
Platform for growth of additional extensions
Durability of competitive advantage
Technolog. simplicity
Availability of technical resources and skills
Synergy with other extensions
Market need
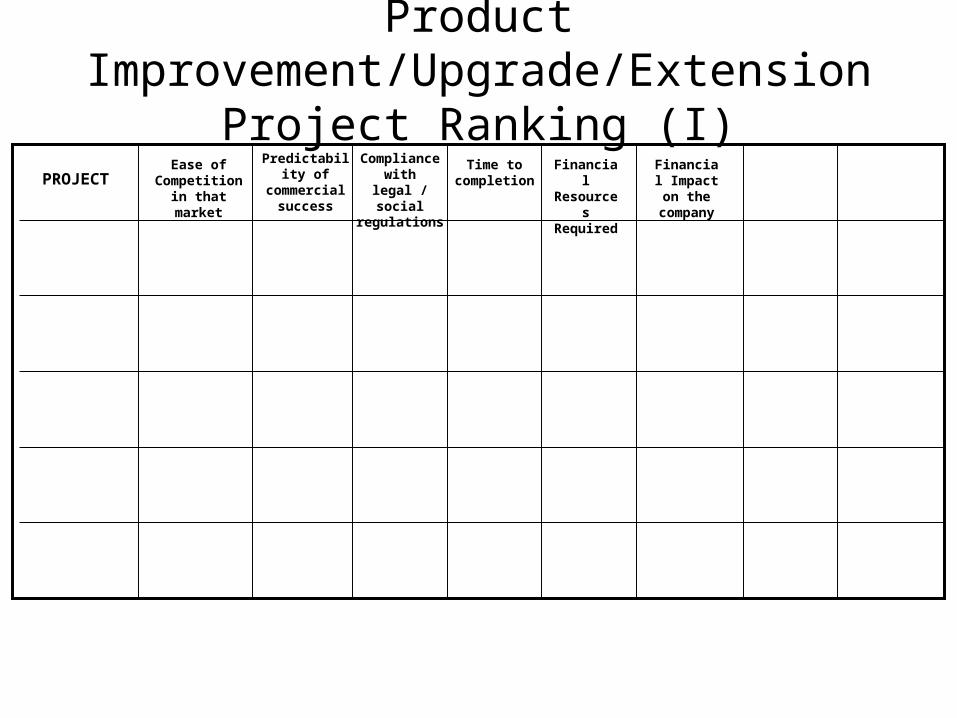
PROJECTEase of
Competition in that market
Predictability of
commercial success
Compliance with legal /
social regulations
Time to completion
Financial Resources Required
Product Improvement/Upgrade/Extension Project Ranking (I)
Financial Impact on
the company
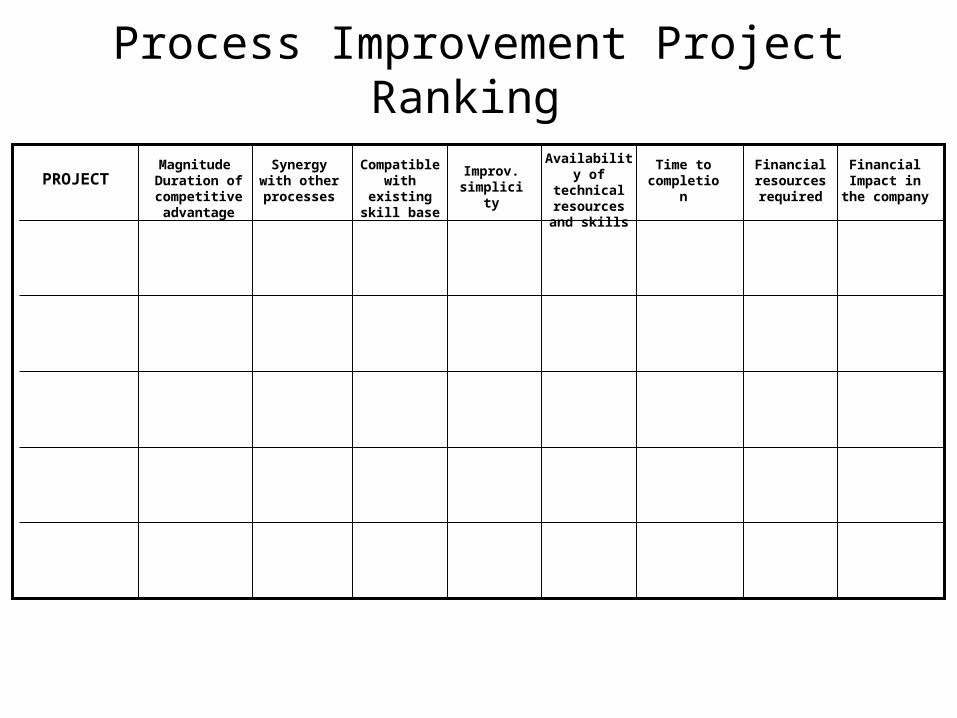
Process Improvement Project Ranking
PROJECTFinancial
Impact in the company
Magnitude Duration of competitive advantage
Synergy with other
processes
Compatible with existing
skill base
Time to completion
Availability of technical resources and skills
Improv. simplicity
Financial resources required
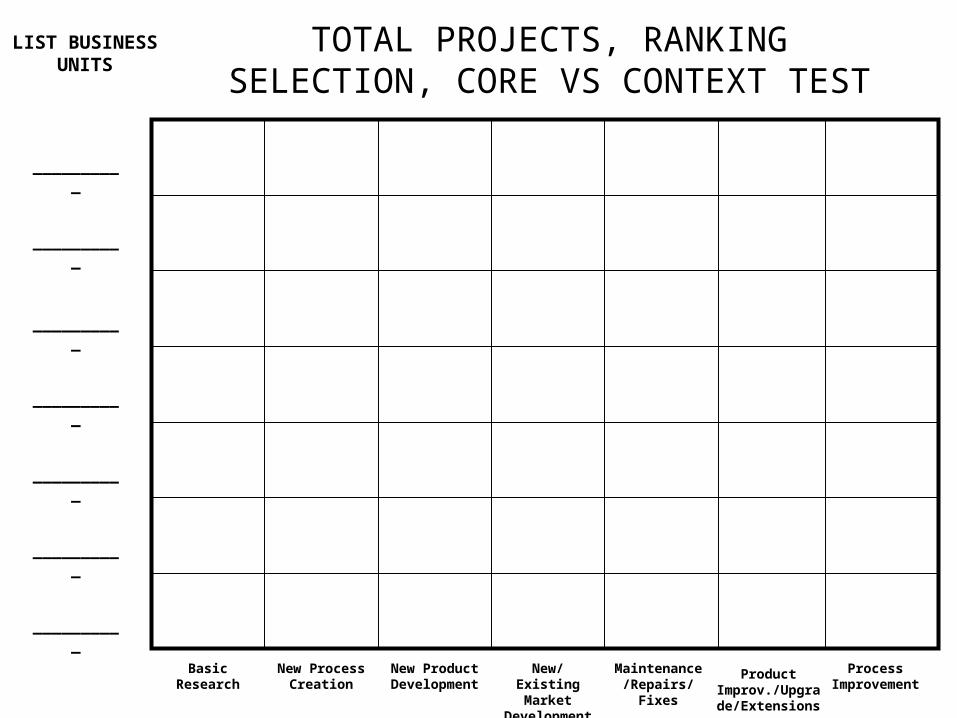
TOTAL PROJECTS, RANKING SELECTION, CORE VS CONTEXT TEST
__________
Basic Research
__________
__________
__________
__________
__________
__________
LIST BUSINESS UNITS
Process Improvement
Product Improv./Upgrade
/Extensions
New Process Creation
New Product Development
Maintenance/Repairs/Fixes
New/Existing Market
Development
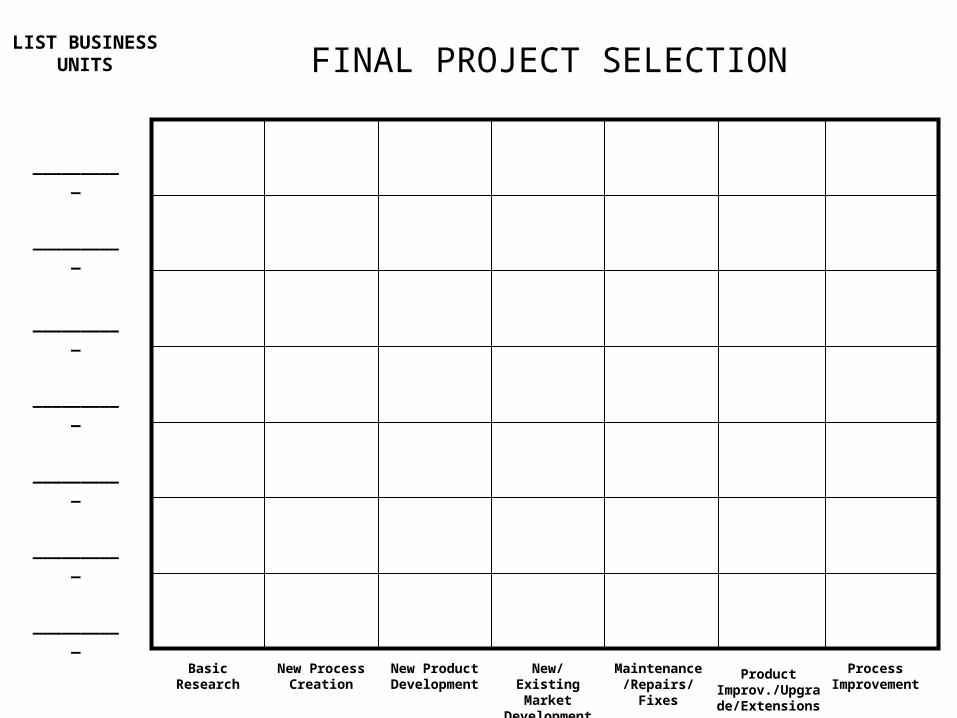
FINAL PROJECT SELECTION
__________
Basic Research
__________
__________
__________
__________
__________
__________
LIST BUSINESS UNITS
Process Improvement
Product Improv./Upgrade
/Extensions
New Process Creation
New Product Development
Maintenance/Repairs/Fixes
New/Existing Market
Development

INTERNAL PROCESS RESULTS EXPECTED
• Basic Research Results
• New Product Creation
• Product Improvements Benchmarking
• Product Portfolio Diversification
• Process Excellence
• New Process Creation
• Quality achievements

BUSINESS UNIT X GROWTH INTENSITY CHART: CURRENT SITUATION
__________
Non-existent Low Growth Medium Growth High Growth Booming GrowthGrowth Intensity
__________
__________
__________
__________
__________
__________
List Products or
Services
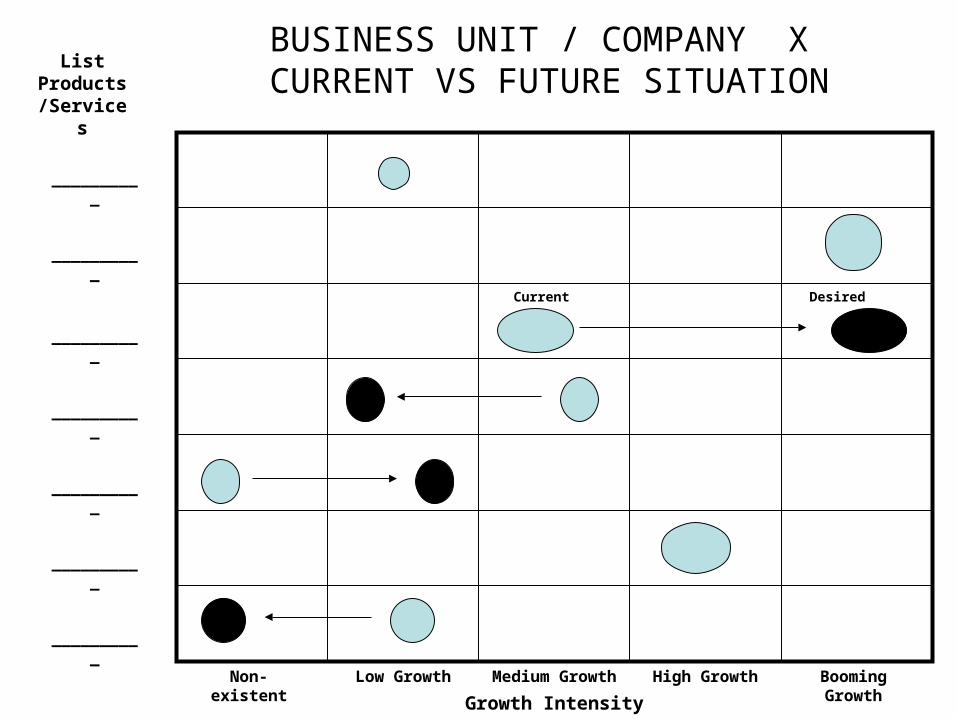
BUSINESS UNIT / COMPANY X CURRENT VS FUTURE SITUATION
__________
Non-existent Low Growth Medium Growth High Growth Booming GrowthGrowth Intensity
Current
__________
__________
__________
__________
__________
__________
List Products/Services
Desired

__________
Non-existent Low Growth Medium Growth High Growth Booming GrowthGrowth Intensity
__________
__________
__________
__________
__________
__________
List Products/Services
BUSINESS UNIT X GROWTH INTENSITY CHART: CURRENT VS FUTURE SITUATION

MARKETING RESULTS EXPECTED
• Market Development Rates– Market Share increase in existing markets– New Market Development Rate– Repeating Customers Purchasing Rate
• Customer Satisfaction Rates• Customer Base Diversification• Customer Awareness Rates• Brand related rates• Customer Image Rates• Other relevant marketing rates

FINANCIAL RESULTS EXPECTED
• Sales Growth Rates• Profitability Increase Rates
– Pricing Increases– Cost Reductions– Margin Increases– Benchmark with competition
• Return on Investment Rates• Debt reduction rates• Stock market price rates• Other relevant financial rates

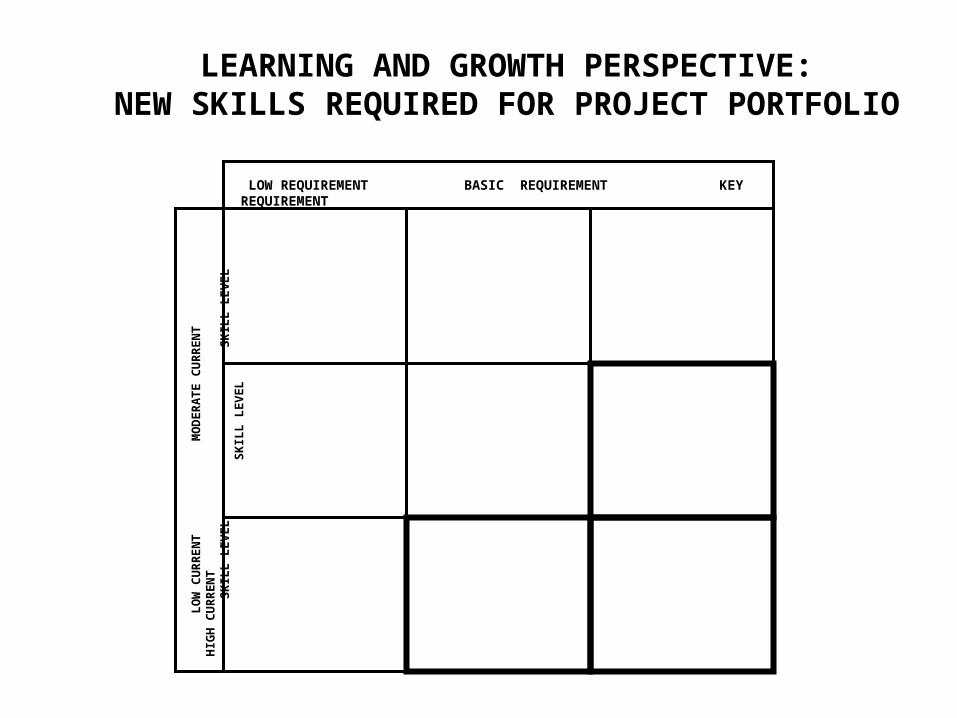
LOW REQUIREMENT BASIC REQUIREMENT KEY REQUIREMENT
L
OW
CU
RR
EN
T
M
OD
ER
AT
E C
UR
RE
NT
HIG
H C
UR
RE
NT
SK
ILL
LE
VE
L
S
KIL
L L
EV
EL
SK
ILL
LE
VE
L
LEARNING AND GROWTH PERSPECTIVE:NEW SKILLS REQUIRED FOR PROJECT PORTFOLIO
LOW REQUIREMENT BASIC REQUIREMENT KEY REQUIREMENT
L
OW
CU
RR
EN
T
M
OD
ER
AT
E C
UR
RE
NT
HIG
H C
UR
RE
NT
SK
ILL
LE
VE
L
S
KIL
L L
EV
EL
SK
ILL
LE
VE
L
LEARNING AND GROWTH PERSPECTIVE:NEW SKILLS REQUIRED FOR PROJECT PORTFOLIO

Leading
Leading
Lagging
Lagging
Soft
Soft
Hard
Hard
Vision &
Strategy
Vision &
Strategy
CUSTOMERCUSTOMER
“To achieve our vision, how should we appear to our customers?”
“To achieve our vision, how should we appear to our customers?”
ObjectivesObjectives MeasuresMeasures TargetsTargets
FINANCIALFINANCIAL
“To succeed financially, how should we appear to our shareholders?”
“To succeed financially, how should we appear to our shareholders?”
ObjectivesObjectives MeasuresMeasures TargetsTargets
INTERNAL BUSINESS PROCESSES
INTERNAL BUSINESS PROCESSES
“To satisfy our shareholders and customers, what business processes must we excel at?”
“To satisfy our shareholders and customers, what business processes must we excel at?”
ObjectivesObjectives MeasuresMeasures TargetsTargets InitiativesInitiatives
INNOVATION AND LEARNINGINNOVATION AND LEARNING
“To achieve our vision, how will we sustain our ability to change and improve?”
“To achieve our vision, how will we sustain our ability to change and improve?”
ObjectivesObjectives MeasuresMeasures TargetsTargets InitiativesInitiatives
Creating a Growth Scorecard