growth & development raleigh · growth & development summary ... although the number of...
TRANSCRIPT
growth & developmentSummary
On the Inside
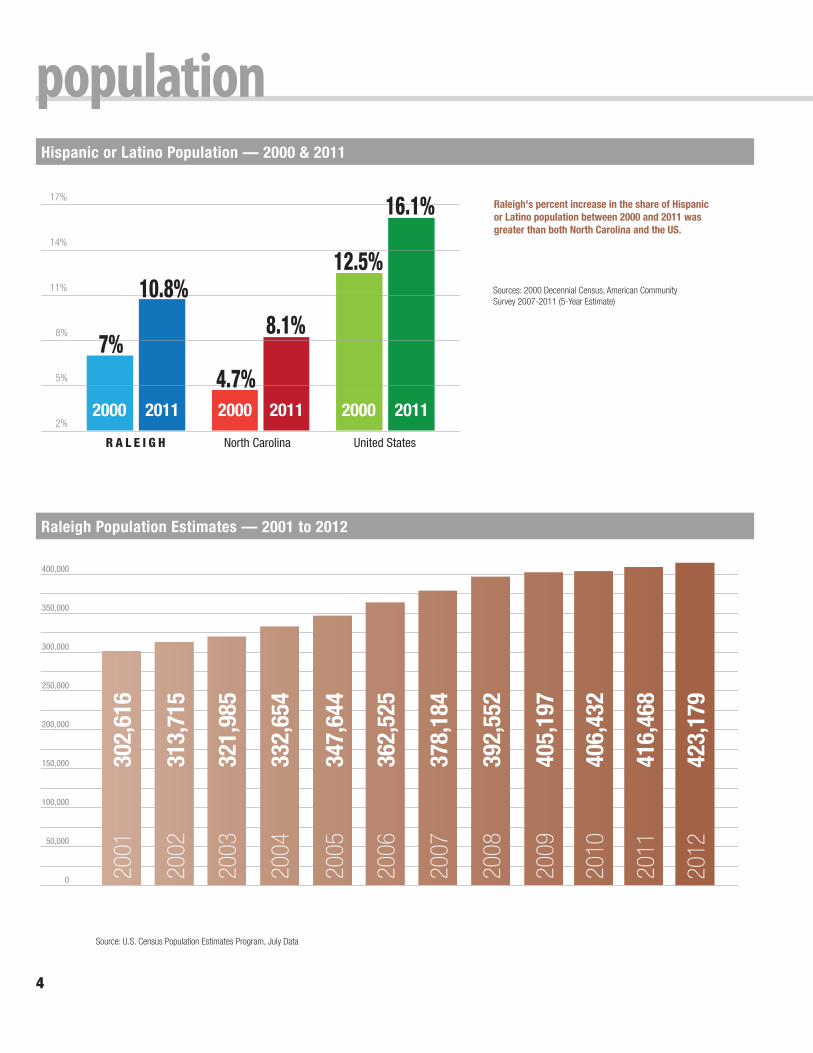
Population (see pages 3-4) Raleigh’s population as of July 2012 is 423,179, as estimated by the US Census Bureau. From 2000 to 2012 Raleigh added 147,086 persons to its corporate limits, an increase of approximately 53% since the 2000 decennial census when Raleigh’s population was measured at 276,093 persons.
Housing Units (see pages 3, 6) According to the American Community Survey (5-Year Estimate), there are 175,325 housing units in the city as of 2011. This represents an increase of 54,626 new units or 45.2% over the year 2000 figure of 120,699 from the decennial census.
Economy (see pages 9-12) The city of Raleigh’s 6.9% 2012 average unemployment rate was lower than Wake County (7.5%), the state of North Carolina (9.5%), and the US (8.1%). In 2012, the Raleigh-Cary Metropolitan Statistical Area (MSA) had the highest median family income ($79,900) among metropolitan areas in North Carolina.
Council for Community and Economic Research (C2ER) Cost of Living Index (see page 10) Compared to the National Average index of 100, for calendar year 2012, Raleigh had a Composite Index of 90.8. Of nine comparable metro areas, Raleigh had the lowest average apartment rent during 2012 at $635.
Property Tax Base and Tax Rates (see page 11) Raleigh had a property tax base of over $50.4 billion in 2012-2013. The City’s property tax base is approximately 29% commercial and 71% residential. In 2012, Raleigh also had the third-lowest property tax rate among municipalities in Wake County.
Raleigh and Extraterritorial Jurisdiction (ETJ) Non-Residential Building Activity (see page 12) For calendar year 2012, the value of new, privately owned building activity in Raleigh and the ETJ surpassed $159 million. There was an increase in the number of permits, square footage and dollar amount of office and non-residential other* development in calendar year 2012 compared to calendar year 2011. Although the number of permits did not increase for industrial development, there was a substantial increase in square footage and construction value. The total value of authorized construction (private and publicly-owned combined) was over $1.3 billion for calendar year 2012.
* Other non-residential building includes parking garages, out buildings, cell towers, etc.
Socioeconomic Comparisons ............................2
Population Estimate ...........................................4
Residential Sales ...............................................6
Residential Construction ...................................7
CITY OF RALEIGH PLANNING AND DEVELOPMENT SPRING 2013
Unemployment Rate ..........................................9
Cost of Living ...................................................10
New & Expanding Companies .........................12
Building & Development ..................................12
RALEIGH
REPORT
R A L E I G H North Carolina United States
R A L E I G H North Carolina United States
0
5
10
15
20
25
30
35
40
2000 2011 2000 2011 2000 2011
30.9
31.8
35.3
37.3
35.3
+0.9
ye
ars
+2.0
ye
ars
+1.7
ye
ars
37.0
2000
2000 2011 2000 2011
2011 2000 2011 2000 2011
72.7%
71.4%
RALE
IGH 84
%NC
77%
US 79
%
NC 84
%US
85%
NC 2
2%US
24%
NC
27%
US
28%
RALE
IGH 91
%
RALE
IGH 4
2%
RALE
IGH
47%
65.7%
64.6%
63.9%
64.8%
50
55
60
65
70
75
0
20
40
60
80
100
High school grad or higher
Bachelor’s degree or higher
R A L E I G H North Carolina United States
R A L E I G H North Carolina United States
0
5
10
15
20
25
30
35
40
2000 2011 2000 2011 2000 2011
30.9
31.8
35.3
37.3
35.3
+0.9
ye
ars
+2.0
ye
ars
+1.7
ye
ars
37.0
2000
2000 2011 2000 2011
2011 2000 2011 2000 2011
72.7%
71.4%
RALE
IGH 84
%NC
77%
US 79
%
NC 84
%US
85%
NC 2
2%US
24%
NC
27%
US
28%
RALE
IGH 91
%
RALE
IGH 4
2%
RALE
IGH
47%
65.7%
64.6%
63.9%
64.8%
50
55
60
65
70
75
0
20
40
60
80
100
High school grad or higher
Bachelor’s degree or higher
demographicsKey Socioeconomic Comparisons 2011
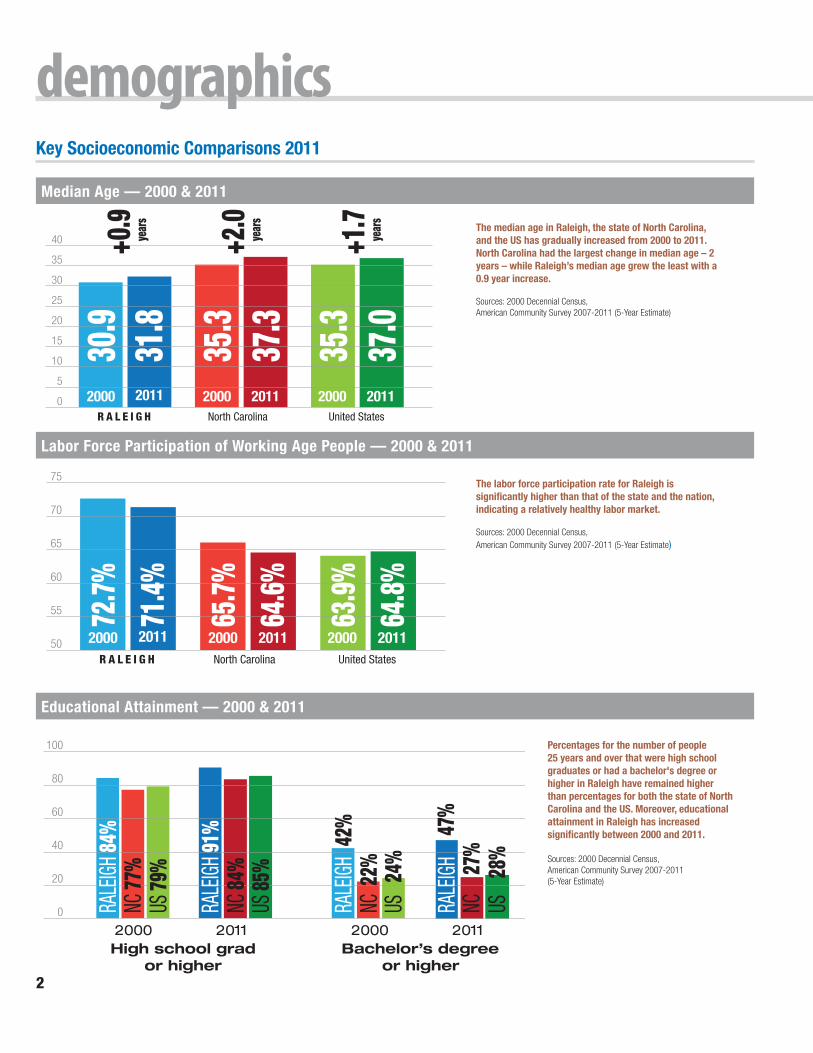
Median Age — 2000 & 2011
Labor Force Participation of Working Age People — 2000 & 2011
Educational Attainment — 2000 & 2011
The median age in Raleigh, the state of North Carolina, and the US has gradually increased from 2000 to 2011. North Carolina had the largest change in median age – 2 years – while Raleigh’s median age grew the least with a 0.9 year increase.
Sources: 2000 Decennial Census, American Community Survey 2007-2011 (5-Year Estimate)
The labor force participation rate for Raleigh is significantly higher than that of the state and the nation, indicating a relatively healthy labor market.
Sources: 2000 Decennial Census, American Community Survey 2007-2011 (5-Year Estimate)
Percentages for the number of people 25 years and over that were high school graduates or had a bachelor's degree or higher in Raleigh have remained higher than percentages for both the state of North Carolina and the US. Moreover, educational attainment in Raleigh has increased significantly between 2000 and 2011.
Sources: 2000 Decennial Census, American Community Survey 2007-2011 (5-Year Estimate)
2
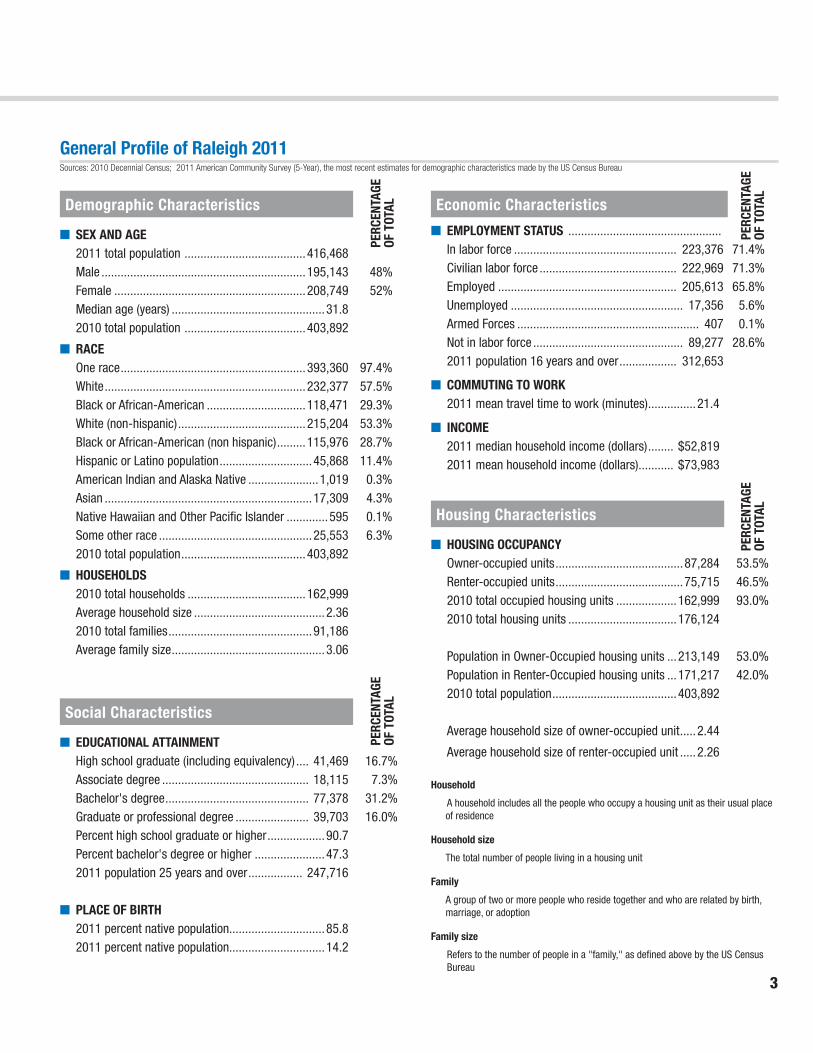
General Profile of Raleigh 2011
■ EDUCATIONAL ATTAINMENT High school graduate (including equivalency) .... 41,469 16.7% Associate degree .............................................. 18,115 7.3% Bachelor's degree ............................................. 77,378 31.2% Graduate or professional degree ....................... 39,703 16.0% Percent high school graduate or higher ..................90.7 Percent bachelor's degree or higher ......................47.3 2011 population 25 years and over ................. 247,716
■ PLACE OF BIRTH 2011 percent native population..............................85.8 2011 percent native population..............................14.2
Demographic Characteristics
Social Characteristics
Housing Characteristics
Economic Characteristics
■ SEX AND AGE 2011 total population ......................................416,468 Male ................................................................195,143 48% Female ............................................................208,749 52% Median age (years) ................................................31.8 2010 total population ......................................403,892
■RACE One race ..........................................................393,360 97.4% White ...............................................................232,377 57.5% Black or African-American ...............................118,471 29.3% White (non-hispanic) ........................................215,204 53.3% Black or African-American (non hispanic) .........115,976 28.7% Hispanic or Latino population .............................45,868 11.4% American Indian and Alaska Native ......................1,019 0.3% Asian .................................................................17,309 4.3% Native Hawaiian and Other Pacific Islander .............595 0.1% Some other race ................................................25,553 6.3% 2010 total population .......................................403,892
■HOUSEHOLDS 2010 total households .....................................162,999 Average household size .........................................2.36 2010 total families .............................................91,186 Average family size ................................................3.06
■ EMPLOYMENT STATUS ................................................ In labor force ................................................... 223,376 71.4% Civilian labor force ........................................... 222,969 71.3% Employed ........................................................ 205,613 65.8% Unemployed ...................................................... 17,356 5.6% Armed Forces ......................................................... 407 0.1% Not in labor force ............................................... 89,277 28.6% 2011 population 16 years and over .................. 312,653
■COMMUTING TO WORK 2011 mean travel time to work (minutes) ...............21.4
■ INCOME 2011 median household income (dollars) ........ $52,819 2011 mean household income (dollars) ........... $73,983
■HOUSING OCCUPANCY Owner-occupied units ........................................87,284 53.5% Renter-occupied units ........................................75,715 46.5% 2010 total occupied housing units ...................162,999 93.0% 2010 total housing units ..................................176,124
Population in Owner-Occupied housing units ...213,149 53.0% Population in Renter-Occupied housing units ...171,217 42.0% 2010 total population .......................................403,892
Average household size of owner-occupied unit .....2.44
Average household size of renter-occupied unit .....2.26 Household
A household includes all the people who occupy a housing unit as their usual place of residence
Household size
The total number of people living in a housing unit
Family
A group of two or more people who reside together and who are related by birth, marriage, or adoption
Family size
Refers to the number of people in a "family," as defined above by the US Census Bureau
PERC
ENTA
GE
OF T
OTAL
PERC
ENTA
GE
OF T
OTAL
PERC
ENTA
GE
OF T
OTAL
PERC
ENTA
GE
OF T
OTAL
Sources: 2010 Decennial Census; 2011 American Community Survey (5-Year), the most recent estimates for demographic characteristics made by the US Census Bureau
3
2%
5%
8%
11%
14%
17%
R A L E I G H North Carolina United States
2000 2011 2000 2011 2000 2011
7%
10.8%
4.7%
8.1%
12.5%
16.1%
0
50,000
100,000
150,000
200,000
250,000
300,000
350,000
400,000
2001
30
2,61
6
2002
31
3,71
5
2003
32
1,98
5
2004
33
2,65
4
2005
34
7,64
4
2007
37
8,18
4
2006
36
2,52
5
2012
42
3,17
9
2008
39
2,55
2
2009
40
5,19
7
2010
40
6,43
2
2011
41
6,46
8
populationHispanic or Latino Population — 2000 & 2011
Raleigh Population Estimates — 2001 to 2012
Raleigh's percent increase in the share of Hispanic or Latino population between 2000 and 2011 was greater than both North Carolina and the US.
Sources: 2000 Decennial Census, American Community Survey 2007-2011 (5-Year Estimate)
Source: U.S. Census Population Estimates Program, July Data
4
0
100,000
200,000
300,000
400,000
500,000
600,000
700,000
2010
421
,587
2020
510
,175
2040
683
,035
2030
596
,580
Growth 2010 to 2040
261,448 people
62%
% Growth 2010 to 2040
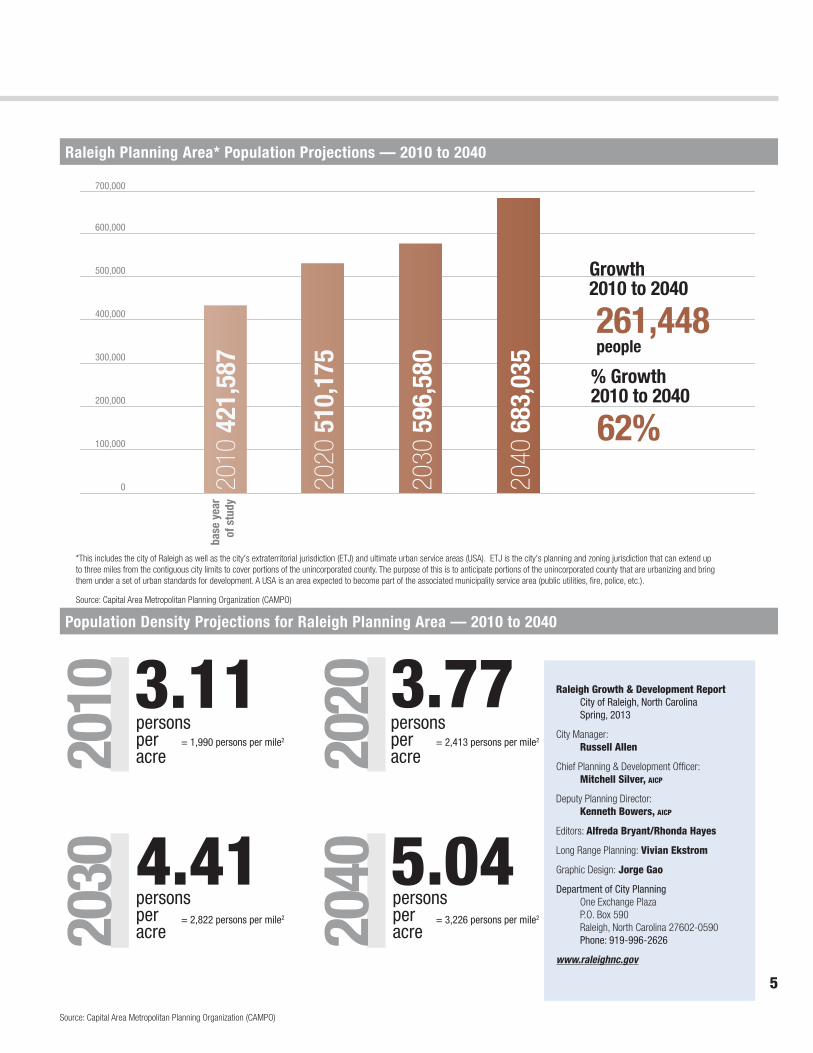
Raleigh Planning Area* Population Projections — 2010 to 2040
ba
se y
ear
of s
tudy
*This includes the city of Raleigh as well as the city's extraterritorial jurisdiction (ETJ) and ultimate urban service areas (USA). ETJ is the city's planning and zoning jurisdiction that can extend up to three miles from the contiguous city limits to cover portions of the unincorporated county. The purpose of this is to anticipate portions of the unincorporated county that are urbanizing and bring them under a set of urban standards for development. A USA is an area expected to become part of the associated municipality service area (public utilities, fire, police, etc.).
Source: Capital Area Metropolitan Planning Organization (CAMPO)
Source: Capital Area Metropolitan Planning Organization (CAMPO)
Population Density Projections for Raleigh Planning Area — 2010 to 2040
3.11persons per acre
persons per acre
persons per acre
persons per acre
3.77
4.41 5.04
Raleigh Growth & Development Report City of Raleigh, North Carolina Spring, 2013
City Manager: Russell Allen
Chief Planning & Development Officer: Mitchell Silver, aicp
Deputy Planning Director: Kenneth Bowers, aicp
Editors: Alfreda Bryant/Rhonda Hayes
Long Range Planning: Vivian Ekstrom
Graphic Design: Jorge Gao
Department of City PlanningOne Exchange PlazaP.O. Box 590Raleigh, North Carolina 27602-0590Phone: 919-996-2626
www.raleighnc.gov
2010
2030
2020
2040
= 1,990 persons per mile2 = 2,413 persons per mile2
= 2,822 persons per mile2 = 3,226 persons per mile2
5
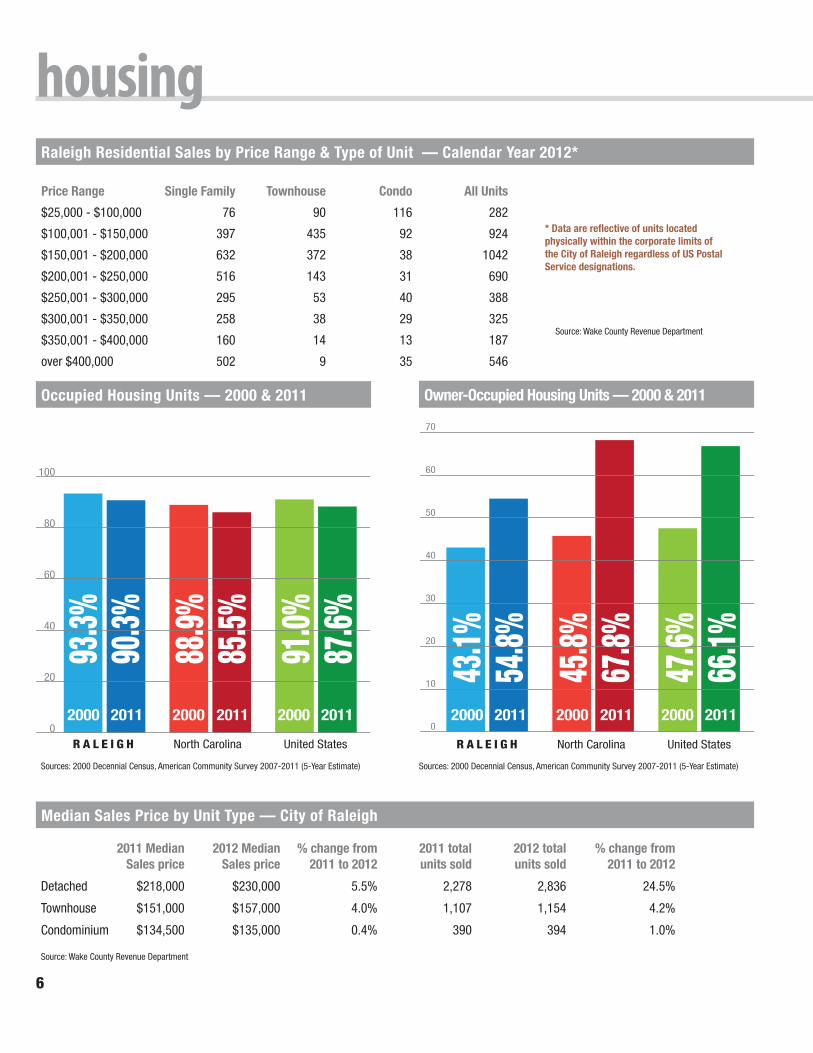
housingRaleigh Residential Sales by Price Range & Type of Unit — Calendar Year 2012*
Price Range Single Family Townhouse Condo All Units
$25,000 - $100,000 76 90 116 282
$100,001 - $150,000 397 435 92 924
$150,001 - $200,000 632 372 38 1042
$200,001 - $250,000 516 143 31 690
$250,001 - $300,000 295 53 40 388
$300,001 - $350,000 258 38 29 325
$350,001 - $400,000 160 14 13 187
over $400,000 502 9 35 546
* Data are reflective of units located physically within the corporate limits of the City of Raleigh regardless of US Postal Service designations.
Median Sales Price by Unit Type — City of Raleigh
2011 Median 2012 Median % change from 2011 total 2012 total % change from Sales price Sales price 2011 to 2012 units sold units sold 2011 to 2012
Detached $218,000 $230,000 5.5% 2,278 2,836 24.5%
Townhouse $151,000 $157,000 4.0% 1,107 1,154 4.2%
Condominium $134,500 $135,000 0.4% 390 394 1.0%
Source: Wake County Revenue Department
90.3%
0
20
40
60
80
100
2000 2011 2000 2011 2000 2011
2000 2011 2000 2011 2000 20110
10
20
30
40
50
60
70
93.3%
88.9%
85.5%
91.0%
87.6%
43.1%
45.8%
67.8%
47.6%
66.1%
54.8%
R A L E I G H North Carolina United States
R A L E I G H North Carolina United States
Occupied Housing Units — 2000 & 2011
Sources: 2000 Decennial Census, American Community Survey 2007-2011 (5-Year Estimate)
90.3%
0
20
40
60
80
100
2000 2011 2000 2011 2000 2011
2000 2011 2000 2011 2000 20110
10
20
30
40
50
60
70
93.3%
88.9%
85.5%
91.0%
87.6%
43.1%
45.8%
67.8%
47.6%
66.1%
54.8%
R A L E I G H North Carolina United States
R A L E I G H North Carolina United States
Owner-Occupied Housing Units — 2000 & 2011
Sources: 2000 Decennial Census, American Community Survey 2007-2011 (5-Year Estimate)
Source: Wake County Revenue Department
6
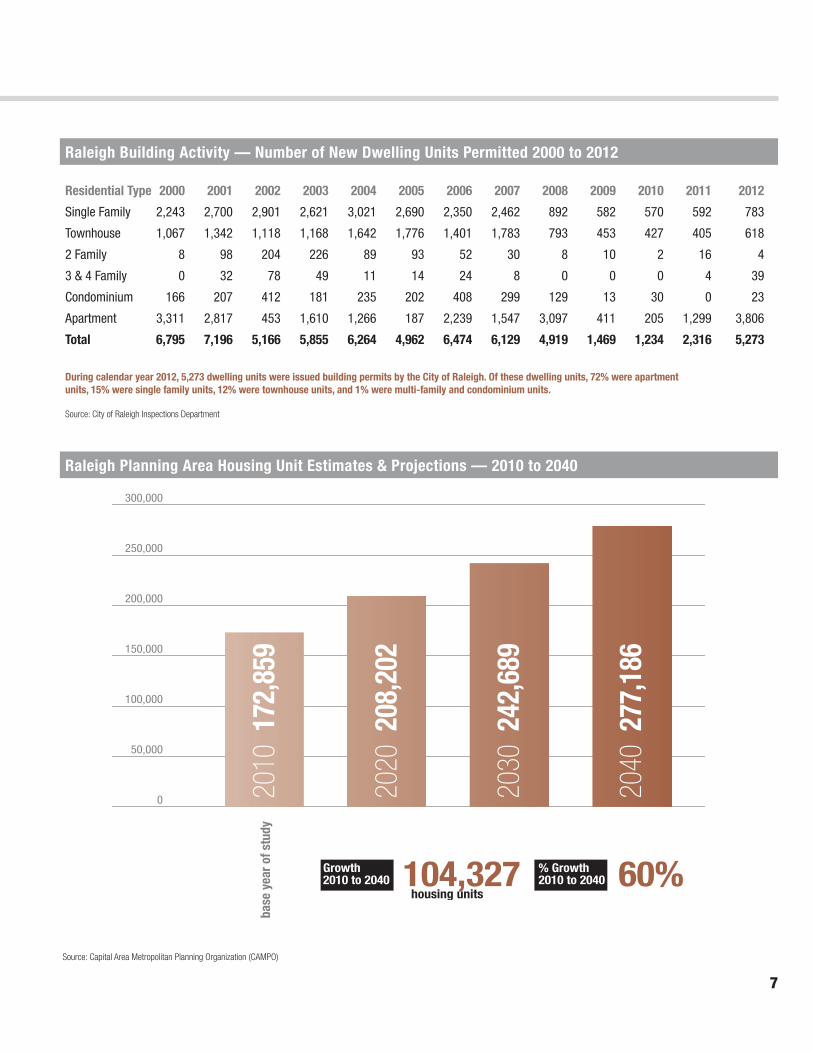
Raleigh Building Activity — Number of New Dwelling Units Permitted 2000 to 2012
Raleigh Planning Area Housing Unit Estimates & Projections — 2010 to 2040
Residential Type 2000 2001 2002 2003 2004 2005 2006 2007 2008 2009 2010 2011 2012
Single Family 2,243 2,700 2,901 2,621 3,021 2,690 2,350 2,462 892 582 570 592 783
Townhouse 1,067 1,342 1,118 1,168 1,642 1,776 1,401 1,783 793 453 427 405 618
2 Family 8 98 204 226 89 93 52 30 8 10 2 16 4
3 & 4 Family 0 32 78 49 11 14 24 8 0 0 0 4 39
Condominium 166 207 412 181 235 202 408 299 129 13 30 0 23
Apartment 3,311 2,817 453 1,610 1,266 187 2,239 1,547 3,097 411 205 1,299 3,806
Total 6,795 7,196 5,166 5,855 6,264 4,962 6,474 6,129 4,919 1,469 1,234 2,316 5,273
During calendar year 2012, 5,273 dwelling units were issued building permits by the City of Raleigh. Of these dwelling units, 72% were apartment units, 15% were single family units, 12% were townhouse units, and 1% were multi-family and condominium units.
Source: City of Raleigh Inspections Department
0
50,000
100,000
150,000
200,000
250,000
300,000
350,000
400,000
450,000
2010
172
,859
2020
208
,202
2030
242
,689
2040
277
,186
Growth 2010 to 2040 104,327
housing units 60%% Growth
2010 to 2040
0
50,000
100,000
150,000
200,000
250,000
300,000
350,000
400,000
450,000
2010
172
,859
2020
208
,202
2030
242
,689
2040
277
,186
Growth 2010 to 2040 104,327
housing units 60%% Growth
2010 to 2040
Source: Capital Area Metropolitan Planning Organization (CAMPO)
ba
se y
ear o
f stu
dy
7
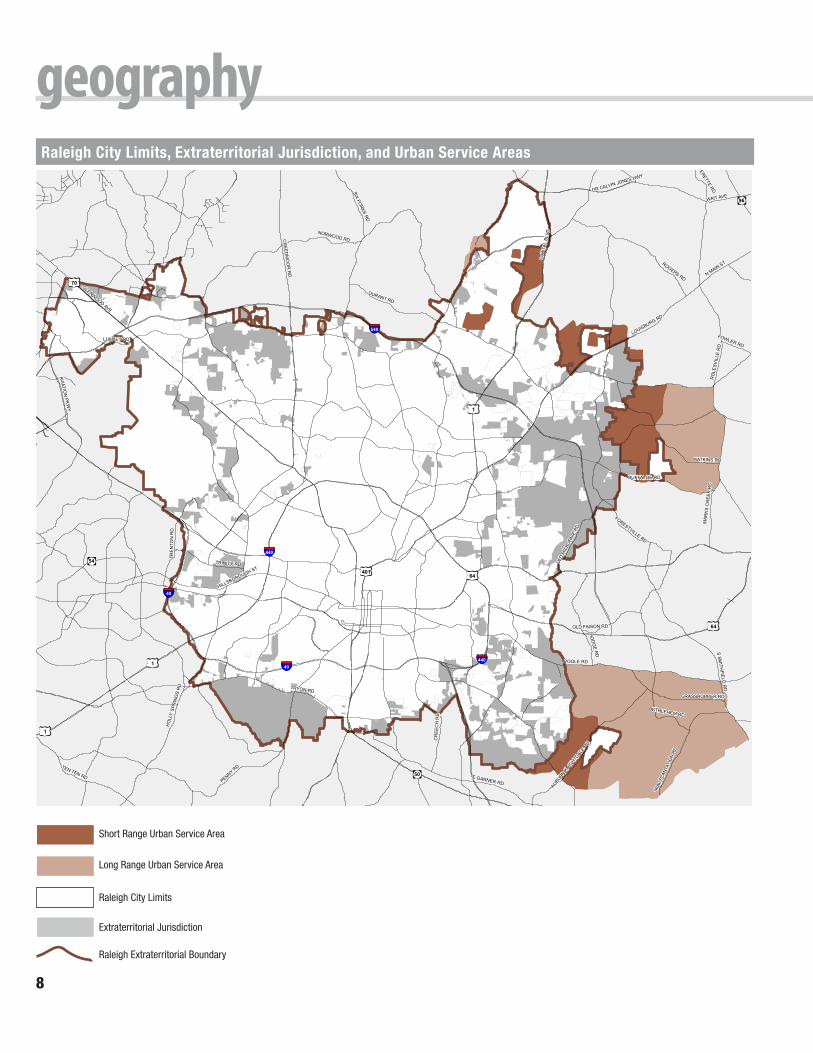
geography
TRINITY RD
N MAIN ST
GRASSHOPPER RD
WATKINS RD
AVERETTE RD
E GARNER RD
WAIT AVE
FORESTVILLE RD
LUMLEY RD
AVIATION
PKW
Y
OLD
MIL
BURN
IE R
D
CR
EEC
H R
D
GLENWOOD AVE
RO
LESV
ILLE
RD
LOUISBURG RD
DR CALVIN JONES HWY
NORWOOD RD
MAR
KS
CR
EEK
RD
TRYON RD
CAP
ITAL
BLV
D
BETHLEHEM RD
FOWLER RD
HO
LLY
SPR
ING
S R
D
AUBU
RN KNIG
HTDALE
RD
SIX FORKS RD
POOLE RD
HO
DG
E RD
CR
EEDM
OO
R R
D
DURANT RD
MIA
L PL
ANTA
TIO
N RD
OLD FAISON RD
PENNY RD
S SMITH
FIELD
RD
TEN TEN RD
BUFFALOE RD
HILLSBOROUGH ST
ROGERS RD
TRE
NTO
N R
D
540
40440
40
440
1
64
401
70
64
1
1
50
96
54
City Limits
Extraterritorial Jurisdiction
Extraterritorial Jurisdiction Boundary
Short Range Urban Services Area
Long Range Urban Services Area
Short Range Urban Service Area
Long Range Urban Service Area
Raleigh City Limits
Extraterritorial Jurisdiction
Raleigh Extraterritorial Boundary
Raleigh City Limits, Extraterritorial Jurisdiction, and Urban Service Areas
8
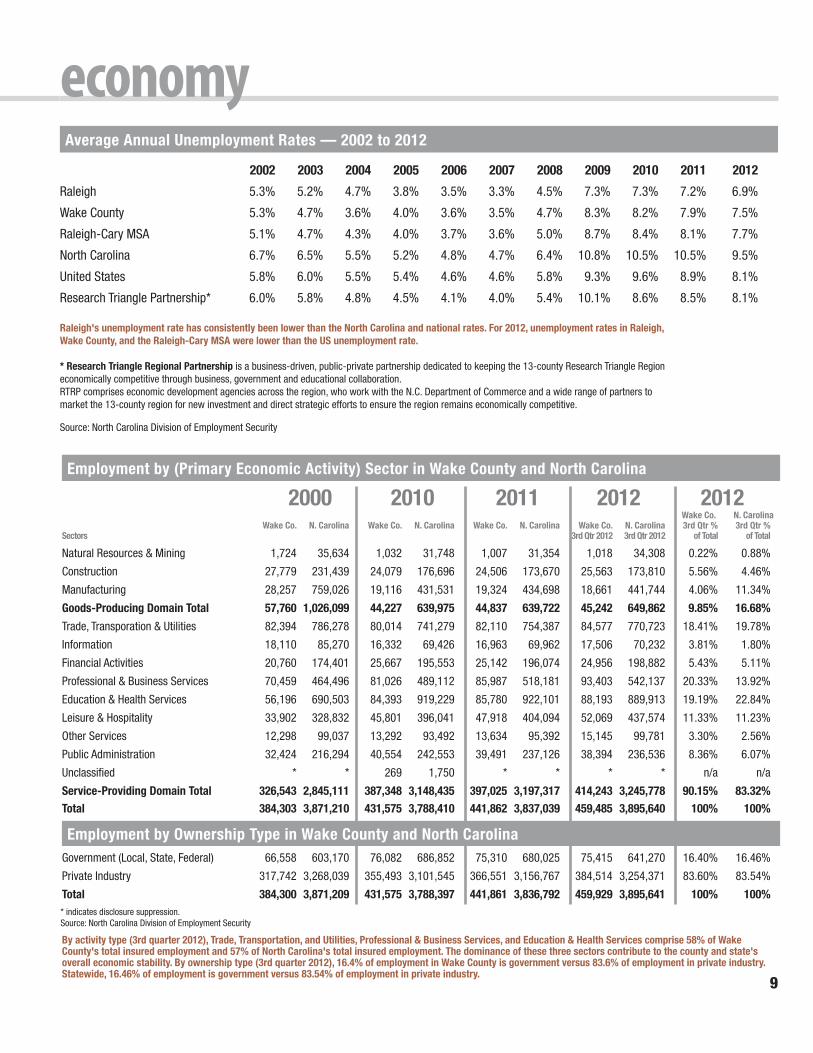
economyAverage Annual Unemployment Rates — 2002 to 2012
2002 2003 2004 2005 2006 2007 2008 2009 2010 2011 2012
Raleigh 5.3% 5.2% 4.7% 3.8% 3.5% 3.3% 4.5% 7.3% 7.3% 7.2% 6.9%
Wake County 5.3% 4.7% 3.6% 4.0% 3.6% 3.5% 4.7% 8.3% 8.2% 7.9% 7.5%
Raleigh-Cary MSA 5.1% 4.7% 4.3% 4.0% 3.7% 3.6% 5.0% 8.7% 8.4% 8.1% 7.7%
North Carolina 6.7% 6.5% 5.5% 5.2% 4.8% 4.7% 6.4% 10.8% 10.5% 10.5% 9.5%
United States 5.8% 6.0% 5.5% 5.4% 4.6% 4.6% 5.8% 9.3% 9.6% 8.9% 8.1%
Research Triangle Partnership* 6.0% 5.8% 4.8% 4.5% 4.1% 4.0% 5.4% 10.1% 8.6% 8.5% 8.1%
Raleigh's unemployment rate has consistently been lower than the North Carolina and national rates. For 2012, unemployment rates in Raleigh, Wake County, and the Raleigh-Cary MSA were lower than the US unemployment rate.
* Research Triangle Regional Partnership is a business-driven, public-private partnership dedicated to keeping the 13-county Research Triangle Region economically competitive through business, government and educational collaboration.RTRP comprises economic development agencies across the region, who work with the N.C. Department of Commerce and a wide range of partners to market the 13-county region for new investment and direct strategic efforts to ensure the region remains economically competitive.
Source: North Carolina Division of Employment Security
Employment by (Primary Economic Activity) Sector in Wake County and North Carolina
2000 2010 2011 2012 2012 Wake Co. N. Carolina Wake Co. N. Carolina Wake Co. N. Carolina Wake Co. N. Carolina Wake Co. N. Carolina 3rd Qtr % 3rd Qtr %Sectors 3rd Qtr 2012 3rd Qtr 2012 of Total of Total
Natural Resources & Mining 1,724 35,634 1,032 31,748 1,007 31,354 1,018 34,308 0.22% 0.88%
Construction 27,779 231,439 24,079 176,696 24,506 173,670 25,563 173,810 5.56% 4.46%
Manufacturing 28,257 759,026 19,116 431,531 19,324 434,698 18,661 441,744 4.06% 11.34%
Goods-Producing Domain Total 57,760 1,026,099 44,227 639,975 44,837 639,722 45,242 649,862 9.85% 16.68%
Trade, Transporation & Utilities 82,394 786,278 80,014 741,279 82,110 754,387 84,577 770,723 18.41% 19.78%
Information 18,110 85,270 16,332 69,426 16,963 69,962 17,506 70,232 3.81% 1.80%
Financial Activities 20,760 174,401 25,667 195,553 25,142 196,074 24,956 198,882 5.43% 5.11%
Professional & Business Services 70,459 464,496 81,026 489,112 85,987 518,181 93,403 542,137 20.33% 13.92%
Education & Health Services 56,196 690,503 84,393 919,229 85,780 922,101 88,193 889,913 19.19% 22.84%
Leisure & Hospitality 33,902 328,832 45,801 396,041 47,918 404,094 52,069 437,574 11.33% 11.23%
Other Services 12,298 99,037 13,292 93,492 13,634 95,392 15,145 99,781 3.30% 2.56%
Public Administration 32,424 216,294 40,554 242,553 39,491 237,126 38,394 236,536 8.36% 6.07%
Unclassified * * 269 1,750 * * * * n/a n/a
Service-Providing Domain Total 326,543 2,845,111 387,348 3,148,435 397,025 3,197,317 414,243 3,245,778 90.15% 83.32%Total 384,303 3,871,210 431,575 3,788,410 441,862 3,837,039 459,485 3,895,640 100% 100%
Government (Local, State, Federal) 66,558 603,170 76,082 686,852 75,310 680,025 75,415 641,270 16.40% 16.46%
Private Industry 317,742 3,268,039 355,493 3,101,545 366,551 3,156,767 384,514 3,254,371 83.60% 83.54%
Total 384,300 3,871,209 431,575 3,788,397 441,861 3,836,792 459,929 3,895,641 100% 100%* indicates disclosure suppression.Source: North Carolina Division of Employment Security
By activity type (3rd quarter 2012), Trade, Transportation, and Utilities, Professional & Business Services, and Education & Health Services comprise 58% of Wake County's total insured employment and 57% of North Carolina's total insured employment. The dominance of these three sectors contribute to the county and state's overall economic stability. By ownership type (3rd quarter 2012), 16.4% of employment in Wake County is government versus 83.6% of employment in private industry. Statewide, 16.46% of employment is government versus 83.54% of employment in private industry.
Employment by Ownership Type in Wake County and North Carolina
9
economy
Metro/Micro 100% Misc. Urban Area Composite Grocery Transpor- Health Goodsand State Index Items Housing Utilities tation Care & Services"Atlanta, GA(Atlanta-Sandy Springs-Marietta GA Metro)" 96.9 106.4 84.2 93.2 105.0 101.1 101.1"Austin, TX (Austin-Round Rock TX Metro)" 95.6 89.7 87.7 93.2 99.6 104.5 102.8"Charlotte, NC(Charlotte-Gastonia-Concord NC-SC Metro)" 94.7 103.2 81.3 100.1 96.9 97.4 99.4"Jacksonville, FL (Jacksonville FL Metro)" 96.7 100.0 84.7 104.3 108.5 87.3 100.0"Nashville-Franklin, TN(Nashville-Davidson-Murfreesboro TN Metro)" 88.9 95.7 74 87.1 93.9 85.9 97.7"Orlando, FL(Orlando-Kissimmee FL Metro)" 97.7 100.8 80.6 109.7 100.6 93.3 106.3"Raleigh, NC(Raleigh-Cary NC Metro)" 90.8 101.0 71.5 104.8 95.9 93.6 95.7"Richmond, VA (Richmond VA Metro)" 102.1 103.5 91.3 105.9 101.1 114.7 107.9"Rochester, NY (Rochester, NY Metro)" 102.8 96.7 100 98.3 109.4 101.8 106.8
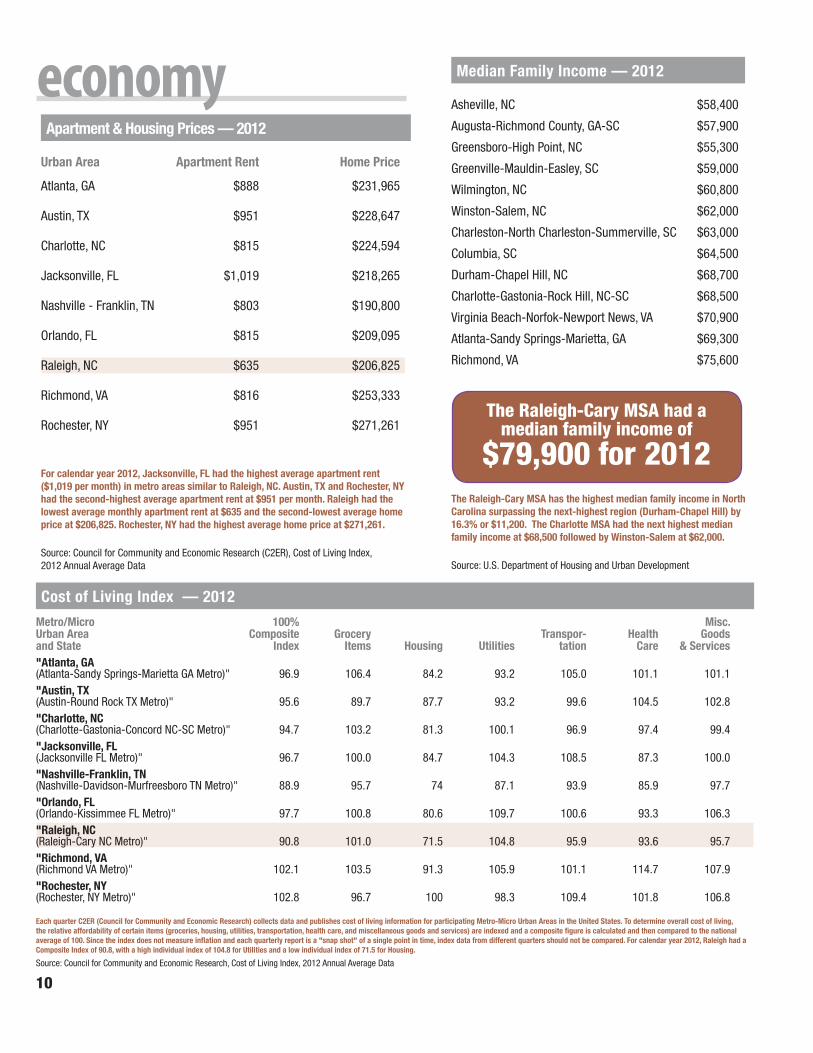
Urban Area Apartment Rent Home Price
Atlanta, GA $888 $231,965
Austin, TX $951 $228,647
Charlotte, NC $815 $224,594
Jacksonville, FL $1,019 $218,265
Nashville - Franklin, TN $803 $190,800
Orlando, FL $815 $209,095
Raleigh, NC $635 $206,825
Richmond, VA $816 $253,333
Rochester, NY $951 $271,261
Cost of Living Index — 2012
Source: Council for Community and Economic Research, Cost of Living Index, 2012 Annual Average Data
Apartment & Housing Prices — 2012
Median Family Income — 2012
Asheville, NC $58,400
Augusta-Richmond County, GA-SC $57,900
Greensboro-High Point, NC $55,300
Greenville-Mauldin-Easley, SC $59,000
Wilmington, NC $60,800
Winston-Salem, NC $62,000
Charleston-North Charleston-Summerville, SC $63,000
Columbia, SC $64,500
Durham-Chapel Hill, NC $68,700
Charlotte-Gastonia-Rock Hill, NC-SC $68,500
Virginia Beach-Norfok-Newport News, VA $70,900
Atlanta-Sandy Springs-Marietta, GA $69,300
Richmond, VA $75,600
For calendar year 2012, Jacksonville, FL had the highest average apartment rent ($1,019 per month) in metro areas similar to Raleigh, NC. Austin, TX and Rochester, NY had the second-highest average apartment rent at $951 per month. Raleigh had the lowest average monthly apartment rent at $635 and the second-lowest average home price at $206,825. Rochester, NY had the highest average home price at $271,261.
Source: Council for Community and Economic Research (C2ER), Cost of Living Index, 2012 Annual Average Data
The Raleigh-Cary MSA has the highest median family income in North Carolina surpassing the next-highest region (Durham-Chapel Hill) by16.3% or $11,200. The Charlotte MSA had the next highest median family income at $68,500 followed by Winston-Salem at $62,000.
Source: U.S. Department of Housing and Urban Development
The Raleigh-Cary MSA had amedian family income of
$79,900 for 2012
Each quarter C2ER (Council for Community and Economic Research) collects data and publishes cost of living information for participating Metro-Micro Urban Areas in the United States. To determine overall cost of living, the relative affordability of certain items (groceries, housing, utilities, transportation, health care, and miscellaneous goods and services) are indexed and a composite figure is calculated and then compared to the national average of 100. Since the index does not measure inflation and each quarterly report is a "snap shot" of a single point in time, index data from different quarters should not be compared. For calendar year 2012, Raleigh had a Composite Index of 90.8, with a high individual index of 104.8 for Utilities and a low individual index of 71.5 for Housing.
10
economy
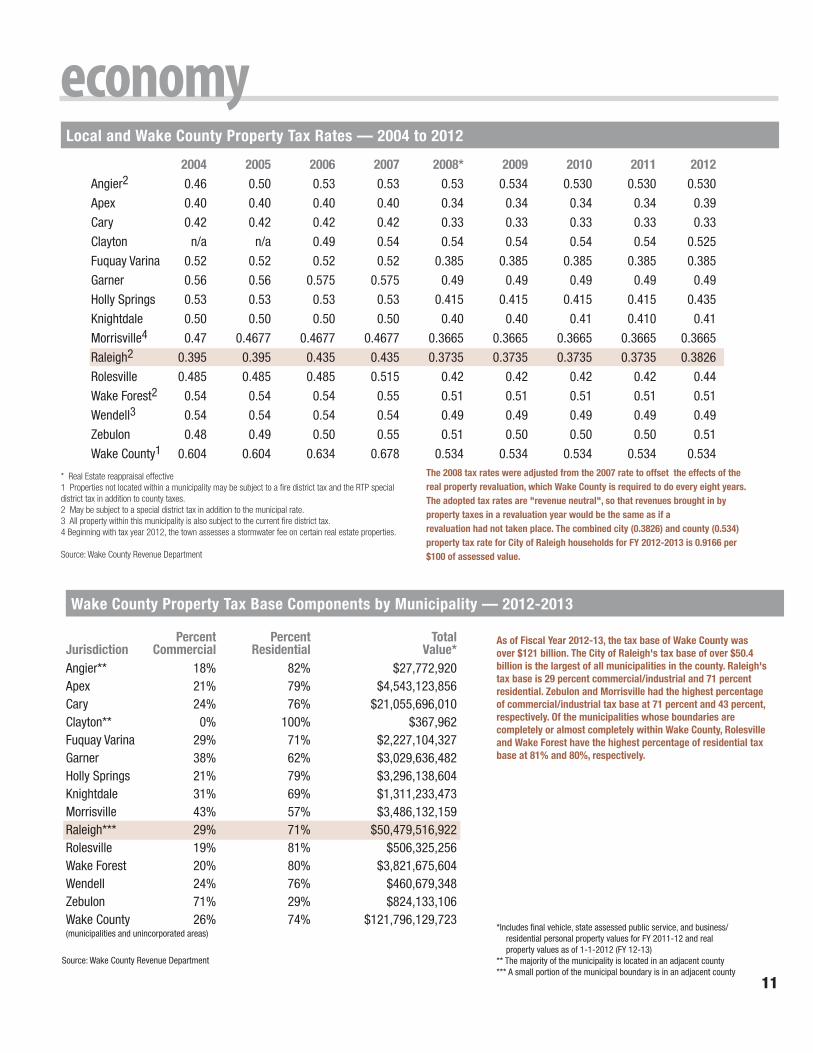
Percent Percent TotalJurisdiction Commercial Residential Value*Angier** 18% 82% $27,772,920Apex 21% 79% $4,543,123,856Cary 24% 76% $21,055,696,010Clayton** 0% 100% $367,962Fuquay Varina 29% 71% $2,227,104,327Garner 38% 62% $3,029,636,482Holly Springs 21% 79% $3,296,138,604Knightdale 31% 69% $1,311,233,473Morrisville 43% 57% $3,486,132,159Raleigh*** 29% 71% $50,479,516,922Rolesville 19% 81% $506,325,256Wake Forest 20% 80% $3,821,675,604Wendell 24% 76% $460,679,348Zebulon 71% 29% $824,133,106Wake County 26% 74% $121,796,129,723(municipalities and unincorporated areas)
Local and Wake County Property Tax Rates — 2004 to 2012
Wake County Property Tax Base Components by Municipality — 2012-2013
Source: Wake County Revenue Department
As of Fiscal Year 2012-13, the tax base of Wake County was over $121 billion. The City of Raleigh's tax base of over $50.4 billion is the largest of all municipalities in the county. Raleigh's tax base is 29 percent commercial/industrial and 71 percent residential. Zebulon and Morrisville had the highest percentage of commercial/industrial tax base at 71 percent and 43 percent, respectively. Of the municipalities whose boundaries are completely or almost completely within Wake County, Rolesville and Wake Forest have the highest percentage of residential tax base at 81% and 80%, respectively.
*In cludes final vehicle, state assessed public service, and business/residential personal property values for FY 2011-12 and real property values as of 1-1-2012 (FY 12-13)
** The majority of the municipality is located in an adjacent county*** A small portion of the municipal boundary is in an adjacent county
* Real Estate reappraisal effective1 Properties not located within a municipality may be subject to a fire district tax and the RTP special district tax in addition to county taxes.2 May be subject to a special district tax in addition to the municipal rate.3 All property within this municipality is also subject to the current fire district tax.4 Beginning with tax year 2012, the town assesses a stormwater fee on certain real estate properties.
Source: Wake County Revenue Department
The 2008 tax rates were adjusted from the 2007 rate to offset the effects of the real property revaluation, which Wake County is required to do every eight years. The adopted tax rates are "revenue neutral", so that revenues brought in by property taxes in a revaluation year would be the same as if a revaluation had not taken place. The combined city (0.3826) and county (0.534) property tax rate for City of Raleigh households for FY 2012-2013 is 0.9166 per $100 of assessed value.
2004 2005 2006 2007 2008* 2009 2010 2011 2012Angier2 0.46 0.50 0.53 0.53 0.53 0.534 0.530 0.530 0.530
Apex 0.40 0.40 0.40 0.40 0.34 0.34 0.34 0.34 0.39
Cary 0.42 0.42 0.42 0.42 0.33 0.33 0.33 0.33 0.33
Clayton n/a n/a 0.49 0.54 0.54 0.54 0.54 0.54 0.525
Fuquay Varina 0.52 0.52 0.52 0.52 0.385 0.385 0.385 0.385 0.385
Garner 0.56 0.56 0.575 0.575 0.49 0.49 0.49 0.49 0.49
Holly Springs 0.53 0.53 0.53 0.53 0.415 0.415 0.415 0.415 0.435
Knightdale 0.50 0.50 0.50 0.50 0.40 0.40 0.41 0.410 0.41
Morrisville4 0.47 0.4677 0.4677 0.4677 0.3665 0.3665 0.3665 0.3665 0.3665
Raleigh2 0.395 0.395 0.435 0.435 0.3735 0.3735 0.3735 0.3735 0.3826
Rolesville 0.485 0.485 0.485 0.515 0.42 0.42 0.42 0.42 0.44
Wake Forest2 0.54 0.54 0.54 0.55 0.51 0.51 0.51 0.51 0.51
Wendell3 0.54 0.54 0.54 0.54 0.49 0.49 0.49 0.49 0.49
Zebulon 0.48 0.49 0.50 0.55 0.51 0.50 0.50 0.50 0.51
Wake County1 0.604 0.604 0.634 0.678 0.534 0.534 0.534 0.534 0.534
11
economy
Total Value for 2012$159,563,798
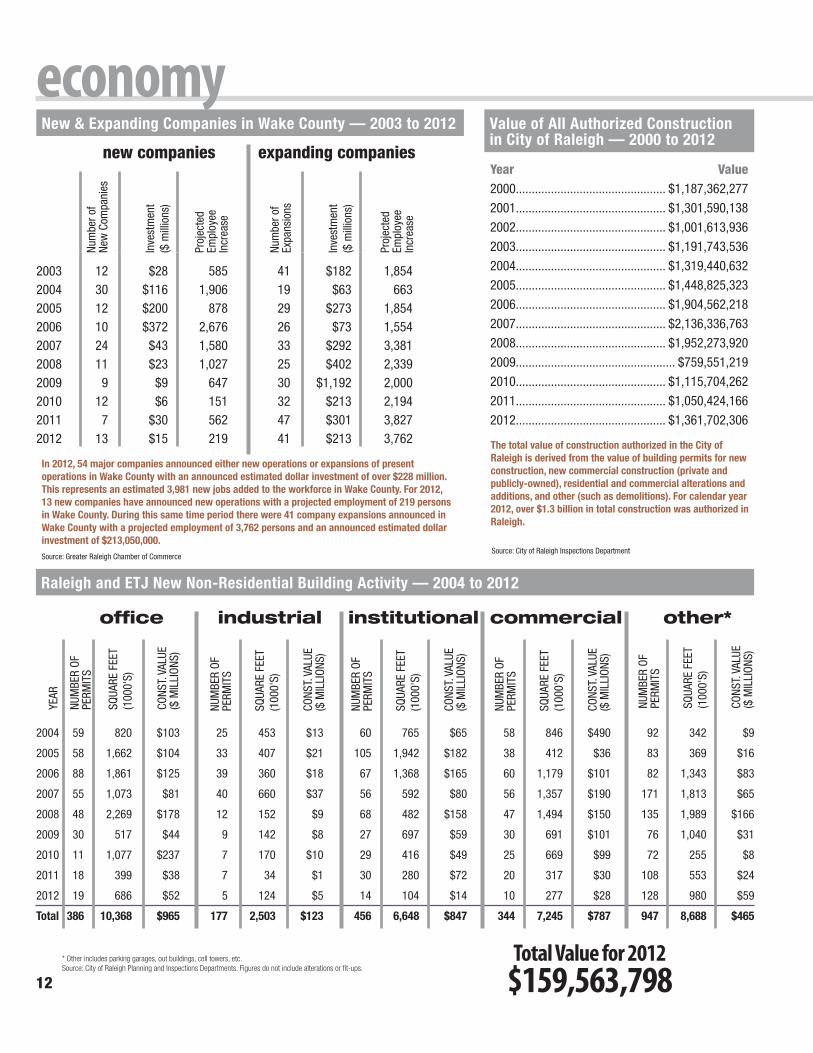
Raleigh and ETJ New Non-Residential Building Activity — 2004 to 2012
2004 59 820 $103 25 453 $13 60 765 $65 58 846 $490 92 342 $9
2005 58 1,662 $104 33 407 $21 105 1,942 $182 38 412 $36 83 369 $16
2006 88 1,861 $125 39 360 $18 67 1,368 $165 60 1,179 $101 82 1,343 $83
2007 55 1,073 $81 40 660 $37 56 592 $80 56 1,357 $190 171 1,813 $65
2008 48 2,269 $178 12 152 $9 68 482 $158 47 1,494 $150 135 1,989 $166
2009 30 517 $44 9 142 $8 27 697 $59 30 691 $101 76 1,040 $31
2010 11 1,077 $237 7 170 $10 29 416 $49 25 669 $99 72 255 $8
2011 18 399 $38 7 34 $1 30 280 $72 20 317 $30 108 553 $24
2012 19 686 $52 5 124 $5 14 104 $14 10 277 $28 128 980 $59
Total 386 10,368 $965 177 2,503 $123 456 6,648 $847 344 7,245 $787 947 8,688 $465
industrial institutional commercial other*office
* Other includes parking garages, out buildings, cell towers, etc.Source: City of Raleigh Planning and Inspections Departments. Figures do not include alterations or fit-ups.
Num
ber o
f Ne
w C
ompa
nies
Inve
stm
ent
($ m
illio
ns)
Proj
ecte
d
Empl
oyee
In
crea
se
Num
ber o
f Ex
pans
ions
Inve
stm
ent
($ m
illio
ns)
Proj
ecte
d
Empl
oyee
In
crea
se
In 2012, 54 major companies announced either new operations or expansions of present operations in Wake County with an announced estimated dollar investment of over $228 million. This represents an estimated 3,981 new jobs added to the workforce in Wake County. For 2012, 13 new companies have announced new operations with a projected employment of 219 personsin Wake County. During this same time period there were 41 company expansions announced in Wake County with a projected employment of 3,762 persons and an announced estimated dollar investment of $213,050,000.
Value of All Authorized Construction in City of Raleigh — 2000 to 2012
Year Value 2000............................................... $1,187,362,277
2001............................................... $1,301,590,138
2002............................................... $1,001,613,936
2003............................................... $1,191,743,536
2004............................................... $1,319,440,632
2005............................................... $1,448,825,323
2006............................................... $1,904,562,218
2007............................................... $2,136,336,763
2008............................................... $1,952,273,920
2009.................................................. $759,551,219
2010............................................... $1,115,704,262
2011............................................... $1,050,424,166
2012............................................... $1,361,702,306
The total value of construction authorized in the City of Raleigh is derived from the value of building permits for new construction, new commercial construction (private and publicly-owned), residential and commercial alterations and additions, and other (such as demolitions). For calendar year 2012, over $1.3 billion in total construction was authorized in Raleigh.
New & Expanding Companies in Wake County — 2003 to 2012
new companies expanding companies
Source: Greater Raleigh Chamber of CommerceSource: City of Raleigh Inspections Department
YEAR
NUM
BER
OF
PERM
ITS
SQUA
RE F
EET
(100
0'S)
CONS
T. V
ALUE
($
MIL
LION
S)
NUM
BER
OF
PERM
ITS
SQUA
RE F
EET
(100
0'S)
CONS
T. V
ALUE
($
MIL
LION
S)
NUM
BER
OF
PERM
ITS
SQUA
RE F
EET
(100
0'S)
CONS
T. V
ALUE
($
MIL
LION
S)
NUM
BER
OF
PERM
ITS
SQUA
RE F
EET
(100
0'S)
CONS
T. V
ALUE
($
MIL
LION
S)
NUM
BER
OF
PERM
ITS
SQUA
RE F
EET
(100
0'S)
CONS
T. V
ALUE
($
MIL
LION
S)
2003 12 $28 585 41 $182 1,8542004 30 $116 1,906 19 $63 6632005 12 $200 878 29 $273 1,8542006 10 $372 2,676 26 $73 1,5542007 24 $43 1,580 33 $292 3,3812008 11 $23 1,027 25 $402 2,3392009 9 $9 647 30 $1,192 2,0002010 12 $6 151 32 $213 2,1942011 7 $30 562 47 $301 3,8272012 13 $15 219 41 $213 3,762
12