growth and physical properties of magnetite thin films
TRANSCRIPT

University of South FloridaScholar Commons
Graduate Theses and Dissertations Graduate School
2006
Growth and physical properties of magnetite thinfilmsChamila S. SiyambalapitiyaUniversity of South Florida
Follow this and additional works at: http://scholarcommons.usf.edu/etd
Part of the American Studies Commons
This Thesis is brought to you for free and open access by the Graduate School at Scholar Commons. It has been accepted for inclusion in GraduateTheses and Dissertations by an authorized administrator of Scholar Commons. For more information, please contact [email protected].
Scholar Commons CitationSiyambalapitiya, Chamila S., "Growth and physical properties of magnetite thin films" (2006). Graduate Theses and Dissertations.http://scholarcommons.usf.edu/etd/2705
Growth and Physical Properties of Magnetite Thin Films
by
Chamila S. Siyambalapitiya
A thesis submitted in partial fulfillment of the requirements for the dual degrees of
Master of Science Department of Physics
College of Arts and Science and
Master of Science in Engineering Science Department of Electrical Engineering
College of Engineering University of South Florida
Co-Major Professor: Srikanth Hariharan, Ph.D. Co-Major Professor: Sarath Witanachchi, Ph.D.
Myung K. Kim, Ph.D. Andrew M. Hoff, Ph.D.
Don Morel, Ph.D.
Date of Approval: July 12, 2006
Keywords: PLD, Fe3O4, Verwey, M-H loops, Magneto-resistance, IV
© Copyright 2006, Chamila S. Siyambalapitiya

ACKNOWLEDGEMENTS
First and foremost I offer my sincere gratitude to my supervisor, Dr. Srikanth
Hariharan, who has supported me throughout my thesis and, especially for his support in
my pursuit of dual masters’ degree. One simply could not wish for a better or friendlier
supervisor. Also, I am indebted to Dr. Srinath Sanyadanam for his guidance and
continuous support throughout my project.
My work could not be completed without the help of my graduate co-advisor Dr.
Sarath Witanachichi. His supervision of my work and access to his laboratory allowed
me to perform my experiments and to write this thesis. I would also like to thank my
committee members, Dr. Myung Kim, Dr. Andrew Hoff, and Dr. Don Morel, for their
time, effort, and for serving on my committee.
I would like to thank the members of Dr. Hariharan’s research group: Natalie
Fray, James Gass, Ranko Heindl, Drew Rebar, Jeff Sanders, Marienette Morales. Their
cheerful and supportive nature helped me trough many difficulties. The help and support
from the members of Dr. Witanachchi’s group with the PLD system was essential to my
success; for that, I am very thankful. Especially I would thank Robert Hyde and Marek
Merlak for being good friends and supportive colleagues.
I would like to thank the staff members of the Department of Physics for their
support. Especially I am thankful for all the time I have spent with the late Sue Wolfe.
Finally, I want to thank my family and especially my parents and aunts for raising
me to become the person that I am, and for teaching me the importance of education.
Without their support and confidence in me, I would not be able to reach my goals.
I am blessed with many friends and I like to thank them with all of my heart.

i
TABLE OF CONTENTS LIST OF TABLES iii LIST OF FIGURES iv ABSTRACT vii CHAPTER ONE: BACKGROUND AND MOTIVATION 1
1.1. Introduction 2 1.1.1. Verwey Transition 3
1.1.2. Magnetic Properties of Ferromagnets 4 1.2. Overview of Research on Fe3O4 6 1.3. Conclusion 14
CHAPTER TWO: GROWTH OF Fe 3O4 FILM BY PULSED LASER
DEPOSITION 15 2.1. Overview of the Deposition Setup 17 2.1.1. Excimer Laser 18 2.1.2. Laser Target Interaction 18 2.1.3. Plume 19 2.2. Film Preparation 20 2.3. Process Flow 22 2.4. Conclusion 25 CHAPTER THREE: STRUCTURAL CHARACTERIZATION 26 3.1. X-Ray Diffraction (XRD) 28 3.1.1. X-Ray Diffraction of Fe3O4 on SiO2 Buffer Layered Si Substrate 29 3.1.2. X-Ray Diffraction of Fe3O4 on MgO Substrate 31 3.1.3. X-Ray Diffraction of Fe3O4 on Si (>50 Ω-cm) Substrate 34 3.1.4. X-Ray Diffraction of Fe3O4 on Si (<.005 Ω-cm) Substrate 34 3.2. Scanning Electron Microscopy (SEM) 37 3.3. Energy Dispersive Spectroscopy (EDS) 39 3.4. Thickness Measurements 41

ii
CHAPTER FOUR: ELECTRICAL AND MAGNETIC CHARACTERIZATION 42 4.1. Overview of the PPMS System 43 4.2. Electrical Resistance Measurements 45 4.2.1. Temperature Dependence of the Resistance in Fe3O4 Films
Grown on SiO2 46 4.2.2. Temperature Dependence of the Resistance in Fe3O4 Films
Grown on MgO 47 4.2.3. Temperature Dependence of the Resistance in Fe3O4 Films
Grown on High Resistive Si (resistivity > 50 Ω cm) 49 4.2.4. Temperature Dependence of the Resistance in Fe3O4 Film
Grown on Low Resistive Si (resistivity <0.005 Ω cm) 51 4.2.5. Comparisons and Conclusions 52
4.3. Magneto-Resistance 55 4.3.1. MR for Fe3O4 on SiO2 55 4.3.2. MR for Fe3O4 on MgO 57 4.3.3. Fe3O4 on High Resistive Si (resistivity > 50 Ω cm) 58 4.4. Magnetization as a Function of the Applied Magnetic Field (M-H) 60 4.4.1. M-H for Fe3O4 on SiO2 61 4.4.2. M-H for Fe3O4 on MgO 62 4.4.3. M-H for Fe3O4 on Si (resistivity > 50 Ω cm) 64 4.4.4. M-H for Fe3O4 on Si (resistivity > 50 Ω cm) 65 4.5. Magnetization Versus Temperature (M-T) 67 4.5.1. M-T for Fe3O4 on SiO2 68 4.5.2. M-T for Fe3O4 on MgO 69 4.5.3. M-T for Fe3O4 on Si (<0.005 Ω cm) 70 4.6. Current -Volatage Characteristics 70 4.6.1. Current and Voltage Dependence of Fe3O4 on SiO2 71 CHAPTER FIVE: SUMMARY, CONCLUSIONS AND FUTURE PLANS 73 5.1. Future Plans 76 REFERENCES 77 BIBLIOGRAPHY 79

iii
LIST OF TABLES
Table 3.1. Elements, weight and Atomic weight percentage for the target. 40 Table 3.2. Average thickness measurements for the Fe3O4 films. 41
Table 4.1. Verwey transition temperatures for films on SiO2, MgO and high resistive Si (> 50 Ω cm). 52
Table 4.2. Coercivity, saturation magnetization, remanence values
for the Fe3O4 films on SiO2, MgO, Si (>50 Ω cm) and Si (<0.005 Ω cm) substrates. 67

iv
LIST OF FIGURES Figure 1.1. Fe3O4 structure (adopted from Friedrich, 2002). 2 Figure 1.2. Hysteresis loop showing the saturation magnetization Ms,
the remanent magnetization Mr and the coercive Field Hc. 5
Figure 1.3. The resistivity as a function of temperature for 1500 Å and 6600 Å thick Fe3O4 films in the range of 60- 350 K. 8
Figure 1.4. Resistance vs. temperature curves for 1500 Å of Fe3O4 deposited on a Si substrate and on Ta, Ti and SiO2 buffer layer. 9
Figure 1.5. Resistance as a function of temperature for Fe3O4 films with different
thicknesses. 10 Figure 1.6. Magneto-resistance at H=1500 Oe as a function of temperature for a
polycrystalline (850 Å) and an epitaxial (1500 Å) Fe3O4 film. 11
Figure 1.7. Magnetization hysteresis loops at 90 K and 300 K for the 6600-Å film with field scans up to 5.5 T. 12
Figure 2.1. Schematic diagram of pulsed laser deposition system. 17
Figure 2.2. Substrate mounting configuration. 21 Figure 2.3. Laser spot sample. 21 Figure 2.4. Film deposition process flow. 22 Figure 3.1. X-Ray diffraction scans for Fe3O4 target. 28 Figure 3.2. X- Ray diffraction scan for the Fe3O4 on SiO2 buffer layered
Si substrate. 30 Figure 3.3. Zoomed X-ray diffraction scans around 43˚ for the MgO
substrate (top), Fe3O4 on MgO substrate (bottom). 32

v
Figure 3.4. Zoomed X-Ray diffraction scan around angle 94˚ for the MgO substrate (top), Fe3O4 on MgO substrate (bottom). 33 Figure 3.5. X-Ray diffraction scan for the Fe3O4 on Si substrate. 35 Figure 3.6. X-Ray diffraction scan for Fe3O4 film on Si (<.005 Ω-cm) substrate. 36 Figure 3.7. SEM images for Fe3O4 film on SiO2 substrate (a) and Fe3O4 film on MgO substrate (b). 38 Figure 3.8. SEM images for Fe3O4 film on high resistive Si (>50 Ω-cm) substrate. 39 Figure 3.9. EDS graph for Fe3O4 target. 40 Figure 4.1. (a) Schematic of Physical Property Measurement System (PPMS), (b) The different probes for different measurements. 44 Figure 4.2. Temperature dependence of resistance for Fe3O4 film on
SiO2 substrate. 47 Figure 4.3. Temperature dependence of resistance for Fe3O4 film on
MgO substrate. 48 Figure 4.4. Temperature dependence of resistivity for Fe3O4 film on
MgO substrate. 49 Figure 4.5. Temperature dependence of resistance for Fe3O4 Film on Si
substrate. 50 Figure 4.6. Temperature dependence of resistance for Fe3O4 film on
high conducting Si substrate. 51 Figure 4.7. Temperature dependence of the resistance of Fe3O4 film on SiO2,
MgO and high resistive Si. 52
Figure 4.8. Temperature dependence of the resistance of Fe3O4 film on SiO2, MgO and high resistive Si. 53
Figure 4.9. Temperature dependence of magneto-resistance for
Fe3O4/SiO2 film. 56 Figure 4.10. Temperature dependence of magneto-resistance for
Fe3O4/MgO film. 57

vi
Figure 4.11. Resistance dependence on temperature of Fe3O4 film on Si (>50 Ω cm) substrate in the presence of applied field of 5 T and absence of field. 58
Figure 4.12. M-H loops for Fe3O4 film on SiO2 at 10 K and 300 K. 61 Figure 4.13. M-H loops for film on MgO at 10 K, 120 K and 300 K. 62 Figure 4.14. M-H loops for film on high resistive Si substrate (resistivity > 50 Ω cm) at 10 K, 120 K and 300 K. 64 Figure 4.15. M-H loops for film on low resistivity Si substrate at 10 K and 300 K. 65 Figure 4.16. M vs.T for the film on SiO2 under applied field of 300 Oe and 5000 Oe.68 Figure 4.17. M vs.T for the film on MgO Under applied field 300 Oe, 5000 Oe. 69 Figure 4.18. M vs.T for the film on low resistivity Si substrate under applied field of 300 Oe and 5000 Oe. 70 Figure 4.19. I-V characteristics of the Fe3O4 film on SiO2 for the temperature range of 125 K ≤ T≤ 300 K. 72 Figure 4.20. I-V characteristics of the Fe3O4 film on SiO2 for temperature 70 K and 65 K. 72
vii
GROWTH AND PHYSICAL PROPERTIES OF MAGNETITE THIN FILMS
Chamila S. Siyambalapitiya
ABSTRACT
This project focused on two aspects of magnetite thin films. The first was to find
optimum parameters and conditions for deposition of stoichiometeric Fe3O4 films using
pulsed laser deposition (PLD). The second aspect was the characterization of the
magnetic and electrical properties in order to broaden the spectrum of understanding of
PLD Fe3O4 films. These properties were also investigated in terms of the substrates on
which the films were deposited. Discussed in this thesis are deposition parameters,
structural characteristics, magnetic and electrical characteristics of the films in terms of
different substrates and film thicknesses. The discussion consists of structural parameters
obtained using X- ray diffraction (XRD), Scanning electron microscopy (SEM), Energy
dispersive spectroscopy (EDS), and electric properties such as resistance as a function of
temperature and voltage dependence on the applied current. The magnetic properties
measured were the magneto-resistance, M-H hysteresis loop, and magnetization as a
function of temperature. The results obtained are then compared with pre-existing
literature data. It will be shown that there is an impurity phase that may be seen when
magnetite films are deposited on SiO2 substrates.
1
CHAPTER ONE
BACKGROUND AND MOTIVATION
Magnetite, Fe3O4, shows unique magneto-transport properties that has potential
application in spintronics devices. Thin films made of Fe3O4 draws attraction in devices
dependent on magnetic tunneling junctions and spin valve configuration. The use of
Fe3O4 films in magneto-electronic devices is also a growing interest. Ferromagnetic oxide
material may be used as memory storage material as a part of a magnetic multilayer to
store information. The magnetizations of domain parallel and anti parallel to an applied
external magnetic field are used as distinct states for binary logic. Another interesting
aspect of a storage material is to exploit its anisotropy in magnetism. A material that has
fairly large switching field in one crystal orientation and a smaller switching field in
another crystal orientation may be tailored to meet desired specifications.
1. 1. Introduction
Magnetite, Fe3O4, is one of the best known minerals on earth and is famous for its
half metallic nature, 100% spin polarizability and high Curie temperature (858 K).
The signature property of Fe3O4 is the Verwey transition which is an unusual metal to
insulator transition at a temperature of about 120 K and named after E. J. W. Verwey on
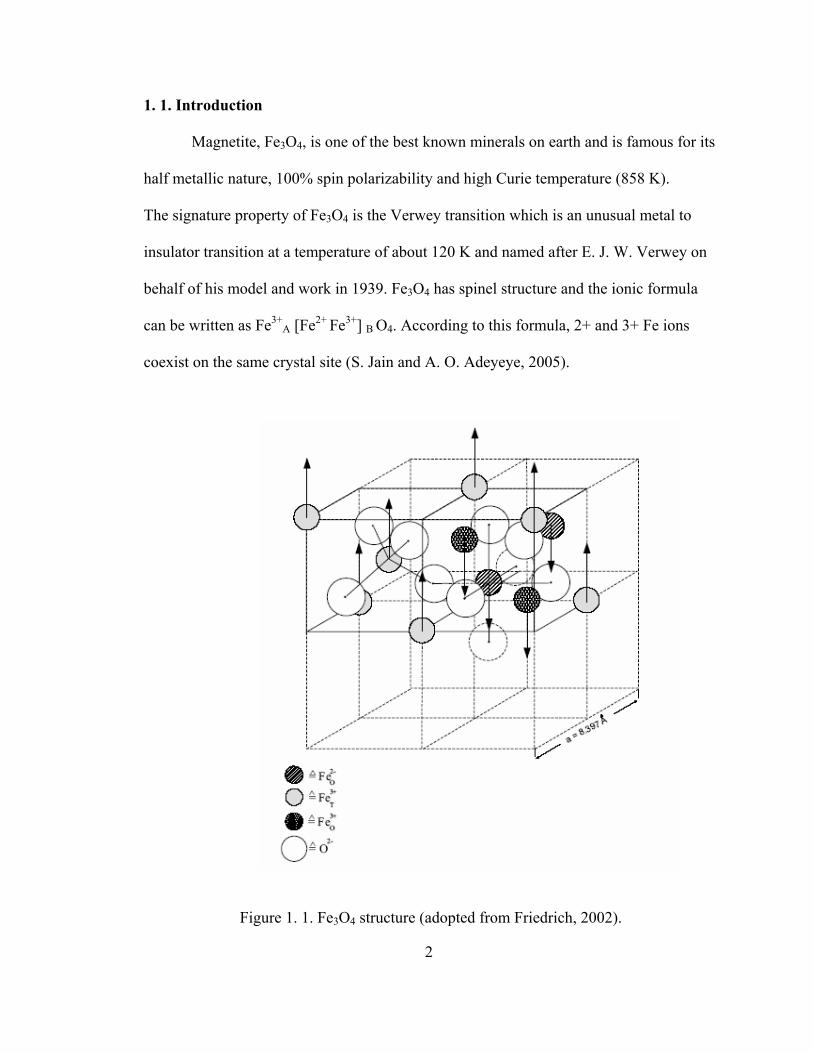
behalf of his model and work in 1939. Fe3O4 has spinel structure and the ionic formula
can be written as Fe3+A [Fe2+ Fe3+] B O4. According to this formula, 2+ and 3+ Fe ions
coexist on the same crystal site (S. Jain and A. O. Adeyeye, 2005).
Figure 1. 1. Fe3O4 structure (adopted from Friedrich, 2002).
2
3
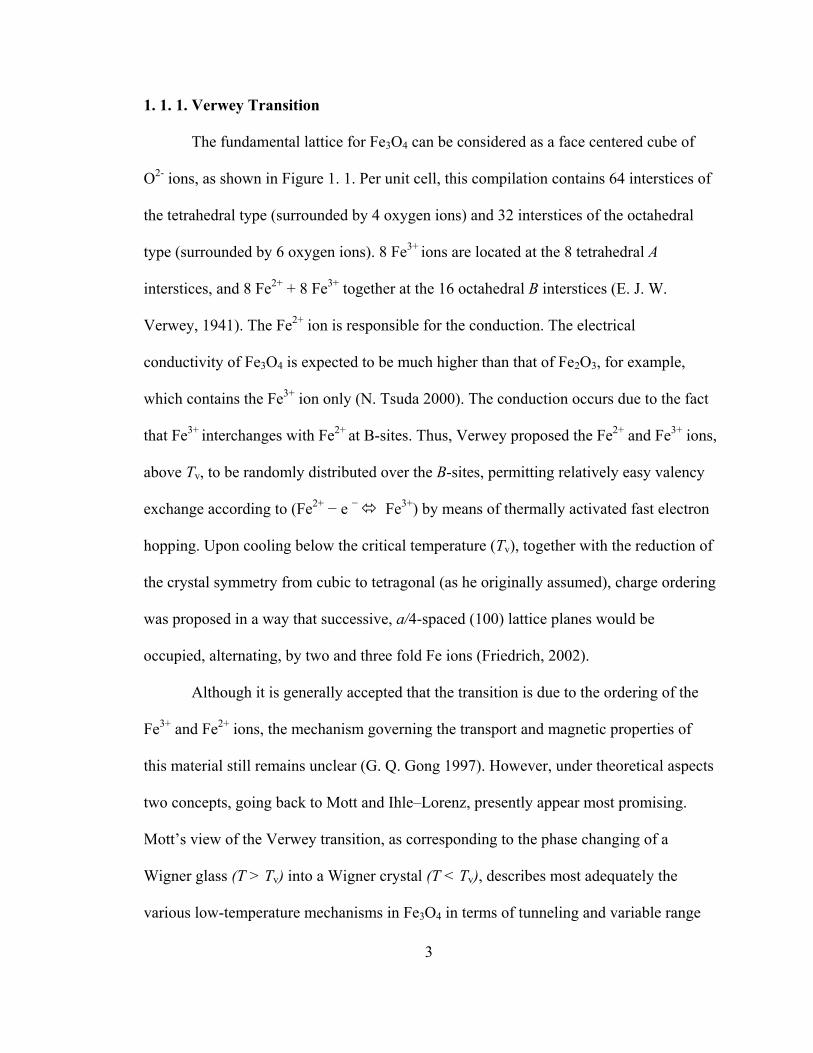
1. 1. 1. Verwey Transition
The fundamental lattice for Fe3O4 can be considered as a face centered cube of
O2- ions, as shown in Figure 1. 1. Per unit cell, this compilation contains 64 interstices of
the tetrahedral type (surrounded by 4 oxygen ions) and 32 interstices of the octahedral
type (surrounded by 6 oxygen ions). 8 Fe3+ ions are located at the 8 tetrahedral A
interstices, and 8 Fe2+ + 8 Fe3+ together at the 16 octahedral B interstices (E. J. W.
Verwey, 1941). The Fe2+ ion is responsible for the conduction. The electrical
conductivity of Fe3O4 is expected to be much higher than that of Fe2O3, for example,
which contains the Fe3+ ion only (N. Tsuda 2000). The conduction occurs due to the fact
that Fe3+ interchanges with Fe2+ at B-sites. Thus, Verwey proposed the Fe2+ and Fe3+ ions,
above Tv, to be randomly distributed over the B-sites, permitting relatively easy valency
exchange according to (Fe2+ − e − Fe3+) by means of thermally activated fast electron
hopping. Upon cooling below the critical temperature (Tv), together with the reduction of
the crystal symmetry from cubic to tetragonal (as he originally assumed), charge ordering
was proposed in a way that successive, a/4-spaced (100) lattice planes would be
occupied, alternating, by two and three fold Fe ions (Friedrich, 2002).
Although it is generally accepted that the transition is due to the ordering of the
Fe3+ and Fe2+ ions, the mechanism governing the transport and magnetic properties of
this material still remains unclear (G. Q. Gong 1997). However, under theoretical aspects
two concepts, going back to Mott and Ihle–Lorenz, presently appear most promising.
Mott’s view of the Verwey transition, as corresponding to the phase changing of a
Wigner glass (T > Tv) into a Wigner crystal (T < Tv), describes most adequately the
various low-temperature mechanisms in Fe3O4 in terms of tunneling and variable range
4
hopping of small polarons. On the other hand, the well-elaborated Ihle–Lorenz model,
assuming a superposition of polaron-band and hopping conductivity, is in better
agreement with the high-temperature data (Tv < T < 600 K) (Friedrich, 2002).
1. 1. 2. Magnetic Properties of Ferromagnets
Magnetic properties of a material have direct relationship with electrons and their Spin.
Each unpaired spin has a moment of one Bohr magnetron µb. Fe3+ with a electronic
structure of (1s22s22p63s23p6)3d5 has 5 µb . Similarly Fe2+ has 4 µb. The moments of the
Fe3+ ions on octahedral and tetrahedral sites are opposite to each other and the net
moment arises only from the Fe2+ ions; the arrangement being termed as ferrimagnetic (S.
B. Ogale 1998). Ferrimagnetism is similar to ferromagnetism. It exhibits all the hallmarks
of ferromagnetic behavior spontaneous magnetization, Curie temperatures, hysteresis,
and remanence (Bruce M. Moskowitz, 1991)
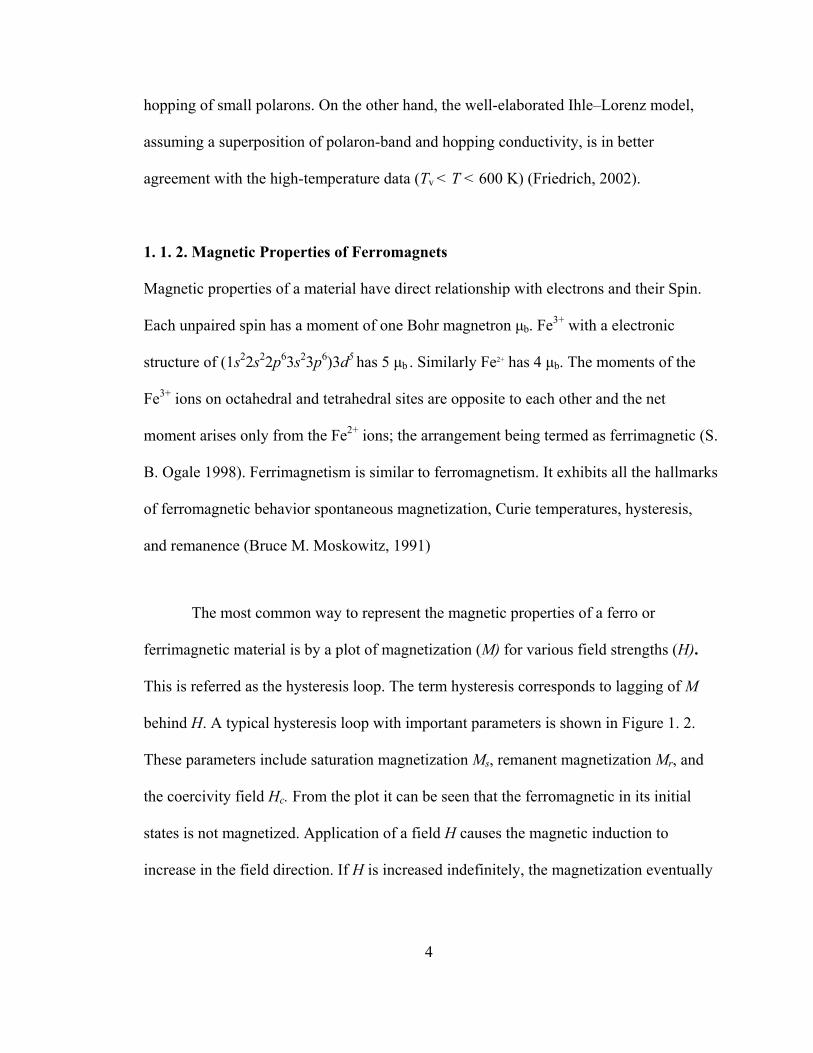
The most common way to represent the magnetic properties of a ferro or
ferrimagnetic material is by a plot of magnetization (M) for various field strengths (H).
This is referred as the hysteresis loop. The term hysteresis corresponds to lagging of M
behind H. A typical hysteresis loop with important parameters is shown in Figure 1. 2.
These parameters include saturation magnetization Ms, remanent magnetization Mr, and
the coercivity field Hc. From the plot it can be seen that the ferromagnetic in its initial
states is not magnetized. Application of a field H causes the magnetic induction to
increase in the field direction. If H is increased indefinitely, the magnetization eventually

reaches saturation at a value denoted as Ms. This represents the condition where all the
magnetic dipoles within the material are aligned in the direction of the magnetic field H.
Figure 1. 2. Hysteresis loop showing the saturation magnetization Ms, the remanent magnetization Mr and the coercive field Hc.
The next characteristic quantity is the remanence. When the field is reduced to
zero after magnetizing the magnetic material the remaining magnetic induction is called
remanent or remanence- Mr.
The magnetization can be reduced to zero by applying a reverse magnetic field of
strength Hc. This field strength is known as the coercivity. When the coercive field of a
ferro or ferrimagnet is large, the material is said to be a hard magnet and when it is low
said to be soft magnet. Coercivity is strongly dependent on the condition of the sample,
being affected by such factors as heat treatment or deformation.
5
6
All ferro or ferrimagnets when heated to sufficiently high temperatures become
paramagnetic. The transition temperature from ferromagnetic to paramagnetic behavior is
called the Curie temperature. At this temperature the permeability of the material drops to
a low value and both coercivity and remanence become zero.
The suitability of ferro or ferrimagnetic materials for applications is determined
principally from characteristics described above. As an example, magnetic recording
material should have a high remanent and high coercivity. Materials for electromagnets
need to have a low remanent and coercivity in order to ensure that the magnetization can
easily be reduced to zero as needed (David Jiles).
1. 2. Overview of Research on Fe3O4
Scientists have been continuously working on Fe3O4 to develop a better
understanding regarding this material in the sense of structure, transport properties, and
magnetic properties along with the Verwey transition mechanism and how different
factors such as strain, grain boundaries, and stoichiometry affect for magnetite properties.
The substrate effect, thickness effect and effect of preparation methods play major roles
in determining the properties of Fe3O4 useful for devices.
The Verwey transition in magnetite (Fe3O4) has attracted extensive research
interest since its discovery more than sixty years ago. As mentioned earlier, though the
exact mechanism is still unclear, scientists have contributed bits and pieces to the puzzle
of Fe3O4 ever since. Here we use some of these references and their experimental results
to establish background knowledge.

7
It is an accepted fact that the stoichiometry and the film thickness play a major
role in the Verwey transition. The sharpness of the Verwey transition is often considered
to represent the high quality of material. Due to a small lattice mismatch (0. 344%),
epitaxial growth of Fe3O4 (a=8. 397 Å) on MgO (a=4. 213Å) has been actively pursued
during the recent past (S. K. Arora, 2005). Here we focus on some results from the
reference of Gong et al where they have grown film on MgO substrates using the pulsed-
laser deposition technique utilizing a frequency tripled Nd:YAG laser (355 nm). The
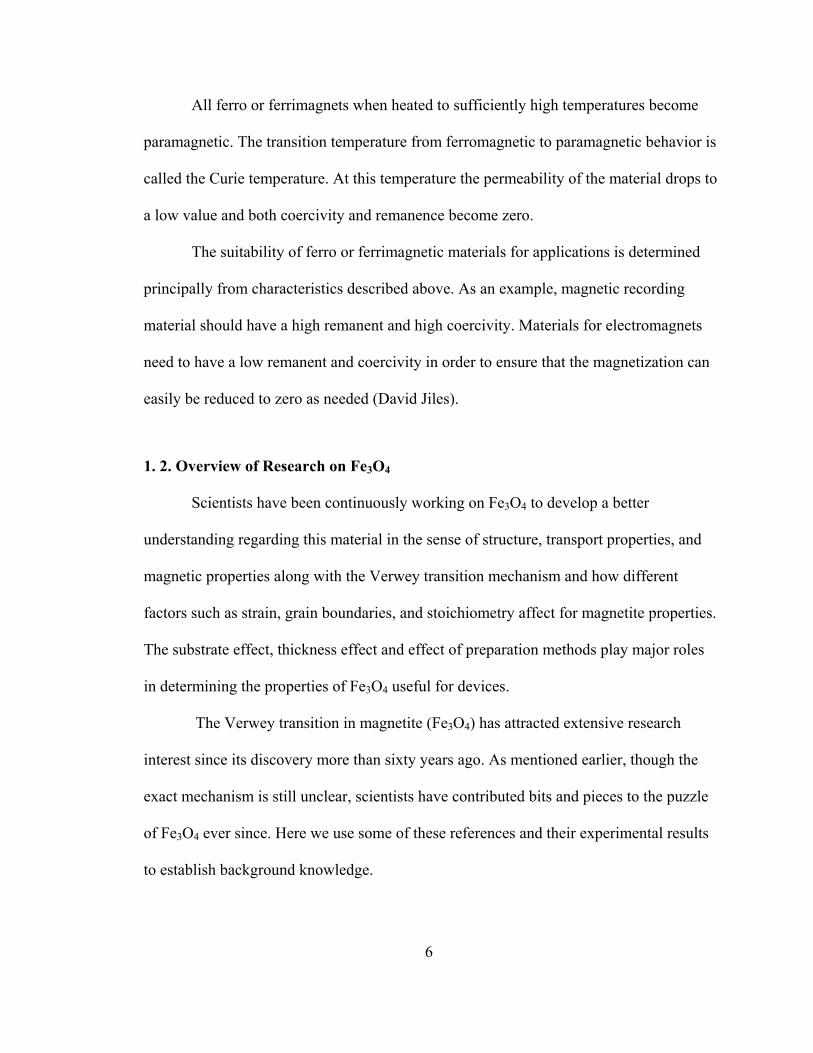
Figure 1. 3 shows the graph extracted from the Gong el al reference which shows the
resistivity and magnetization changes as a function of temperature for two different film
thicknesses- 1500 Å and 6600 Å. The Verwey transition temperature (Tv) is determined to
be about 120 K for both samples. Also the magnetization measurement yields a Tv of
123 K for the thick film. Both films exhibit a broadened transition, compared to
measurements made on bulk samples. In particular, the thin film’s transition is broader
than that for the thick films. Gong et al ascribe this as possibly due to the residual strain
in the films resulting from the lattice mismatch with the substrate. Also the film they
grew with a thickness of 670 Å has produced a transition temperature of 116. 5 K,
suggesting that T v decreases with film thickness (G. Q. Gong 1997). This is also
consistent with the results reported by Margulies (1996).
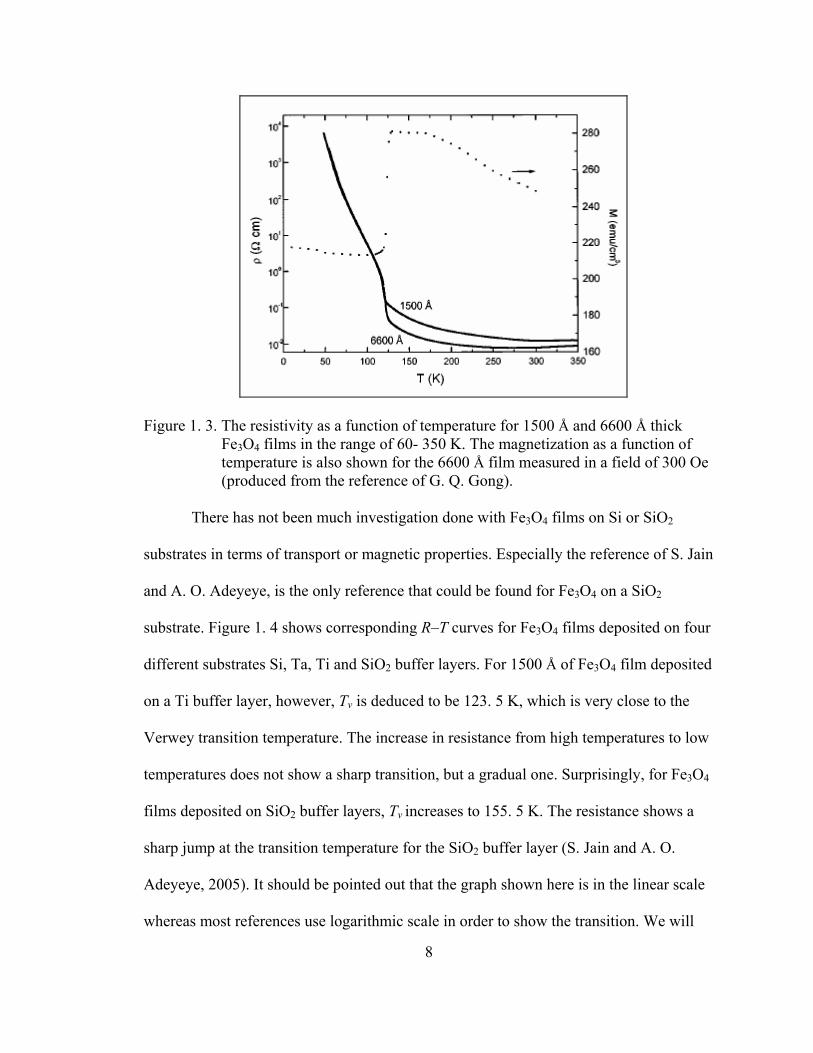
Figure 1. 3. The resistivity as a function of temperature for 1500 Å and 6600 Å thick
Fe3O4 films in the range of 60- 350 K. The magnetization as a function of temperature is also shown for the 6600 Å film measured in a field of 300 Oe (produced from the reference of G. Q. Gong).
There has not been much investigation done with Fe3O4 films on Si or SiO2
substrates in terms of transport or magnetic properties. Especially the reference of S. Jain
and A. O. Adeyeye, is the only reference that could be found for Fe3O4 on a SiO2
substrate. Figure 1. 4 shows corresponding R–T curves for Fe3O4 films deposited on four
different substrates Si, Ta, Ti and SiO2 buffer layers. For 1500 Å of Fe3O4 film deposited
on a Ti buffer layer, however, Tv is deduced to be 123. 5 K, which is very close to the
Verwey transition temperature. The increase in resistance from high temperatures to low
temperatures does not show a sharp transition, but a gradual one. Surprisingly, for Fe3O4
films deposited on SiO2 buffer layers, Tv increases to 155. 5 K. The resistance shows a
sharp jump at the transition temperature for the SiO2 buffer layer (S. Jain and A. O.
Adeyeye, 2005). It should be pointed out that the graph shown here is in the linear scale
whereas most references use logarithmic scale in order to show the transition. We will
8
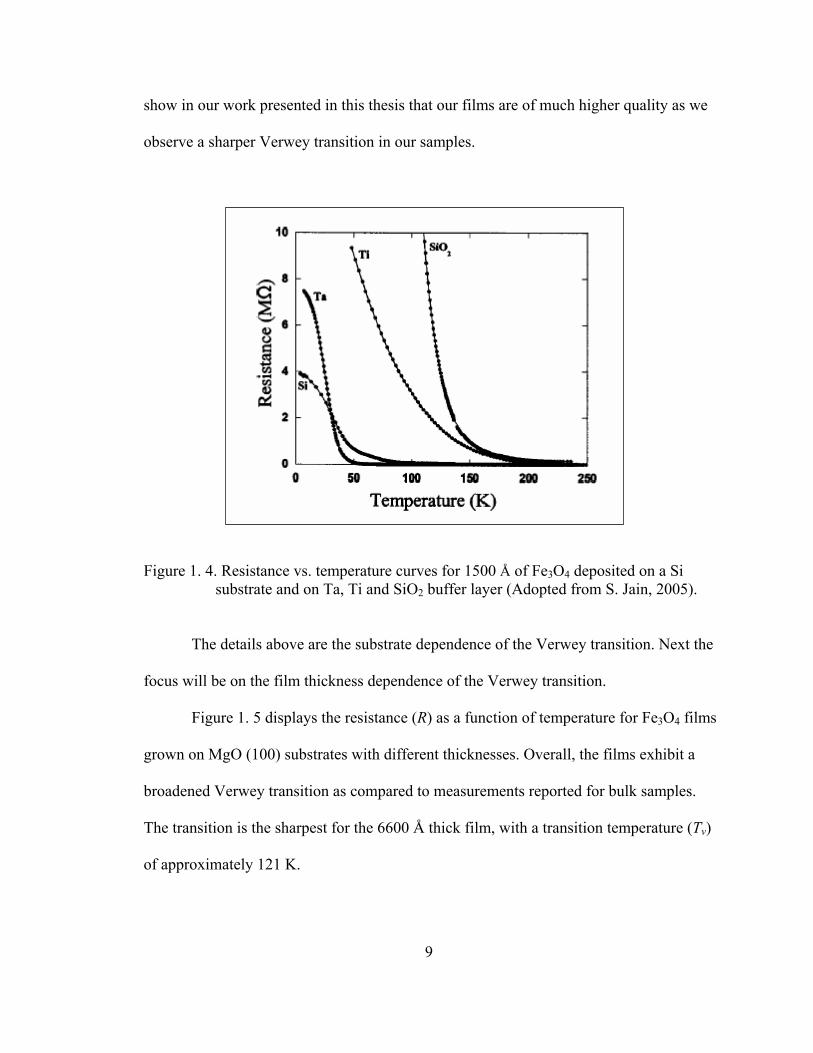
show in our work presented in this thesis that our films are of much higher quality as we
observe a sharper Verwey transition in our samples.
Figure 1. 4. Resistance vs. temperature curves for 1500 Å of Fe3O4 deposited on a Si
substrate and on Ta, Ti and SiO2 buffer layer (Adopted from S. Jain, 2005).
The details above are the substrate dependence of the Verwey transition. Next the
focus will be on the film thickness dependence of the Verwey transition.
Figure 1. 5 displays the resistance (R) as a function of temperature for Fe3O4 films
grown on MgO (100) substrates with different thicknesses. Overall, the films exhibit a
broadened Verwey transition as compared to measurements reported for bulk samples.
The transition is the sharpest for the 6600 Å thick film, with a transition temperature (Tv)
of approximately 121 K.
9

Figure 1. 5. Resistance as a function of temperature for Fe3O4 films with different thicknesses. The Verwey transition temperature (Tv) determined from Arrhenius plots as a function of film thickness is shown in the inset (adopted from X. W. Li, 1998).
The resistance change at the transition decreases in magnitude and the transition
gets broader with decreasing film thickness, and is not noticeable for the thinnest films.
The transition temperature, as determined from the Arrhenius plot, is plotted as a function
of film thickness and shown as an inset in Figure 1. 5. Tv increases quite rapidly with the
initial increase in film thickness and then gradually levels off at a value close to the bulk
(X. W. Li, 1998).
It is also known that magnetite has a small negative magneto resistance (MR).
Though mostly refer MR as (RH-R0) /R0, different authors has adopted different way of
expression to calculate MR. G. Q. Gong at all have observed MR values as high as 32%
for a 6600-Å-thick film at 60 K under a 4-T field. The MR ratio defined according to (Ro-
10
RH)/RH, where Ro is the zero-field resistance and RH is the resistance in the applied field
H.
X. W. Li et al have also studied the magneto-resistance in Fe3O4 films. They have
briefly discussed the low-field magneto-resistance (MR) properties of epitaxial Fe3O4
films grown on MgO and the polycrystalline films grown on polycrystalline SrTiO3
substrate.
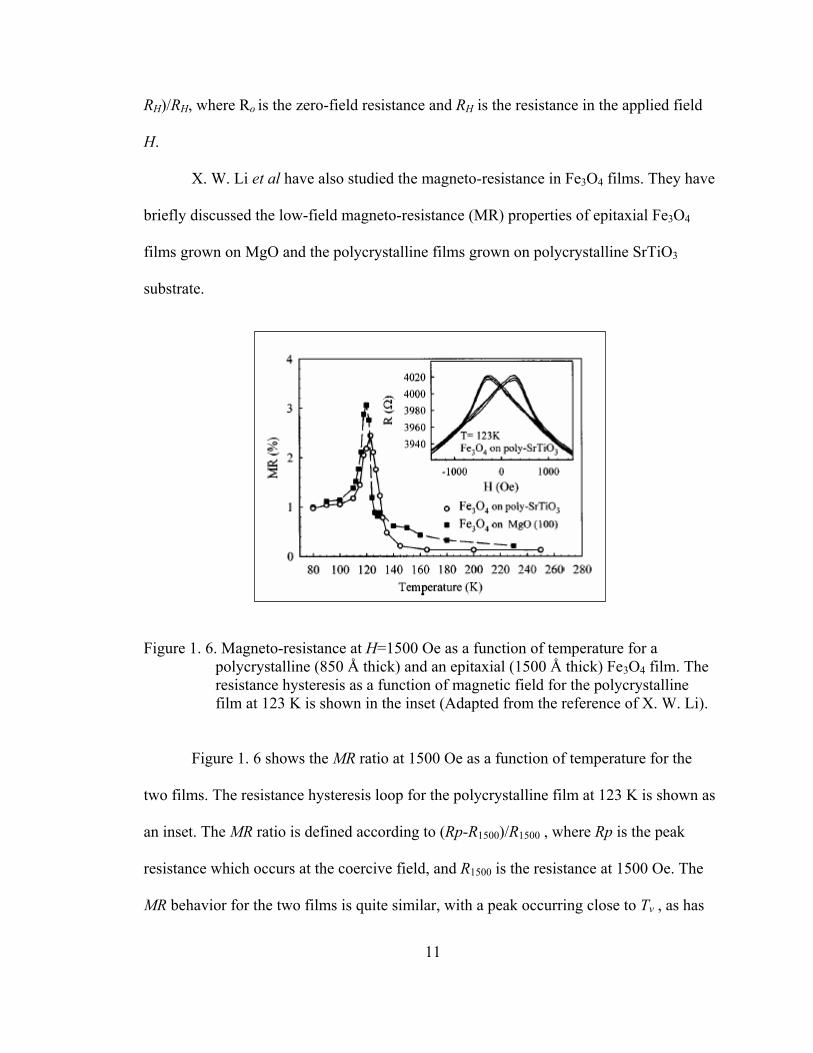
Figure 1. 6. Magneto-resistance at H=1500 Oe as a function of temperature for a polycrystalline (850 Å thick) and an epitaxial (1500 Å thick) Fe3O4 film. The resistance hysteresis as a function of magnetic field for the polycrystalline film at 123 K is shown in the inset (Adapted from the reference of X. W. Li).
Figure 1. 6 shows the MR ratio at 1500 Oe as a function of temperature for the
two films. The resistance hysteresis loop for the polycrystalline film at 123 K is shown as
an inset. The MR ratio is defined according to (Rp-R1500)/R1500 , where Rp is the peak
resistance which occurs at the coercive field, and R1500 is the resistance at 1500 Oe. The
MR behavior for the two films is quite similar, with a peak occurring close to Tv , as has
11
also been previously observed by G. Q. Gong et al. Consistent with the transport and
magnetic data, the MR peak occurs at a slightly higher temperature and is somewhat
broader for the polycrystalline film on SrTiO3 than for the epitaxial film on MgO. The
MR magnitude has been found to be quite small (2%–3% at 1500 Oe) for both the films,
with very little contribution resulting from grain boundary transport (X. W. Li, 1998).
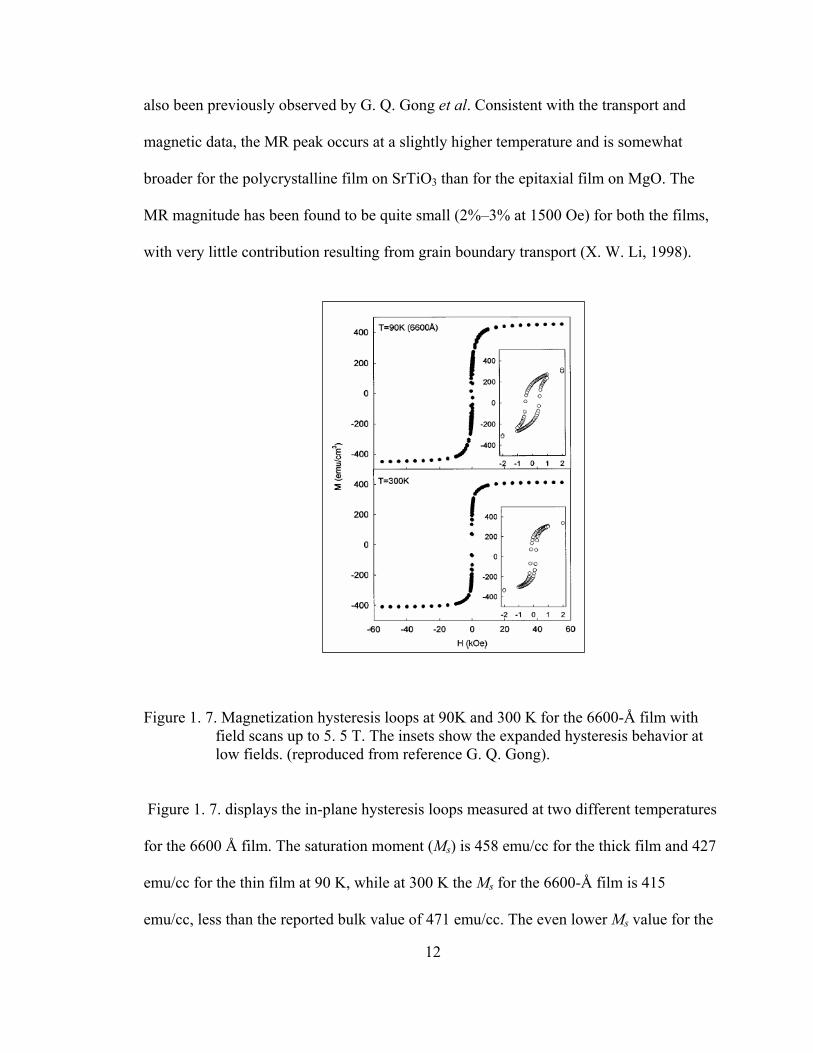
Figure 1. 7. Magnetization hysteresis loops at 90K and 300 K for the 6600-Å film with
field scans up to 5. 5 T. The insets show the expanded hysteresis behavior at low fields. (reproduced from reference G. Q. Gong).
Figure 1. 7. displays the in-plane hysteresis loops measured at two different temperatures
for the 6600 Å film. The saturation moment (Ms) is 458 emu/cc for the thick film and 427
emu/cc for the thin film at 90 K, while at 300 K the Ms for the 6600-Å film is 415
emu/cc, less than the reported bulk value of 471 emu/cc. The even lower Ms value for the
12
13
thinner film suggests that strain may play a role in the reduction of magnetization. It has
also been suggested that the reduction may be caused by a thin layer of α-Fe2O3 present
on the surface (C. A. Kleint 1995). The insets show the expanded low-field hysteresis
behavior at the two temperatures. Also as seen in the inset, the coercivity increases from
200 to 470 Oe, going from 300 to 90 K.
Antiphase boundaries (APB) are formed as a natural growth defect in the
Fe3O4/MgO hetero-epitaxy. This is due to the fact that the spinel crystal structure of
Fe3O4 (Fd3m) is lower in symmetry than MgO (Fm3m) and its unit cell size is twice the
size of MgO. Density of the APBs is strongly influenced by the growth conditions and
substrate microstructure. Presence of APBs has a deleterious effect on the magnetic
properties and electronic structure of Fe3O4 films. For example, the magnetization does
not saturate in high magnetic fields and at smaller thickness, films exhibit super-
paramagnetic behavior (S. K. Arora, 2005).
There has only been a little investigation on the current-voltage dependence (I-V)
of Fe3O4 films. In fact, only one paper could be found which has this characterization.
The conductivity of magnetite film is known to be due to the exchange of electrons
between the ferrous and ferric ions in the octahedral lattice sites, and thus the random
distribution of the ions above the transition leads to an isotropic conductivity. Below the
transition, however, the conductivity should be anisotropic. The energy required for the
exchange of ferrous and ferric ions for conductivity to take place is called the activation
energy.

14
1. 3. Conclusion
Magnetite has application potential for various electronic devices. In order to
integrate with current electronic industry it is important for Fe3O4 to be grown on
semiconductor substrates. Then there would be good potential for the use of Fe3O4 in
magneto-electronic devices. Our motivation for this research to grow stoichiometric films
on four different substrates such as Si with SiO2 buffer layer, MgO, Si substrates with
different resistivities. Systematic studies are then conducted on the structural, transport
and magnetic characteristics.
15
CHAPTER TWO
GROWTH OF Fe3O4 FILMS BY PULSED LASER DEPOSITION
The pulsed laser deposition (PLD) technique was used to fabricate all the thin
films investigated in this thesis. All the PLD growth of films was done in the thin films
laboratory of University of South Florida under the supervision of Prof. Witanachchi and
with help from his group members. PLD is a method for deposition of a wide variety of
materials in thin film form, collected from a plume of vaporized material which was
created by high power laser pulses directed at the desired target material. This deposition
technique often generates films with the same stoichiometry as the target material, an
important advantage of this method. Maintaining the same ratio of elements in the
resulting film as the initial target components simplifies the target selection and
fabrication process. Matching stoichiometry is made possible by the rapid heating rate
provided by the pulsed laser being faster than the individual low and high vapor pressure
components of the target elements, and micro-particulates ejected into the high
temperature of the plasma are further decomposed into a stoichiometric vapor. PLD does
not require an atmosphere gas as in sputtering, however, reactive gases can be added to
the vacuum system to vary the desired stoichiometry of the deposition. In general, the
useful range of laser wavelengths for material ablation to grow thin films by PLD lies

16
between 200 nm and 400 nm. The absorption coefficient of materials tends to increase
toward the short wavelength end of this range and the penetration depth of the target
materials is also reduced, but has characteristics which aid in reduction of particulate size
and quantity. Further advantages of PLD are the simplicity and flexibility of the
technique, small target size as compared to sputtering targets, and low substrate
temperatures can be utilized due to the high energy of the vaporized species in the plume,
typically 5 eV to greater than 100 eV.
There are two major disadvantages in the PLD method; particulate generation and
lack of large area uniformity. Particulates in the form of molten droplets and/or
irregularly shaped fragments can range in size from sub-micrometer to several
micrometers. The negative effects of particulates on thin films are reduced smoothness of
the micro-structure, non-uniformity of the film thickness, and point defects in devices.
Large area non-uniformity of film thickness is due to the narrow angular distribution of
the plume. Uniform coverage area can be improved by rotation and translation of the
substrate, and rastering of the laser irradiated area of the target. Rotation, translation, and
rastering were not available in the current deposition system; however, the disadvantage
of large area non-uniformity of the thickness was minimized by selecting deposition areas
near to the on-axis positions of the plume. A schematic diagram of the basic PLD system
is shown in Figure 2.1.

17
Vacuum Chamber Target
Figure 2.1. Schematic diagram of pulsed laser deposition system.
2.1. Overview of the Deposition Setup
The deposition system employed consists of a few key components including an
excimer laser, rotating target, heated substrate holder, and vacuum system, as shown in
Figure 2.1. The beam of the UV wavelength (248nm) excimer laser is directed into the
vacuum chamber through the use of two UV grade mirrors and is focused onto the Fe3O4
target using a single UV-AR lens. The number of mirrors, lens, and windows are
minimized to reduce losses at each surface, while obtaining desired laser spot size and
position. The lens is mounted on an X-Y translation stage to facilitate the positioning and
size of the incident laser spot on the target. The target is rotated using a variable speed
motor externally attached to the chamber. The target is rotated at a predetermined rate so
the incident laser pulses will evenly ablate the surface of the target without pitting.
Possible effects of target pitting are undesired particulates and change of the direction of
Substrate Plume
Excimer Laser
Lens
Mirrors

the plume. The substrate is fixed to a stainless steel heater block using conductive paint to
provide good thermal contact. The heater block is positioned such that the face of the
substrate is parallel to the target, and the center of the deposition area is on-axis with the
plume. The heat source is provided by a 0-120 VAC, 600 Watt, halogen bulb inserted in
to the heater block. The temperature of the heater block is monitored through the use of a
K-type thermo-couple attached closely to the substrate. The vacuum system consists of a
chamber, roughing pump, turbo-molecular pump, and a cryogenic pump. This vacuum
system allows the pressure inside the chamber to be maintained as low as 10-7 Torr.
2.1.1. Excimer Laser
The laser system utilized a Lambda Physik Compex 102 KrF excimer laser. The
light is in the UV range with a wavelength of 248 nm, a pulse width of ~ 20 ns, and the
maximum energy per pulse is 280 mJ leading to maximum power per pulse of:
MWs
JtEP s
Jp 1414000000
1020280.0
9 ==×
== − [2.1]
The frequency range of the laser pulse is 1-10 Hz (1-10 pulses per second). The laser was
operated by a LabView interface program allowing control of the pulse repetition rate,
total number of pulses, and monitoring of the energy per pulse output at the laser.
2.1.2. Laser Target Interaction
Electronic sputtering is considered to be the principal interaction mechanism of a
laser pulse with the target. The mechanism is not a single process but rather a group of
18
19
processes, all of which have the common feature of involving some form of excitations
and ionizations. The incident photons strike the target, producing electron-hole pairs and
electronic excitations in a femto second timescale. After a few picoseconds, the energy is
transferred to the crystal lattice, and during the laser pulse, within a few nanoseconds, a
thermal equilibrium between the electrons and the lattice is reached. This leads to a
strong heating of the lattice and, with continued irradiation, to a massive emission of
material from the surface (R. Kelly, 1994).
2.1.3. Plume
The laser beam focused on the target ablates the target material during laser
pulsing. This results in the appearance of a luminous plasma like plume composed of the
ablated material and oriented in direction nearly perpendicular to the surface of the target,
regardless of the angle of incidence of the laser beam on the target. (Saenger, 1992).
Typical plasma temperatures measured by emission spectroscopy during initial expansion
are on the order of 10,000 K. This is well above the boiling points of most materials
(generally less than 3000 K) (Chrisey). The laser fluence is a measure of energy density
of a laser beam and is defined by,
Fluence = Laser Energy Laser spot Area at the Target [2.2]
Fluence is typically expressed as Joules per square centimeter (J/cm2).
20
2.2. Film Preparation
A commercially acquired Fe3O4 (99.9%) target was used for the deposition
process. The XRD and EDS characterization was done on the bulk target and it was
verified that the target had the stoichiometry of Fe3O4 and the crystalline structure Fd3m,
face centered cubic of Fe3+ [Fe2+ Fe3+] O4 magnetite. Film deposition was carried out on
four different substrates, namely MgO, Si with a 5000 Å thick SiO2 layer (later referred to
as SiO2 substrate), high resistive Si (ρ >50Ω cm) and Boron doped low resistive Si (ρ
<0.005Ω cm). All the substrates used had (100) orientation.
Our goal was to deposit films on all the substrates under the same condition such
as pressure, fluence, and substrate temperature with the same thickness in order to
compare the substrate effect on the film. The major concern here is maximizing the area
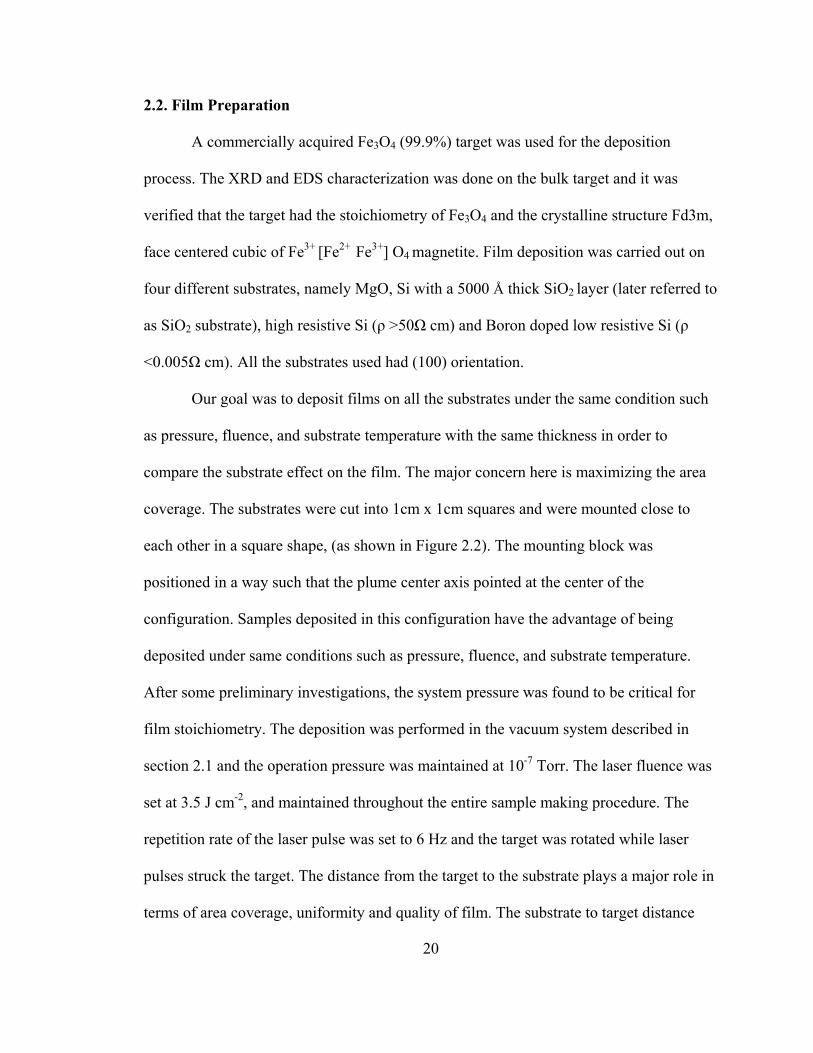
coverage. The substrates were cut into 1cm x 1cm squares and were mounted close to
each other in a square shape, (as shown in Figure 2.2). The mounting block was
positioned in a way such that the plume center axis pointed at the center of the
configuration. Samples deposited in this configuration have the advantage of being
deposited under same conditions such as pressure, fluence, and substrate temperature.
After some preliminary investigations, the system pressure was found to be critical for
film stoichiometry. The deposition was performed in the vacuum system described in
section 2.1 and the operation pressure was maintained at 10-7 Torr. The laser fluence was
set at 3.5 J cm-2, and maintained throughout the entire sample making procedure. The
repetition rate of the laser pulse was set to 6 Hz and the target was rotated while laser
pulses struck the target. The distance from the target to the substrate plays a major role in
terms of area coverage, uniformity and quality of film. The substrate to target distance
was maintained at 6 cm from the target surface in our deposition procedure. The surface
of the target was ablated for 15 minutes before the substrate was exposed to the
deposition. This was done in order to remove any surface contamination and oxidation of
the target surface. During this initial ablation, a shielding plate was placed between the
target and the substrate. This plate shields the substrates from the plume while the target
is ablated, preventing any contaminated material from reaching the substrate. The
temperature of the substrate was maintained at 350 ˚C. A LabView program was used to
control the process by setting the number of pulses desired, pulse rate and the laser
energy. After the deposition, the samples where cooled at the rate of 2˚C/minute to
minimize film fractures caused by mechanical stresses in rapidly cooling films. Under
the conditions described above a 50 Å/min (~0 .14 Å per pulse) film growth rate was
obtained.
Substrate Holder (metal block)
21
Figure 2.2. Substrate mounting configuration.
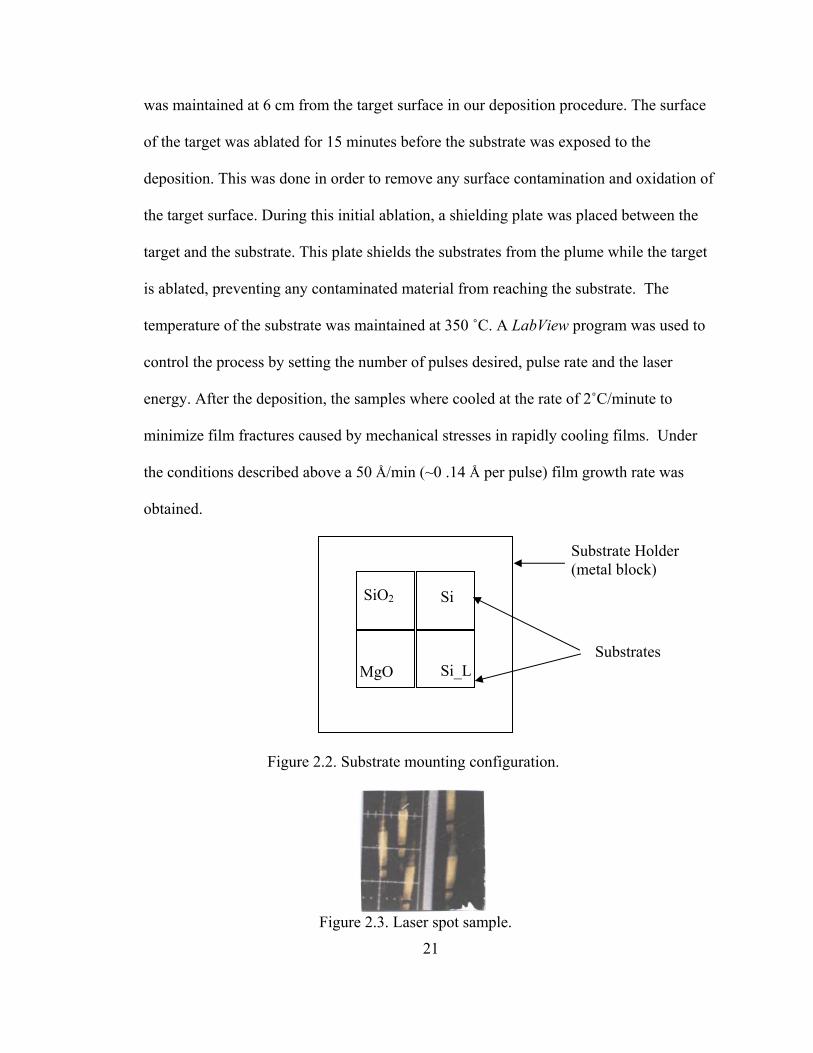
Figure 2.3. Laser spot sample.
SiO2
Si_L Substrates
Si
MgO

2.3. Process Flow
The process flow chart which shows the film deposition procedure is shown in
Figure 2.4. followed by detailed description for each step.
Substrate Cleaning
Vacuum system activation
Laser adjustment
Substrate Installation
Substrate Temperature Adjustment
Cooling of the substrate
Vent system pressure
Laser Deposition
Remove samples
Figure 2.4. Film deposition process flow.
22

23
1. Sample substrates were cut into 1cm x 1cm squares. Substrate surface preparation
included an ultrasonic bath in acetone, methanol, and de-ionized water respectively for 15
minutes each. Subsequently, the substrates were dried using compressed dry nitrogen.
The substrates were then mounted on to the substrate holder. To assure good thermal
contact with the heating element, a layer of silver paste was applied in between the
substrate and holder. The use of this layer is to avoid any temperature gradient across the
substrate and to ensure a good thermal contact with the heating block.
2. The appropriate lens and mirror adjustments were carried out in order to focus the laser
beam on the target. The laser energy and laser spot size were adjusted according to the
desired fluence (energy/area). In order to measure the spot size, the developed black
photographic paper was used as a temporary target. The temporary target was then
exposed to focused laser beam, while holding it at the surface of the target. The ablated
area of the temporary target is of different color as seen in Figure 2.3. The laser spot size
is determined by measuring the area of the ablated material.
3. The substrate holder/heater block was placed inside the chamber 6 cm away from the
target. The temperature measuring thermocouple junction is attached to the block in close
location to the substrate.
4. The pressure system consists of three pumps: roughing pump, turbo-molecular pump,
and cryogenic pump. Roughing pump is used to remove the gasses inside of the chamber
until pressure drop below 200 mTorr. Then the turbo-molecular pump is enabled which
24
allows for further reduction of the pressure (down to 10-6 Torr). When the pressure of the
system reaches 10-6 Torr the Turbo-molecular and roughing pumps valves are closed and
cryogenic pump valve is opened. The cryogenic pump allows for the system pressure to
be maintained at the level of 10-7 Torr. A stable pressure of around 5x 10⁻⁷ Torr was
maintained during film depositions.
5. The temperature of the substrate holder is set at 350 ˚C by adjusting the voltage across
the halogen bulb (located in the substrate holder).
6. After shielding the substrate, by using the stainless steel shield that can be adjusted
from outside the chamber, the target was ablated for 15 minutes to condition the target.
The laser pulse frequency, energy, and total pulses desired were programmed using the
“excimer laser.vi” laser control program. Following the target’s 15 minute ablation, the
substrate shield was rotated out of the way, and the main deposition commenced.
7. After the deposition, the temperature was slowly lowered by decreasing the voltage
applied across the bulb.
8. The cryogenic pump valve was closed.
9. The vacuum was released by opening the vacuum release valve. The substrates were
taken out from the chamber for future testing and characterization.

25
2.4. Conclusion
Although great care was taken in aligning the plume to the substrates’ center, the
plume has been shifted towards right of the substrate configuration shown in Figure 2.2.
This is one disadvantage of PLD system that the adjustments can not be made while the
deposition chamber atmosphere is evacuated. This can be lead to thickness variation
between substrates. Uniform area coverage is a known issue in PLD growth, and many
PLD systems including the set up used in this research, are not equipped for uniform
thickness or large area depositions. Uniform coverage could be achieved, to some extent,
if the system allow for translational and/or rotational movements of the substrate.

26
CHAPTER THREE
STRUCTURAL CHARACTERIZATION
This chapter describes the microstructure analysis and results of the Fe3O4 films
using X-ray diffraction (XRD), Scanning Electron Microscopy (SEM) and Energy
Dispersive Spectroscopy (EDS) characterization of the Fe3O4 films grown on various
substrates including SiO2, MgO, high resistive Si (> 50 Ω-cm), and low resistive Si (<
0.005 Ω-cm).
The XRD characterization of the target was performed prior to deposition to
verify the Fe3O4 composition. The XRD analysis of the thin films shows the crystalline
nature, orientations and evidence for Fe3O4.
In addition, images of films were taken using SEM in order to compare the film
surface quality. SEM images show the epitaxy of the films on the MgO substrate. In
addition, films on other substrates show a polycrystalline nature. The EDS data was taken
for the target as well as the films to get the composition ratio of the chemical elements.
Thickness measurements were done by using a Dektak 3030ST auto surface texture
profiler and results are shown at the end of the chapter.
27
3.1. X-Ray Diffraction (XRD)
A Bruker D8 Focus powder diffractometer with wave length of 1.504 Å from a
Cu source was used to perform the measurements. X-ray diffraction (XRD) is a standard
technique for structural characterization of materials. In XRD, a collimated beam of x-
rays impinges on a sample and the intensity of the reflected beam is measured. The x-rays
are scattered at the crystallographic lattice planes of the sample. The scattering intensity
has a sharp maximum when the waves are scattered specularly from different planes
interfering constructively. This is the case when the relationship between the scattering
angle and the inter-planar spacing fulfills the Bragg’s condition.
We now present characteristic XRD scans for the target as well as films grown on
different substrates. The matching database scan lines are inserted with the film scan to
show the peak match. Also, the angles and the (h k l) planes are shown for appropriate
peaks.
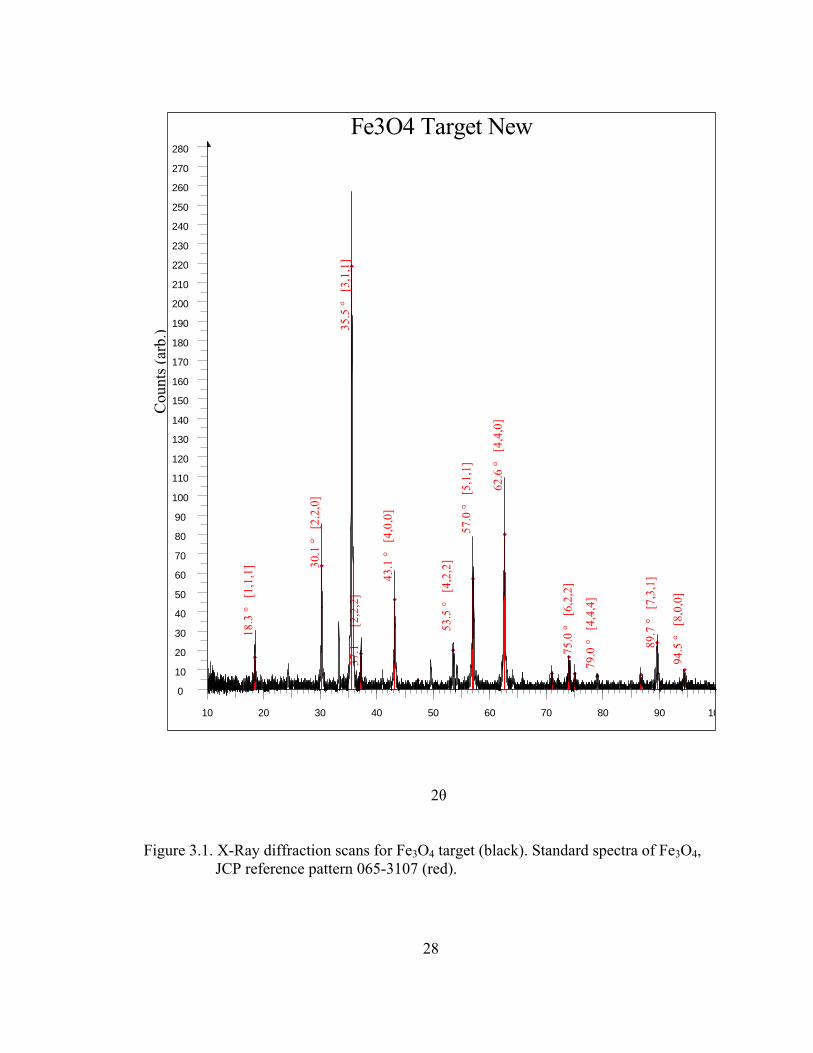
The XRD scan for the target is shown in Figure 3.1. Here we can see the peaks
with multiple orientations. The most prominent peak is observable at 2θ = 35.5˚ for the
X-ray scattered from the (311) plane.
Fe3O4 Target New
0
10
20
30
40
50
60
70
80
90
100
110
120
130
140
150
160
170
180
190
200
210
220
230
240
250
260
270
280
10 20 30 40 50 60 70 80 90 10
Cou
nts (
arb.
)
1
8.3
° [1
,1,1
]
3
0.1
° [2
,2,0
]
3
5.5
° [3
,1,1
]
37.
1
[2,2
,2]
43.
1 °
[4,
0,0]
5
3.5
° [4
,2,2
]
5
7.0
° [5
,1,1
]
6
2.6
° [
4,4,
0]
7
5.0
° [
6,2,
2]
7
9.0
° [4
,4,4
]
8
9.7
° [7
,3,1
]
9
4.5
° [
8,0,
0]
2θ
Figure 3.1. X-Ray diffraction scans for Fe3O4 target (black). Standard spectra of Fe3O4,
JCP reference pattern 065-3107 (red).
28
29
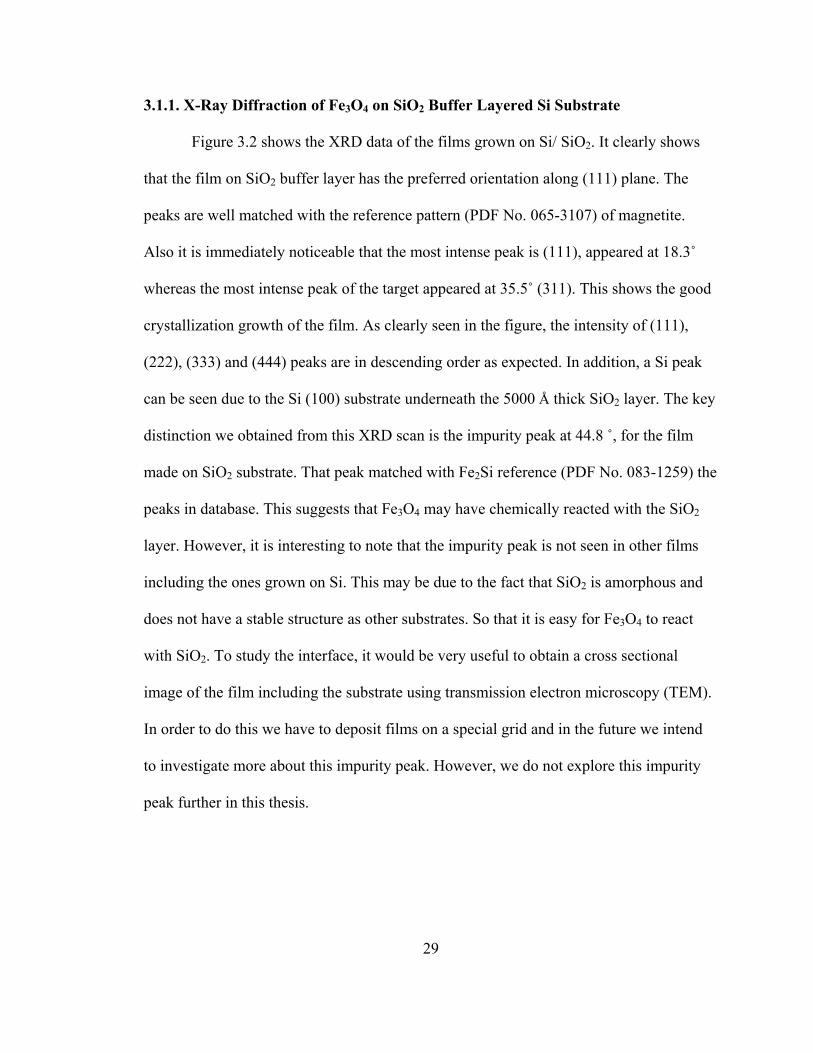
3.1.1. X-Ray Diffraction of Fe3O4 on SiO2 Buffer Layered Si Substrate
Figure 3.2 shows the XRD data of the films grown on Si/ SiO2. It clearly shows
that the film on SiO2 buffer layer has the preferred orientation along (111) plane. The
peaks are well matched with the reference pattern (PDF No. 065-3107) of magnetite.
Also it is immediately noticeable that the most intense peak is (111), appeared at 18.3˚
whereas the most intense peak of the target appeared at 35.5˚ (311). This shows the good
crystallization growth of the film. As clearly seen in the figure, the intensity of (111),
(222), (333) and (444) peaks are in descending order as expected. In addition, a Si peak
can be seen due to the Si (100) substrate underneath the 5000 Å thick SiO2 layer. The key
distinction we obtained from this XRD scan is the impurity peak at 44.8 ˚, for the film
made on SiO2 substrate. That peak matched with Fe2Si reference (PDF No. 083-1259) the
peaks in database. This suggests that Fe3O4 may have chemically reacted with the SiO2
layer. However, it is interesting to note that the impurity peak is not seen in other films
including the ones grown on Si. This may be due to the fact that SiO2 is amorphous and
does not have a stable structure as other substrates. So that it is easy for Fe3O4 to react
with SiO2. To study the interface, it would be very useful to obtain a cross sectional
image of the film including the substrate using transmission electron microscopy (TEM).
In order to do this we have to deposit films on a special grid and in the future we intend
to investigate more about this impurity peak. However, we do not explore this impurity
peak further in this thesis.

Fe3O4 /SiO2
0
1000
2000
3000
4000
5000
6000
15 20 30 40 50 60 70 80 90
44.8
° F
e-Si
33.0
° S
i
692
° Si
30
37.1
° [2
,2,2
]
57.0
° [3
,3,3
]
18.3
° [1
,1,1
]
79.0
° [4
,4,4
]
Cou
nts (
arb.
)
2θ
Figure 3.2. X-Ray diffraction scan for the Fe3O4 on SiO2 buffer layered Si substrate. Impurity peak in addition to Si substrate peaks can be seen with Fe3O4 peaks at 44.8˚.

31
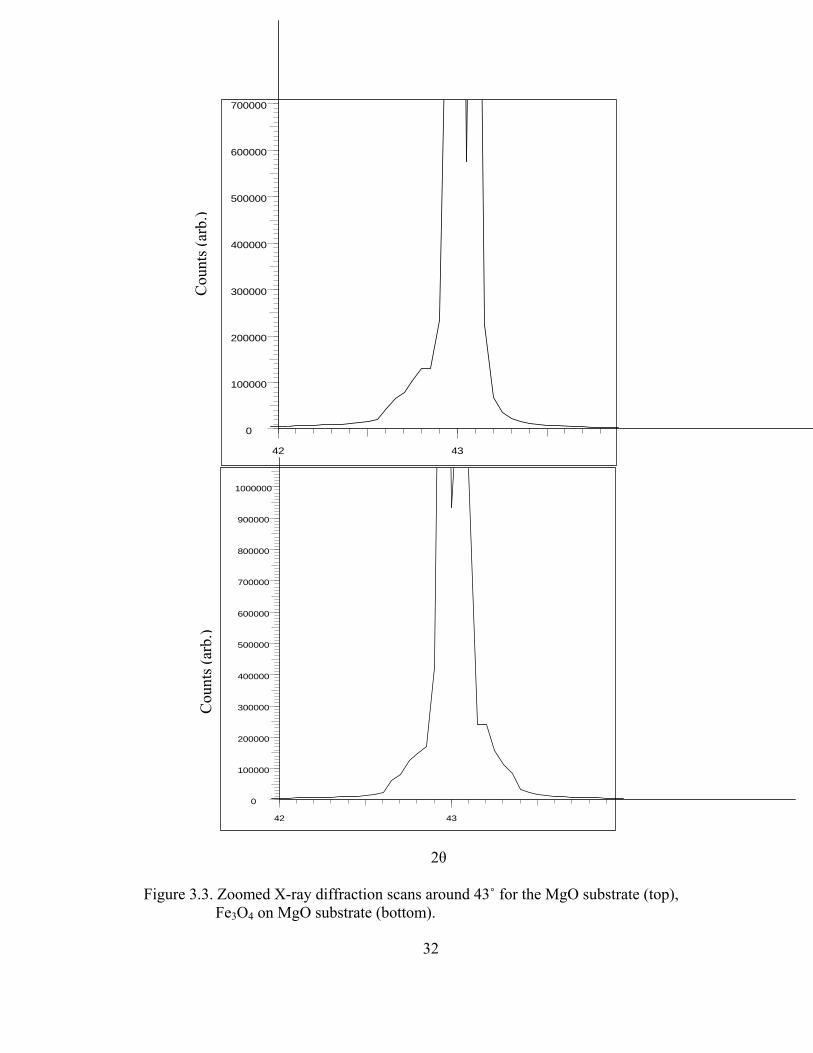
3.1.2. X-Ray Diffraction of Fe3O4 on MgO Substrate
Two peaks around 43˚ and 94˚ are visible for the 2θ scan from 15˚ to 100˚. No
other orientation of Fe3O4 peaks can be seen other than (100). This shows the high
crystallinity of the film. Fe3O4 film peaks were hard to differentiate from those of MgO
due to the fact that the MgO peaks and Fe3O4 peaks overlap. The reason for this is that
the lattice parameter of Fe3O4 (8.397 Å) is nearly double that of MgO (4.213 Å), and this
leads to an epitaxial film. The Fe3O4 peaks seen in contrast with the MgO substrate peaks
are even difficult to resolve as our MgO substrate shows split peaks. It is known that any
distortion of the lattice resulting in lower symmetry such as poor orientation and uneven
sample surface will lead to split peaks. However, we were able to resolve the peaks
corresponding to the film, by comparing magnified data of the substrate alone and data
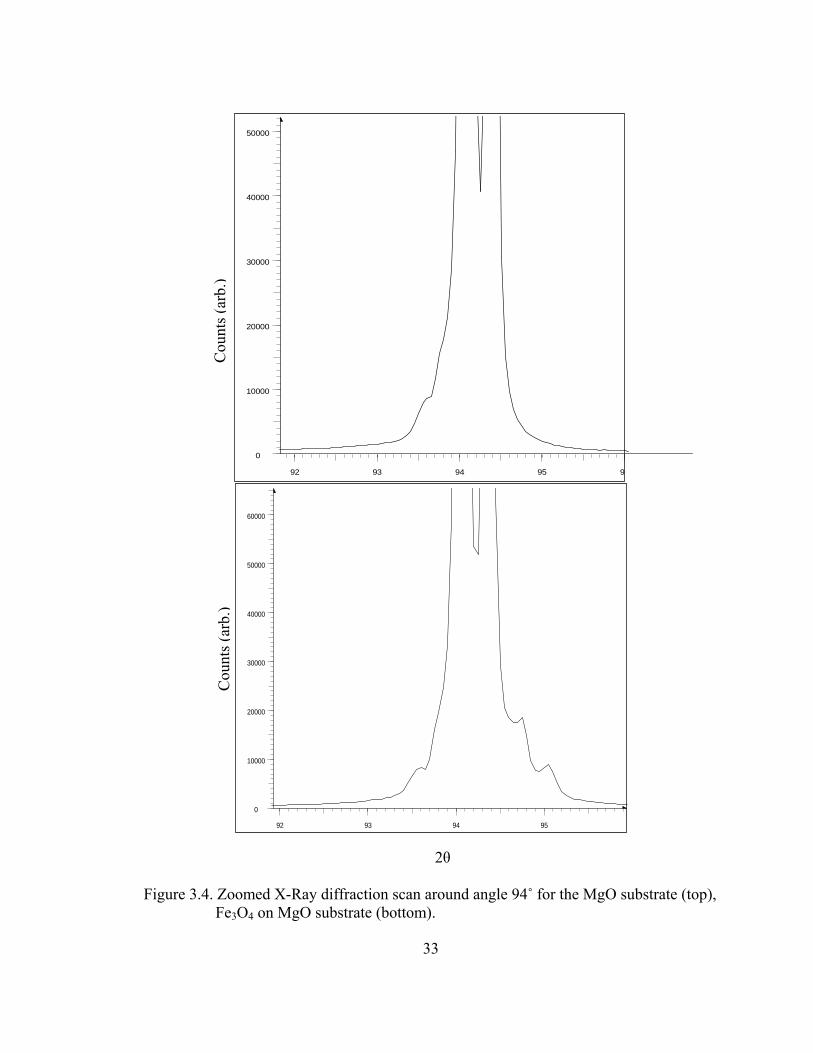
from substrate with film. The Figures 3.3 and 3.4 show the zoomed X-ray diffraction
peak around 43˚ and 94˚ respectively to illustrate this point.
0
100000
200000
300000
400000
500000
600000
700000
42 43
0
100000
200000
300000
400000
500000
600000
700000
800000
900000
1000000
42 43
Cou
nts (
arb.
)
Cou
nts (
arb.
) 2θ
Figure 3.3. Zoomed X-ray diffraction scans around 43˚ for the MgO substrate (top),
Fe3O4 on MgO substrate (bottom).
32
33
2θ
Figure 3.4. Zoomed X-Ray diffraction scan around angle 94˚ for the MgO substrate (top),
Fe3O4 on MgO substrate (bottom).
0
10000
20000
30000
40000
50000
60000
92 93 94 95
0
10000
20000
30000
40000
50000
92 93 94 95 9
Cou
nts (
arb.
) C
ount
s (ar
b.)
34
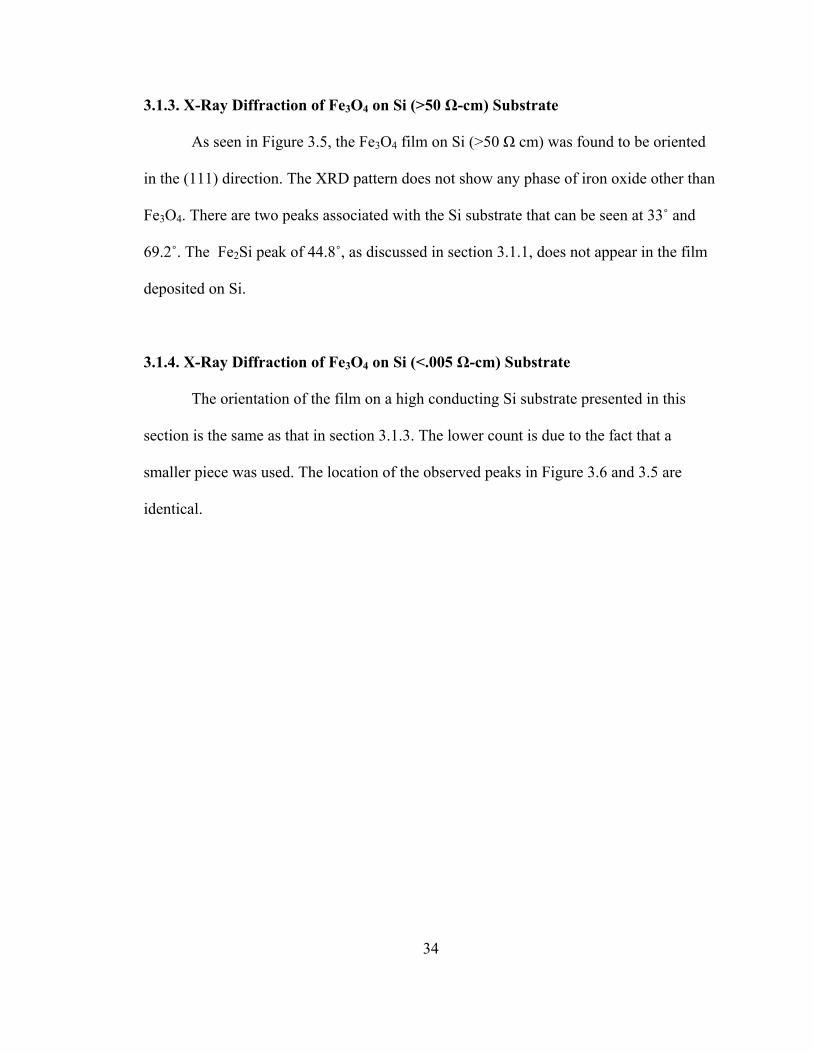
3.1.3. X-Ray Diffraction of Fe3O4 on Si (>50 Ω-cm) Substrate
As seen in Figure 3.5, the Fe3O4 film on Si (>50 Ω cm) was found to be oriented
in the (111) direction. The XRD pattern does not show any phase of iron oxide other than
Fe3O4. There are two peaks associated with the Si substrate that can be seen at 33˚ and
69.2˚. The Fe2Si peak of 44.8˚, as discussed in section 3.1.1, does not appear in the film
deposited on Si.
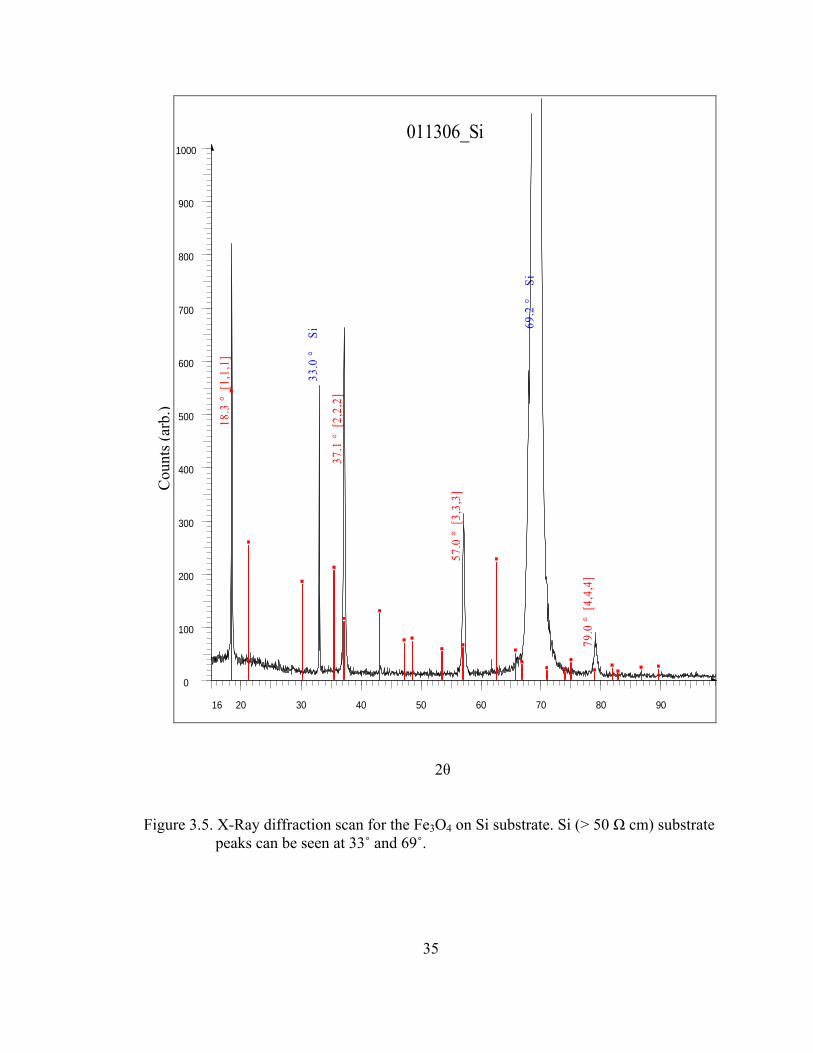
3.1.4. X-Ray Diffraction of Fe3O4 on Si (<.005 Ω-cm) Substrate
The orientation of the film on a high conducting Si substrate presented in this
section is the same as that in section 3.1.3. The lower count is due to the fact that a
smaller piece was used. The location of the observed peaks in Figure 3.6 and 3.5 are
identical.
011306_Si
0
100
200
300
400
500
600
700
800
900
1000
16 20 30 40 50 60 70 80 90
18.3
° [1
,1,1
]
37.1
° [2
,2,2
]
57.0
° [
3,3,
3]
79.0
° [4
,4,4
]
33.0
°
Si 69
.2 °
S
i
Cou
nts (
arb.
)
2θ
Figure 3.5. X-Ray diffraction scan for the Fe3O4 on Si substrate. Si (> 50 Ω cm) substrate peaks can be seen at 33˚ and 69˚.
35

Fe3O4 on Si low resistive sub
0
100
200
300
400
500
600
700
800
900
1000
1100
1200
1300
1400
15 20 30 40 50 60 70 80 90
36
18.3
° [
1,1,
1]
37.1
° [2
,2,2
]
57.0
° [
3,3,
3]
79.0
° [4
,4,4
]
33.1
° S
i
69.2
° S
i
Cou
nts (
arb.
)
2θ
Figure 3.6. X-Ray diffraction scan for Fe3O4 film on Si (<.005 Ω-cm) substrate. Si substrate peaks can be seen addition to Fe3O4 peaks.

37
3.2. Scanning Electron Microscopy (SEM)
Scanning electron microscopy (SEM) is a method for high-resolution imaging of
surfaces. A Hitachi S-800 scanning microscope was used to capture these images. The
SEM uses electronsT for imaging, much as a light microscope uses visible light. The
advantages of SEM over light microscopy include greater magnification (up to
300,000X) and much greater depth of field. An incident electron beam is raster-scanned
across the sample's surface, and the resulting electrons emitted from the sample are
collected to form an image of the surface. Imaging is typically obtained using secondary
electrons for the best resolution of fine surface topographical features. Alternatively,
imaging with backscattered electrons gives contrast based on atomic number to resolve
microscopic composition variations, as well as, topographical information.
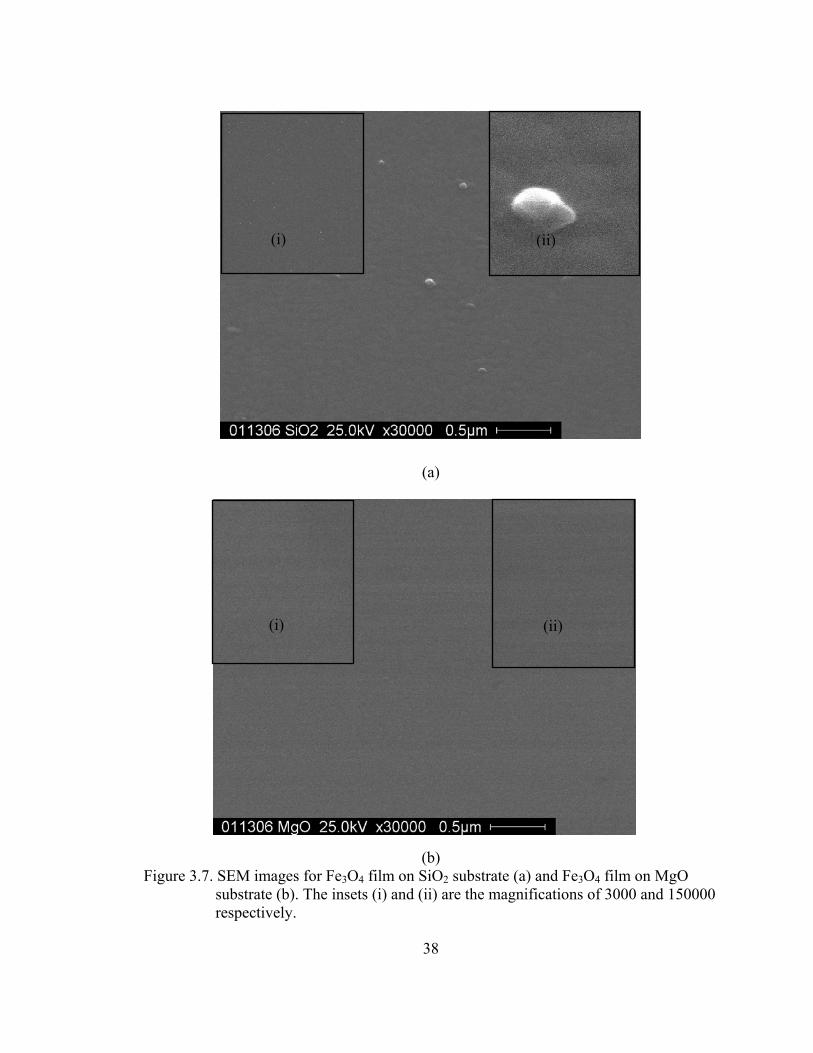
Even though these films were grown in situ, there are significant differences in
the film surface from substrate to substrate. Figure 3.7 (a) shows the topology of film on
SiO2 under 30 000X magnification. We can see the crystallites under 0.1 µm distributed
on the film on a SiO2 substrate. The grain boundaries are also visible in this image. The
image with 3000 magnification included an inset in Figure 3.6 (a) (i) has shown the
uniformly distributed crystallites and, the image of 15 0000 magnification has shown the
texture, i.e. distribution of crystallographic orientation. In contrast, the MgO film has a
very clean surface that is free of particulates or crystallites. This is convincing evidence
of the epitaxial formation of the Fe3O4 on MgO substrates. Films on other substrates
show the polycrystalline nature.
(ii) (i)
(a)
(ii) (i)
(b) Figure 3.7. SEM images for Fe3O4 film on SiO2 substrate (a) and Fe3O4 film on MgO
substrate (b). The insets (i) and (ii) are the magnifications of 3000 and 150000 respectively.
38

The film made on Si (> 50 Ω-cm) also appears to be particle-free when compared
with SiO2 substrate. Grain boundaries are also smaller in Si substrate than that on SiO2
substrate, as shown in Figure 3.8.
(i) (ii)
Figure 3.8. SEM images for Fe3O4 film on high resistive Si (>50 Ω-cm) substrate. The insets (i) and (ii) are the magnifications of 3000 and 150000 respectively.
3.3. Energy Dispersive Spectroscopy (EDS)
Energy dispersive x-ray spectroscopy (EDS) is a chemical microanalysis
technique performed in conjunction with a scanning electron microscope (SEM). A
EDAX model Hitachi S800 132-2.5 EDS detecting unit was utilized to perform these
measurements. The technique utilizes x-rays that are emitted from the sample during
bombardment by the electron beam to characterize the elemental composition of the
analyzed volume. The EDS x-ray detector measures the number of emitted x-rays from
the sample surface versus their energy. The energy of the x-ray is characteristic of the
39

element from which the x-ray was emitted. A relative counts versus energy of the
detected x-rays is obtained and evaluated for qualitative and quantitative determinations
of the elements present in the sampled volume.
0
50
100
150
200
250
300
0 1 2 3 4 5
Energy (keV)
Inte
nsity
(arb
.)
Fe
O
C
Figure 3.9. EDS graph for Fe3O4 target.
This shows the chemical composition is Fe, O and C. The carbon (C) peak is due
to the instrument error resulting from scattering from the rough target surface.
Table 3.1. Elements, weight and Atomic weight percentage for the target.
Element Wt % At % Atomic Ratio
C K 7.39 16.71 1.24
O K 31.58 53.61 4
Fe K 61.03 29.68 2.21
Total 100 100
40
41
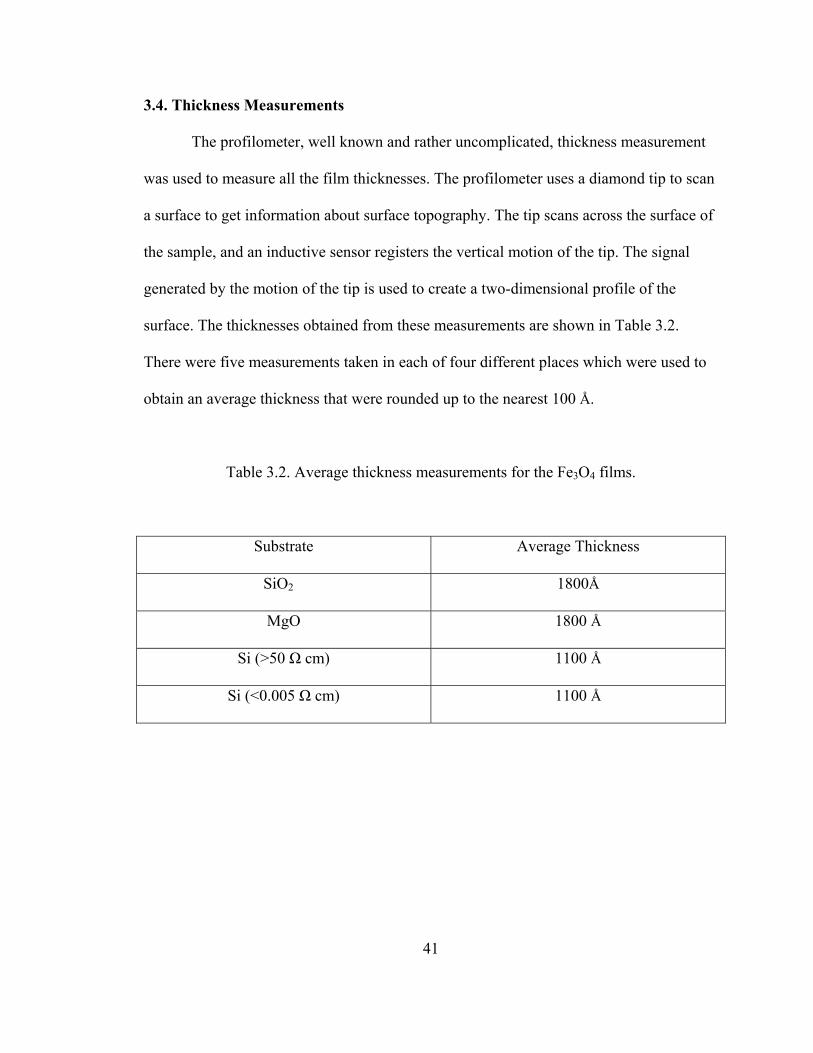
3.4. Thickness Measurements
The profilometer, well known and rather uncomplicated, thickness measurement
was used to measure all the film thicknesses. The profilometer uses a diamond tip to scan
a surface to get information about surface topography. The tip scans across the surface of
the sample, and an inductive sensor registers the vertical motion of the tip. The signal
generated by the motion of the tip is used to create a two-dimensional profile of the
surface. The thicknesses obtained from these measurements are shown in Table 3.2.
There were five measurements taken in each of four different places which were used to
obtain an average thickness that were rounded up to the nearest 100 Å.
Table 3.2. Average thickness measurements for the Fe3O4 films.
Substrate Average Thickness
SiO2 1800Å
MgO 1800 Å
Si (>50 Ω cm) 1100 Å
Si (<0.005 Ω cm) 1100 Å

42
CHAPTER FOUR
ELECTRICAL AND MAGNETIC CHARACTERIZATION
The electrical and magnetic characterization was mainly done using a model 6700
Physical Property Measurement System (PPMS) available in our Functional Material
Laboratory at University of South Florida (USF). In addition, I-V characteristics were
investigated using the standard four-point probe configuration which is in the LAMSAT
laboratory at USF.
The PPMS provides a flexible, automated work station that can perform precise
thermo control of various experiments such as magnetic, electro-transport, or
thermoelectric measurements from temperatures ranging from 350 K to 2 K. Liquid
helium is the cryogen and computerized temperature control is used by the PPMS for
accessing a wide range in temperature. The PPMS also is equipped with a
superconducting magnet that can be changed to produce fields up to ± 7T. We used the
PPMS system to measure resistance as function of temperature, R (T), both in the case of
presence and the absence of applied magnetic fields. Also, magnetization as a function of
applied magnetic field M (H), and as a function of temperature M (T) were measured.
This chapter consists of eight sub sections which describe seven experimental
procedures and the results. Section 4.1 is dedicated the overview of the PPMS to give the
43
reader a brief understanding. Sections 4.2 and 4.3 cover the resistance measurements and
magneto-resistance measurements for the magnetite films on SiO2, MgO, Si substrates.
Resistivity variation as a function of temperature is also presented and compared with
other literature. Section 4.4 and 4.5 present the magnetization measurements.
Magnetization as a function of applied field (M-H) in section 4.4 and magnetization as a
function of temperature (M-T) in section 4.5 are presented along with the analysis.
Section 4.6 presents the I-V characteristics for the Fe3O4 films on SiO2 substrate.
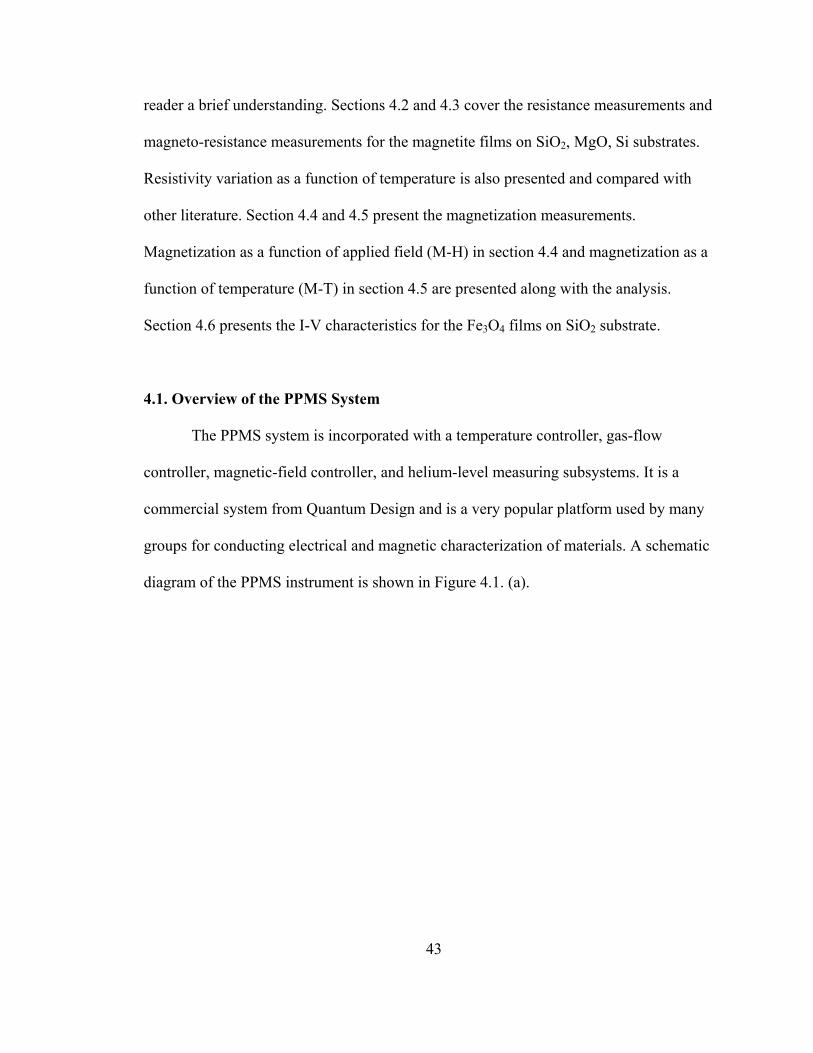
4.1. Overview of the PPMS System
The PPMS system is incorporated with a temperature controller, gas-flow
controller, magnetic-field controller, and helium-level measuring subsystems. It is a
commercial system from Quantum Design and is a very popular platform used by many
groups for conducting electrical and magnetic characterization of materials. A schematic
diagram of the PPMS instrument is shown in Figure 4.1. (a).
(a)
44
(b)
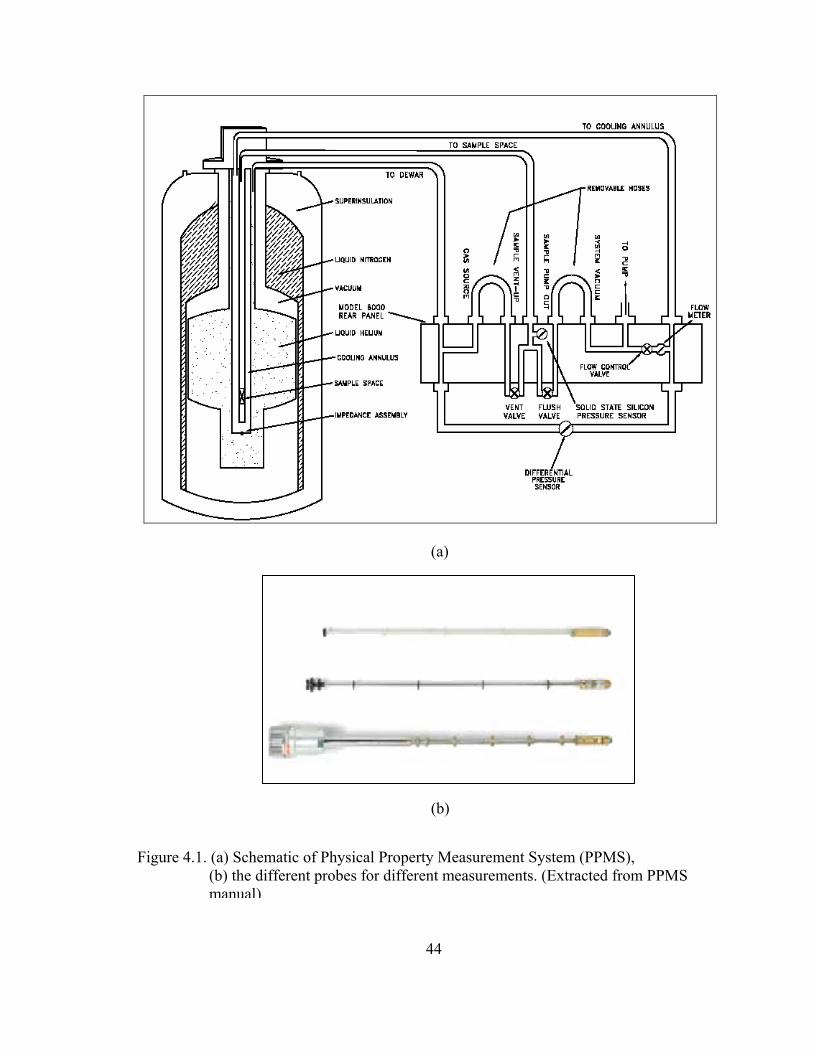
Figure 4.1. (a) Schematic of Physical Property Measurement System (PPMS),
(b) the different probes for different measurements. (Extracted from PPMS manual)
45
The dewar’s outer jacket has super insulation to help minimize He consumption.
This outer layer is evacuated through an evacuation valve. The cooling annulus is the
active region of temperature control. The continuously pumping vacuum pump draws
helium from the dewar through the impedance tube and into the cooling annulus. There
are two different thermometers in this system. A platinum resistance thermometer reads
temperature above 80 K and a negative temperature coefficient thermometer accurately
reads temperatures below 100 K. There are several probes, as shown in Figure 4.1.(b) that
are available to study the sample with PPMS in order to carry out different measurements
under different conditions. Computer controlled multi Vu software is used to operate and
collect data from PPMS. In addition, other LabView modules are also available in our lab
for user experiments using the PPMS.
4.2. Electrical Resistance Measurements
This section presents the sample preparation, installation, and results for electrical
resistance measurements for the films grown in this project. All the samples were
prepared with 0.3 cm x 1 cm area for the electrical measurements. Two samples were
mounted onto the resistivity puck in four point measurement configuration in a single
run. A layer of silicone vacuum grease was applied in between the sample mount and
substrate in order to achieve good thermal contact. The puck was mounted into the PPMS
after checking the lead connections. A quick resistance measurement was performed to
confirm the electrical contact leads attached using silver paint were robust and at the
same time to acquire an approximation of the sample resistance.

46
The bridge set up which is a part of the PPMS control was completed by choosing
the channel, current, drive mode, etc. The resistance data was collected in the cooling
cycle for all the samples presented in this section.
The experiment was performed for the Fe3O4 films on different substrates
such as MgO, SiO2, Si (low resistive and high resistive) to see substrate dependence on
the transport. The following sub sections present resistance raw data and the calculated
resistivity data for the different substrates.
4.2.1. Temperature Dependence of the Resistance in Fe3O4 Films Grown on SiO2
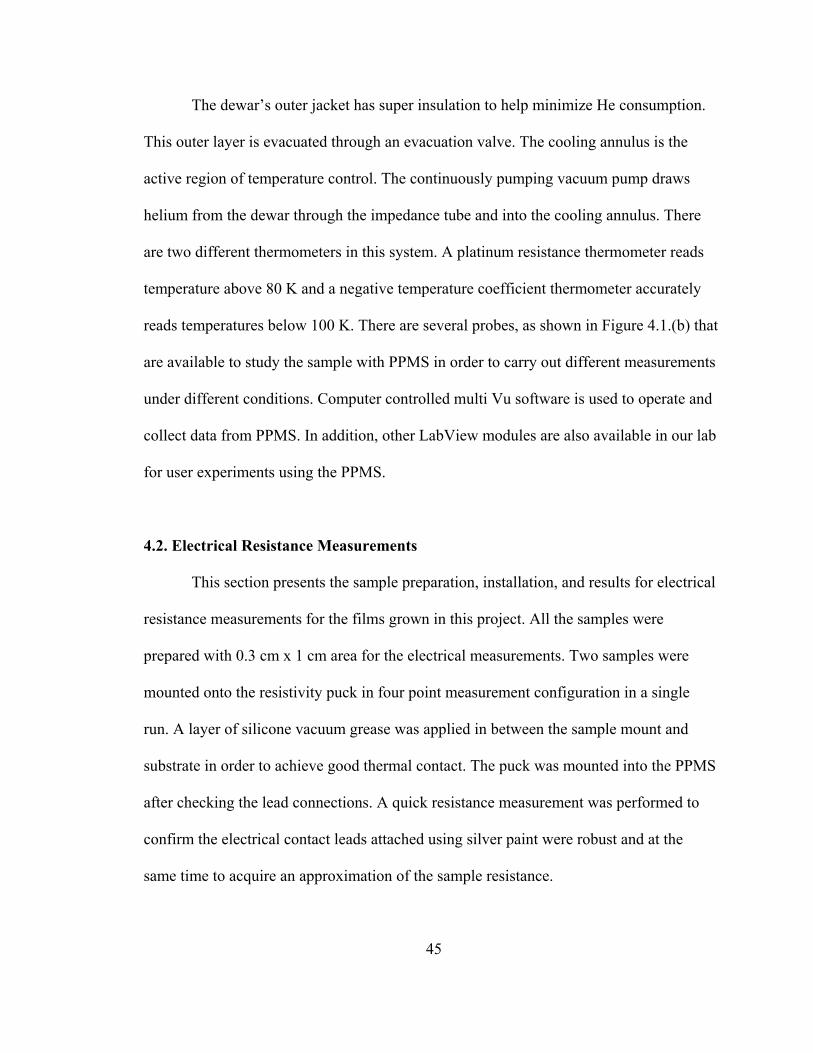
Figure 4.2 shows the resistance variation as a function of temperature. The
resistance increases as temperature is decreased and there are three distinct regions
marked by the shape of resistance change. The resistance increases slowly by one order
of magnitude as the temperature is decreased from 300 K to 124 K. At 124 K there is a
sharp increase in resistance. At the transition, the resistance increases with higher slope
than that of the first zone. The sharp resistance change in the second zone is called the
Verwey transition (Tv) and it occurred at 124 K. As explained in the introduction, this
sharp transition is associated with the structural transition from a cubic high temperature
to a monoclinic low temperature phase. The Verwey transition temperature observed here
matches well with the reported values. In general the transition observed in these films is
broader in comparison to the single crystal data possibly due to the residual strain in the
films resulting from the lattice mismatch with the substrate. The strain effects also result
in shifting of the Verwey transition temperature to lower values with film thickness.
50 100 150 200 250 3001x102
1x10³
1x10⁴
1x10⁵
1x10⁶
1x10⁷
Cooling
Res
ista
nce
(Ω)
T (K)
Fe3O4/SiO2
Figure 4.2. Temperature dependence of resistance for Fe3O4 film on SiO2 substrate. Thickness of the film is ~ 1800 Å.
4.2.2. Temperature Dependence of the Resistance in Fe3O4 Films Grown on MgO
The Fe3O4 film thickness was approximately 1800 Å for MgO. The R verses T
graph for a film on the MgO substrate is shown in Figure 4.3. As seen in Section 4.2.1,
three distinct regions of resistance variation can be identified for the Fe3O4 film grown on
MgO. A very sharp transition can be seen at 118 K with higher than one order of
magnitude resistance jump.
47

50 100 150 200 250 300102
103
104
105
106
107 Cooling
Res
ista
nce
(Ω)
T (K)
Fe3O4/MgO
Figure 4.3. Temperature dependence of resistance for Fe3O4 film on MgO substrate. Thickness of the film is ~ 1800 A˚.
The resistance data obtained from four point probe collinear method showed in
Figure 4.3. and sample geometrical data were used to calculate the resistivity by using the
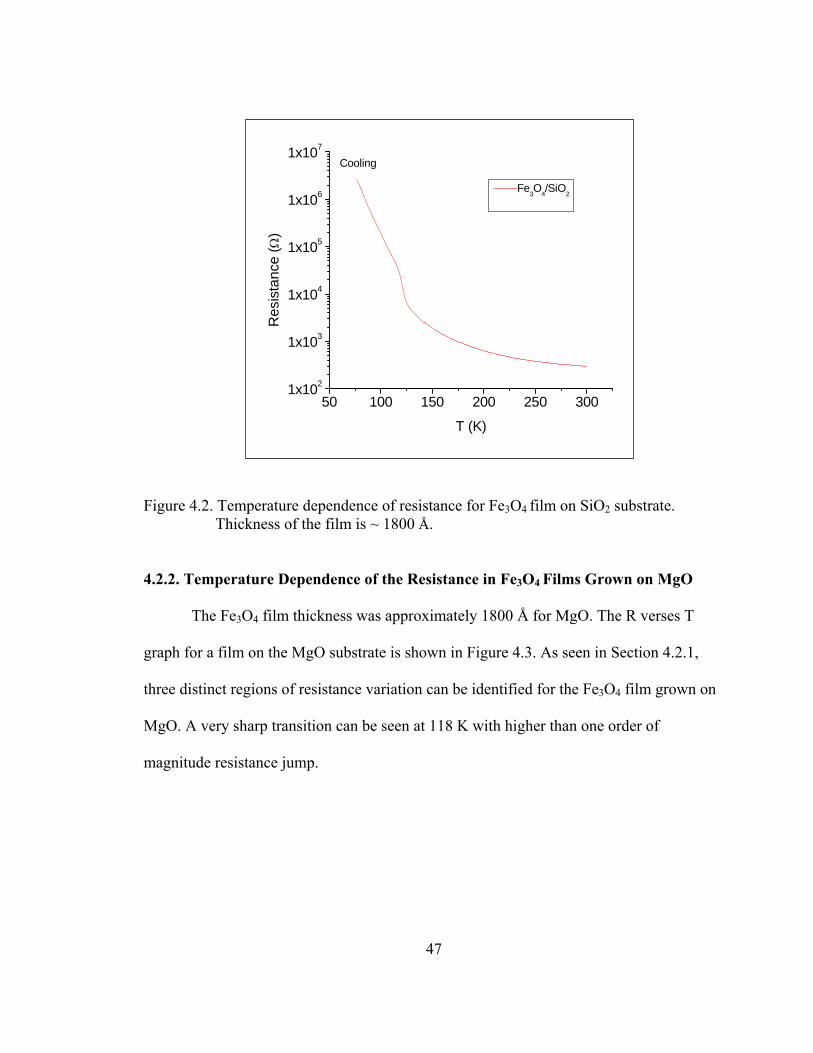
equation R= ρ l /A. The Figure 4.4 shows the resistivity variation for the Fe3O4 film on
MgO for the thickness of 1800 Å. The resistivity of the Fe3O4 film made on MgO
substrate was found to be 2.1 mΩ cm at room temperature. Ogale and co-workers have
declared in their paper that a typical value of well characterized single crystals is lower
than 10 mΩ cm at 300 K. This shows that our experiment results match very well with
accepted values. The sharpness and the order of magnitude of the Verwey transition are
the characteristics of good quality Fe3O4. In fact, there exist a few papers in literature
where sharp transitions are not reported. It is reported that the bulk Fe3O4 (thickness
48
>6000 Å) shows a very sharp transition with two orders of magnitude. Figure 4.3 shows
the very sharp transition with close to two orders of magnitude in our thin films. This
data along with XRD and EDS data show the evidence for good crystalline quality of our
films. The transition occurs at 118 K at a lower temperature than the film grown on SiO2
substrate. This may be due to substrates influence on the films characteristics.
50 100 150 200 250 300
5x10⁻³
5x10⁻²
5x10⁻¹
5x100
5x101
MgO
ρ (Ω
cm
)
T (K)
Figure 4.4. Temperature dependence of resistivity for Fe3O4 film on MgO substrate. Thickness of the film is ~ 1800 Å.
4.2.3. Temperature Dependence of the Resistance in Fe3O4 Films Grown on High
Resistive Si (resistivity > 50 Ω cm)
Fe3O4 films grown on a Si substrate had a thickness of approximately 1100 Å.
The Verwey transition is measured to be at 118 K. The sharpness of the Verwey
transition is not as steep as that of the films we discussed above. This can be due to either
49

the lower thickness of the film compared to the films on SiO2 and MgO, that have
thickness around 1800 Å or due to the unfavorable growth of an ionic oxide on a covalent
substrate. To grow Fe3O4 films on a Si substrate, Jain et.al have introduced buffer layers
such as Ta, Ti and SiO2 as they were unable to see Fe3O4 peaks of the film deposited on
bare Si substrate. But in our case, XRD shows the Fe3O4 peaks crystalline in the (111)
plane for the films on Si substrate without any buffer layer and the observation of
Verwey transition confirms the successful growth of Fe3O4 films. The transition
temperature (Tv) as determined by the change in slope of the R-T data is higher in
comparison to those of films grown on SiO2 and MgO substrates.
50 100 150 200 250 300
103
104
105
106011306/Si(>50Ω cm)
Res
ista
nce
(Ω)
T (K)
Figure 4.5. Temperature dependence of resistance for Fe3O4 Film on Si substrate
(resistivity > 50 Ω cm). Thickness of the film is ~ 1100 Å.
50

4.2.4. Temperature Dependence of the Resistance in Fe3O4 Film Grown on Low
Resistive Si (resistivity <0.005 Ω cm)
The graph shown here is taken from the four point probe method using Keithley
meters in LAMSAT laboratory at USF. Here we can see a decrease in resistance around
120 K instead of a sharp increasing expected for Fe3O4. We believe this is due to the
high conductivity of the substrate which offers a channel for current flow when the film
resistivity shows up in the vicinity of the Verwey transition. This may partly explain the
reason why not many groups have been successful in growing Fe3O4 films on Si
substrates. As we have shown here, better quality films can be achieved only if the
resistivity of the Si substrates considerably high.
Resistance vs Temperature
1.E-01
1.E+00
1.E+01
0 50 100 150 200 250 300
T ( K)
Res
ista
nce
[Ω]
Figure 4.6. Temperature dependence of resistance for Fe3O4 film on high conducting Si
substrate (resistivity <.005 Ω cm). Thickness of the film is ~ 1100 Å.
51

4.2.5. Comparisons and Conclusions
50 100 150 200 250 300
103
104
105
106
107
Res
ista
nce
(Ω)
T (K)
SiO2 MgO Si
Figure 4.7. Temperature dependence of the resistance of Fe3O4 film on SiO2, MgO and high resistive Si (>50 Ω cm) substrates, prepared under same condition at same time.
Table 4.1. Verwey transition temperatures for films on SiO2, MgO and high resistive Si (>
50 Ω cm).
Substrate Tv (K)
SiO2 124
MgO 118
Si (> 50 Ω cm) 118
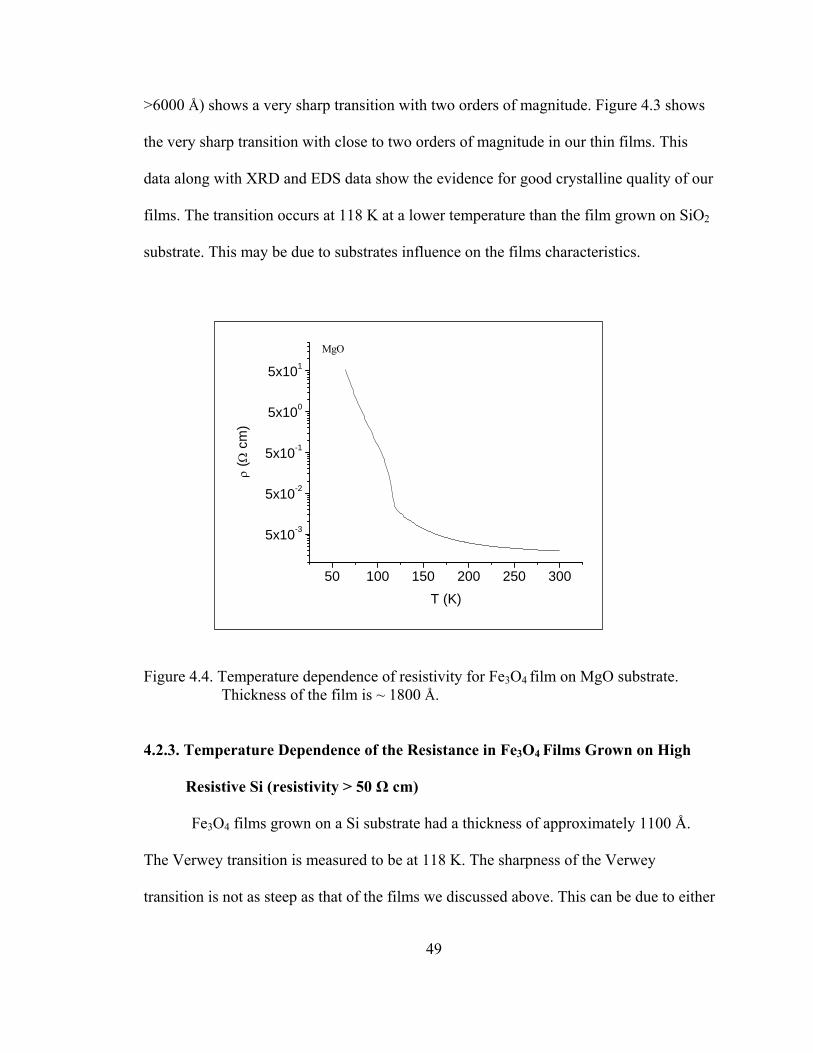
Figure 4.7 shows the comparison of temperature dependence of resistance for
Fe3O4 films grown on different substrates. It can be seen that the film on the MgO
52
substrate has the steepest transition. The Verwey transition for MgO and Si (>50 Ω cm)
can be seen at 118 K. The film on the Si substrate has the broadest transition. This can be
due to two reasons. One is as others have observed, it may be due to thickness
dependence. This is in agreement with the experimental results of X.W. Li et al reference
which we showed in Figure 1.6 in Chapter 1. The other reason is there can be substrate
dependence. To normalize the effect of different thickness of the films, we calculated the
resistivity for the films and displayed all in the same graph as seen in Figure 4.8.
50 100 150 200 250 30010-3
10-2
10-1
100
101
102
ρ (Ω
cm
)
T (K)
SiO2 MgO Si (>50 Ω cm)
Figure 4.8. Temperature dependence of the resistance of Fe3O4 film on SiO2, MgO and high resistive Si (>50 Ω cm) substrates, prepared under the same conditions and at the same time.
Resistivity starts at room temperature with the same resistivity range and
increases with different rates as the temperature decreases. This is an important
comparison because Figure 4.8 shows the role of substrates on Fe3O4 films. The XRD
53
54
results reveal that the film on MgO is (100) oriented and other samples are (111)
oriented. There is a close match in slope of the resistivity graph which can be seen for
films on Si and SiO2 substrates as the temperature decreases from 300 K down to Tv.
Resistivity of Fe3O4/ MgO increases with a lower slope during this temperature range.
The film on MgO is oriented in (100) direction and both films on Si and SiO2 are
(111) oriented which is the lowest energy orientation for the magnetite. The sharpness of
the transition is affected by the strain arising due to the lattice mismatch with the
substrate and also oxygen stoichiometry i.e., slight departure from the precise Fe:O
stoichiometry. It is also reported that the change in resistivity at the Verwey transition is
smaller for (111) than (100) oriented films. This is consistent with what was observed in
our samples.
The higher Tv of Fe3O4/SiO2 films at room temperature in comparison to the films
grown on Si and MgO may be due to the presence of Fe2Si phase as seen in XRD
analysis. It has been found that iron containing 3% silicon has four times the resistivity of
pure iron (C. W. Chen, 1977).
There are several models which have been introduced to describe the Verwey
transition since its discovery as discussed in Chapter 1. The most resent accepted model
is Mott’s view of the Verwey transition (T < Tv) which describes the transition as due to
the variable range hopping of small polarons. The formula is given by ρ = A exp (B/T) 1/4
where ρ is the resistivity and B is the activation energy. The conduction above the
transition is said to be due to the thermal excitation. The resistance above the Tv is given
by R =R0 exp (B/kbT), where kb is the Boltzman constant (Liang Wang, 1999).

4.3. Magneto-Resistance
Magneto-resistance is the change in resistance of a material when a magnetic field
is applied to the sample versus when no field is applied. The percentage magneto-
resistance is then defined as,
( )
1000 ×−
≡H
H
RRR
MR [4.1]
Where RH is the resistance when a magnetic field is applied, and R0 is the resistance for
zero field.
The resistance data of the sample as it is cooled from 300 K to the target
temperature of 10 K with a zero magnetic field applied (H= 0 Oe) was described in
Section 4.2. The sample was then cooled from 300 K to 10 K, at the same rate, with a
magnetic field (FC) of 5 Tesla applied perpendicular to the film surface, and the
resistance measurements were recorded. The notation FC is used for sample being field
cooled. It is reported that the transport properties of these films also depend on the
magnetic history of the sample. We measured the resistance of the sample while heating
at a constant rate both in the presence of the field and also in zero field. The magneto-
resistance of these films is calculated using equation 4.1.
4.3.1. MR for Fe3O4 on SiO2
Magnetite is well known for its negative magneto-resistance. The resistance
variation in the absence of the field and the 5 T field applied was plotted in the same
graph as shown in inset of Figure 4.9 in order to show this effect. As seen in the figure,
the resistance of the material in the presence of the magnetic field is lower than that when
55

there is no field applied. The figure shows the percentage magneto-resistance variation as
a function of temperature. The magneto-resistance (MR) is increasing monotonically
from 300 K to 130 K and close to the Verwey transition MR increases sharply and has a
highest value of 17 % at 123 K. Further lowering the temperature, the MR remains almost
the same up to the lowest temperature of 90 K. The sharp increase in MR close to the first
order Verwey transition has been observed previously by other groups. A sharp
magneto-resistance of 16 % in a magnetic field of 7.7 T was observed by Gridin et al for
a Fe3O4 single crystal near Verwey transition.
100 150 200 250 3000
10
20
100 150 200 250 300
103
10
105
106
R (Ω
)
T (K)
H 0 T H 5 T
(R0-R
H)/R
H %
T (K)
Fe3O4/SiO2
Figure 4.9. Temperature dependence of magneto-resistance for Fe3O4/SiO2 film. The inset
shows the resistance of the film in the presence of applied field of 5 T and for the 0 T case.
56
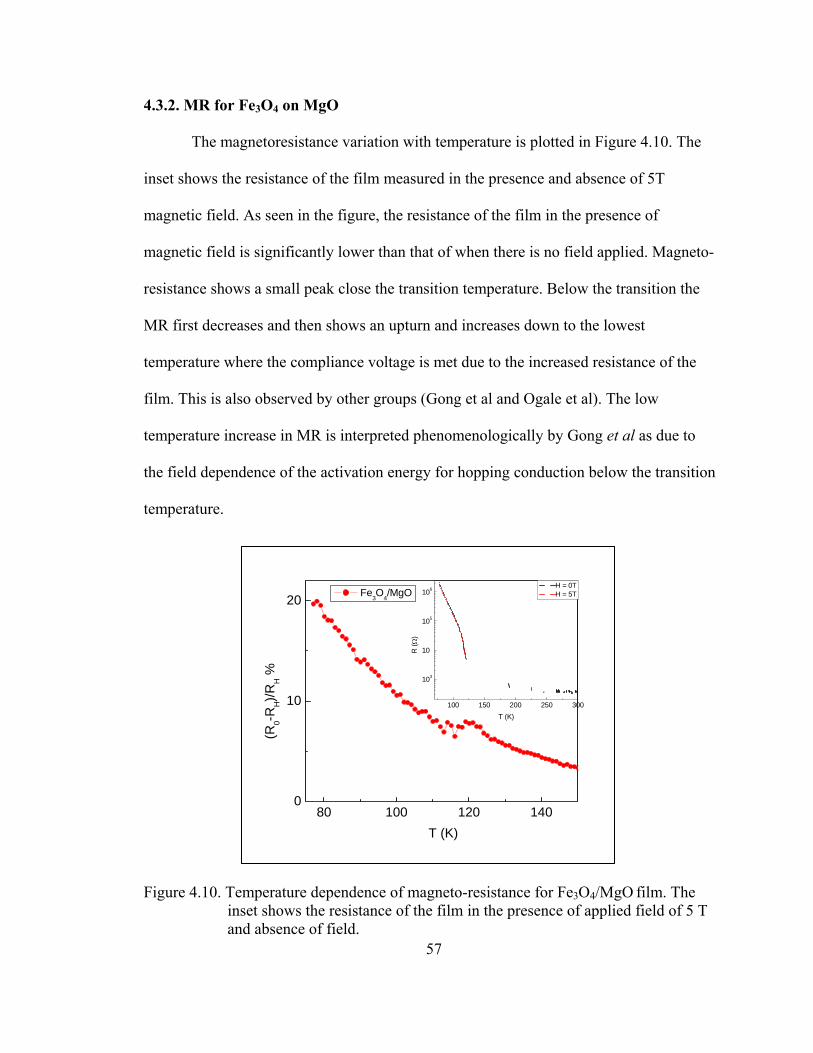
4.3.2. MR for Fe3O4 on MgO
The magnetoresistance variation with temperature is plotted in Figure 4.10. The
inset shows the resistance of the film measured in the presence and absence of 5T
magnetic field. As seen in the figure, the resistance of the film in the presence of
magnetic field is significantly lower than that of when there is no field applied. Magneto-
resistance shows a small peak close the transition temperature. Below the transition the
MR first decreases and then shows an upturn and increases down to the lowest
temperature where the compliance voltage is met due to the increased resistance of the
film. This is also observed by other groups (Gong et al and Ogale et al). The low
temperature increase in MR is interpreted phenomenologically by Gong et al as due to
the field dependence of the activation energy for hopping conduction below the transition
temperature.
80 100 120 1400
10
20
100 150 200 250 300
103
10
105
106
R (Ω
)
T (K)
H = 0TH = 5T
(R0-R
H)/R
H %
T (K)
Fe3O4/MgO
57
Figure 4.10. Temperature dependence of magneto-resistance for Fe3O4/MgO film. The inset shows the resistance of the film in the presence of applied field of 5 T and absence of field.

4.3.3. Fe3O4 on High Resistive Si (resistivity > 50 Ω cm)
The resistance variation in the absence of field and the 5T field applied
has been plotted in the same graph as in the above section, and is shown in Figure 4.11.
As seen in the figure, there is a small resistance lowering in the presence of magnetic
field.
50 100 150 200 250 300
1x10³
1x10⁴
1x10⁵
1x10⁶
Fe3O4/ Si(>50 Ω cm)
R (Ω
)
T (K)
Cooling (0T) Cooling (5T)
Figure 4.11. Resistance dependence on temperature of Fe3O4 film on Si (>50 Ω cm) substrate in the presence of applied field of 5 T and absence of field.
Conclusions:
We measured MR on Fe3O4 films deposited on different substrates. All the films
show an increase in MR at the Verwey transition temperature. The peak in MR matches
well with the reported values. The film on SiO2 shows a sharp peak in MR at Tv with no
increase at low temperature whereas Fe3O4 on MgO shows a small peak in MR close to Tv
and MR increase on further lowering the temperature.
58

59
Magneto-resistance has been studied by V.V. Gridin et al. (1996) on single-
crystal samples that showed that the MR has a sharp peak around Tv, with a maximum
value of 17% under 7.7 T and decreases very rapidly as the temperature deviates from Tv.
This magneto-resistance has been explained as resulting from the discontinuous change
of thermodynamic quantities accompanying the first order Verwey transition. Also G.Q.
Gong et. al. (1997) has reported magneto-transport properties of epitaxial film grown on
an MgO substrate and has observed the similar peak at around Tv. Additionally; they have
observed that the MR increases monotonically below 100 K with decreasing temperature.
MR values as high as 32% have been observed for a 6600 Å thick film at 60 K under a 4
T field. Our results on MgO substrate show a very similar feature.
The MR in Fe3O4 thin films is investigated by many groups and it is reported that
the transport properties of magnetite below TV is highly dependent on the history of the
sample. So MR not only depends on whether the sample is field cooled or zero field
cooled through the transition but also on its prior magnetic state. It is also to be noted that
the MR measurements are carried out in our PPMS using the resistivity option in which
during the measurement the voltage remains constant and the current changes as the
resistance of the sample is changed. In the case of Fe3O4 films the I-V characteristics are
non linear at lower temperature. So the change in current during the measurement can
influence the observed MR variation. In order to see the effect of variation of current and
also the magnetic state of the sample on the transport properties, future experiments
would focus on measuring the ac conductivity (in which the current can be kept constant)
on Fe3O4 films in a predefined magnetic state.
60
Magnetization Measurements
The Quantum Design AC Measurement System (ACMS) which is an option for
our PPMS was used for this experiment. DC magnetization measures the sample’s
magnetic moment M in an applied magnetic field H at a specific temperature. In this case
the sample moves through a set of copper coils and the induced signal is analyzed with a
digital signal processor to determine the sample’s magnetic moment. During a DC
magnetization measurement, the PPMS supplies a constant magnetic field to the sample
space, and the sample moves through the entire detection coil set in approximately 0.05
seconds. The ACMS takes 4,096 voltage readings during the sample translation and
creates a voltage profile curve for the translation. The detection coils register a voltage
proportional to the rate of change of magnetic flux through them. So the voltage profile is
the time derivative of the net flux through the coils. The sample moment M is obtained by
integrating the voltage profile.
4.4. Magnetization as a Function of the Applied Magnetic Field (M-H)
The same sample used in Section 4.2.1 was used for this experiment. The sample
was placed in a gel capsule longitudinally and inserted into a straw. Then the straw was
attached to the measurement probe and placed in the dewar. The next step is to center the
sample inside the probe coils. This is done by locating sample option in the ACMS
control center and setting a small field (500 Oe). Then the M vs. H and M vs. T were
measured. Here DC magnetization of ACMS measurement configuration was used to
measure magnetization. The magnetization was measured at 300 K while changing the
applied magnetic field from -6000 Oe to +6000 Oe at a rate of 280 Oe per second, where

10 000 Oe = 1 T. The same procedure was then repeated at 10 K. The M verses T
measurement was taken while changing temperature from 300 K to 10 K.
4.4.1. M-H for Fe3O4 on SiO2
-6 -4 -2 0 2 4 6-600
-300
0
300
600
10K -1100 to 990(Oe) 300K -290 to 290 (Oe)
Fe3O4/ SiO2 (011306)
Mag
netiz
atio
n (e
mu/
cc)
Magnetic Field (kOe)
Figure 4.12. M-H loops for Fe3O4 film on SiO2 at 10 K and 300 K .
Magnetization of the film on SiO2 substrate was measured while varying the
applied magnetic field from -6000 Oe to +6000 Oe. This measurement was done at two
different temperatures (300 K and 10 K). The hysteresis loops broadens at 10 K with
respect to 300 K loop. Also there is a small shift towards the negative side. The coercivity
Hc at 300 K is about 290 Oe and is almost symmetric. But at 10 K it has two different
values for positive 990 Oe and negative 1100 Oe. The saturation moment (MS) is 440
61
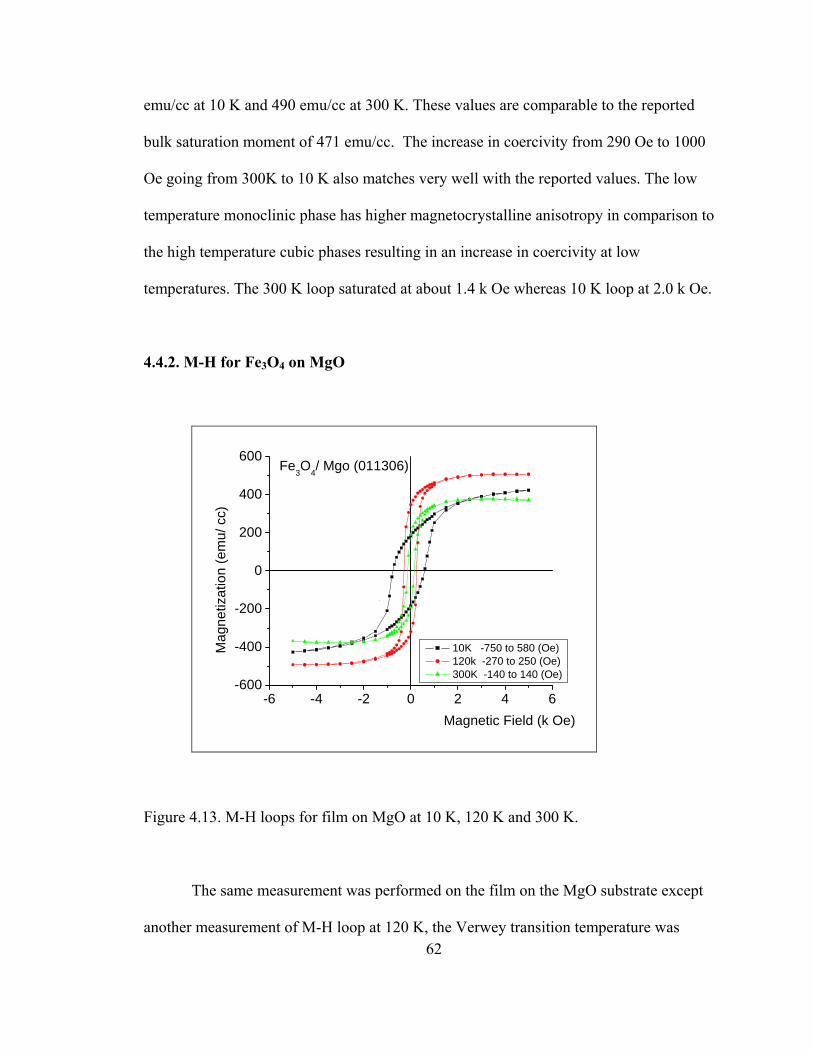
emu/cc at 10 K and 490 emu/cc at 300 K. These values are comparable to the reported
bulk saturation moment of 471 emu/cc. The increase in coercivity from 290 Oe to 1000
Oe going from 300K to 10 K also matches very well with the reported values. The low
temperature monoclinic phase has higher magnetocrystalline anisotropy in comparison to
the high temperature cubic phases resulting in an increase in coercivity at low
temperatures. The 300 K loop saturated at about 1.4 k Oe whereas 10 K loop at 2.0 k Oe.
4.4.2. M-H for Fe3O4 on MgO
-6 -4 -2 0 2 4 6-600
-400
-200
0
200
400
600Fe3O4/ Mgo (011306)
Mag
netiz
atio
n (e
mu/
cc)
Magnetic Field (k Oe)
10K -750 to 580 (Oe) 120k -270 to 250 (Oe) 300K -140 to 140 (Oe)
Figure 4.13. M-H loops for film on MgO at 10 K, 120 K and 300 K.
The same measurement was performed on the film on the MgO substrate except
another measurement of M-H loop at 120 K, the Verwey transition temperature was 62
63
taken. It can be seen that the loop is broadened as temperature is decreased. The loop at
300 K is perfectly symmetric and it has coercivity of 140 Oe. But as the temperature is
lowered, the loops tend to shift toward the negative side. At 120 K the coercivity of the
negative side is 270 Oe and that of the positive side is 250 Oe. At 10 K we can see a large
shift of loop with the coercivity of negative side is 750 Oe and positive side is 580 Oe.
The large loop shift observed at 10 K in Fe3O4 deposited on MgO substrate is also
observed by many groups and this is interpreted as due to the formation of antiphase
boundaries (APB) as a natural growth defect in this hetero-epitaxial films. The spinel
crystal structure of Fe3O4 films is lower in symmetry than MgO and as explained in
Chapter 2 the unit cell size of Fe3O4 is twice the size of MgO. It is reported that the
density of APBs is strongly influenced by the growth conditions and the substrate
microstructure. The presence of APB which is region coupled by antiferromagnetic
interaction with neighboring ferromagnetic domains leads to an exchange coupled system
which leads to a shifted hysteresis loop at low temperature.
The saturation Magnetization (MS) of films grown on MgO substrate are 428 emu/cc at
10 K and 370 emu/cc at 300 K.
We can clearly see higher magnetization at the 120 K relative to the other
temperatures. Bickford studied the temperature dependence of the ferromagnetic
resonance absorption in a synthetic single crystal of magnetite and found that above 130
K (which is above Tv) the anisotropy constant is negative, indicating that (111) is the easy
axis of magnetization, while below 130 K, (100) is the easy axis of magnetization. This
might explain the increase in magnetization of our film on MgO at 120 K as the film on

MgO substrate has (100) orientation. Saturation field for 300 K is about 1 kOe and for
120 K, it is about 2.2 kOe.
4.4.3. M-H for Fe3O4 on Si (resistivity > 50 Ω cm)
We also measured the M-H loops of films grown on Si (resistivity > 50 Ω cm)
substrate. Figure 4.14. shows the M-H loops carried out 10 K, 120 K and 300 K. These
M-H loops are as measured without the background correction due to the Si substrate.
The downward curvature of these loops at high temperature is due to the diamagnetic
contribution from the Si substrate. The saturation magnetization is 330 emu/ cc and is
much smaller in comparison to the bulk value.
-6000 -4000 -2000 0 2000 4000 6000-455
-303
-152
0
152
303
455
Mag
netiz
atio
n (e
mu/
cc)
Magnetic Field (k Oe)
300 K 120 K 10 K
Figure 4.14. M-H loops for film on high resistive Si substrate (resistivity > 50 Ω cm) at
10 K, 120 K and 300 K. 64

4.4.4. M-H for Fe3O4 on Si (resistivity <0.005 Ω cm)
We also measured the M-H loops of films grown on low resistivity Si substrates.
Figure 4.15 shows the M-H loops carried out of 10 K and 300 K. These M-H loops are as
measured without the background correction due to the Si substrate. The downward
curvature of these loops at high temperature again is due to the diamagnetic contribution
from the Si substrate. The saturation magnetization is 390 emu/ cc and is smaller in
comparison to the bulk value. The shift of the M-H loop at 10 K can be seen in the film
on low resistive conducting substrate as seen in for others.
65
200
400
0
Figure 4.15. M-H loops for film on low resistivity Si substrate at 10 K and 300 K.
-6 -4 -2 0 2 4 6
-400
-200
Fe3O4/ Si_.005 (011306)
Mag
netiz
aio
n (e
mu/
cc)
Magnetic Field (kOe)
t
10K -1200 to 1000(Oe) 300K -300 to 290(Oe)
66
Conclusions:
By comparing the values in Table 4.2., coercivity is remarkably high for the
polycrystalline films which have an orientation of (111). The epitaxial film on MgO
substrate which has an orientation of (100) has the lowest coercivity at room temperature.
This can be explain by the formation of microstructure. The Fe stacking sequence of
Fe3O4 in the (111) direction is comprised of alternating antiferromagnetically coupled
octahedrally and tetrahedrally coordinated sites. Hence each layer along the (111)
direction has a well defined magnetization direction in the plane of the sample. So that
the (111) direction films show the high coercivity. Also it is observable for all the films
the coercivity increases as temperature decreases. Large increase in coercivity can be
understood by recalling that while cooling through Tv the crystal structure changes from
cubic to orthorhombic (Sangeeta, 2001).
Films on SiO2 and Si exhibit a higher magnetic remanent compare to film on
MgO, which shows the lowest remanent among the substrates used. This might have a
direct correlation with the polycrystalline distribution of crystallites. As shown in the
SEM images in Chapter 3, SiO2 had the highest random orientation and the largest
crystallites. Films on MgO have a clear epitaxial nature.
Magnetization of films on SiO2 and Si are higher than the films on MgO. This is
due to MgO being oriented in the magnetic hard axis (100) and the others are oriented in
to magnetic easy axis (111).

67
Table 4.2. Coercivity, saturation magnetization, remanence values for the Fe3O4 films on SiO2, MgO, Si (>50 Ω cm) and Si (<0.005 Ω cm) substrates.
HC (Oe) MR (emu/cc) MS (emu/cc) Substrate
10 K 300 K 10 K 300 K 10 K 300 K
SiO2 -1100
1000
-300
300 340 300 440 490
MgO -750
580
-140
140 182 182 428 370
Si (> 50 Ω cm) -900
880
-350
350 274 252 330 330
Si(<0.005 Ω cm) -1100
1000
-300
290 220 260 390 390
4.5. Magnetization Versus Temperature (M-T)
The sample was cooled from 300 K to 10 K with zero Magnetic field applied
(ZFC), and the magnetization was measured while sweeping the temperature at 2 K per
minute. The sample was then warmed up to 300 K to eliminate the history effect. Again
the sample was cooled from 300 K to 10 K with 5T magnetic field (FC) with same rate
and the magnetization measurements were taken. Magnetization changes with the
temperature for both 300 Oe and 5000 Oe are plotted in the same graph. The graphs are
displayed in the same scale in order to compare the graphs with different substrate.

4.5.1. M-T for Fe3O4 on SiO2
Magnetization is increased under applied parallel magnetic field as temperature
decreases until the transition temperature is reached. At Tv one can see the
magnetization decrease to a lower value. This sharp transition again verifies the good
stoichiometry of the sample. There is an increase in magnetization after the transition
which can be seen for the applied field of 300 Oe whereas no such an increment in a field
of 5000 Oe after the transition.
0 50 100 150 200 250 300185
278
370
463
556Fe3O4/ SiO2 (011306)
Mag
netiz
atio
n (e
mu/
cc)
Temperature (K)
300 Oe 5000 Oe
Figure 4.16. M vs.T for the film on SiO2 under applied field of 300 Oe and 5000 Oe.
68

4.5.2. M-T for Fe3O4 on MgO
The magnetization increased under the applied parallel magnetic field as the
temperature was decreased until the transition temperature is reached. At the Tv can see a
magnetization decrease to a lower value. The transition under a low field is sharpest and
about 100 emu/cc. This sharp transition again verifies the good stoichiometry of the
sample. Strain due to the close lattice match of the substrate and the Fe3O4 may play a
role in the reduction of magnetization. The epitaxial nature also plays a major role in the
transition. There is an increase in magnetization after the transition which can be seen in
both high and low applied fields.
0 50 100 150 200 250 300185
278
370
463
556Fe3O4/ Mgo (011306)
Mag
netiz
atio
n (e
mu/
cc)
Temperature (K)
300 Oe 5000 Oe
Figure 4 17. M vs.T for the film on MgO Under applied field 300 Oe, 5000 Oe.
69

4.5.3. M-T for Fe3O4 on Si (<0.005 Ω cm)
0 50 100 150 200 250 300185
277
370
462
555 Fe3O4/ Si.005 (011306)
Mag
netiz
atio
n (e
mu/
cc)
Temperature (K)
300 Oe 5000 Oe
Figure 4.18. M vs.T for the film on low resistivity Si substrate under applied field of 300 Oe and 5000 Oe.
4.6. Current -Volatage Characteristics
I-V characteristics were investigated using the standard four-point probe
configuration which is in the LAMSAT laboratory at University of South Florida. A
Keithley model 224 constant current source was used to apply current and a Keithley 182
nanovoltmeter was used to measure the voltage. The sample was current biased. A
computer controlled LabView program was used to control the system via applied current
and temperature control and extracts data as measured voltage and calculated resistance.
A cryogenic He cooling system was used to lower the temperature. The supplied current
70

71
was varied from 1 to 10 µA in the both positive and negative direction. Eight voltage
measurements were taken for both directions for eight different applied currents.
Typically, measurements were performed in the temperature range of 300 K to 55 K.
4.6.1. Current and Voltage Dependence of Fe3O4 on SiO2
As seen in Figure 4.19, within the bias current range of 0.01uA to 10uA, current
and voltage has a linear dependence at higher temperatures. When the temperature is
lower than 90 K, within the same bias current range, a non-linear relationship is seen.
Figure 4.20 shows the non-linear current vs. voltage relationship at temperatures 65 K
and 70 K. This trend is consistent with the metal to insulator transition of Fe3O4. We can
interpret the result as above the transition as electron transfer within B sites due to the
thermal excitation. This should have ohmic behavior and Figure 4.19., shows the
agreement with the theoretical model. According to Mott’s formula, the conduction
which occurs due to tunneling and variable range hopping of small polarons occurs below
the transition. This is expected to have non linear behavior and our results are in
agreement with that expectation.

Current vs Voltage
-1.E-05
-6.E-06
-1 E-06
4.E-06
9.E-06
-0.04 -0.03 -0.02 -0.01 0 0.01 0.02 0.03 0.04
Voltage [V]
Cur
rent
[A]
300 200 135 125
Figure 4.19. I-V characteristics of the Fe3O4 film on SiO2 for the temperature range of
125 K ≤ T≤ 300 K.
Current vs Voltage
-10
-8
-6
-4
-2
0
2
4
6
8
10
-20 -15 -10 -5 0 5 10 15 20
Voltage [V]
Cur
rent
[µA
]
70 65
72Figure 4.20. I-V characteristics of the Fe3O4 film on SiO2 for temperature 70 K and 65 K.
73
CHAPTER FIVE
SUMMARY, CONCLUSIONS AND FUTURE PLANS
We were able to successfully grow crystalline Fe3O4 on four different substrates
namely, MgO, SiO2, high resistive Si (resistivity >50 Ω cm) and low resistivity Si
(<0.005 Ω cm) with good iron to oxygen stoichiometry. All the substrates were (100)
oriented. A Pulsed laser deposition (PLD) system was used to grow the thin films and
proved to be successful. The substrates were kept at 350˚C temperature and the
deposition process was carried out at a pressure lower than 5 x 10⁻⁷ Torr. Depositions
were made at the same time for all four substrates at a time in order to do a comparative
study. The substrate to target distance was kept at 6 cm in order to maximize coverage
area while maintaining reasonable growth (~0. 1 Å per laser pulse). Large target-substrate
distance provides the ablation plume to be wider when expanding away from the target.
Our intention was to deposit films with the same thickness on all the substrates; however,
we were unable to get the same thickness profile due to the limitation in coverage area.
Films deposited on MgO and SiO2 had thickness of 1800 Å while films on Si substrates
had average thickness of 1100 Å. This deviation can be caused by two factors. Growth
thickness decrease away from the center of the plume is a known fact. The other reason is
that the plume axis was pointing slightly off from the center of substrates. The PLD is a
74
known technique for formation of films with stoichiometry being the same from source to
target. Even with some limitation, PLD is a good technique for making magnetite films as
the magnetite properties crucially depend on stoichiometry. The short comings of small
area coverage of the film, inherent to PLD can be overcome by introducing a rotational
and/or translational motion of the substrate as we discussed in Chapter 2.
X-Ray diffraction (XRD) analysis on all of the films revealed peaks consistent
with the crystalline phase of Fe3O4. The target has (311) orientation and it can be seen
that the highest peak is 35.5˚. Fe3O4 on MgO substrate had orientation in (100) plane and
the other three films had orientation in the (111) plane. These results show that
orientation of films is strongly influenced by substrates. Films grown on amorphous SiO2
showed a strong peak of Fe2Si. This suggests a chemical reaction between Fe3O4 and
SiO2 layers at the interface. One has to achieve better control of the interface when
considering integration of the film with semiconductors.
Thickness measurements were done using a profilometer and it was found that the
films on MgO and SiO2 have 1800 Å and the films on Si substrates were ~ 1100 Å thick.
Scanning electron microscopy (SEM) showed evidence for epitaxial structure of the films
on MgO substrate. Films on SiO2 and Si revealed crystallites with a preferred orientation.
Physical Property Measurement System (PPMS) was used to carry out all of the
transport and magnetic measurements, except for the I-V characteristics. Temperature
dependent resistivity serves as a quality factor in determination of quality of Fe3O4. First
the resistance measurements were carried out on samples and our studies revealed their
dependence on substrates. The films on MgO, SiO2, Si (resistivity >50 Ω cm) showed the
Verwey transition at 118 K, 124 K and 118 K respectively. However, the Si (<0.005 Ω
75
cm) substrate showed a resistance decrease instead of increasing around the transition
temperature. We believe this is due to the substrate itself providing a channel for
conduction. This may be utilized in device fabrication. For example, it may be attractive
for devices which need good magnetic properties and also low power consumption. We
calculated resistivity in order to see whether our results agreed with values reported in
literature. The resistivity values were found to be ~2 mΩ cm for the films on all the
substrates except high conducting Si, and values fall in the expected range.
Magneto-resistance was measured for Fe3O4 films deposited on different
substrates. A peak was observed in MR at the Verwey transition temperature. The peak
in MR is also consistent with other reports. The film on SiO2 shows a sharp peak in MR
at TV with no increase at low temperature whereas Fe3O4 on MgO shows a small peak in
MR close to Tv and MR increases upon further lowering of the temperature.
The magnetization verses applied magnetic field (M-H) loops were measured on
all films. Magnetic parameters such as coercivity, remanent and saturation magnetization
values were obtained for all the films and were in good agreement with literature values.
We observed that the coercivity increases with decreasing temperature. Large increase in
coercivity can be due to the crystal structure changing from cubic to orthorhombic during
cooling through Tv (Sangeeta, 2001). J. J. Sen et al have observed that the coercivity and
the loop shift both decrease with the increase of the temperature and the latter vanishes at
about 200K. It has been ascribed to the decrease of the pinning field with the increasing
of the temperature and is consistent with the exchange bias idea (J.J. Shen, 2006).
Also the magnetization as a function of temperature (M-T) were measured under
high applied field (5000 Oe) and low applied field (300 Oe) the Verwey transition around

76
120 K was observed. Also, films on MgO have higher difference of magnetization at the
transition temperature. Both transitions of R-T and M-T are strong indicators of good
stoichiometry and high crystalline phase of the thin film. MgO appears to be the best
substrate for obtaining sharp Verwey transition. Moreover the I-V curves we obtained for
the films on SiO2 substrate showed linear relationship from room temperature to Tv and
non liner relationship below Tv. We believe that our work reports one of the first
systematic studies of the substrate influence in magnetite films. A manuscript based on
the results presented in this thesis will be communicated for publication in the future.
5.1. Future Plans
Our immediate future plan will be carrying out magneto-resistance measurements
under a controlled environment with extreme care. Another plan is to grow nano scale
films and investigate the grain size influence on the properties. An interesting plan would
be to grow granular films embedded in metallic matrix such as Cu and Au. In this case,
we could do spin polarization experiments at low temperature which is currently not
possible because of the intervening Verwey transition at 120 K. Future plans also include
exploring the magnetic anisotropy using RF transverse susceptibility that has being
developed in our laboratory.
77
REFERENCES
1. C. W. Chen, Magnetism and Metallurgy of soft Magnetic Materials, North Holland Publishing Company, Amsterdam, p.276, (1977).
2. C. A. Kleint, H. C. Semmelhack, M. Lorenz, and M. K. Krause, J. Magnetism and
Magnetic Materials. 140–144, 725 (1995). 3. D. T. Margulies, F. T. Parker, and F. E. Spada, Physical review B ,539176 (1996). 4. E. J. W. Verwey, P. W. Haayman, Physica VIII, 9 979 (1941). 5. G. K. Rozenberg, G. R. Hearne, M. P. Pasternak, P. A. Metcalf, and J. M. Honig,
Physical Review B 53, 6482 (1996). 6. G. Q. Gong, A Gupta, Gang Xiao, W. Qian and V. P. Dravid, Physical Review B 56
5096 (1997). 7. Hitchhiker's Guide to Magnetism Bruce M. Moskowitz, Environmental Magnetism
Workshop (1991). 8. N. Tsuda, K. Nasu, F. Atsushi, K. Siratori, Electronic Conduction in Oxides, ISBN
3-540-66956-6, Springer Verlag burling Heideburg, New York, (2000).
9. S. B. Ogale, K. Ghosh, R. P. Sharma, R. L. Greene, R. Ramesh, and T. Venkatesan Physical Review B 57 7823 (1998).
10. S. Jain and A. O. Adeyeye, C.B. Boothroyd, Journal of Applied Physics 97 93713
(2005).
78
11. S. K. Arora, R.G.S. Sofin, A. Nolan, I. V. Shvets, Journal of Magnetism and Magnetic Materials, Volume 286, p. 463-467 (2005).
12. X. W. Li, A. Gupta, Gang Xiao and G. Q. Gong, Journal of Applied Physics 83 7049
(1998). 13. Sangeeta Kale, S. M. Bhagat, S. E. Lofland, T. Scabarozi, S. B. Ogale, A. Orozco, S.
R. Shinde, T. Venkatesan, B. Hannoyer, B. Mercey, W. Prellier, Physical Review B, Volume 64, 205413 (2001).
14. Friedrich Walz, Journal of Physics: Condensed matter, 14 R 285 (2002). 15. G. K. Hubler, “Pulsed Laser Deposition of thin films”, J. Wiley, New York, (1994). 16. Liang Wang, Jianmin Li, Weiping Ding, Tiejun Zhou, Bin Liu, Wei Zhong, Jian Wu,
Youwei Du, Journal of Magnetism and Magnetic Materials, 207 111 (1999).
79
BIBLIOGRAPHY
1. A. Bolloero, M. Ziese, R. Hohne, H. C. Semmelhack, U. Kohler, A. Setzer, P. Esquinazi, Journal of Magnetic Materials, 285 279 (2006).
2. Hongliang Li, Yihong Wu, Zaibing Guo, Shijie Wang, Kie Leong Teo, Teodor Veres, Applied Physics letters, 86 252507 (2005).
3. J. H. De Boer, E. J. W. Verwey, Semi-conductors with partially and with completely filled 3d- lattice bands.
4. Jinke Tang, Kai-Ying Wang, Weilie Zhou, Journal of Applied Physics, 89 7690 (2001).
5. M. Ziese and H. J. Blythe, Journal of Physics, Condensed matter, 12 13 (2000)
6. Mizue Ishikawa, Hidekazu Tanaka, Tomoji Kawai, Applied Physics Letters 86, 222504 (2005).
7. R. G. S. Sfin, S. K. Arora, I.V. Shvets, Journal of Applied Physics, 97 10D315 (2005).
8. R. J. Kennedy and P.A. Stampe, Journal of Physics 32 16 (1999).
9. S. I. Rybchemko, Y. Fujishiro, H. Takagi, M. Awano, Physical Review B 72, 054424 (2005).
10. T. Hibma, F. C. Voogt, L. Niesen, P. A. A. van der Heijden, W. J. M. de Jonge, J. J. T. M. Donkers, and P. J. van der Zaag, J. Appl. Phys. 85, 5291 (1999).
80
11. V. V. Gridin, G. R. Hearne, J. M. Honig, Physical Review B, 15 519 (1996).
12. Ze Zhang and Sashi Satpathy, Physical review B, Volume 44 13319 (1991).
13. Zuqin Liu, Daihua Zhang, Song Han, Chao Li, Bo Lei, Weigang Lu, Jiye Fang, and Chongwu Zhou, Journal of American Chemical Society, 127 6 (2005).