growth and investment in east as before and mter the
TRANSCRIPT
Growth and Investment in East Asia Before and Mter the Financia1 Crisis
Robert J. Barro and Jong-Wha Lee*
In 1997-8, five East Asian countries - Indonesia , Malaysia ,
Soulli Korea , the Philippines , and Thailand - experienced sharp currency and ban잉ng crises. The contraction of reaJ GDP was severe in relation to the previous history and in comparison with five East Asian countries that were Iess affected by the financiaI crisis. Recoveries in the five countries were strong in some cases, but it is uncIear whether the pre-crisis growth rates wiIl be reattained. Indications for permanentIy depressed prospects come from the sharp reductions in investment ra디os ,
which have recovered only slightIy , and the Iowered stockmarket prices. A panel analysis for a broad group of economies shows that a combined currency and b밍lking crisis typically reduces economic growth over a five-year period by 2% per year The East Asian experience ovel 야1e 1997 -8 crisis is in general consistent with this stylized pattem. The broader analysis found no evidence that financial crises had effects on gro、Nth that persisted beyond a five-year pe디。d
Keywords: East Asia , Financial crisis , Growth , Panel regression
JEL Class댄cation: 04 , 01 , F4
1. Introduction
The Asian financial crisis began with the floating of the Thai
baht in ,July 1997. The crisis then spread rapidly to the Philippine
peso and the Malaysian ringgit. In August, the Indonesian rupiah
* Professor, Department of Economics Littauer 218, Harward Univers i":y , USA, π'el) +1-617-495-3203, (E-mail) [email protected]; Professor, Department of Politics and Ecomomics , Korea University, Seoul, Korea , (Tel)
+82-2-3290-2216, (E-mail) jon밍[email protected] , respectively. We are grateful to John F'emaJd , Keunkwan Ryu , and paπicipants at the Eleventh Seωl Journal of Economics International Symposium for helpful comments [Seoul Journal of Economics 2003, Vol. 16, No. 2J

84 SEOUL ]OURNAL OF ECONOMICS
devalued. ultimately by more than any other Asian currency. Rela다vely small depreciations occurred in the Singaporean dollar. staπing in August, and the New Taiwan dollar. starting in October.
The South Korean won depreciated substantially staπing in November. Japan also had a moderate devaluation between July 1997 and January 1998. No significant devaluations took place in China. which has remained relatively insulated from world financial markets. and Hong Kong. which maintained a currency board linked to the U.S. dollar.
This study focuses on 야le immediate and long-term effects of the Asian financial crisis on economic performance in East Asia. Specifically. we consider the behavior of economic gro\\πh and investment in China. Hong Kong. Indonesia. Japan. South Korea. Malaysia. the Philippines. Singapore. Taiwan. and πlailand.
These ten economies break down naturally into two groups depending on the extent to which they were impacted by the financial crisis of 1997-8. The first group of five countries
Indonesia. South Korea. Malaysia. the Philippines. and Thailand experienced nominal currency depreciations of more than 50 percent from July 1997 to early 1998. In these countries. offshore nominal interest rates (determined primarily by forward exchange rates) or onshore rates reached at least 25 percent at some point between June 1997 and January 1998. Subsequent1y. we refer to this group as Asian-crisis countries. The other five East Asian economies experienced nominal depreciations of less than 25 percent. and nominal interest rates remained below 20 percent. 1
One objective is to assess whether the Asian financial crisis had a long lasting effect on growth prospects and other dimensions of economic performance for the two groups of Asian economies. This task is difficult because only limited data are available after the ends of the financial crises in 1998. However. we get some information first by looking at post-crisis behavior within the group of East Asian economies. second by imbedding this behavior within a panel analysis of a large number of economies. and finally by using the panel to take a broader view of the impact of currency crises.
'Offshore interest rates in late 1997 reached 18 percent in Hong Kong and 17 percent in Singapore. Meanin멍ill data on interest rates are unavailable for China. but the official exchange rate remained 찌rtually
unchanged

GROwrH AND INVESTMENT IN EAST ASIA
11. Recent Economic Performance in the East Asian
Economies
A. Economic Growth
85
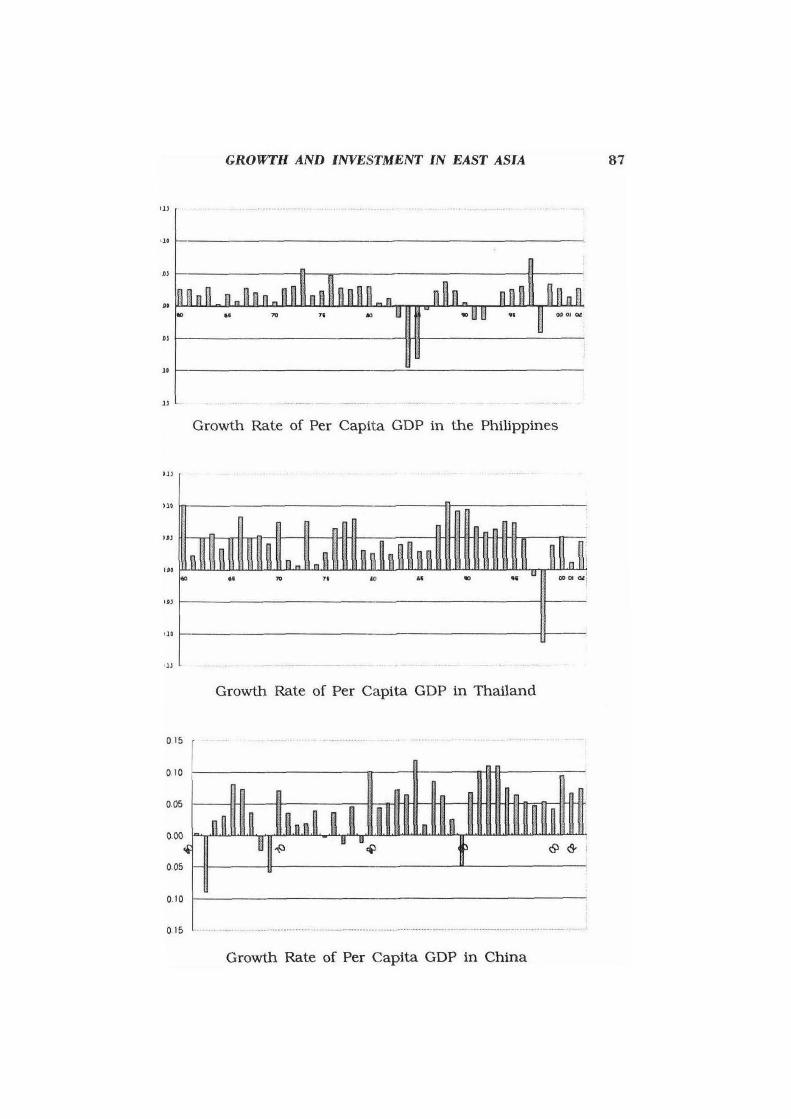
Figure 1 shows the annual growth rate of real per capita GDP
for each of the East Asian economies from 1960 to 2002. 2 The
sharp economic contractions in 1998 for the five Asian-crisis countries are evident: real per capita GDP (as the purchasing-power
adjusted value) fell by 12 percent in Indonesia. 11 percent in
Thailand. and 10 percent in South Korea. but only 3 percent in the Philippines and 1 percent in Malaysia. 3 The other five East Asian
economies were less affected: per capita gro\\πh during 1998 was
9 percent in Hong Kong. - 4 percent in Singapore. - 2 percent in
Japan. 4 percent in Taiwan. and !;i percent in China.
In 1999-2000. economic recovenes occurred. and the per capi1a
growth rates were posi디ve in all ten economies. Among the fi、 e
crisis countries. the annualized p(‘r capita growth rates were 8 per
cent in South Korea. 4 percent in Thailand. 3 percent in Malaysia and the Philippines. and 2 percent in Indonesia. For the other fi、 e
economies. the rates were 7 percent in China and Singapore. 5
percent in Hong Kong and Taiwan ‘ and 1 percent in Japan.
A central issue is whether the l':ast Asian economies will be able to return to the pre-crisis trend rate of growth. It is not clear if tt:e
recoveries. in the post-crisis period signal a return to the previot;.s
pattems of growth for the crisis-hit East Asian economies. In fact.
the rebound of growth for 1999-2000 slowed down in ttle
subsequent period. In 2001-2. the annualized per capita grow1h
rates were 4 percent in South Korea. 3 percent in Thailand. 2
percent in Indonesia and the Philippines. and 0 percent in Malaysia.
ιThe underlying GDP data are the purchasing-power adjusted values froπl Penn-World Tables 6.1. as described in Surnmers and Heston (1 991) and Heston. Summers. and Aten (2002). We updated the Surnmers-He않ston dalι)
for 2001 and 2002 by using information on real GDP from the Intemational Monetary Fund. World Economic Outlook.
3According to the Penn-World Tables 6. 1, per capita GDP growth rate m 1998 was - 0.6% for Malaysia. This estimate based on the PPP adjusted GDP series seems too low. For instance. the conventional national account data from the IMF source was • 9.70;,). For other East Asian countries. 야le
discrepancies between two sources are less significant.

86 SEOUL }OURNAL OF ECONOMICS
UJ
U.
UJ
U'
. I'J
-U'
UJ ‘_, - _, _.-... _ ............. _ ... _ .... _ ..... , .............. ~"'_., .. " .............. _.-‘--_.~ ..... ' ................ _-‘_ ........... -.... … ... _ .... " ... _ .... -._- ‘ ...... , ...... -’ Growth Rate of Per Capita GDP in Indonesia
U J
tl.
UJ
U'
-u ’
-'11
IlJ
Growth Rate of Per Capita GDP in Korea
tlJ
U •
. "
... -UJ
.fJf
-tlJ ‘- .. _-_.--- -_, ._ .... _ ................ __ ._~._._ ..... _--_. _ .... -... -._.-...... _ .. __ ...... _----_ .... _ ... __ .. _ --_._.~",
Growth Rate of Per Capita GDP in MaJaysia
GROWI'H AND lNVESTMENT lN EAST ASIA
’II
'l'
ÞI
••
• ,
II
II
Growth Rate of Per Capita GDP in 암le Philippines
‘I I
)U
’"
”’
’"
'JO
' ll
Growth Rate of Per Capita GDP in Thailand
015
0.10
때 뼈 뼈
0.10
0.15 ’ .. __ ._ ............. , . .1
Growth Rate of Per Capita GDP in China
87

88 SEOUL }OURNAL OF ECONOMICS
’ 11
010
U1
‘ '0
-OÞJ
010
-Ol)
Growtb Rate of Per Capita GDP in Hong Kong
’ 11 , ’ • _ ••• - . _
010
‘ .1
”’ ‘ 0 .1
‘ 010
.’l ’
Growth Rate of Per Capita GDP in Japan
'11
010
.‘i
’JO
-U1
.1’
.11
Growtb Rate of Per Capita GDP in Singapore

GROWl'H AND INVESTMENT IN EAST ASIA “9
01’
.,.
“ 1
“‘ -0 .1.)
011
OJJ
Growth Rate of Per Capita GDP in Taiwan
FIGURE 1
Thus. it looks likely that the financial crisis in 1997 -8 h a.d persisting effects on grow단1. However. the subsequent downturTI over the period 2001-2 may have come from the global recession. During the same period. the non -crisis East Asìan economies also experienced a drastic r.외1 in per capita grow야1 rates: the annualized per capita gro、짜h rates were - 2 percent in Singapore and 0 percent in Hong Kong and Taiwan. Furthermore. even without tbe Asian financial crisis. projected growth rates in East Asia would have differed from historical ones. paπly because the various economies had become so much richer than they were in 1960.
Therefore. the ques디on is whether gro、Nt.h forecasts would revert 1.0
those that would have been made before the Asian financial crisi::;. The subsequent analysis quanti.fi.es these growth pr이ec디ons and tries to reach some conclusions about the long-term outlook.
B. Investment Ratios
Figure 2 depicts 삼1e investment ratios for the East Asian econornies from 1960 to 2002. 4 Four of the Asian-crisis counmes -
송fhe ratios are for real investment (private plus public) relative to re꾀 GDP. The under밴ng data are the purchas1ng-power adjusted values from 야le Penn-World Table 6. 1. For 2001 and 2002. the values were estimated from infonnation on re외 investment and real GDP from the IntemationaJ Monetary Fund. WorLd Economic Outlook and the Asian Development Bank. Key Indicators oJ Developing Asian and paciflC Countries. These numbeJ's were linked to the Penn-World Tables values based on a comparison in the overlapping year 2000 (1996 for Singapore. 1998 for Taiwan).

90
0.5
0.4
0 .3
0.2
0 .1
0 .0
OJ
.‘
0)
’1
Il
.J
u
’ j
11
. Il
.。 ••
..
“
SEOUL }OURNAL OF ECONOMICS
’‘ ’‘ .。 ‘· .。 .‘ 。.01 。‘
lnvestment Ratlo in lndonesia
,。 .. .。
“ '" ., 00010‘
Investment Ra디o in South Korea
,。
’‘ .. “ .. •• .., 01 Ql
Investment Ratlo in M려aysia

GROWTH AND lNVESTMENT lN EAST ASIA 91
'J
tJ
.)
.)
.)
“ .。 .‘ ,。 71 ‘ i “ .. •• 。D 01 Qt
Investment Ratio in the Philippines
'J
“
’ J
‘i
11
” .。 .. ”’ 71 .。 “ .。 “ 。001 Ql
lnvestment Ratio in Thailand
’」
’j
IJ
‘1
11
‘· .。
“ '" ’‘ .. “ .。 •• .. .,'"
Investment Ratio in China

92 SEOUL JOURNAL OF ECONOMICS
‘i , .’.. .-- ‘ ...... ‘’ .‘·i “ ‘”..... ..... · · ‘· .. ~. -- -.. -,. “ --- ----. • …-. - “-.. ' -~ -- -i
“
tJ
.2
u
” .。 .‘ ,。 11 ID ‘· .。 .‘ a:t 01 Qt
Investment Ratio in Hong Kong
.J
“
’ j
nnnn~~~ ‘i
11
“ .。
“ 꺼i ’‘ .。 •• .. .‘ oø 01 Qt
Investment Ratio in Japan
“
.‘
nnn~ 때n~뺨rm~n~~~~n~~때mmm~~~삐J f)
t1
fl
‘l .。 .‘ i。 11 ‘ i “ “ “ 。001'"
InvestInent Ratio 1n Singapore

GROWIH AND INl'ESTMENT lN EAST ASIA !’3
IJ
.‘
OJ
12
8J
“ .。 .. 1。 ’‘ m “ .。 .‘ 。... 。‘
Investment Ratio in Taiw없1
FIGURE 2
Indonesìa, South Korea, Malaysia, 하ld π1ailand - showed dramati c declines in 1998, by well over ten percentage points. For the Philippines, which historically had a low investment ratio , the reduction in 1998 was comparatively small , amoun디ng to about 2 percentage points ‘ For the four countries in which investmen.t declined sharply, the failure to see substantial recoveries i:n 1999-2002 suggests that some삼1ing permanent may have occurred.5
However, it 1s a1so possible that investment ra디os tend gener려ly to recover more slowly than rates of economic grow상1 , and the subsequent cross-country 없lalysis supports 삼1is viewpoint.
The other five East Asian economies e강1ibited milder decreases or no decreases in investment ratios during 1998. Hong Kong,
Japan 하1d Sìngapore had small reductions from their peak ratios., r없1밍ng from 2 to 3 percentage points. There was little or n o dechne for China 없1d Taiw밍1 . π1US , there is reason to beheve that the dramatic falls in the investment ratios in Indonesia, SoUtll Korea , M머aysia, and 까1ailand were specifically related to the Asian
5Al야lOugh parts of the sharp declines in real investments are attributed to the increase in investrnent prices due to currency crashes. there must b년 other factors that have caused the permanent slump of investment. In Korea. for ex없nple. after the nominal exchange depreciation of 40% in 1997. domestic price of investment goods on average increased by 19% in 1998. However. since 야len 디1e price continue to have dropped by 13% ove:~
the period of 1999-2002.
94 SEOUL ]OURNAL OF ECONOMICS
financial crisis.
C. Stock-Market Prices
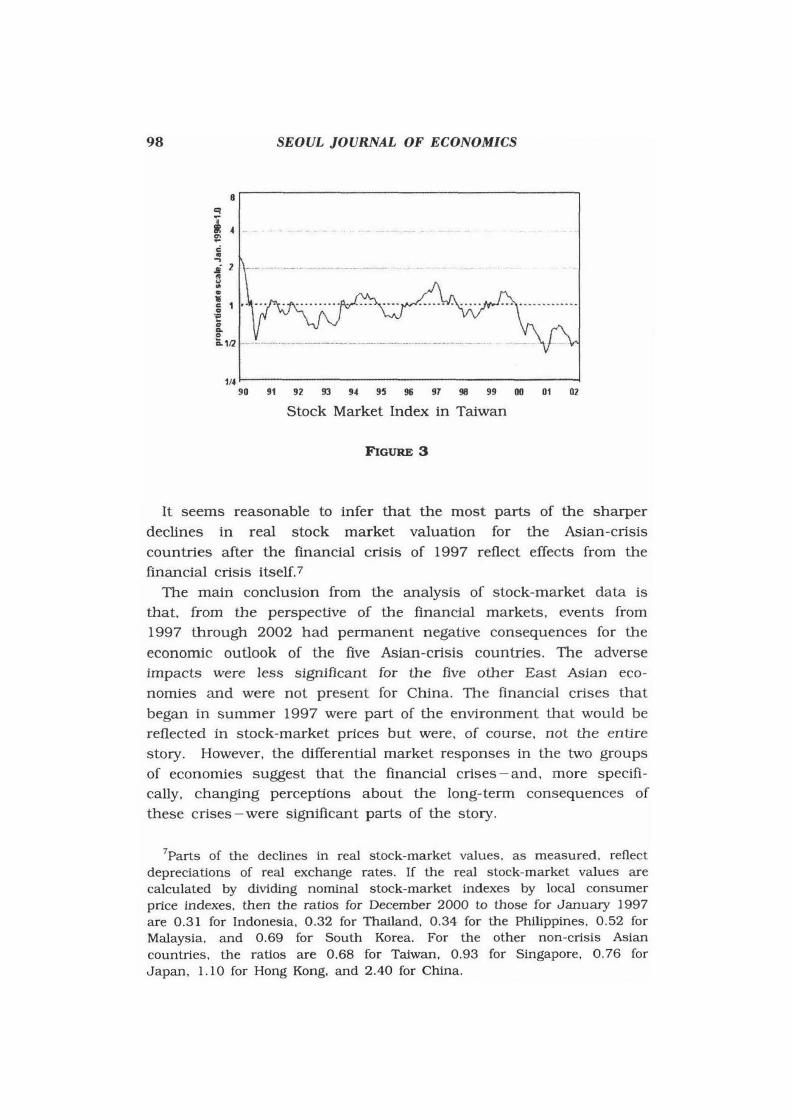
Figure 3 examines pattems in real stock-market prices. πle
general idea is that a f:벼1 in an economy’s stock market likely reflects the market's belief that long-term gro"πh prospects have diminished. In the figures , the real stock-market values are computed by conveπing loc외 currency values of stock-market indexes to U.S. dollars 와ld then di찌ding by a measure of the U .S. price leve1.6 An altemative procedure would deflate the local currency stock-market indexes by measures of local prices. Shifts in real exchange rates cause the two concepts t。 이verge.
The five Asian-crisis countries saw sharp declines in real stock-market valuations from the staπ of the financial crisis in summer 1997 until the f:려1 of 1998 (For Thailand , the drop in the stock market clearly precedes the financial crisis). For present purposes , an important observation is that valuations at the end of 2002 f:머1 far short of those from early 1997. The ra디os of values for December 2002 to those for January 1997 are 0.10 for the Philippines , 0.14 for Indonesia. 0.31 for Malaysia, 0.43 for Thailand , and 0.65 for South Korea. For the five other East Asian economies , the declines in stock-market valuation are less dramatic. The ratios of values for December 2002 to those for January 1997 are 0.42 for Taiwan, 0.51 for Singapore , 0.55 for Japan , 0.63 for Hong Kong, and 1.24 for China.
Parts of these declines reflect the weak overall stock-market performance during 2000-2. The ratios of real stock p디ces index for January 2000 to those for January 1997 are 0.28 for Indonesia ,
0.57 for Thailand, 0.82 for the Philippines, 0.46 for Malaysia , and 1.01 for South Korea. For the five other East Asian economies , the ratios for Januaxy 2000 relative to Januarγ 1997 are 1. 12 for Taiw윈1 , 0.88 for Singapore , 1.29 for Japan , 1. 10 for Hong Kong,
and 1.59 for China.
δThe stock-market indexes , rep아ted in domestic currency units , were converted into U.S. dollars using market exch밍1ge rates. These values were converted into real terms by dividing by the U.S. CPI. The natural logs of these values were calculated , the values in January 1998 were normalized to zero , 하ld 외I values were divided by the natural log of hνo [to obtain convenient units for the graph). The resul디ng numbers are plotted in Figure 3, w:ith the values for January 1998 labeled as 1.

8 덕
용 4 '" c -.., .i 2 8 ” g
1ii ~ 1 .::> 。... o a.. 112
c) F
1셔
8
옳 ‘ '" --「.i 2 -니 ” @
GROWTH AND lNVESTMENT lN EAST ASIA
90 91 92 93 9‘ 95 96 97 98 99 00 01 02
Stock Market Index in Indonesia
g 1 ’ ..... ............. .. .... .... ...... .. ..... -......... .. .... .. -。“ 。Q. 112 ’~ '.- ’ -"_' .~ .. _ .... - , .••• _.-…‘ ... ~ . . ...... _‘
1/.‘
8
『
& ‘ '" --.., JJÎ 2' g --
90 91 92 93 9" 95 96 97 98 99 00 01 02
Stock Market Index in Korea
11 l' 。
t ‘ 。a.. 1121 •. _ ........... ’‘_' •. _-… …._----.. _-~ -~ ._ ..... _ ‘ ... _--..... _ .. ‘ .. -.-•. __ -‘_ ....... _ .. - . ..... _._ ..
1/4 ~ ~ ~ ~ ~ " 96 ~ 98 ~ 00 M ~
Stock Market Index in Malaysia
95

SEOUL )OURNAL OF ECONOMICS 96
e 익
뺑 ‘ s .., .. 21--‘ -‘_.• .-‘ -------, -_._._-‘ 6 ‘ -~ 1 1 •.... P 。
A 。
lt 112 1------‘--_. __ ... _-----. __ ._--_._---._~_.- ._-- _ .... _ . . _--
9’ 。,
Stock Market lndex in the Philippines m 99 98 91 훌 95 94 93
1/4 90
’”
‘,
,‘
‘,
”“
--E
.←e?lg$agE-
「-
--「.I,“‘ --g-cae=
‘
02 01 m Stock Market Index in Thailand
99 % 97 % 95 94 93 9’ ’14
90
8 억 .. 홍 ‘ 。‘--.., Ji 2 -u --~ 1 1 . . r e “ @
lt 1121.
02 。,@ 92 93 94 95 96 97 98 99
Stock Market lndex in China 9’ 1/.‘
90

GROWJ'H AND lNVESTMENT lN EAST ASIA
8
훌 , | : 짧권~훌~ν
1'" 90 91 9l 93 94 95 96 97 9Ø 99 00 01 02
Stock Market Index in Hong Kong
8
‘, a. F ,ga a F
.
2
1
η
---「.ag” @iRc。걷a 。‘ι
'-χ
하i
1' <4 90 91 92 93 94 95 96 91 96 99 110 01 02
Stock Market lndex in J apan
8
억 --8\ ‘ '" ’ --...., ßi 2 g ” ‘l § 1 흔 。
Q. 。
'ä. 1f2 1. - -. -._ ....... -‘-'-.-… -‘ .... ~“ ---. ~ ....... _.-._.- ‘ •. _ ‘.,.. ••• _ ...... _ •• _.~-,
1'4 90 9’ 9l 93 ~ ~ 96 ~ 96 ~ 00 ~ ~
Stock Market lndex in Singapore
97
98
8 악
용 4 ‘ ."
c --’
SEOUL JOURNAL OF ECONOMICS
• 2 ’‘_ .. - .. -_ .... _- .... '-_ .. _ .. --g ‘ • g ’ 싸.“.샤’‘ • .A‘.“…….“……….“…….“………-“……-“………-“…….“….“.ιu -g
“ 。i ’(1 1 •.• - ._._ .- .• -.-.------.. -.--‘ ... _. H_ ‘_ ... _~- --- ~ ....
90 91 92 93 94 95 96 97 98 99 00 01 02
Stock Market lndex in Taiwan
FIGURE 3
It seems reasonable to infer that the most paπS of the sharper declines in real stock market valuation for the Asian-crisis countries after the financial crisis of 1997 reflect effects from the financial crisis itself.7
The main conclusion from the analysis of stock-market data is that. from the perspec디ve of the financial markets. events from 1997 야lrough 2002 had permanent negative consequences for the
economic outlook of the five Asian-crisis countries. The adverse impacts were less signific윈lt for the five other East Asian economies and were not present for China. The 띠lancial crises 삼lat began in summer 1997 were paπ of the environment that would be reflected in stock-market prices but were , of course, not the entire st아y. However. the differential market responses in the t:\νo groups of economies suggest that the financial crises - and. more specifically, ch하19ing perceptions about the long-term consequences of these crises - were signifi않nt parts of the story.
7Parts of the decllnes in real stock-market values . as measured. reflect depreciations of re허 exch없1ge rates. If the re외 stock-market values are calculated by dividing nominal stock-market indexes by local consumer price indexes, then the ratios for December 2000 to those for January 1997 are 0.31 for Indonesia. 0.32 for Thailand. 0 .34 for the Philippines. 0 .52 for Malaysia. and 0.69 for South Korea. For the other non-crisis Asian countries. the ratios are 0.68 for Taiwan. 0.93 for Singapore , 0.76 for Japan , 1. 10 for Hong Kong , 없ld 2 .40 for China.

ιROWTH AND INVESTMENT IN EAST ASIA 99
III. Cross-Country Analyses of Economic Outcomes
The general approach in this section is to modity exis디ng work on cross-country analyses of economic groV\πh and investment to assess the effects of the Asian financial crisis. We begin with a study of economic grm까h , using an empirical framework that has been widely used in pre띠ous studies. See , for example , Barro and Le(‘ (1 994) , Barro (1 997). and Barro and Sala-i-Martin (2004 , Ch 12). Our regression applies to a panel data set of 85 countries over seven five-year periods from 1965 to 2000 , corresponding to the periods 1965-70, ... and 1995-2000. We include in this analysis a representative set of the explanatory variables that have been us건d in previous work. Thus , controlling for other important explanatorγ variables , any effects of the Asian financial crisis would show up as deviations of economic performance during the final five-year
inteπal from those observed in the earlier intervals. When the data are available , it will be interesting to assess persis디ng effects on performance in the next five-year period , 2000-5.
A. Economic Growth
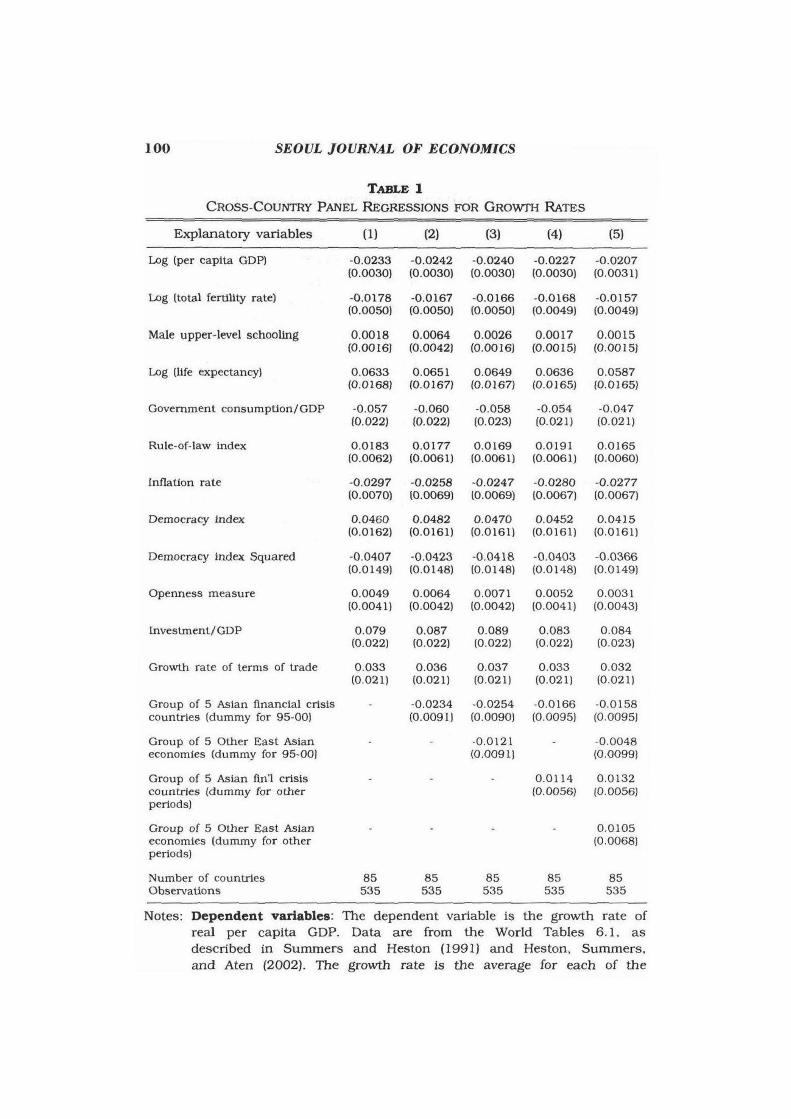
The framework for deterrnining the groV\떼1 rate of real per capita GDP is indicated by the baseline system, shown in column 1 of Table 1. Since the general approach has been described elsewhere and is likely to be familiar , we include here only a brief discussion.
The dependent variables are the five-year growth rates of real per capita GDP. Estimation is by 야uee-stage least squares , using mo~tly lagged values of the independent variables as instruments - see the notes to Table 1. lndividual constant terms are included for
each period; hence , the system does not explain the evolution of world economic growth over time. No country fixed effects are introduced , because this procedure tends to eliminate the bulk of the information in the data , that is , the cross-sectional dimension of 1he panel.
100 SEOUL JOURNAL OF ECONOMJCS
TABLE 1 CROSS-COUNTRY PANEL REGRESSIONS FOR GROWfH RATES
Expl없latory variables (1) (2) (3) (4) (5)
Log (per capita GDP) -0.0233 -0 .0242 -0.0240 -0.0227 -0 .0207 (0.0030) (0.0030) (0.0030) (0.0030) (0 .0031)
Log (total feπillty rate) -0.0178 -0.0167 -0.0166 -0.0168 -0.0157 (0.0050) (0.0050) (0.0050) (0.0049) (0.0049)
Male upper-level schooling 0 .0018 0.0064 0.0026 0.0017 0 .0015 (0.0016) (0.0042) (0.0016) (0.0015) (0.0015)
Log (1ife expectancy) 0.0633 0.0651 0 .0649 0.0636 0 .0587 (0.0168) (0.0167) (0.0167) (0.0165) 10.0165)
Govemment consumpt1on/GDP -0 .057 -0 .060 -0 .058 -0 .054 -0 .047 (0.022) (0.022) (0.023) (0.021) (0.021)
Rule-of-law index 0 .0183 0.0177 0.0169 0 .0191 0 .0165 10.00621 (0.0061) (0.0061) (0.0061) 10.0060)
Inflation rate -0.0297 -0.0258 -0.0247 -0.0280 -0.0277 (0.0070) (0.0069) (0.0069) (0.0067) (0.0067)
Democracy index 0 .0460 0.0482 0.0470 0.0452 0.0415 (0.0162) (0.0161) (0.0161) (0.0161) (0 .0161)
Democracy index Squ강ed -0 .0407 -0.0423 -0 .0418 -0 .0403 -0 .0366 (0.0149) (0.0148) 10.0148) (0.0148) (0.0149)
Openness measure 0.0049 0 .0064 0.0071 0 .0052 0 .0031 (0.0041) (0.0042) (0.0042) (0.0041) (0.0043)
[nvestment/GDP 0 .079 0.087 0.089 0 .083 0 .084 (0.022) (0.022) (0.022) (0.022) (0.023)
Growth rate of terms of trade 0.033 0.036 0.037 0.033 0.032
Group of 5 Aslan financlal crtsis coun tr1es (dummy for 95-0이
Group of 5 Other East Aslan economies (dummy (or 95-。이
Group of 5 Aslan fin1 crtsls countrles (dummy for other pertods)
Group of 5 Other East Aslan econ omies (dummy for other pertods)
Number of countr1es 。bservatlons
(0 .021) (0 .021) (0.021) (0.021) (0.021)
85 535
-0 .0234 ‘ 0.0254 -0 .0166 -0 .0158 (0.0091) (0.0090) (0.0095) (0.0095)
85 535
-0.0121 -0 .0048 (0.009 1) (0.0099)
85 535
0.0114 0 .0132 10.0056) 10.0056)
85 535
0 .0105 (0.0068)
85 535
Notes: Dependent variables: The depen dent variable i5 야le growth rate of real per capita GDP. Data are from the World T a bles 6 . 1. as described in Sumrners and Heston (1991) and Heston ‘ Summers. and Aten (2002). The grow야1 rate 1s 상le average for each of the

GROWTH AND INVESTMENT lN EAST ASIA 101
seven five-year periods 1965-70 ... , 1995-2000. Independent variables: lndi띠dual constants (not shown) are included for each period. The log of real per capita GDP and the avemge years of male secondm-y and higher sch。이ing are measured at the beginning of each period. The log of Iife expect없1Cy at birth is 며1 average for the previous five years. The ratios of government consumption (exc)usive of spending on education and defense) and investment (private plus public) to GDP. the inflation rate. the total fertHity rate. the democracy inclex. and the gro~πh rate of the terms of trade (export over import prices) are period averages. The rule-of-Iaw index is the earliest value available (for 1982 or 1985) m the first four equa디ons and the period average for the oth‘"r equations ‘ The openness measure is the ratio of exports plus imporls to GDP. filtered for the estimated effects on this measure of the logs of population and area. The t간n East Asian economies are China. Hong Kong SAR. lndonesia. Japan. South Korea. Malaysia. the Philippines. Singapore. Taiwan. ancl Thailand (China is omitted because of missing data). The five Asian-crisis countries are lndonesia. South Korea. Malaysia. the Philippines. and Thailand Estimation: Estimation is by three-stage least squares. lnstruments are the actual values of the schooling. Iife-expectancy. openness ‘ a r..d tem1s-of-trade variables; dumrny variables for prior colonial status (wh:ich have substantial explanatory power for inflation)); lagg~'d
values of the log of per capita GDP. the government consurnption ratio. and the investment ra디0; and the initial values for each perieod of the rule-of-Iaw index and democracy index. The earliest value available for the rule-of-Iaw inclex (for 1982 or 1985) is included ,IS
an :instrument for the first four equatio I1s. and the value at the start of each period is included for the other equations. Standard errors are shown in parentheses.
The first explanatory variable. the log of per capita GDP at the
start of each period. reveals the familiar conditional convergence
effect: the estimated coefficient is - 0.023 (s.e. 二 0.003).8 The log of
the total fertility rate is significantly negative: - 0.0 18 (0.005). Also
included are nνo measures of initial human capit머. each of which
has a posi디ve effect on growth. The coefficient on the log of life
expectancy at birth is significant. 0.063 (0.017). However. the
s.:r‘he instrurnent list excludes the log of per capita GDP at the start of eact. period but includes earlier values of the log of per capita GDP. If the square of the log of per capita GDP is added as an explanatory variable. there is some indication that the rate of convergence (the magnitude of the marginal effect of the log of per capita GDP on the growth rate) increases as an economy gets richer.

l02 SEOUL JOURNAL OF ECONOMICS
educationa1 attainment variable , which is measured by the average
years of school attainment of m a1es aged 25 and over at the secondary 밍ld higher levels is sta디stically insignificant. 0.0018 (0.0016).9
The next five variables capture aspects of government p이icies
and institutions. The ratio of govemment consump디on (measured exclusively of outlays on education and defense) to GDP is
significantly nega디ve. -0.057 (0.022). A subjective measure of the
extent of maintenance of the rule of law (an indicator of property
rights enforcement) is significantly positive , 0.018 (0.006). Higher inflation. 없1 indicator of macroeconomic instability, is significantly
negative for growth , - 0.027 (0.008).10
The regression results confirm the non-linear relationship
between democracy and growth. as found by Barro (1 997). The
coefficients on the indicator of democracy and its square terms are
positive and nega디ve respectively and both coefficients are statisti
cally significant. The pattem of coefficients indicates that the
gro'\\πh rate increases with poli디cal freedom at low levels of
democracy but decreases with democracy once the society has attained a ceπ.ain level of political freedom.
Increased openness to international trade has a posi디ve effect on
growth. but the estimated coefficient. 0.005 (0.004) is not statisti
cally significant. 11
Many of the variables just discussed also affect an economy’S
propensity to invest. as discussed below. However. given the other
explanatory variables , a higher ratio of real investment to real GDP
90ther measures of school attainment lack significant explanatory power for economic growth. Barro and Sala-i-Maπin (2004) show that the quality of sch。이ing - measured by scores on intemation떠Iy comparable tests of educational achievement in the subjects of science and mathematics - is statistically significant. However. data on the qu떠ity of schooling cover only about 40 countries.
lιfhe instrument list excludes inflation but includes measures of colonial heritage. These colony 、rariables have substantial explanatory power for inflation.
llThe independent variable is the ratio of total trade. expoπs plus imports. to GDP filtered for the 양pical effect of country size on this trade measure. This last effect was estimated from a system in which the trade-GDP ratio over various periods was the dependent variable. Countηf size was represented by the logs of population and area. The trade variable was included in the instrument list.

ιROWTH AND INVESTMENT IN EAST ASIA 103
still has a significantly positive effect on gro\\πh , as indicated by the coeffìcient 0.079 (0.022). Thε inclusion of the lagged , but not contemporaneous , investment ratio in the instrument list may allc-w a causal interpretation of this effect. A higher gro\\πh rate of the terms of trade (export relative to import prices) has also an expansionary effect on growth , but the estimated coefficient. 0.0(13
(0.020), is not statistically significan1.
Columns 2-5 of Table 1 show the effects on growth in the period 1995-2000 from dummy 、rariables for being one of the five Asian
financial crisis countries and from being one of the five other east Asian economies. In column 2. the estimated coefficient on the
dummy variable for the five Asian financial crisis countries for tlle period 1995-2000 is significantly negative , -0.023 (0.009) , indicating that the five crisis countries grew during 1995-2000 ‘1t about 2. :3 percentage points per year below the rate that wou.d otherwise have been predicted by the set of explanatory variables.
Column 3 of Table 1 adds the dummy variable for the five other east Asian economies for the period 1995-2000 ‘ The estimated effect of the five Asian financial crisis countries remains similar to
thaL in column 1. For the five other east Asian economies. the estimated coefficient is insignificantly different from zero. - 0.0 12
(0.009). Thus , only the five crisis-hit Asian economies experienc~:d the signifìcant shortfall of gro\\πh in the period 1995-2000 from the rate that would have been predicted by the growth regression.
Column 4 of Table 1 includes Î..wo dummy variables for the fi\'e
crisis-hit Asian economies- one for the period 1995-2000 , and the other for the six other five-year periods (where the coefficient of the dummy for these six periods is constrained to be the same for each
period). The estimated coefficient on the dummy for the period 1995-2000 is negative and marginally signific밍11, -0.017 (0.01 이,
whereas the estimated coefficient for the other six periods :s significantly positive , 0.011 (0.006). Thus , the five Asian criSlS countries had higher growth by about 1. 1 percentage point per year in the intervals before 1995 whereas they had lower growth by about 1. 7 percentage point per year during 1995-2000 , compared 10
the rest of the sample in the corresponding period. Column 5 adds the corresponding dummy variables - for the
period 1995-2000 and for the six other five-year periods -- for the
five othe Jr Asian economies. With these variables included , the estimated effects of the five Asian crisis countries are similar to

104 SEOUL ]OURNAL OF ECONOMICS
those in co1umn 4; that is. significantly posi디ve for the six other five-year periods and marginal1y significantly negative for the peπod 1995-2000. The estimated coefficient for the five other Asian economies for the period 1995-2000 is insignificant. - 0.005 (0.01이. The estimated coefficient for these economies for the other six periods was 0.011 (0.00’7) and is also sta디S디cal1y insignificantly different from zero.
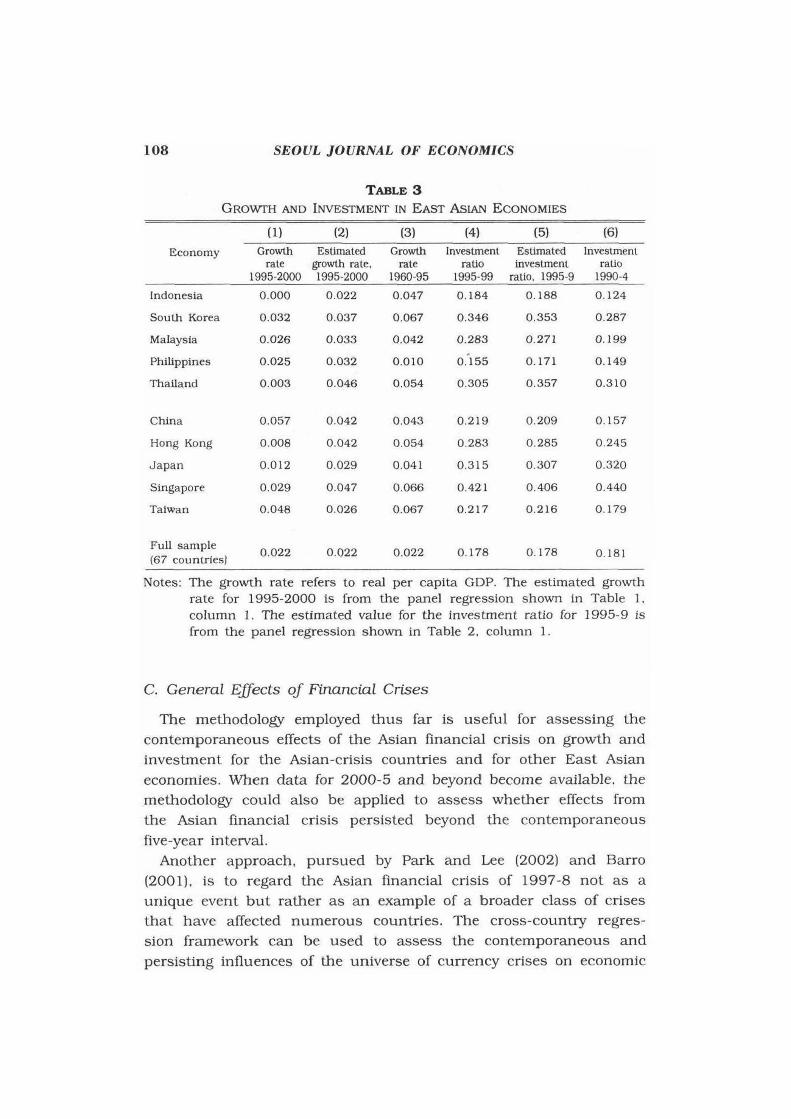
Tab1e 3. co1umns 1 and 2. detai1s the growth shortfall during 1995-2000 for each of the East Asian economies. Co1umn 1 contains the actua1 growth rates of per capita GDP. Co1umn 2 shows the estimated va1ues from the baseline system in co1umn 1 of Tab1e 1.
Note that this system excludes all of the dummy variab1es for the East Asian economies. In most cases. the estimated va1ues fall
substantially short of the historica1 gro\\πh rates. which are shown for 1965-95 in co1umn 3 of Tab1e 3. The main reason for these shortfalls is that most of the economies have become much richer over time , and the convergence effect predicts a reduction in growth
rates. This effect is par디al1y offset by the generally favorab1e and ,
more pertinently, improving nature of the other exp1anatory variab1es that determine economic growth in the system sho\\π1 ln co1umn 1 of Tab1e 1 (The values of the exp1anatOlγ variables for the East Asian economies are shown in Tab1e 4). However , the net
effect is to predict growth rates below the historica1 average for most of the East Asian economies. These lowered gro\\πh
projections wou1d also app1y for future periods and wou1d have applied even in the absence of the Asian financial crisis.
As an example. for South Korea. the model’s estimated gro\\πh
rate of per capita GDP for 1995-2000 is only 3.7 percent per year ,
compared with the 6.7 percent average gro\\πh rate experienced for 1965-95. 12 The mode1 predicts similar retardations of gro\\πh for the other pre띠ously high growing East Asian economies: Hong Kong is
lιfhis estimated growth rate for South Korea in 1995-2000 exceeds the average value in the sample (0.022) by 0.015. This deviation from the sample mean can be broken down intro contributions from the ten explanatory variables shown in Tables 3 and 4. The results , all expressed as deviations from the sample mean , are as follows: ~ 0.017 for the log of per capita GDP, 0.005 for schooling , 0.004 for government consumption. 0.001 for life expectancy, ~0.002 for democracy. ~0.001 for the terms of trade , 0.000 for the rule of law, 0.000 for openness , 0.007 for fertility. 0.001 for inflation. and 0.013 for investment

GROWfH AND INVESTMENT IN EAST ASIA 105
4.2 percεnt versus 5.4 percent, Singapore is 5.0 percent versus 6.6
percent. Taiwan is 2.6 percent versus 6.7 percent. and Thailancl is
4.6 percent versus 5.4 percent. The cutback for Japan , 2.9 percent versus 4.1 percent. is also notable. The only economy in which a
growth slowclown was not projectecl is the Philippines. which has
3.2 percent versus 1.0 percent. However , the main element in this
case is the greatly disappointin당 growth performance during the 19G5-95 period.
A comparison of the actual gro씨rth rates for 1995-2000 with the
model’ s estimates shows that two of the East Asian countries
actually exceeded expecta디ons. These are China. for which the
actual growth rate of 5.7 percenlι beat the model estimate of 4 2
percent. and Taiwan. for which the actual value of 4.8 percent was
wel1 above the estimate of 2.6 percent. The other eight countries
showed shortfalls of varying sizes. including gaps of 4.3 percent per year for Thailand and 4.1 percent per year for Hong Kong.
B. Investment Ratios
Table 2: contains the results from cross-country estimation of the
determinants of the ratio of real investment (public plus private) 10
real GDP. The dependent variables are the averages of the investment rat:ios over the seven five-、year periods 1965-9 , ... 1995-9.
The specification follows the form of Table 1. except that the
contemporaneous investment raüo is replaced in the group ()f
explanatory variables by the lagged value of this ratio. Since the
investment ratio displays a high degree of serial dependence , th1S
lagged depenclent variable has a lot of explanatory power. In the
equations shown in Table 2. the estimated coefficient of this
variable is in the neighborhood of 0.7 and is highly significant. 13
From the perspective of a partial-a이ustment model. the investment ra디1) can be viewed as adjus디ng about 30 percent of the way over
a f1ve-year period to the target value determined by the other
explanatory 、rariables in the system.
The baseline model in column 1 of Table 2 shows a significantly
negative effect on the investment ratio from the initial level of pt'f
capita GDP. The initial quantities of human capital in the forms ()f
13In contrast , if a lagged dependent vmiable is added to the system for the growth rate in Table 1. column 1. the estimated coefficient diflers insi망1ificantly from zero.

10 6 SEOUL ]OURNAL OF ECONOMICS
TABLE 2 CROSS-COUNTRY PANEL REGRESSIONS FOR INVESTMENT RATIOS
Explanatory variables (1) (2) (3) (4) (5)
Lagged raUo lo investment to 0.711 0.712 0.712 0 .721 0 .072 GDP (0.002) (0.023) (0.023) (0.021) (0.021)
Log (per cap!ta GDP) -0.0082 -0.0086 -0 .0086 -0.0062 -0.0049 (0‘ 0036) (0.0037) (0.0037) (0.0034) (0.0035)
냐g (total ferUlity rate) -0 .0178 -0.0 178 -0 .0177 -0 .0131 -0 .0113 (0.0058) (0.0060) (0.0059) (0.0053) (0.0054)
Male upper-level schooling 0 .0028 0.0029 0 .0028 0 .0021 0.0018 (0.0016) (0.0017) (0.0017) (0.0015) (0.0015)
Log (Ufe expectancy) 0.065 0.064 0.064 0 .067 0.064 (0.020) (0.020) (0.020) (0.0 19) (0.019)
Govemment consumpUon/GDP -0.062 -0 .063 -0.063 -0.066 -0.061 (0.027) (0.027) (0.027) (0.025) (0.025)
Rule-of-Iaw index 0.0204 0.0202 0 .0201 0 .0208 0.0192 (0.0082) (0.0082) (0 .0082) (0.0077) (0.0077)
lnflaUon rate 0 .0002 -0.0004 -0 .0007 0.0040 0 .0028 (0.0097) (0.0097) (0.0097) (0.0090) (0.0089)
Democracy index 0.0259 0 .0253 0 .0254 0 .0146 0 .0143 (0.0204) (0.0206) (0.0206) (0.0200) (0.0201)
Democracy index -0 .0240 -0.0229 -0 .0226 -0.0140 -0 .0123 Squared (0.0 19이 (0.0192) (0.0192) (0.0186) (0.0188)
Openness measure 0 .0189 0 .0197 0.0195 0 .0173 0.0151 (0.0044) (0.0045) (0.0046) (0.0040) (0.0041)
Growth rale of lerms of trade 0.076 0.077 0 .076 0.077 0.074
Group of 5 Aslan fi.nancial cr!sls countries (dummy for 95-0이
Group of 5 Otl1er EasL Asian economles (dummy for 95-00)
Group of 5 Aslan fin'l crisls countrles (dummy for other periods)
Group of 5 Other Easl Asian economies (dummy for other perlods)
Number of countries ObservaUons
(0.032) (0.032) (0.032) (0.032) (0.032)
85 535
-0.0137 -0.0131 -0.0210 -0 .0186 (0.0114) (0.0115) (0.0113) (0.0115)
85 535
-0.0035 0.0079 (0.0118) (0.0117)
85 535
0.0329 0 .0345 (0.0055) (0.0055)
85 535
0 .0071 (0.0066)
85 535
Notes: The dependent variable is the ratio of real investment (private p lus public) to real GDP. Data are from the World Tables 6.1. The m easure used is the average of the ra디o over the seven p eriods 1965-9. . .. 1995-9. The lagged value of the ìnves tInent ratio is 삼le average of 비e ratio over 야le pre여ous interval. See the notes to Table 1 for other information.

GROffl'J'H AND INVESTMENT IN EAST ASIA 107
education and life expectancy have positive coefficients , though the
one on education is margin머ly significant. The fertility rate has a
significantly negative effect. In terms of the policy variables , the main results are negative
effects from government consumption and significantly positive
effects from the rule of law and international openness. The inflation rate has an insigni“cant effect. The effect from democracy is non-linear: the estimated coefficient on the linear term is
positive. and that on the square 0 1' democracy is nega디ve.
However , neither coefficient is statistically significant. Changes in
the terms of trade have a significantly positive effect. Columns 2-6 add dummy variables for the five Asian-crisis
countries and the five other East Asian countries. The results show
that , for given values of the other explanatory 、rariables , the
investment ratios in the five Asian-crisis countries were significantly
higher by about 3 percentage points than the rest of the sample in the intervals before 1995-9. However. these investment ratios
became significantly lower by about 2 percentage points in Ule 1995-9 period. In contrast, for the five other East Asian economies ,
the investment ratios did not deviate significantly from those elsewhere in the periods before 1995-9 or in the 1995-9 period. Thus , the Asian-crisis countries cliffered from the other East Asian
economies not only in terms of the adverse shocks to investment in the recent period but also in the sense of having abnormally high
investment ratios at earlier times ‘
Table 3 gives details about the actual and estimated investment
ratios in the East Asian economies for the period 1995-9. Column
1 pres않ent않s the actual investmen따lt r떠a디o떠s. Column 2 shows the e estimated values from the baseline syste히m in column 1 of T、'ab비le :2
Amon명g the five A뻐s외ia뻐n-c띠r디isis count띠r디ies , only M외aysia had an
investment ratio above the estimated value (by one percenta앙e
pointl. For the other four crisis economies , 삼le actual ratios f{ ‘ II
short of the estimated ratios. Thailand showed the largest negative
gap of five percentage points ancl the other crisis economies had
nega디ve gaps ranging from one to two percentage points. ln
contrast, for the five other East Asian economies , most of the gaps
were posltive , with the largest being plus two percentage points for
Singapore.
108 SEOUL }OURNAL OF ECONOMICS
TABLE 3 GROwrH AND INVESTMENT lN EAST AslAN ECONOMIES
(1) (2) (3) (4) (5) (6)
Economy Growth EsUrnated Growth Jnvestment EsUmated Jnvestment rate growth rate. rate ratio Investment raUo
1995-2000 1995-2000 1960-95 1995-99 ratio. 1995-9 1990-4
Jndonesia 0.000 0.022 0.047 0.184 0.188 0.124
South Korea 0.032 0 .037 0 .067 0.346 0.353 0 .287
Malaysia 0.026 0 .033 0.042 0 .283 0.271 0 .199
Phillppines 0.025 0.032 0.010 0.155 0 . 171 0.149
Thailand 0 ‘ 003 0.046 0.054 0.305 0.357 0.310
China 0.057 0.042 0 .043 0.219 0.209 0 . 157
Hong Kong 0.008 0.042 0 .054 0.283 0 .285 0.245
Japan 0.012 0.029 0 .041 0.315 0 .307 0 .320
Slngapore 0.029 0 .047 0 .066 0.421 0 ‘ 406 0 .440
Taiwan 0.048 0 .026 0.067 0.217 0 .216 0 .179
Full sample 0.022 0 .022 0 .022 0 .178 0. 178 0 . 181 (67 counUiesJ
Notes: The gro、wth rate refers to rea1 per capita GDP. The estimated grow다1
rate for 1995-2000 is from the p윈lel regression shown in Table 1. column l. The estimated va1ue for the investment ratio for 1995- 9 is from the panel regression shown in Table 2. column 1.
C. General E.ffects oJ Fïnancial Crises
The method이O잉r employed thus far is useful for assessing the contemporaneous effects of the Asian financia1 crisis on gro、따h and investment for the Asian-crisis countries and for other East Asian economies. When data [or 2000- 5 and beyond become available , the methodology could a1so be appUed to assess whether e[fects from the Asian financial crisis persisted beyond the contemporaneous fíve-year inteπ외.
Another approach , pursued by Park 없ld Lee (2002) and Barro (2001) , is to regard the Asian financial crisis of 1997-8 not as a unique event but rather as an example of a broader class of crises that have affected numerous countries. The cross-coun다y regression framework can be used to assess 암le contemporaneous and persisting influences of the universe of currency crises on economic

(;ROWTH AND lNVESTMENT lN EAST ASIA }09
outcome상. The results from this exercise can then be extrap이ated
to the case of the Asian financial crisis. In this way. inferences can be made about the las디ng economic effects of this crisis without Wa:L디ng for additional data to materialize.
To get a broader international perspective on currency crises. we first need to define what a currency crisis is. A typical approach. f이lowing Frankel and Rose. (1 996). is to iden디ty the dates of crises with lar당e nominal deprecia디ons of a country’s currency over a short period. However. severe spεculative pressure does not always lead to large depreciations when the authorities successfully defend
the currency by inteπening in the foreign exchange market. Hence. Eichengreen. Rose. 없ld Wyplosz (1 995) and Kaminsky and Reinhart (1999) use an alternative indicator of currency pressure by combining depreciation rates wi.th additional variables such as
foreign reserve losses and domestic interest rates. Then. a currency crisis is considered to have occurred if the composite indicatJr increased. above a threshold level in terms of the country-speciJìc moments.
In our analysis. we combine the two approaches. We define a currency crisis as an episode identified. by either the former αr
latter approach. For the former approach. as in Park and Lee (2002) and Barro (2001). we define a currency crisis as a circumstance in which the nominal der:’recia디。n of the currency was at least 25 percent during any quarter of the year and exceeded by at least 10 percentage points the depreciation of the currency in the
previous quarter. In order to apply the criterion in the laU.~r
approach. we construct the indicator of currency pressure by a
weighted average of monthly nominal depreciation rate and monthly percenta딛e change of foreign reseπe. with weights such that the two components of the indicator have an equ혀 size in terms of sample volatilities. A currency crisis is then identified to have occurred in the specific year when the change in the indicator αf currency pressure for any month of that year exceeded three standard deviations above the mean of the indicator over the sample pe디od for each country. provided that either the monthly nominal depreciation rate or percentage change of reseπe loss exceeds 10 percent. 14
I<We impose the condition of the monthly nominal depreciation rate or percentage change of reseπe loss exceeding 10 percent. Otherwise. there
llO SEOVL ]OVRNAL OF ECONOMICS
We apply a wïndow of three years to isolate independent crises.
That is. a currency crisis occurring in that year or three years
followïng the initial crisis is counted as a continuation of the same
crisis rather than a new episode. Applying 야1Ïs procedure. we
identifY 260 independent currency crises for 130 countries over the
period from 1970 to 1999. According to these criteria. the five
Asian-crisis countries all experienced currency crises in 1997. We defined a cuπency-crisiS dummy variable for each countrγ
during any fìve-year period to equal one if a crisis occurred during
the period and to take on the value zero otherwise. 15 We considered the contemporaneous effects of this variable on economic
gro\\πh and investrnent. and we also looked for effects from the presence of a currency crisis in the previous five-year period.
The Asian financial crises were not only currency crises but also
involved severe distress for banking systems. To get a broad
measure of b밍lking crises. we followed the approach of Caprio and
Klingebiel (1996) and Eichengreen and Rose (1 998). These authors
define a banking crisis as a situation in which bank failures or
suspensions led to the exhaustion of much or all of bank capital.
The data on b하lking crises are complied from Caprio and
Klingebiel (1 996). Demirguc-Kunt and Detragiache (1 997). and Glick
and Hutchison (2001). The resul디ng data apply from 1970 to 1998. We also use a wïndow of three years to isolate independent crises.
According to these data. the five Asian-crisis countries all experienced banking crises during 1997-8.
might occur a potenti외 problem such that the expected number of crises would be the same for all countries. if the form of the distribution were equ떠ly normal but the mean 뻐d standard deviations varied across countries.
ISWe used the interval 1970-4 for cuπency devaluation to coπespond to growth for 1970-5 없ld to the average investment ratio for 1970-4 and similarly for the other periods. As an altemative procedure. we defined the if 야le crisis occurred in the first year of the five-year interval. 0.8 if the crisis occurred in the second year. and so on. This approach might be preferable if the effect of a currency crisis tended to persist at least for several years. However. this altemative approach generated a poorer fit to the data. especially on economic growth. This finding suggests that the effects of currency crises on economic outcomes are short lived.

GROWTH AND INVESTMENT IN EAST ASIA 111
TABLE 4 E XPLANATORY V ARlABLES FOR EAST AS lAN E CONOMIES
Ecαoπnomy
lndonesia
Sou lh Korea
Malaysia
Philippines
Tha iland
ChJna
η
mι
κ
m
1
때 聊때 빼
H
L
ω S
f“
Full samp1e (74 counlries)
(1)
lιog (per capita GDP)
1995
8.20
9.5 1
9 .07
8 .02
8.82
7 .94
10 ‘ 15
10.05
10.03
9 .60
8.79
(2)
Log (Lotal ferUlity rat(')
1996
0 .98
0 ‘ 56
1.23
1.31
0 .60
0 .65
0 .21
0.35
0.54
0.58
0.96
(3 )
Upper-Ievel schoolJng
1995
1.5
5.5
3 .4
2 .3
1.5
2 .2
4.8
4.3
3 .4
3 .9
2.6
(4) (5) Log (life Govcrnmcnl
expeclancy) consumplíon/ l995 GDP 1995-n
4 . 18 0 . 10
4 .26 0 .0 1
4.27 0 .09
4 .22 0 . 11
4.26 0 .06
4 .27 0 , 17
4.36 0 .03
4.37 0 .03
4.31 0 .0 1
4 .31 0 .05
4 .25 0.08
(10)
Economy
lndonesla
SOUU1 Korea
Malaysia
Philippines
Thailand
China
Hong Kong
Jap없1
Slngapore
Talwan
F'u1l sarnple (74 countries)
(6) (7) (8) (9)
Ru le of Law Inflalíon ratc Democracy 1995-9 1995-2000 1995-9
0 .57 0. 16 0. 13
0.73 0 .04 0.83
0 .77 0.03 0.43
0 .67 0 .07 0.83
0 .83 0.04 0.73
m
”ι m
킨 %
nν nu
I‘
nv
nu
m m m m m
AU
nU
nU
nU
nu
q냐 nu
nu
nu
q니
8
9
O
0
7
nu
nu
1i
’l
nU
0 .73 0.08 0 .7 1
Openness Gro\Vlh of measure lerms of Lradr l995-9 1995-2000
0 . 19 0 .035
0 .02 -0.047
1.26 0 .000
0 .37 0 .052
0 .34 0 .006
0 .18 0 .000
1.68 0 .004
-0 .37 -0.0 ) 8
2.04 -0.004
0 . 13 0 .009
-0 .02 -0 .01 1
Notes: Per capita GDP ìs the PPP a djusted value ln 1996 U.S. dollars
Upper-level schoolìng is the average years of a ttainme n t of males
aged 25 없ld over in secondary a nd high e r edu cation. Li fe

112 SEOUL ]OURNAL OF ECONOMICS
expectancy is at age 1. The total fertility rate is the number of live births for the average woman over her expected lifetime. The govemment consump디on variable is the Summers-Heston ratio of real government consump디on to GDP less the ratios for public spending on defense and education. The rule-of-law index. expressed on a zero-to-one scale. with one the most favorable. is based on the indicator from International Countrν Risk Guide for the maintenance of the rule of law. The inflation rate is the gro\\πh rate over each period of a consumer price index. The democracy index. expressed on a zero-to-one scale. with one the most favorable ‘ is based on the indicator of politic외 rights compiled by Freedom House. The openness variable is 야le ratio of exports plus imp야ts to GDP less the estimated effect on this ratio from the logs of popula디on and area. These effects were estimated in a panel system in which the dependent variable was the ratio of exports plus imports to GDP over various periods. The mean value of the openness variable was normalized to zero in each period. The terms-of-trade variable is the growth rate of the ratio of expoπ to import prices.
The variable we use is a dυmmy for whether a b없lking crisis
occurred for each country during any five-year period. 끼Te again
considered the contemporaneous and lagged effects of these crises
on economic gro\\πh and investment.
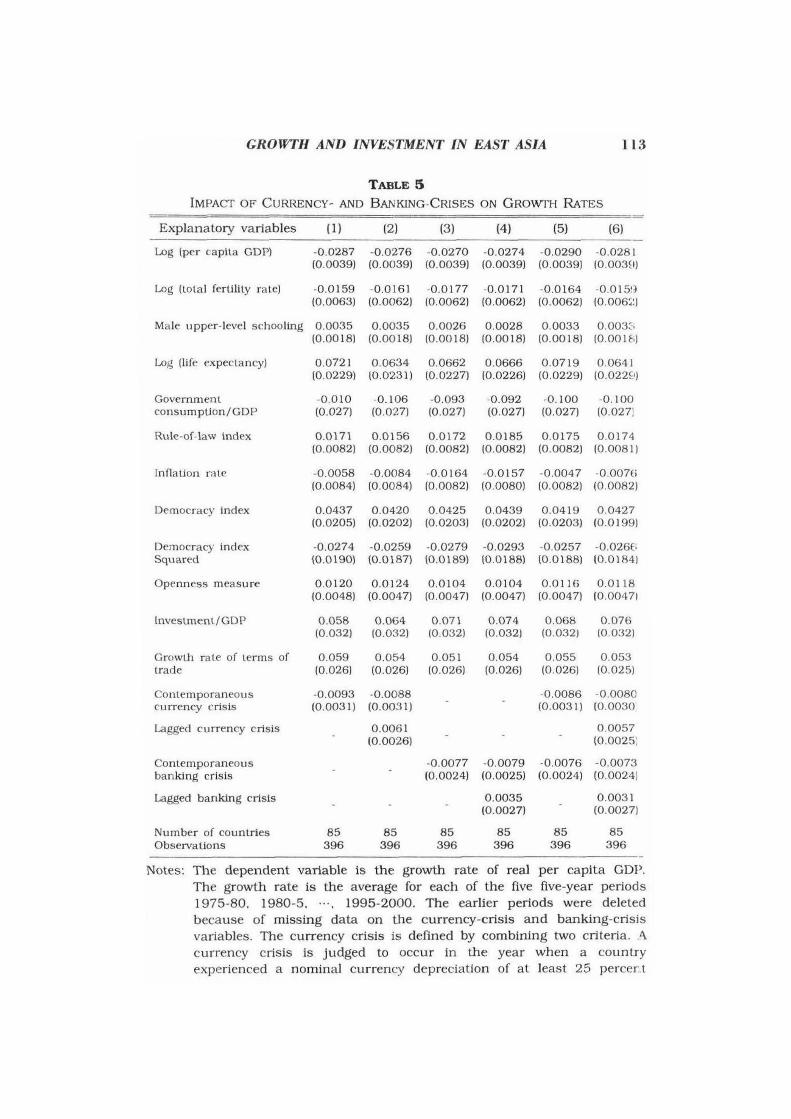
The results from adding the currency-crisis and banking-crisis
variables to the systems for economic growth are in Table 5. In
column 1. a contemporaneous currency crisis (occurring sometime
within the applicable five-year period) is associated with lower per
capita growth ~ by 0.9 percent per year. This effect is statistically
significant. Column 2 adds a lagged effect of a currency crisis. The result
shows that the contraction of growth does not persist into the next
five-year period. The estimated contemporaneous effect is signi“ cantly nega디ve and quan디tatively similar to that in column 1
However. the lagged effect is positive. The estimated coefficient on
the lagged currency crisis variable 1s statistically significant: 0.006
(0.003). Hence , there is evidence that GDP growth rate tends to
rebound by about 0.6 of a percentage point per year in the
subsequent five-year period.
Column 3 shows that the corresponding effect for a banking
crisis is a retardation of growth by 0.8 percent per year. This effect
is statistìcally significant. In column 4 , a lagged ban찌ng crisìs
variable is added. The result also shows that the contraction of
GROJη’'H AND INVESTMENT IN EAST ASIA 113
TABLE 5 IMPACT OF CURRENCY- AND B ANKlNG-CR1SES ON GROWl‘H RATES
Explanatory variables
Log (per caplta GDP)
Log (lola l fertilHy rale)
(1) (2) (3) (4) (5) (6)
-0 .0287 -0.0276 -0 .0270 -0.0274 -0.0290 -0.0281 (0.0039) (0.0039) (0.0039) (0.0039) (0.0039) (0.003~1)
-0 .0159 -0 .016 1 -0 .0177 -0.0171 -0.0164 -0 .0 15!’ (0.0063) (0.0062) (0.0062) (0.0062) (0.0062) (0.006찌
Ma le u ppcr-level schooling 0 ‘ 0035 0.0035 0.0026 0 .0028 0 .0033 0.003ι
lιog (life expectancy)
Governmenl consumpUon/GDP
Rule-of-law \ndex
InnaUon rate
Democracy index
Democracy index Squared
。penness measure
(0.00 18) (0.0018) (0.0018) (0.0018) (0.0018) (0.001 히
0 .0721 0 .0634 0 .0662 0 .0666 0 .0719 0 .0641 (0.0229) (0.0231) (0.0227) 10.0226) 10.0229) (0.022S')
-0 .010 -0 .106 -0.093 -0.092 -0. 100 -0 . 100 (0 .027) (0.027) (0.027) (0.027) (0.027) (0.027)
0 .0 171 0.0156 0.0172 0 .0 185 0 .0175 0 .0174 (0.0082) (0.0082) (0.0082) (0.0082) (0.0082) (0.0081)
-0 .0058 -0 .0084 -0 ‘ 0164 -0.0 157 -0.0047 -0.007(; (0.0084) (0.0084) (0.0082) (0.0080) (0.0082) (0.0082)
0.0437 0 .0420 0 .0425 0 .0439 0 .0419 0.0427 (0.0205) (0.0202) (0.0203) (0.0202) (0.0203) (0.0199)
-0.0274 -0 .0259 -0.0279 -0 .0293 -0 .0257 -0 .026E; {0.0190) (0.0187) (0.0189) (0.0 188) (0.0188) (0.0184)
0 .0 120 0 .0124 0 .0104 0.0104 0 .0116 0.0 118 (0.0048) (0.0047) (0.0047) (0.0047) (0.0047) (0.00471
lnveSlmenl/GDP 0.058 0 .064 0 .071 0 .074 0 .068 0 .076 (0.032) (0.032) 10.032) (0.032) (0 .032) 10.032)
GrowÚ1 ra l.e of lerms of 0 .059 0.054 0 .05 1 0.054 0 .055 0 .053 lrade (0.026) (0.026) (0.026) (0.026) (0.026) (0.025)
Contemporaneous cu rrency crisls
Lagged currency crisis
Conlemporaneous bank.ing cris ls
Iιagged bank.lng crisls
Number of counlrles 。bservations
-0 .0093 -0.0088 (0.0031) (0.0031)
85 396
0 .006 1 (0 ‘ 0026)
85 396
-0 .0086 -0.0080 (0 .0031) (0.0030
0 .0057 {0.0025:
-0.0077 -0 .0079 -0 .0076 -0.0073 (0.0024) (0.0025) (0.0024) (0.0024)
85 396
0 .0035 (0.0027)
85 396
85 396
0.0031 (0.0027)
85 396
Notes: The dependent variable 1s the growth rate of re aI per capita GDP. The g rowth rate i8 the average for each of the five fìve-year periods
1975-80. 1980-5. ... 1995-2000. The earlie r periods w e re deleted
because of missing data on the currency-crisis and b없lking-crisiS
variables. The cuπency c risis i8 defìned by combining t\νo crileria. A currency crIsis is judge d to occur in the year when a country
experie n ced a norninaI currency depreciation of at Ieast 25 percer t

114 SEOUL ]OURNAL OF ECONOMICS
in any quarter of a specific year and the depreciation rate exceeded that in the pre띠ous qu하ter by a margín of at least a 10 percent. A currency crísis is also identified at the month of a year when an indicator of currency pressure. a weighted average of monthly nomina1 exchange depreciatíon and monthly foreign reseπe loss. exceeds three standard deviations above the mean of the indicator over the sample períod for each countrγ, provided that eíther the monthly nomínal depreciation rate or percentage change of reseπe loss exceeds 5 percent. A crísis that is not apart at least 3 years from the nearest crísis is counted as a contínuatíon of the initial crísis rather than an independent crisis. The b없lking-crísis dummy varíable equals one íf at least one of the years ín the five-year period features a banking crisis , as defined in Caprío and Klingebiel (1996). Data on banking críses are compiled from Caprío and Klingebiel (1 996). Demir밍lC 밍ld Detragiache (1998) , 없ld Glick 밍ld
Hutchison (2001). See the text for further details ‘ See the notes to Table 1 for additíonal informatíon.
growth does not persist into the next five-year period. The esti
mated coefficient here is again posi디ve but statistically insignificant:
0.004 (0.003) ‘ 16
Columns 5 and 6 of Table 6 include both currency and ban찌ng
crises variables together. In column 5 , the contemporaneous effects
from currency and ban때ng crises are negative and statistically
significant. The difference between the two effects from currency
and ban퍼ng crises is not statistically significant • the p-value is
0.78. Thus , currency and ban퍼ng crises seem to have quan디ta
tively similar impacts on economic growth.
The broad cross-country analysis indicates that a combination of
a currency and a ban굉ng crisis would be associated with reduced
growth contemporaneously by about 2 percent per year. From this
16Additional persistence would be implied through effects on the independent variables. For example, the reduced level of per capita GDP provides a channel whereby a cuπency or ban퍼ng crisis would raise growth in the next períod. These effects tend , however, to be sma11. Negative , but quantitatively even smaller, effects involve the persisting influences on investment. Other negative effects on subsequent gro따h would arise if. as examples , a currency or banking crísis reduces intemationa1 trade or damages institutions that influence the rule of law. It is also possible that the occurrence of a currency or banking crisis alters the probability of a crísis in subsequent periods and thereby affects the expecta디on of future growth rates through those channels. These effects have not been investigated

GROWTH AND INVESTMENT IN EAST ASIA 115
TABLE 6 IMPACT OF CURRENCY- AND BANKlNG-CRISES ON lNVESTMENT RATI0S
Expl하latory variables (1) (2) (3) (4) (5) (6)
’..agged raUo lo 0.631 0 .626 0.622 0 .607 0.626 0 .610 invesLmenl to GDP (0.027) (0.027) (0.027) (0.028) (0.028) (0.028)
Log (per capila GDP) -0 .0087 -0 .0086 -0 .0073 -0 .0068 -0.0086 -0 .008E (0.0046) (0.003 7) (0.0046) (0.0047) (0.0047) (000481
lιog (lotal ferUlily rale) -0.0210 -0.0212 -0.0208 -0.0227 -0.0209 -0 .02213 (0.0070) (0.007 1) (0.007 1) (0.0073) (0.0071) (000731
Male upper-Ievel schooling 0.0041 0.0039 0.0038 0 .0034 0.0040 0.0037 (0.0019) [0.0019) (0.0019) (0.0020) [0.0019) (000201
Log (life expeclancy) 0.066 0 .Oß7 0.067 0.068 0.066 0 .069 (0.026) (0.026) (0.026) (0.027) (0.026) (0.027)
Govemmenl consumpûon/GDP
-0.117 -0.119 -0.125 -0.132 -0 .121 -0.129 (0.033) (0.033) [0.033) [0.034) (0.033) [0 .034)
mω 때 때 때
O O
o o
nu
nu
nU
nu
잃 뼈 띠 뼈
m m m m
nu
nU
nu
nu
m
때 삐 삐
o O
O o
n]
nu
nu
nv
9
터 O
끼
m m Mm m
o o
O O
nu
nU
nu
nu
따 뼈 벼 때
o o
o o
nv
nu
nu
nu
%
川
강 川
m m m m
nU
nu
nu
nu
앉
띠
i
e
%
…… J
n
4
ω
빠 빼 Democracy index -0 .0058 -0.0066 -0.0 109 -0.0122 -0 .0055 -0.0083
(0.0249) [0.0249) [0.0250) (0.0249) (0.0248) (0.02481
Democracy index Squared 0.0090 0.0103 0.0124 0 .0140 0.0091 0.0125 (0.0231) (0.0231) (0.0233) (0.0232) (0.0231) (0 . 02~101
Openness measure 0 .0234 0 .0235 0.0236 0.0241 0 .0234 0.0240 (0.0050) (0.0050) (0.0051) (0.0052) (0.0051) (0.005 11
Growt.h raLe of terms of 0.064 0 .062 0.053 0.043 0 .057 0 .049 trade [0.038) (0.038) (0.038) (0.037) (0.037) (0.037)
Lagged currency cπsis
-0 .0083 -0 .0079 (0.0041) (0.0041)
-0 .0021 (0.0033)
-0 .0073 -0.00n. (0.0041) (0.00401
-0.0026 (0.00331
Conlemporaneous cUITency crisis
Conlemporaneous banking cris is
-0 .0068 -00063 -0.0062 -0 .006:<. (0.0032) 10.0031) (0.0031) (0.0031)
85 396
85 396
-0.0078 (0.0035)
85 396
-0 .007ï’
(0.0035)
85 396
l‘ agged banking crisls
Number of counlrles. Observa니ons
85 396
85 396
Notes: The dependent variable is the ratio of reaJ investmenl (private plus public) to reaJ GDP. The investment ratio is the average for each of the five five-year periods 1975-9. 1980-4. ... 1995-9. The earli,er periods were deleted because of mìssing data on the currency-cris is andb밍lking-crisis variables. See the text for further details. S ee 디le
notes to Tables 2 and 5 for additionaJ ìnfOlm a tion.
116 SEOUL JOURNAL OF ECONOMICS
perspec디ve. the recent economíc contractions in the Asian-crisis countries look similar to the broader historical experience. In those cases. ref1ected in the dummy variables contained in Table 1. gro"πh rates for 1995-2000 were reduced by about 2 percent per year.
Table 5 presents the results from adding the currency-crisis and ban퍼ng-crisis variables to the systems for the investment ratio. Column 1 of Table 6 shows that a currency crisis is associated with a statistically significant reduction by about 0.8 of a percentage point. In column 2. the estimated lagged effect of a currency crisis on investment is nega디ve but statistically insignificant. Hence. the investment contraction due to a currency crisis does not seem to persist into the ne.xt five-year period.
Column 3 shows that a banking crisis is associated with a decrease in the investment ratio by 0.9 of a percentage point. and this result is statistically significant. Column 4 of Table 5 shows that the lagged effect from a banking crisis is a significantly nega디ve 0.8 of a percentage point. This finding contrasts with the statistically insignificant effect from a currency crisis on the investment ratio. Hence. a ban퍼ng crisis seems to have a persisting negative effect on investment. although such a crisis does not appear to have a persisting negative in f1uence on economic gro"πh (for given values of the investment ratio and other variables) .
Column 5 shows that when currency and banking crises variables are included simultaneously. there are signific려1t nega디ve
effects from currency and ban퍼ng crises on investment in the contemporaneous pe디od. 깐le difference between the two contemporaneous effects from currency and banking crises is not statistically significant - the p-value is 0.84. Thus. currency and banking crises have quan디tatively similar impacts on investment as
well as economic gro"πh. From the perspective of the broad cross-country analysis. the
sharp contractions of investment in the Asian-crisis countries in 1998 were not exceptional. In the Asian -crisis cases. re f1ected in the dummy variab1es in Tab1e 2. average investment ratios for 1995-2000 decreased by about 2 percentage points. The broader analysis also suggests that a combined currency and banking crisis would typically have been accompanied by a contraction of the investment ratio by about 2 percentage points.
GROWTH AND INVESTMENT IN EAST ASIA 1 17
IV. Conc:luding Remarks
The Asian financìal crìsìs was assocìated wìth a sharp reductìon of economìc growth ìn East Asìa. especìally in the fìve countries that were most directly affected by the crisis. Investment ratios al:3o fell sharply in these crisìs countries. though not so much in other east Asìan economìes. Rates of economic gro\\πh in East Asia have rebounded ìn 1999-2002. but the permanence of thìs recovery is uncertaìn. The faìlure of ìnvestment ratios to rebound sìgnìficanlly ìn the crisis countries suggests that the crisis had a long-term adverse effect. This conclusìon is reìnforced by the observation that real stock-market prìces ìn the crìsìs countrìes have failed to reattaìn theìr pre-crìsis values.
A simi1ar picture emerges from a broader study of currency and banking crises. This analysis documents the association of currency and banking crises wìth contemporaneously reduced values of economic growth and investment. The magnitude of the typical effect is quan디ta디vely similar to that seen in the recent period m the Asian crìsis countrìes. More importantly. the broader evìdence does not indicate a persisting adverse influence of currency and banking crises on economic growth. Thus. if extrapolated to the Asian-cri성is countries. the broad evidence predicts returns 1:0 the rates of economic growth that would have prevaìled in the absence of the crisis. However. the broader international evìdence shows some indication of a persisting adverse effect of a ban성ng crìsis ün ìnvestment. Consequently. throu당:h the permanent depressìon of investment. the financial crisis would have a long-term adver“e effect on growth in East Asia.
(Received 29 October 2003: Revised 11 December 2003)
Referen(~es
Barro. R. J. Determinants oJ Economic Gr。ωth: A Cross-CountTυ
Empirical Study. Cambridge MA: MIT Press. 1997.
Barro. R. J. Economic Growth in East Asia Before and After the Financial Crisis. NBER Working Paper No. 8330. June 2001.
Barro. R., and J. W. Lee. “ Sources of Economic Growth." Carnegie

118 SEOUL ]OURNAL OF ECONOMICS
Rochester ConJerence Series on Public Policy 40 (1994): 146.
Barro , R. J. , and Sala-Martin , X. Economic Growth. 2nd Edition ,
Cambridge MA: MIT Press , 2004.
Caprio , G. , and Kl1ngebiel , D. Bank Insolvencies: Cross-CountIy
Experience. Policy Research Working Paper Number 1620,
찌Tashington DC: The World Bank, 1996.
Demirguc-Kunt , A., and Detra맹ache , E. The Determinants of Bank
ing Crises: Evidence from Developed and Developing
Countrtes. Unpublished, Intemational Monetary Fund , May
1997.
Eichengreen , Barry, Andrew K. Rose , and Wyplosz , Charles.
“ Exchange Market Mayhem: the Antecedents and Aftermath
of Speculative Attacks." Economic Policy , 1995.
Frankel, J. A., and Rose , A. K. “ Currency Crashes in Emerging
Markets: An Empiric외 Treatment." Joumal oJ Intemational Economics 41 (No. 4 1996): 351-66.
Glick, R., and Hutchison, M. “ Banking and Currency Crises: How
Common Are 1ψins?" In Reuven Glick, Ramon Moreno , and
Mark Spiegel (eds.) , Financial Crises in Emerging Markets. NY: C밍nbridge University Press , 2001.
Heston , A., Summers , R., and Aten, B. Penn World Tables Version
6.1. Center for Intemational Comparisons at the University of
Pennsylvania (CICUP). October 2002.
Park, Y. C. , and J. W. Lee. “Recovery and Sustainability in East
Asia." In M. Dooley 밍ld J. Fr밍lkel (eds.). Managing Currency
Crises in Emerging Markets. The University of Chicago Press ,
2002.
Kamins야r , Garciela, 윈ld Reinhart, Carmen. ‘'The Twin Crises: The
Causes of Banking 잉ld Balance-of-Payments Problems."
American Economic Revieω 89 (No. 3 1999): 473-500.
Summers , R. and Heston , A. ‘'The Penn World Table (Mark 5): An
Expanded Set of Intemational Comparisons , 1950-1988."
Quarterly Joumal oJ Economics 106 (No. 2 1991): 327-68.