growth accounting, productivity analysis, and purchasing...
TRANSCRIPT

Growth Accounting, Productivity Analysis, and Purchasing Power Parity
in Korea (1984-2000)
February 28, 2004
Hak K. Pyo, Keun-Hee Rhee, and Bong Chan Ha
Korea-Japan Workshop on the Industrial Productivity Database

Contents
1. Gross Output Data from National Account and IO Table2. Measurement of Capital Input
National Wealth Survey(NWS) - 1968, 1977, 1987,1997Estimating MethodMeasurement of Capital Prices
3. Measurement of Labor InputQuantity Factor Quality Factor – Sex, Educational Attainment, Age
4. Characteristic of Korean Database for KLEM Model5. Gross Output Growth Accounting for Korea (1984-1997)6. Trends in Productivity and Capital-Output
Coefficient in Korea (1984-2000)

Table 1. Input-Output Tables in Korea (1970-2000)
1. Transaction Tables at Producers’ Prices (number of sector classification)
year basic small medium large1970 153 56 1973* 153 56 1975 392 164 60 1978* 164 60 1980 396 162 64 191983* 396 162 64 191985 402 161 65 201986* 161 65 201987* 161 65 201988* 161 65 201990 405 163 75 261993* 163 75 261995 402 168 77 281998* 168 77 282000 404 168 77 28
* Extended I-O tables with sector classification of the preceding main I-O tables.

Input-Output Tables in Korea (1970-2000)
2. Linked Input-Output Tables (number of sector classification)year small median large
1975-80-85 161 65 201980-85-90 161 751985-90-95 168 77 28
3. Supporting Tables(1) Employment Table: 1980 1983 1985 1986 1990* 1995* 1998* 2000*
(*including employment matrix)(2) Fixed Capital Formation Table: 1990 1995
4. U-Table and V-Table (22 industries including 9 Manufacturing industries)Annual U-Table at 1995 constant prices and annual V-Table in both current and constant prices for 1990-1997 are available in 1999 National Accounts.

Generated Input-Output Tables
1. Data: Gross Output, Value-added, Intermediate input,
Energy Input, Input share
2. Matrix BalancingScaling - RAS MethodOptimization – KEO-RAS, Entropy Method
Capital Input
1. Data on Capital Stock
(1) National Wealth Survey(NWS): 1968, 1977, 1987, 1997
(2) Estimation of Net and Gross Capital Stock(a) Period before 1968(b) Period before 1968-1997(c) Period after 1997

Translog function of the services of individual assets ( )
where,
: the rental price of capital services from asset type
the rental price of capital services from asset type
where, : the rate of return
: the acquisition price of investment good with , which is the rate of inflation in the price of investment good .
)(tK ji
2. Measurement of Capital Price
[ ]∑ −−=−−i
ji
jii
jj tKtKvtKtK )1(ln)(ln)1(ln)(ln
[ ])1()(21
−+= tvtvv iii ∑=
iii
iii tKtp
tKtptv)()(
)()()(
)(tPi
)1(]})(1[)]()({[)( −Π++Π−= tqtttrtP iiiii δ
)(tr
)(tqi )1()]1()([)(
−−−
=Πtq
tqtqti
iii

indirect method of imputing rental price of capital in j-sector from the annualized I/O Table
where, : our estimates of capital stock in j-sector in constant prices
Measurement of Capital Price
jjjK
jK KKPP /=
jK
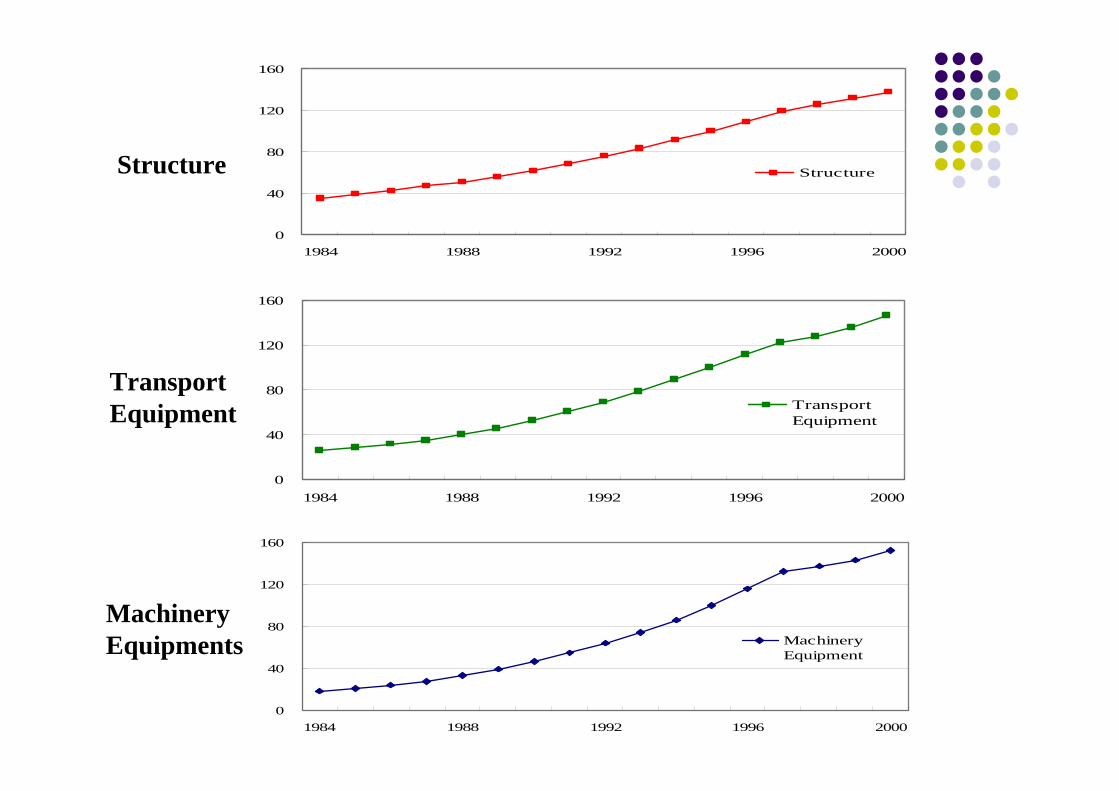
Structure
Transport Equipment
Machinery Equipments
0
40
80
120
160
1984 1988 1992 1996 2000
MachineryEquipment
0
40
80
120
160
1984 1988 1992 1996 2000
Structure
0
40
80
120
160
1984 1988 1992 1996 2000
TransportEquipment

152.6655 146.5290 137.6533 2000
143.7201 135.8352 131.9063 1999
137.2088 127.4984 125.8970 1998
132.1943 122.5036 119.1530 1997
115.8168 112.0274 109.3747 1996
100.0000 100.0000 100.0000 1995
85.9452 88.9207 91.2642 1994
74.2615 78.0714 83.2423 1993
64.4908 69.2826 75.6301 1992
55.3544 60.7903 68.7454 1991
46.7165 52.8521 61.9486 1990
39.3313 45.7661 55.9261 1989
33.0070 40.1079 51.2445 1988
27.5775 35.0529 47.2253 1987
23.8907 31.5348 42.7534 1986
20.8522 28.3387 38.8206 1985
18.4485 25.5263 35.0946 1984
MachineryEquipment
TransportEquipmentStructureYear

Labor Input
1. Data(1) Ministry of Labor
- 3 digit classification - wage data
(2) National Statistical Office - 2 digit classification- agricultural and government sector data
2. Quality Adjustment- sex, educational attainment, age

Measurement of Labor Input
In order to make quality adjustment to the employment data, we have taken the follow steps;
1) Defining variables.: wage rate for j-sector and l-type category of labor
: the share of labor income by l-typecategory of labor is j-sector
: the average weight of j-sector and l-type laborincome during the period of (t-1) and t
jLlP
∑= j
lj
Ll
jl
jLlj
Ll LpLpv
[ ])1()(21
−+= tvtvv jLl
jLl
jLl

Measurement of Labor Input
[ ] [ ])1(ln)(ln)1(ln)(ln)1(ln)(ln −−+−−=−− tHtHtMtMtLtL jjjjjj
[ ]∑ −−+l
jjjLl tdtdv )1(ln)(ln
)()()()( tHtMtdtL jl
jl
jl
jl =
2) Decomposed labor input of j-sector and l-type.
3) Computing the growth rate of j-sector labor input
j = 1,2,…..J

Characteristics of Korean Database for KLEM Model
5 types of assets and 10 large industrieswith 28 sub-manufacturingIndustries
Capital stock (capital services)
Gross and Net Stock data: National Wealth Survey (1987)(1997)Capital Formation data: National Accounts(1999)Annual Gross and Net Stock by Industries and by Types of Assetsand Estimated Depreciation Rates are available in Pyo (2001)
Net stock and Investment data: Mining and Manufacturing CensusMining and Manufacturing Survey- Types of assets: residential building, nonresidential building, otherconstruction, transport equipment, machinery equipment
Number of Sectors
2164-77 or 20-28 22
Gross output
National AccountsInput-Output Table (1980,1985,1990,1995)U-Table and V-Table Annual tables (1990-1997)

Characteristics of Korean Database for KLEM Model
21 sector by V-Table
PPP-prices of outputs of each industry in both Korea and the reference economy and exchange rate
Intermediate inputsNational AccountsInput-Output Table(1980, 1985, 1990, 1995)U-Table and V-Table Annual Tables(1990-1997)Energy Input; sectors 2, 4, 14, 28, and 29
18 types2 types3 types3 types
Labor input (days worked)Report of Monthly Labor Survey (NSO)Survey Report on Wage Structure (Ministry of Labor)-sex (male/female)-educational attainment
(middle school graduates, high school graduates and college above)-age classes (16~34, 35~54, and 55 above)

Table 3. Characteristics of KLEM Database in Korea(1984-2000)
8.216.052.499.968.32Average growth rate
51263776255159016259649710492372000
4749486870615485524681509841041999
4549266359513230323532399567241998
4632015472214201322424119635561997
4348325039414485220272069075421996
4058044007014760918177808393371995
3687443972814102916265797660401994
3367084001513927114569447031661993
3234043496313496213051416575311992
3051153161512609711655116155421991
2813592687213460210303355563801990
251339246471324319119814964131989
232905236471369408165594566311988
204804237691324997343923993971987
175803212881143826586413447501986
149136243181098705930252946011985
139325252271097945337612781481984
M billion Won
E billion Won
L 10000 hour
K billion Won
Gross Outputbillion Wonyear
(in 1995 prices)

Table 11. Gross Output Growth Accounting for Korea (1984-1997)
0.51 6.84 5.24 3.33 9.10 7.29 primary metal17
1.27 6.54 3.59 -2.27 9.14 6.48 stone,clay,glass16
4.07 -0.37 1.19 -20.38 0.70 0.38 Leather15
0.31 6.12 3.76 -0.01 11.79 6.04 petroleum products14
0.25 7.46 9.94 -0.01 11.48 7.94 Chemicals13
1.32 8.16 5.83 2.22 8.09 7.88 printing,publishing,allied12
0.19 6.33 6.38 0.50 13.06 6.84 paper allied11
2.16 9.02 8.02 -2.21 10.28 9.49 Furniture10
2.62 5.56 5.65 -5.22 4.63 6.70 lumber and wood9
1.72 3.60 3.45 -6.98 4.10 3.54 Apparels8
1.52 1.01 2.70 -5.08 5.19 2.30 Textile7
-0.52 2.75 3.06 0.90 7.73 3.07 Food6
-1.55 5.18 -3.53 7.01 13.08 5.40 Construction5
0.02 0.00 0.00 0.00 -0.85 0.00 Oil and gas4
10.76 4.12 5.11 -5.90 -15.95 3.75 Metal non-metal3
-0.86 -7.81 -9.66 -11.90 -2.46 -10.37 coal mining2
-2.85 2.07 4.70 -2.43 7.10 1.66 Agriculture1
TFPMaterial Input Energy InputLabor InputCapital InputGrowth output

Table 11. Gross Output Growth Accounting for Korea (1984-1997)
TFPMaterial Input Energy InputLabor InputCapital InputGrowth output
1.04 8.216.052.499.968.32Total
5.41 2.06 0.35 1.81 11.36 7.46 Public service33
-1.17 9.12 8.73 9.91 11.86 8.85 other private service32
3.55 14.07 13.74 9.07 8.09 13.54 Finance and real estate31
-2.93 10.00 6.18 11.37 12.16 8.19 Trade30
1.22 10.49 19.63 7.06 17.90 17.44 gas utility29
-0.02 8.53 2.93 7.07 8.28 6.65 electric utility28
3.41 17.67 10.13 2.54 12.29 13.66 communication27
0.68 8.59 4.79 2.55 7.12 6.66 transportation 26
-2.20 1.02 1.74 -5.59 23.95 1.53 misc.manufacturing25
2.89 11.19 11.85 -4.76 12.07 11.39 Rubber24
1.64 11.05 7.67 0.80 11.01 10.87 Instrument23
-2.66 3.66 -10.88 5.08 21.29 3.05 transportation equip.22
1.12 15.22 7.16 5.08 12.05 14.39 Motor21
2.13 14.13 9.66 -1.99 14.40 14.24 electrical machinery20
1.39 10.59 8.02 5.67 7.58 10.60 Machinery19
1.36 6.32 5.86 0.09 11.96 7.38 fabricated metal18

Table 12. Trends in Productivity and Capital-Output Coefficients in Korea(1984-2000)
7.571.595.98Average Growth Rate(%)
16.332.476.602000
15.942.516.361999
17.792.467.231998
15.792.336.781997
14.002.236.271996
12.312.175.691995
11.532.125.431994
10.462.075.051993
9.671.984.871992
9.241.894.881991
7.651.854.131990
6.891.843.751989
5.961.793.331988
5.541.843.011987
5.761.913.011986
5.402.012.681985
4.861.922.531984
K/LK /YOYO/LYear

Figure 1. Labor Productivity
0
2
4
6
8
1984 1988 1992 1996 2000
YO/L
%

Figure 2. Capital-Output Coefficient / Capital-Labor Ratio
K/YO
K/L
0.0
0.5
1.0
1.5
2.0
2.5
3.0
1984 1988 1992 1996 2000
%
0
2
4
6
8
10
12
14
16
18
20