growing up in irelandgrowing up in ireland has been funded by the department of children and youth...
TRANSCRIPT
National Longitudinal Study of Children
Growing Up in Ireland
INFANT COHORT
REPORT 9
THE LIVES OF 5-YEAR-OLDS
National Longitudinal Study of ChildrenGrowing Up in Ireland
THE LIVES OF 5-YEAR-OLDS
Aisling Murray, Eoin McNamara, James Williams, Emer Smyth
The views expressed in this report are those of the authors and do not necessarily reflect the views of the funders or of either of the two institutions involved in preparing the report.
Project1 14/10/2013 16:29 Page 1
Name Institution
Aisling Murray ESRI
Eoin McNamara ESRI
James Williams ESRI (Alumnus)
Emer Smyth ESRI

Growing Up in Ireland • THE LIVES OF 5-YEAR-OLDS
2
Copyright © Minister for Children and Youth Affairs, 2019
Department of Children and Youth AffairsBlock 1, Miesian Plaza, 50-58 Baggot Street Lower, Dublin 2 D02 XW14
Published by The Stationery Office, Dublin
ISBN 978-1-4468-8019-7
All rights reserved. No part of this publication may be reproduced, stored in a retrieval system, or transmitted, in any form or by any means, electronic, mechanical, photocopying, recording or otherwise, without the prior permission in writing of the copyright holder.
For rights of translation or reproduction, applications should be made to the Head of Communications, Department of Children and Youth Affairs, Block 1, Miesian Plaza, 50-58 Baggot Street Lower, Dublin 2
AcknOwLEDgEmEnTS
3
Growing Up in Ireland • THE LIVES OF 5-YEAR-OLDS
ACkNOwLEDgEmENTS
This report uses data collected as part of the Growing Up in Ireland study. A large number of individuals worked collectively to gather and prepare these data including field interviewers and operations staff based at the ESRI; as well as other researchers and policy-makers who contributed as part of the study’s steering group, scientific advisory group and research ethics committee. Dorothy Watson and Caoimhe O’Reilly, both of the ESRI, provided fundamental support in bringing this report to publication.
The authors wish to acknowledge inputs to this particular report from external reviewers, and current and former staff at the Department of Children and Youth Affairs including Dr Claire Finn and Dr Clare Farrell.
Last, but not least, the study would not be possible without the commitment and generosity of parents, children, teachers, principals and other caregivers. The authors extend their heartfelt thanks to the thousands of individuals around the country who completed questionnaires, talked to interviewers and helped us build a picture of what it is like to be Growing Up in Ireland.
Aisling MurrayEoin McNamaraJames WilliamsEmer Smyth
Growing Up in Ireland has been funded by the Department of Children and Youth Affairs (DCYA) in associationwith the Central Statistics Office (CSO). These data have been collected in accordance with the Statistics Act, 1993.The DCYA and CSO take no responsibility for the views expressed in the research. The project has been designedand implemented by the joint ESRI-TCD Growing Up in Ireland Study Team. © DCYA.
TAbLE OF CONTENTS
LIST OF FIgURES 7LIST OF TAbLES 11
ExECUTIVE SUmmARY 12
CHApTER 1: INTRODUCTION 191.1 Introduction 20 1.1.1 Background to Report 20 1.1.2 Operation and Objectives of Growing Up in Ireland 201.2 Conceptual Framework 211.3 Findings from Cohort ’08 at 3 Years of Age 231.4 The Data and Methodology 24 1.4.1 The sample and response rates 24 1.4.2 Reweighting the data 26 1.4.3 Interpreting the data and presenting findings 26 1.4.4 Informants and their questionnaires 27 1.4.5 The timing of fieldwork 271.5 Definitions of Background Characteristics Used in this Report 28 1.5.1 Family social class 28 1.5.2 Family income group 28 1.5.3 Family type 28 1.5.4 Highest level of Primary Caregiver’s educational attainment 291.6 Structure of Report 29
CHApTER 2: FAmILY CHARACTERISTICS AND FINANCIAL CIRCUmSTANCES 312.1 Introduction 322.2 Characteristics of the Families and Parents of 5-Year-Olds 32 2.2.1 The demographic characteristics of the parents of 5-year-olds 32 2.2.2 Changing family structures between 9 months and 5 years of age 33 2.2.3 Socio-demographic characteristics of the families of 5-year-olds 35 2.2.4 Employment in the families of 5-year-olds 362.3 The Financial and Economic Circumstances of Families 41 2.3.1 Equivalised income and worklessness 41 2.3.2 Family financial stress 452.4 Summary 46
Growing Up in Ireland • THE LIVES OF 5-YEAR-OLDS
4
CHApTER 3: pHYSICAL HEALTH AND DEVELOpmENT 493.1 Introduction 50 3.1.1 Background 50 3.1.2 Key health findings from Growing Up in Ireland Cohort ’08 at age 3 513.2 Health Status of 5-year-olds 51 3.2.1 Socio-demographic risk factors for poorer health at 5 years 51 3.2.2 Longitudinal health trends 52 3.2.3 Longstanding illness, condition or disability 533.3 Injuries among 5-Year-Olds 55 3.3.1 Common types, most frequent locations 55 3.3.2 Socio-demographic risk factors for injuries 563.4 Overweight and Obesity at 5 Years 57 3.4.1 Descriptive and socio-demographic risk factors 57 3.4.2 Longitudinal trends 583.5 Calorie Intake of 5-year-olds 613.6 Medical Card Cover and GP Consultations 623.7 Antibiotic Usage among 5-year-olds 643.8 Summary 66
CHApTER 4: SOCIO-EmOTIONAL DEVELOpmENT AND pLAY 694.1 Introduction 70 4.1.1 Background 70 4.1.2 Key findings from Cohort ’08 at 3 years 714.2 Strengths and Difficulties Questionnaire 71 4.2.1 Parent report 71 4.2.2 Teacher-reported SDQ scores 73 4.2.3 Longitudinal trends 75 4.2.4 Impact of difficulties in socio-emotional development 764.3 Social Skills Development 78 4.3.1 Socio-demographic trends 78 4.3.2 Longitudinal trends 804.4 Play and Activities 81 4.4.1 Screen-time 81 4.4.2 Play 84 4.4.3 Reading 874.5 Summary 89
cOnTEnTS
5
Growing Up in Ireland • THE LIVES OF 5-YEAR-OLDS

CHApTER 5: pARENTINg AND FAmILY RELATIONSHIpS 915.1 Introduction 92 5.1.1 Background 92 5.1.2 Key findings on parenting at 3 years 925.2 Parent-Child Relationship 93 5.2.1 Primary and Secondary Caregiver’s relationship with the child at 5 years 93 5.2.2 Longitudinal trends in the parent-child relationship 955.3 Parenting Styles 96 5.3.1 Parenting styles at 5 years 96 5.3.2 Longitudinal trends in parenting styles 995.4 Discipline Strategies 100 5.4.1 Strategies at age 5 years 1005.5 Parenting Stress 102 5.5.1 Parental stress in Primary and Secondary Caregivers 102 5.5.2 Longitudinal trends in parental stress 1025.6 Family Activities 104 5.6.1 Activities with any family member 104 5.6.2 Activities with the Primary Caregiver 1055.7 Primary Caregivers’ Report of Contact with Non-Resident Parent 106 5.7.1 Contact between non-resident parents and their children at age 5 years 108 5.7.2 Maintenance and other supports provided by non-resident parents 1085.8 Summary 109
CHApTER 6: SCHOOLINg AND COgNITIVE DEVELOpmENT 1116.1 Introduction 112 6.1.1 Background 112 6.1.2 Key findings at age 3 years 1136.2 School Start 1136.3 Uptake of Free Pre-School Year Scheme 115 6.3.1 Usage 115 6.3.2 Attitudes towards preschool 1156.4 School Readiness 116 6.4.1 Parent report 117 6.4.2 Teacher report 1196.5 Cognitive Development 121 6.5.1 Teacher reports 121 6.5.2 Direct assessment in the home 1246.6 Summary 126
CHApTER 7: SUmmARY AND DISCUSSION 1277.1 Introduction 1287.2 Informing Policy 128 7.2.1 Outcome One: Active and healthy – physical and mental wellbeing 129 7.2.2 Outcome Two: Achieving – full potential in learning 130 7.2.3 Outcome Three: Safe and protected from harm 132 7.2.4 Outcome Four: Economic security and opportunity 132 7.2.5 Outcome Five: Connected, respected and contributing to their world 1347.3 Next Steps in Growing Up in Ireland’s Cohort ’08 134
REFERENCES 136
Growing Up in Ireland • THE LIVES OF 5-YEAR-OLDS
6
LIST OF FIgURES
Figure 1.1: Bronfenbrenner’s ecological perspective on child development (adapted from Garbarino, 1982) 22
Figure 2.1: Summary of change in household composition of families between 9 months and 5 years, classified by family type at 9 months 34Figure 2.2: Family type by Primary Caregiver’s marital status at 5 years 36Figure 2.3: Percentage of children by family type and Primary Caregiver’s educational level 36Figure 2.4a: Primary Caregiver’s employment status by PCG education when child was aged 5 years 39Figure 2.4b: Primary Caregiver employment status by family type when child was aged 5 years 40Figure 2.5. Equivalised income for households when the Study Child was aged 5 years, categorised by Primary Caregiver’s education and household type 42Figure 2.6: Mean equivalised income when child was aged 9 months (2008-2009), 3 years (in 2011) and 5 years old (in 2013), according to the Primary Caregiver’s educational status at first interview 42Figure 2.7: Family type of 5-year-olds by family equivalised income quintile 43Figure 2.8: Number of earners in the household when child was aged 9 months, 3 years and 5 years 44Figure 2.9: Number of earners classified by household type, when child was aged 9 months (2008-09), 3 years (2011) and 5 years old (2013) 44Figure 2.10: Percentage of families recording varying levels of difficulty in making ends meet when the Study Child was 9 months, 3 years and 5 years of age 45Figure 2.11: Persistence of difficulty making ends meet when child was aged 9 months, 3 years and 5 years, classified by family type when the child was aged 5 years 46
Figure 3.1: Percentage of 5-year-olds described as ‘very healthy, no problems’ by family income, gender and birthweight 51Figure 3.2: Percentage of children experiencing a decline in health rating between 9 months and 5 years for each family income group and gender 53Figure 3.3: Frequency of having a longstanding illness, health condition or disability for each gender, birthweight category, family type and social class group 53Figure 3.4: Percentage of 5-year-olds with asthma according to gender, family type and social class 54Figure 3.5: Percentage of children sustaining their most recent injury in their own home, by family type 57Figure 3.6: Percentage of children who were overweight or obese at 5 years, by gender and income 58Figure 3.7: Frequency of remaining overweight (or obese), or becoming overweight, between ages 3 and 5 years, by gender and Primary Caregiver education 59Figure 3.8: Relationship between overweight and obesity in parents at 3 years and child’s BMI status at age 5 years (all families for PCG, two-parent families for SCG) 59Figure 3.9: Relationship between overweight and obesity in either or both parents at 3 years and child’s BMI status at age 5 years (two-parent families only) 60Figure 3.10: Retrospective trajectories in earlier weight for children who were non-overweight, overweight or obese at age 5 years 61Figure 3.11: Average calories consumed per day, classified by equivalised income quintile, Primary Caregiver’s education and child’s gender 61Figure 3.12: Percentage of 5-year-olds covered by a medical card, classified by family social class, family type and health status of Study Child 62
cOnTEnTS
7
Growing Up in Ireland • THE LIVES OF 5-YEAR-OLDS
Figure 3.13: Average number of consultations with a GP, classified by family income quintile, Primary Caregiver education and Study Child’s health status 63Figure 3.14: Average number of GP consultations on the 5-year-old in the last 12 months, classified by health status and whether or not covered by a medical card (‘full’ or ‘GP’ card) 64Figure 3.15: Average percentage of 5-year-olds who had received a course of antibiotics in the previous 12 months, classified by health status and whether or not covered by a medical card (‘full’ or ‘GP’ card) 65Figure 3.16: Average number of courses of antibiotics taken by 5-year-olds in the previous 12 months, classified by health status and whether or not covered by a medical card (‘full’ or ‘GP’ card), based only on those who had received a course 65
Figure 4.1: Percentage of children with a ‘total difficulties’ score in the top decile (parent-reported SDQ) at 5 years by household social class and family type 73Figure 4.2: Percentage of children in the top decile on the ‘total difficulties’ scale (teacher report SDQ) at 5 years by household social class and family type 74Figure 4.3: Proportion of children in the top decile (‘at risk’) on the SDQ ‘total difficulties’ scale at ages 3 and 5 years 75Figure 4.4: Percentage of children in the top decile on the SDQ ‘total difficulties’ scale at 5 years according to score on the ASQ personal-social measure at 9 months 76Figure 4.5: Percentage of 5-year-olds described by their Primary Caregiver as having ‘minor’, ‘definite’ or ‘severe’ difficulties in socio-emotional development classified by family type, gender, birthweight and urban/rural area (representing 19% of all Primary Caregivers) 77Figure 4.6: Effects of the child’s socio-emotional difficulties on different aspects of life, expressed as a percentage of those affected (accounting for 19% of 5-year-olds) 78Figure 4.7: Percentage of 5-year-olds in the top quartile for each of the social skills scales (assertion, responsibility, empathy and self-control) according to their family type 79Figure 4.8: Percentage of 5-year-olds in the top quartile for each of the social skills scales (assertion, responsibility, empathy and self-control) according to gender 80Figure 4.9: Percentage of 5-year-olds in the top quartile for each of the social skills scales (assertion, responsibility, empathy and self-control) according to whether they had been described as having an easier, average or more difficult temperament at age 3 years 80Figure 4.10: Percentage of 5-year-olds in the top quartile for each of the social skills scales (assertion, responsibility, empathy and self-control) according to whether their performance on the ASQ personal-social scale at 9 months old was below average or at/above average 81Figure 4.11: Frequency of screen-based activities, type of screen-time and use of electronic devices among 5-year-olds 82Figure 4.12: Trends among children aged 5 in screen-time duration and engaging in ‘a mixture of [screen-based] activities’, by Primary Caregiver’s education 83Figure 4.13: Summary of gender differences in amount of screen time, type of screen time and use of electronic devices of children age 5 83Figure 4.14: Frequency of different physical play activities of children age 5 84Figure 4.15: Differences in likelihood of engaging in various physical play activities ‘every day’ according to gender, urban/rural area, and family income (only lowest and highest quintiles shown) of children aged 5 85Figure 4.16: Frequency of non-physical play types of children aged 5 years 86Figure 4.17: Gender differences among children aged 5 in the frequency of engaging in pretend play, art activities or dance/music/movement 86
Growing Up in Ireland • THE LIVES OF 5-YEAR-OLDS
8
Growing Up in Ireland • THE LIVES OF 5-YEAR-OLDS
Figure 4.18: Age 3 preference for active or inactive pastimes and the likelihood of engaging in various activities ‘every day’ at age 5 years 87Figure 4.19: Proportion of 5-year-olds who are read to ‘every day’ by their Primary Caregiver, by Primary Caregiver’s education and child gender 88Figure 4.20: Proportion of 5-year-olds who are read to ‘every day’ by their Primary Caregiver, by the number of days they were read to per week at the age of 3 89
Figure 5.1: Percentage of 5-year-old boys and girls whose Primary and Secondary Caregivers reported closeness and conflict levels in the least favourable decile 94Figure 5.2: Percentage of 5-year-olds whose parents reported scores in the least favourable decile for closeness and conflict according to household social class, for both Primary and Secondary Caregivers 94Figure 5.3: Percentage of 5-year-olds whose parents reported scores in the least favourable decile for closeness and conflict according to urban or rural area, for both Primary and Secondary Caregivers 95Figure 5.4: Percentage of 5-year-olds whose Primary Caregivers reported levels of warmth, hostility and consistency in the least favourable decile, by family type 98Figure 5.5: Percentage of Primary and Secondary Caregivers using the preferred discipline combination of always discussing/never smacking child aged 5, according to their level of education 101Figure 5.6: Percentage of Primary and Secondary Caregivers of a child aged 5 in the highest decile of parental stress according to family type and household social class 102Figure 5.7: Risk of the Primary Caregiver being in the highest stress decile at age 5 years based on being in the highest decile at previous waves 103Figure 5.8: Frequency of children aged 5 participating in selected activities with a family member in the last month, classified by living in an urban or rural area 104Figure 5.9: Percentage of children aged 5 attending a cultural/school event or visiting a library with a family member in the past month, according to the Primary Caregiver’s level of education 105Figure 5.10: Percentage of children aged 5 engaging in selected activities with the Primary Caregiver at least once a week according to family type (left) and Primary Caregiver education (right) 106Figure 5.11: The child’s age at the time of the Primary Caregiver’s separation from the other biological parent, for children with non-resident parent by the time of the age 5 interview 107Figure 5.12: Frequency of contact between 5-year-old and non-resident parent, as reported by PCG, separately for face-to-face contact and other types 108Figure 5.13: Frequency of PCG receiving different types of support from the 5-year-old’s non-resident parent 109
Figure 6.1: Timing of 5-year-olds starting school, classified by month of birth 113Figure 6.2: Percentage of boys and girls starting school in 2012, classified by month of birth 114Figure 6.3: Percentage of children who were born in May or June 2008 in each income quintile who started school in 2012 114Figure 6.4: Percentage of children whose parents would have been able to send their child to preschool even without the Free Pre-School Year scheme, and those who topped up the scheme with additional hours, according to family income quintile 115Figure 6.5: Children whose parental rating of their preschool placed their facility in the bottom decile, according to Primary Caregiver’s education and child’s gender 116
9
cOnTEnTS
Growing Up in Ireland • THE LIVES OF 5-YEAR-OLDS
10
Figure 6.6: Primary Caregiver’s rating of agreement on the child’s competency on school-readiness indicators, presented separately for children who had or had not started school at the time 117Figure 6.7: Percentage of Primary Caregivers giving their children the lowest school-readiness scores, according to family income quintile 118Figure 6.8: Percentage of children in the lowest decile of parent-reported school-readiness scores by performance status on two indicators of development at 9 months 118Figure 6.9: Percentage of children reported by teachers to have attained all of the first 3 language milestones by gender, family income and Primary Caregiver’s education (lowest and highest featured for income and education) 120Figure 6.10: Comparison of total teacher-reported scores on the language and disposition/attitudes subscales by gender, income, PCG education and birthweight 120Figure 6.11: Percentage of 5-year-olds attaining all 3 basic milestones on teacher-reported subscales of cognitive development, by gender, PCG education and birthweight 122Figure 6.12: Percentage of children aged 5 rated as below or well below average on selected subjects according to gender, income, PCG education and low birthweight 123Figure 6.13: Percentage of children aged 5 in the top decile of the BAS vocabulary and problem-solving measures by gender, family income, Primary Caregiver’s education and region 124Figure 6.14: Longitudinal relationships – frequency of 5-year-olds being in the top decile of BAS vocabulary or problem-solving scores at age 5 years according to (a) being in the top decile on the same tests at age 3 and (b) above/below average score on the ASQ communication and problem-solving measures at 9 months 125

Growing Up in Ireland • THE LIVES OF 5-YEAR-OLDS
11
LIST OF TAbLES
Table 1.1: Response outcomes at the second round of interviewing when the children were 3 years old 25Table 1.2: Response outcomes at Wave 3 when the Study Children were 5 years old 25Table 2.1: Profile of Primary and Secondary Caregivers of 5-year-olds 33Table 2.2: Family type at 9 months, 3 years and 5 years 33Table 2.3: Changes in family type, 9 months to 5 years 34Table 2.4: Principal economic status of Primary and Secondary Caregivers at 9 months, 3 years and 5 years 37Table 2.5: Principal economic status of Primary Caregiver (PCG) by age of child (9 months and 5 years old) 38Table 2.6: Average number of hours worked outside the home by Primary Caregiver of 5-year-old 38Table 2.7: Work/life balance of Primary and Secondary Caregivers when the Study Child was 5 years old 40Table 2.8: Number of rounds of interview in which families of 5-year-olds reported making ends meet ‘with great difficulty’, ‘with difficulty’, or ’with some difficulty’ 45Table 3.1: Health status of Study Children at 5 years, 3 years and 9 months of age, as described by their Primary Caregiver 52Table 3.2: Percentage of children who were in each of the four health categories at 9 months and their subsequent health status at 5 years 52Table 3.3: Prevalence of selected longstanding conditions at age 5 years 54Table 3.4: Frequency of each most recent injury type at age 5 years 55Table 3.5: Location where injury occurred 56Table 3.6: Individual longitudinal change in weight status from 3 years to 5 years 58Table 4.1: Descriptive statistics for parent-reported SDQ scales at 5 years, contrasted with mean scores at age 3 years 72Table 4.2: Descriptive statistics for teacher-reported SDQ scales at 5 years 73Table 4.3: Comparison of children receiving an SDQ score in the ‘at risk’ range from both parent and teacher 74Table 5.1: Descriptive statistics for Pianta parent-child relationship scales at 5 years, contrasted with mean scores at age 3 years 93Table 5.2: Percentage of 5-year-olds whose parents reported closeness and/or conflict levels in the least favourable decile according to previously being in the least favourable decile at age 3 96Table 5.3: Descriptive statistics for parenting style scales at 5 years, contrasted with mean scores at age 3 years, as reported by PCG and SCG 97Table 5.4: Percentage of 5-year-olds whose Primary Caregivers reported levels of warmth, hostility and consistency in the least favourable decile by family type, by whether they reported levels in the least favourable decile on the same measure at age 3 99Table 5.5: Percentages of different discipline strategies at age 5 years, for PCG and SCG 100Table 5.6: Frequency of play activities and outings between Primary Caregiver and Study Child 105Table 5.7: Relationship between Primary Caregiver (PCG) and non-resident biological parent (NBP) 107Table 6.1: Percentage of 5-year-olds achieving the first 3 milestones in a teacher-reported measure of ‘disposition/attitudes’ and ‘language for communication and thinking’, according to year in school 119Table 6.2: Mean scores on teacher-reported subscales and percentage reaching all 3 basic milestones for ‘linking sounds and letters’, ‘reading’ and ‘numbers’ according to year in school 122Table 6.3: Percentage of children aged 5 rated relative to the average in individual subject areas 123
cOnTEnTS
12
Growing Up in Ireland • THE LIVES OF 5-YEAR-OLDS
ExECUTIVE SUmmARY
INTRODUCTION
BackgroundGrowing Up in Ireland is the national longitudinal study of children. It tracks the development of two cohorts of children over time: Cohort ’08, most of whom were born in 2008 and formerly called the Infant Cohort; and Cohort ’98, most of whom were born in 1998 and formerly called the Child Cohort. The main objective of the study is to contribute to the development of policies and services to support children in Ireland by increasing the understanding of factors that enhance or undermine the wellbeing of children and families.
The study’s conceptual framework draws heavily from Bronfenbrenner’s bio-ecological model which views the individual child as being an active agent whose development is influenced not only by the face-to-face interactions with individuals in his/her most immediate environment (termed the ‘microsystem’), but also by the wider community and circumstances (‘exosystem’ and ‘macrosystem’) that affect the child directly or through effects on the microsystem (‘mesosystem’).
About this reportThis report is concerned with the younger of the two cohorts in the Growing Up in Ireland study (Cohort ’08). It is based mainly on data collected from this cohort at five years of age in 2013, but also drawing on data collected when the Study Children were aged three and when they were nine months old. Summary findings from this cohort at age nine have been published. This new report provides a further, more in-depth description of the circumstances of the children and their families when they were five years old.
At the first wave, 11,134 children aged nine months and their parents participated between September 2008 and March 2009. When the families were interviewed again in 2011, the Study Children were three years old and 9,793 families took part. The home phase took place between March and September 2013 when the Study Children were aged five, followed by data collection from their schools via postal questionnaires completed over winter 2013/14. There were 9,001 Study Children at age five years, representing a 91% response rate from the 9,793 who had been interviewed at age three years; or 81% of the 11,134 respondents who had participated at nine months of age.
The data in this report have been statistically adjusted to account for differential response and attrition rates according to the family’s background characteristics. This is in line with best international practice in sample surveys and ensures that the data are representative of the population under study – in this case five-year-olds resident in Ireland who had also been resident in Ireland at nine months old.
The report contains five chapters of results, beginning with a context-setting discussion of the circumstances of the families in which the five-year-olds live. Chapters 3 to 6 focus on child outcomes in the study’s core domains of health, socio-emotional development (including relationship with parents) and school/cognitive development. The emotional quality of parent-child interactions is an important feature of the child’s microsystem (in the conceptual model). The final chapter (Chapter 7) discusses some of the key findings in light of two key policy documents concerning children: Better Outcomes, Brighter Futures: The National Policy Framework for Children & Young People 2014-2020 (Department of Children and Youth Affairs, 2014) and First 5: A Whole-of-Government Strategy for Babies, Young Children and their Families 2019-2028 (Government of Ireland, 2018).
The remainder of this executive summary focuses on the five results chapters (Chapters 2–6) and points to some key implications for policy. Any of the group differences noted in this discussion are statistically significant.
Growing Up in Ireland • THE LIVES OF 5-YEAR-OLDS
13
FAmILY CHARACTERISTICS AND FINANCIAL CIRCUmSTANCES
Family characteristics at age five yearsTo set the context for the discussion of child outcomes in the areas of health, education and socio-emotional development, the study examined how family structure and financial circumstances changed over time.
Eighty-six per cent of five-year-olds lived in two-parent families and the remaining 14% lived in one-parent families. Primary Caregivers1 in one-parent families had a more disadvantaged profile in terms of level of education and income. Many of the children were in larger families by age five than they had been at age nine months, mainly reflecting the birth of other children into the family. At nine months, two-parent families with two or more children accounted for just over half (53%) of all families. However, this proportion had increased to 78% by the time the Study Child was five years of age.
The overall percentage of children living in one or two-parent families has remained fairly stable over time, with 14-15% of children living in one-parent families and the remainder living in two-parent families. However, there has been more change at the individual level. A majority of children (82%) were living in two-parent families at both nine months and five years, with 10% living in one-parent families at both those ages. However, 4% of children moved from a two-parent to one-parent family and a further 4% changed from a one-parent to two-parent family in the intervening years.
Socio-economic characteristics of parentsAt age five years, 55% of Primary Caregivers were at work outside the home, 35% described themselves as ‘looking after the home’, 5% were unemployed and 5% were in some other situation (such as being a student or unable to work due to illness). Among Secondary Caregivers (usually the children’s fathers), 84% were at work (outside the home), 1% were ‘looking after the home’, 11% were unemployed and 5% reported another status.
A substantial proportion of Primary (46%) and Secondary Caregivers (54%) who worked outside the home ‘agreed’ or ‘strongly agreed’ that they had missed out on family time because of work responsibilities.
Financial stressReflecting the impact of the recession (2008 onwards), the percentage of families who recorded ‘great difficulty’ or ‘difficulty’ in making ends meet increased from 13% at the nine-month interview to 21% at the three-year interview and to 25% by the five-year interview in 2013. One-parent families were about twice as likely as two-parent families to report difficulty in making ends meet at all three time points (52% of one-parent families with one child and 59% of one-parent families with two or more children, compared to 26% and 29%, respectively, of the smaller and larger two-parent families).
HEALTH
General healthFive-year olds were reported by parents to have generally been in good health. Over three-quarters (77%) were described by the Primary Caregiver as ‘very healthy’; one in five (21%) as ‘healthy but a few minor problems’, and just 2% as ‘sometimes quite ill’ or ‘almost always unwell’. Most children who were ‘very healthy’ at nine months of age continued to be so at five years of age.
In general, children from the highest-income families were the most likely to be described as ‘very healthy’: 80% of children in the top income quintile were so described compared to 72% to 75% of those in the lowest two quintiles.
1 The Primary Caregiver is usually the Study Child’s mother. The Secondary Caregiver, where present, is the spouse or partner of the Primary Caregiver and is usually the Study Child’s father.
ExEcuTIVE SummARY
Growing Up in Ireland • THE LIVES OF 5-YEAR-OLDS
14
By age five years, 18% of children were described as having a longstanding illness, condition or disability. Boys were more likely than girls to have a longstanding condition (21% compared to 15%), as were those in the lowest social class category (22% of those who never worked, compared to 17% of those in the professional/managerial social class). The most common conditions (expressed as a percentage of all 5-year-olds) were asthma (8%) and eczema or skin allergy (4%).
InjuriesOver a quarter of the children (28%) had sustained an injury requiring a trip to a doctor, health centre or hospital by the time they were five years old. In terms of the most recent injury, the most frequent type was a head injury (without loss of consciousness). This applied to 30% of children who had received an injury (or 8% of all 5-year-olds).
OverweightMost children at five years old were at a healthy weight (80%), but a minority had problems in this area: 15% were overweight and a further 5% were obese. Girls were at greater risk of being an unhealthy weight (17% of girls compared with 13% of boys were overweight). Obesity levels were significantly higher in the lowest income quintile (7% versus 4% in the highest income group).
Longitudinally, a number of patterns were evident. Those who were not-overweight at age three had a relatively low risk of becoming overweight/obese by age five (just 9%). The risk of being overweight/obese by the age of five was much higher among those who at age three had been overweight (50%) or obese (75%). However, it is encouraging that nearly half of those who had been overweight at age three became non-overweight by age five and 59% of those who had been obese at age three had improved (moving to the less serious overweight category or becoming non-overweight) by age five.
Medical cards and GP visitsThe survey with the families of five-year-olds took place before the introduction of free GP visits for children under six, in July 2016. According to their Primary Caregiver, 40% of five-year-olds were covered by a ‘full’ medical card and just under 4% were covered by the ‘GP-only’ card. As would be expected, rates of cover were significantly higher among socially disadvantaged groups: 94% of children where the family social class was coded as ‘never employed’2 had a full medical card.
The average number of GP consultations in the previous year for five-year-olds was 2.1 but varied according to child health status and medical-card coverage. In general, accounting for underlying health status, the average number of consultations was higher among children who were covered by a medical card under the General Medical Services Scheme (GMS). Among children who were ‘very healthy, no problems’ the average number of consultations in the past year was 1.8 for those with a medical card compared to 1.2 for those with no medical card.
SOCIO-EmOTIONAL DEVELOpmENT
Based on a question to the parent on whether the five-year-old had difficulties in any of the areas of emotions, concentration, behaviour or being able to get on with other people, 81% reported no difficulties, 16% reported minor difficulties, 3% reported definite difficulties and just 1% reported severe difficulties.
Strengths and DifficultiesThe main instrument for assessing the child’s socio-emotional development was the Strengths and Difficulties Questionnaire (SDQ). This is a widely used scale to assess child socio-emotional and behavioural wellbeing (Goodman, 1997). It is a screening tool rather than a diagnostic tool that asks about behaviour over the previous six months. At age five, the SDQ was completed by the Primary Caregiver, the Secondary
2 This is the group in respect of whom no information on the occupation of the parents (or parent, in one-parent families) was available. In most cases, this was because the parent(s) had never worked for pay or profit.
Growing Up in Ireland • THE LIVES OF 5-YEAR-OLDS
15
ExEcuTIVE SummARY
Caregiver (where applicable) and the class teacher (where applicable). Overall, five-year-olds received favourable reports from both parents and teachers on this measure, which covered hyperactivity/attention, peer problems, conduct problems, emotional symptoms and pro-social behaviour.
Following Goodman (1997), it is possible to group the scores on the ‘total difficulties’ scale (which covers hyperactivity, peer problems, conduct problems and emotional symptoms) and use the top decile on the ‘total difficulties’ to identify those ‘at risk’ of socio-emotional and behavioural problems (Goodman, 1997).
Children who scored in the top 10% on these four problem-focused aspects of the SDQ were categorised as being potentially ‘at risk’ of socio-emotional and behavioural problems. According to the Primary Caregiver’s reports, more than twice as many children in the ‘never employed’ social class families were in the top decile on the SDQ (22%) compared to children from ‘professional/managerial’ backgrounds (8%). Boys were more likely to have a high SDQ score than were girls (14% compared to 9%).
Screen-timeNearly all children spent some time in screen-based activities such as watching television, movies, or using a computer or games console on an average week day. The most common duration was ‘less than two hours’ (55%) but 14% typically spent three hours or more. Children in disadvantaged households were more likely to have extended periods of screen-time: 21% of children whose Primary Caregiver had the lowest level of education spent three hours or more on screen time on an average weekday compared to just 8% of children whose Primary Caregivers were in the highest education category.
It is possible to compare children’s time spent watching television at age three to their general screen-based time at age five. The results suggests that a high use of screen-based activities may start early for many children. Those children who had watched television for three or more hours at age three were more likely to have three or more hours of overall screen time at age five (28%, compared to just 10% of other children).
PlayPlay, as well as being enjoyable, is important to children’s development. A variety of play types were popular among children. One of the most frequently reported was ‘playing “make believe” and “pretend” games’; 68% of five-year-olds did so every day. The most popular physical play activities were chasing (66% played every day), bike or tricycle riding (50% every day) and ball games (48% every day). Some significant gender differences in play activities emerged. One of the biggest differences was for playing ball, with 60% of boys doing this every day compared to 36% of girls.
ReadingBeing read to at home is a very important influence on children’s language development. Two-thirds of children were read to every day by their Primary Caregiver, although 13% were read to less often than once a week. Daily parent-child reading is more common among the children of graduates (72%) than in families with Junior Certificate or lower qualifications (54%). Reading frequency at three and five years of age are strongly related; the majority of families who read to their three-year-old (almost) every day continued to do so at age five.
pARENTINg
Parent-child relationshipBoth Primary and Secondary Caregivers tended to rate their relationship with the Study Child as high in closeness and low in conflict. Overall, there were only slight differences between socio-demographic groups on this indicator.
Growing Up in Ireland • THE LIVES OF 5-YEAR-OLDS
16
DisciplineNearly all parents said they used an explanation of why a behaviour was wrong to discipline the Study Child, with 94% of Primary Caregivers and 90% of Secondary Caregivers doing this ‘regularly’ or ‘always’. A majority of parents said they never used smacking as a discipline strategy (58% of Primary Caregivers and 62% of Secondary Caregivers) and fewer than 1% said they used it ‘regularly’ or ‘always’.3
StressPrimary Caregivers in one-parent families were more likely to report higher levels of parental stress. The contrast was greatest between one-parent/one-child families (25% in the top parental stress decile) and two-parent/multiple child families (7% in the top decile). Over half (51%) of Primary Caregivers who had reported higher stress when the child was both nine months and three years old were in the most-stressed group again at age five years. Although this suggests some persistence in parental stress, it also indicates that stress can change over time: almost half who had been in the high stress group in the two earlier periods were not in the high-stress group when the Study Child was five years old.
Family activitiesGoing to a cultural (e.g. concert) or school event was the most popular family activity reported at five years, with 61% of children said to have done this in the past month. Children whose Primary Caregiver had degree-level education were the most likely to have been taken to this type of event (69% compared to 52% of those with lower secondary education).
Just over one-third (36%) of Primary Caregivers said they played with the child using toys or games/puzzles every day. One in five (22%) engaged the child in sports or physical activities on a daily basis. Parents with one child and/or higher levels of education reported more frequent engagement in these types of activities.
Non-resident parentsBy age five years, 14% of children had a biological parent living elsewhere. Among this group, over half of the Primary Caregivers (58%) had never lived with or been married to the child’s other parent.
Many non-resident parents (58%) lived within 30 minutes’ drive of the Study Child’s home. There was considerable variation in frequency of contact; 11% of children had daily face-to-face contact with their non-resident parent, but over a quarter had no face-to-face contact at all.
SCHOOLINg AND COgNITIVE DEVELOpmENT
School startAt the time of the home interview in spring/summer 2013, 70% of the five-year-olds had started school the previous September (2012). Nearly all the oldest children (born in December 2007 and aged 4 years 9 months in September 2012) had started school at that time, compared to just 31% of children born in June 2008. Younger children and those from higher-income groups were more likely to delay school start until the following year.
Free preschool yearAlmost all five-year-olds had availed of the free preschool year scheme (formally known as the Early Childhood Care and Education Scheme). Parents in the lowest income group were the least likely to say they would have sent the child to preschool without the scheme (61% compared to 91% in the highest income group) and also the least likely to have paid for extra hours (11% ‘topped up’ compared to 47% in the highest group). The payment of top-up hours partly reflects the need for extra hours of childcare in families where the mother is in employment, which, in turn, is linked to higher family incomes.
3 Note that the data on use of smacking were collected before the defence of smacking as reasonable chastisement was removed from Irish law by the Children First Act, 2015, which came into effect in December 2015.
Growing Up in Ireland • THE LIVES OF 5-YEAR-OLDS
17
ExEcuTIVE SummARY
Primary Caregivers typically gave high scores to the facility that provided preschool care to their children on scales associated with the richness of the care environment and the perceived quality of care.
School readinessWhen asked about how ready their child had been (or would be) for school on a number of dimensions, the majority of Primary Caregivers were confident about their child’s ability. Over 95% agreed that the child was able to mix with others, take turns, and go to the toilet on their own. A slightly lower percentage (about 85%) felt their child had the necessary pre-reading and writing skills.
In terms of teacher reports, collected later in winter 2013, a majority of children (just over 70%) were judged to have reached the three core age-appropriate developmental milestones in terms of ‘disposition/attitudes’ (interest in classroom activities, managing dressing and hygiene, and involvement in self-chosen activities) and the three age-appropriate developmental milestones relating to ‘language for communication and thinking’ (listens/responds, initiates communication and talks activities through). There were few differences between groups in terms of achieving the milestones on dispositions/attitudes. Differences were more apparent with respect to the language area: boys (59% compared to 65% of girls) were somewhat less likely to have achieved the three core milestones here. The differences by income group and parental education were much larger than the gender differences with respect to language, with gaps of 19 to 20 percentage points between the most advantaged and least advantaged groups. Not having reached these milestones is likely to impede children’s engagement with the primary curriculum (Ring et al., 2016; Girard et al., 2017).
Cognitive developmentTeachers also reported on the child’s emerging academic abilities. As with dispositions and language, teachers were asked to report whether children had achieved certain basic skills that would be expected for this age-group. Most children (95%) had reached the three core milestones for ‘numbers’, 91% for ‘reading’ and 88% for ‘linking sounds and letters’. Boys were somewhat less likely to have attained the first three language milestones (69% compared to 75% for girls) and children from lower-income families were considerably less likely to have done so (61% in the lowest income quintile compared to 81% in the highest). Boys and lower socio-economic groups (as indicated by low income and low maternal education) were also more likely to be rated by their teacher as below average for specific school subject areas such as English, Irish and Maths.
At the home visit, interviewers directly assessed the child’s vocabulary and problem-solving skills. Children from the most advantaged family backgrounds (as illustrated by higher income and higher maternal education) were more likely to have a score in the highest 10% than other children. For example, 17% of five-year-olds in the highest income group had a vocabulary score in the top decile compared to just 9% of children in the lowest income group. Comparable figures for the problem-solving measure were 14% and 8% respectively.
18
Growing Up in Ireland • THE LIVES OF 5-YEAR-OLDS
pOLICY ImpLICATIONS
The two main policy documents relevant to the lives of five-year-olds are:
• Better Outcomes, Brighter Futures: the National Policy Framework for Children and Young People, 2014-2020 (BOBF; DCYA, 2014)
• First 5: A Whole-of-Government Strategy for Babies, Young Children and their Families 2019-2028. (First 5, Government of Ireland, 2018)
Chapter 7 provides details on how the findings from this report can contribute important evidence to the main policy goals identified in these strategies. Some examples are:
• Evidenceofsocio-economicinequalitiesinhealthandofthepersistenceovertimeofhealthproblems are relevant to the goals of physical and mental wellbeing (BOBF) and optimum physical and mental health (First 5). The findings point to the importance of early health interventions targeted towards low-income and lower-social class groups.
• Ofrelevancetothegoalsof‘achievingfullpotentialinallareasoflearninganddevelopment’(BOBF) and ‘positive play-based early learning’ (First 5) are the findings that the ECCE scheme made more of a difference to the capacity of relatively disadvantaged families to avail of preschool. This is also relevant to the First 5 goal of ensuring ‘an effective early childhood system’.
• Thefindingsoninjurytypesandlocationsinwhichinjuryoccursprovideevidencetoinformspecificinterventions relevant to the goal to keep children ‘safe and protected from harm’ (BOBF).
• Thegoalofensuring‘economicsecurityandopportunity’(BOBF) will be informed by findings on which families were most likely to experience financial stress. Achieving this goal could also benefit from future research on the kinds of supports that enable families to improve their economic circumstances.
• Thefindingsofgenerallypositivefamilyrelationshipsandofsharedfamilyactivityarerelevantto the goals of ensuring that children are ‘connected, respected and contributing to their world’ (BOBF) and supporting strong and supportive families and communities (First 5).

19
InTRODucTIOn
Chapter 1
20
Growing Up in Ireland • THE LIVES OF 5-YEAR-OLDS
1.1 INTRODUCTION
1.1.1 bACkgROUND TO REpORTGrowing Up in Ireland is the national longitudinal study of children. The overarching objective of the study is to increase understanding of factors that enhance or undermine the wellbeing of children and families, thereby contributing to the development of policies and services to support children in Ireland.
The study focuses on how children in Ireland are faring across a broad range of developmental outcomes and measures of wellbeing as they grow up. It provides a comprehensive picture of numerous aspects of the lives of children, young people and their Primary Caregivers.4 As it is a longitudinal study, Growing Up in Ireland provides information that allows analysts to explore developmental trajectories over time and investigate the factors that most affect those trajectories and the life chances of children in Ireland today.
The study is based on two large, nationally representative cohorts of children and young people: Cohort ’08, most of whom were born in 2008 (formerly called the Infant Cohort), and Cohort ’98, most of whom were born in 1998 (formerly called the Child Cohort).
At the first wave of data collection for Cohort ’08, 11,134 children aged nine months and their parents participated between September 2008 and March 2009. When the families were interviewed again in 2011, the Study Children were three years old, and 9,793 families took part. At age five years, the home phase took place between March and September 2013 when the Study Children were five, and was followed by data collection from their schools via postal questionnaires completed over winter 2013/14. There were 9,001 Study Children at age five years, representing a 91% response rate from the 9,793 who had been interviewed at age three years, or 81% of the 11,134 respondents who had participated at nine months of age.
The second cohort in Growing Up in Ireland is Cohort ’98. It is based on 8,568 children and their Primary Caregivers, and was recruited when the children were nine years of age, between September 2007 and May 2008. Participants in this cohort were re-interviewed when the children were 13 years of age, between August 2011 and February 2012, and when the children were 17/18 years old, between November 2015 and September 2016. At the time of writing, the young people at the age of 20 and their families are again being re-interviewed.
This report is concerned with the younger of the two cohorts in the Growing Up in Ireland study (Cohort ’08). It is based mainly on data collected from this cohort at five years of age in 2013, but also draws on data collected when the Study Children were aged three and when they were nine months old. Summary findings from this cohort at age nine have already been published. This new report provides a further, more in-depth description of the circumstances of the children and their families and how the children have developed in key areas of their lives since they and their families were first recruited into the project when they were nine months old.
1.1.2 OpERATION AND ObjECTIVES OF gROwINg Up IN IRELANDGrowing Up in Ireland was established in 2006, is funded by the Department of Children and Youth Affairs (DCYA) and is managed by DCYA in association with the Central Statistics Office. It is being carried out by a group of researchers led by the Economic and Social Research Institute (ESRI) and Trinity College, Dublin (TCD).
Growing Up in Ireland is designed to describe and analyse what it means to be a child growing up in Ireland and to understand the factors associated with children’s wellbeing, including those affecting their physical health and development, social, emotional and behavioural wellbeing, and educational achievement and intellectual capacity.
4 The Primary Caregiver is usually the Study Child’s mother. The Secondary Caregiver, where present, is the spouse or partner of the Primary Caregiver and is usually the Study Child’s father.

Growing Up in Ireland • THE LIVES OF 5-YEAR-OLDS
21
Chapter 1 • InTRODucTIOn
While children’s current wellbeing is of immense importance, researchers are also concerned with outcomes in these key areas over time, as children grow and develop. Because Growing Up in Ireland is a longitudinal study following the same children over time, it records information at each wave, which may then be used to understand developmental trajectories and outcomes. The longitudinal data allows the analysis and understanding of child outcomes in the context of information about their lives collected at earlier waves of the study.
To achieve its overarching goal, the study has nine specific objectives:5
1. Describe the lives of Irish children, to establish what is typical and normal as well as what is atypical and problematic
2. Chart the development of Irish children over time, to examine the progress and wellbeing of children at critical periods from birth to adulthood
3. Identify the key factors that, independently of others, most help or hinder children’s development
4. Establish the effects of early child experiences on later life
5. Map dimensions of variation in children’s lives
6. Identify the persistent adverse effects that lead to social disadvantage and exclusion, educational difficulties, ill health and deprivation
7. Obtain children’s views and opinions on their lives
8. Provide a bank of data on the whole child
9. Provide evidence for the creation of effective and responsive policies and services for children and families
1.2 CONCEpTUAL FRAmEwORk
A detailed discussion of the conceptual framework underlying Growing Up in Ireland is available in Greene et al. (2010). In brief, the conceptual framework draws heavily from Bronfenbrenner’s bio-ecological model (e.g. 1979, 1993). This model depicts the child’s relationship to their world as a set of nested and interconnecting environmental systems, all of which influence the developing child, but with varying degrees of directness (Greene, 1994). The individual child is influenced not only by the face-to-face interactions with individuals in their most immediate environment (termed the ‘microsystem’), but by the wider community and circumstances (‘exosystem’ and ‘macrosystem’) that affect the child directly or through effects on the microsystem (‘mesosystem’).
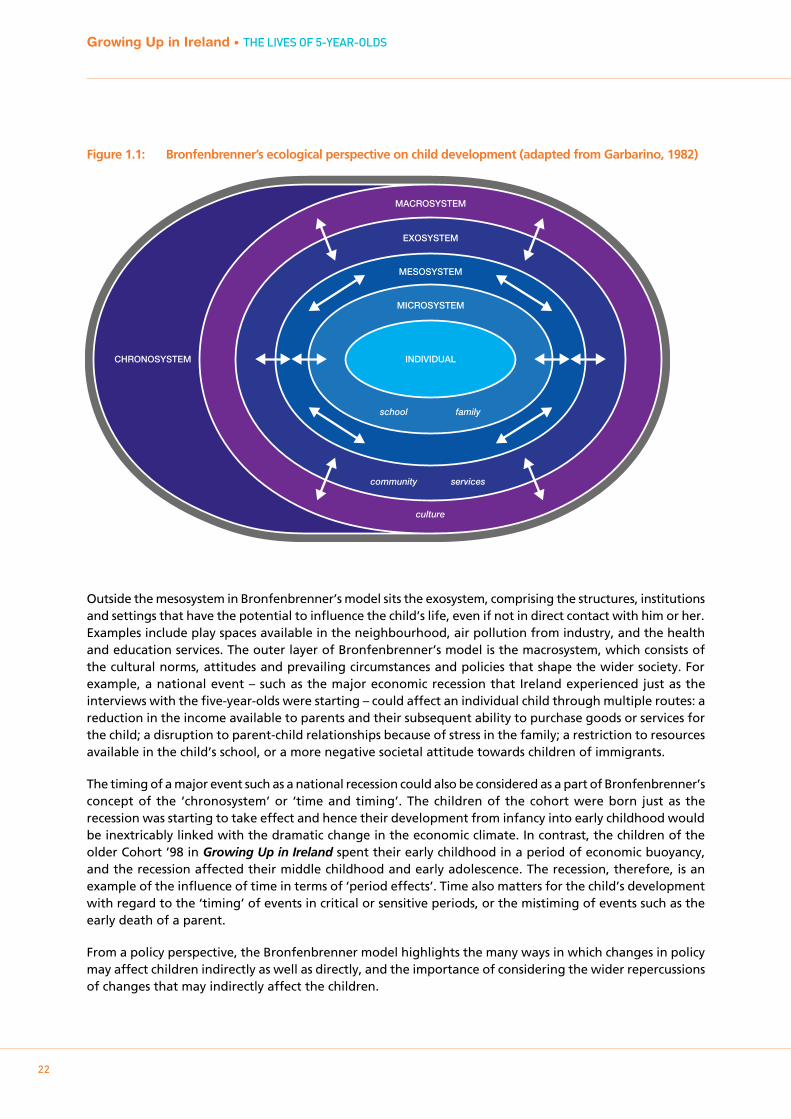
The structure of the bio-ecological framework is illustrated in Figure 1.1. At the core of the framework is the child and their individual characteristics and dispositions. The child is seen as an active agent in the interactions that shape their development; for example, through their own personality, health status and gender. Relationships between the child and people in their microsystem, particularly parents, are critical. Bronfenbrenner’s model, however, recognises that these relationships are affected by other sets of relationships, not only within the household (e.g. the relationship between parents), but also relationships outside the household, such as the school and the workplace. At five years of age, a most important aspect of the mesosystem – the links between actors in the microsystem – is the interactions between the child’s parents and his or her school. Throughout the parent’s interview when the child was five years of age, details were recorded on parental engagement with the school, and communication from the teacher about the child’s progress.
5 Request for Tenders (RFT) for Proposals to Undertake a National Longitudinal Study of Children in the Republic of Ireland, issued by the National Children’s Office of the Department of Health and Children and the Department of Social and Family Affairs, December 2005, p.20.
Growing Up in Ireland • THE LIVES OF 5-YEAR-OLDS
22
Figure 1.1: Bronfenbrenner’s ecological perspective on child development (adapted from Garbarino, 1982)
Outside the mesosystem in Bronfenbrenner’s model sits the exosystem, comprising the structures, institutions and settings that have the potential to influence the child’s life, even if not in direct contact with him or her. Examples include play spaces available in the neighbourhood, air pollution from industry, and the health and education services. The outer layer of Bronfenbrenner’s model is the macrosystem, which consists of the cultural norms, attitudes and prevailing circumstances and policies that shape the wider society. For example, a national event – such as the major economic recession that Ireland experienced just as the interviews with the five-year-olds were starting – could affect an individual child through multiple routes: a reduction in the income available to parents and their subsequent ability to purchase goods or services for the child; a disruption to parent-child relationships because of stress in the family; a restriction to resources available in the child’s school, or a more negative societal attitude towards children of immigrants.
The timing of a major event such as a national recession could also be considered as a part of Bronfenbrenner’s concept of the ‘chronosystem’ or ‘time and timing’. The children of the cohort were born just as the recession was starting to take effect and hence their development from infancy into early childhood would be inextricably linked with the dramatic change in the economic climate. In contrast, the children of the older Cohort ’98 in Growing Up in Ireland spent their early childhood in a period of economic buoyancy, and the recession affected their middle childhood and early adolescence. The recession, therefore, is an example of the influence of time in terms of ‘period effects’. Time also matters for the child’s development with regard to the ‘timing’ of events in critical or sensitive periods, or the mistiming of events such as the early death of a parent.
From a policy perspective, the Bronfenbrenner model highlights the many ways in which changes in policy may affect children indirectly as well as directly, and the importance of considering the wider repercussions of changes that may indirectly affect the children.
MACROSYSTEM
CHRONOSYSTEM
EXOSYSTEM
MESOSYSTEM
MICROSYSTEM
INDIVIDUAL
school family
community services
culture
Chapter 1 • InTRODucTIOn
23
Growing Up in Ireland • THE LIVES OF 5-YEAR-OLDS
The family clearly remains key in the five-year-old’s micro-system. For a substantial proportion of the children, the school has joined the micro-system and largely replaced formal care settings, although some children may still be taking part in formal after-school care. The school, and particularly relationships with teachers and peers, will bring with it a range of new interactions, some of which will be positive, others more negative.
The nature of children’s leisure activities will also start to change from this age, with greater involvement in structured activities (such as sports and music clubs) and potentially more control by the child over the friends with whom they interact.
1.3 FINDINgS FROm COHORT ’08 AT 3 YEARS OF AgE
This report investigates how the Growing Up in Ireland five-year-olds were faring in Ireland in 2013, when the interviews with the children and their Primary Caregivers were carried out. To set it in context and to provide some background to the report, some of the main findings from the descriptive report about these children when they were three-year-olds (Williams et al., 2013) are summarised below.
pHYSICAL HEALTHThree-year-olds were generally in good physical health, though for the minority who experienced ill-health or injury their effects on development could be disruptive, not least in areas such as socio-emotional development and future participation in school.
An area of increasing research interest was the levels of overweight and obesity in early childhood, along with the related topics of diet and activity levels. Using Body Mass Index (BMI), 19% of three-year-olds were classified as overweight, a further 6% were obese and the remaining 75% were non-overweight (Williams et al., 2013).
At three years old, 16% of children were reported to have a longstanding illness, disability or other ongoing health condition. Respiratory illnesses were the most commonly reported; 6% of three-year-olds had received a doctor’s diagnosis of asthma. Boys were significantly more likely than girls to have a health professional’s diagnosis of chronic illness (Williams et al., 2013, p.42).
Accidents or injuries that required hospital treatment were experienced by 16% of three-year-olds, and were more likely among boys (18%) than girls (15%). Socio-demographic variations (including parental employment, educational status and family income) were evident in many of the health trends identified among three-year-olds in the earlier round of the study.
SOCIO-EmOTIONAL wELLbEINg AND bEHAVIOURAt three years of age, the prevalence of socio-emotional and behavioural problems was relatively low overall. On average, children scored quite low on the Strengths and Difficulties Questionnaire (SDQ) in terms of peer, emotional and conduct problems, while scoring quite high in terms of pro-social behaviour. However, the risk of socio-emotional and behavioural problems was strongly associated with socio-demographic and family characteristics, with a higher risk among more socially disadvantaged families. The risk of socio-emotional and behavioural problems at three years was also linked to some measures of parenting, including parental warmth and hostility.
Longitudinal trends in emotional difficulties between nine months and three years of age were also identified; measures of infant temperament at nine months of age were highly predictive of scores in the top decile of the SDQ total difficulties scale at three years of age. Difficult infant temperament at nine months was also associated with elevated levels of parental stress (Williams et al., 2013, p.60).
24
Growing Up in Ireland • THE LIVES OF 5-YEAR-OLDS
pARENTINg AND FAmILY RELATIONSHIpSThe overall picture of parenting and interactions between parent and child was encouraging. The relationships with the Study Children of both Primary and Secondary Caregivers were generally high in warmth and consistency, and low in hostility. Equally, disciplining practices seemed to be largely in line with recommended strategies, such as explaining to the child why their behaviour was wrong, and only rarely included the use of aggressive practices such as smacking. However, the relationship between parental stress and parent-child interactions at three years of age was a source of concern. More highly stressed parents were less warm and consistent, and displayed higher levels of hostility to their infant.
At three years of age, 15% of children were in one-parent families, the remainder in two-parent families. There were changes in family structures between nine months and three years of age. Approximately 2.6% of children had experienced a change from a one- to two-parent family structure, while 2.8% had experienced a change from a two- to one-parent structure. By three years of age, 14% of children had a non-resident parent and, in most instances, high levels of contact were found with non-resident parents at this stage, though for a minority there was no contact at all.
COgNITIVE DEVELOpmENTThere was clear evidence that disadvantages identified from the earliest parent-reported assessments with the children at nine months of age were reflected in speech and language development at three years of age, and also in basic cognitive tests conducted with the children at age three (the Naming Vocabulary and Picture Similarities subscales of the British Abilities Scales). Nearly one in five Primary Caregivers had concerns about their child’s speech and language development at three years of age. Boys were more likely than girls to be reported to have problems.
FAmILY CIRCUmSTANCESAt both nine months and three years of age, substantial variations were found in the financial circumstances of families. One-parent families were the most disadvantaged across the three measures used in the study (income, social class, level of parental educational attainment). Increasing financial stress and difficulties in making ends meet were observed for all family types during the recession. Sizeable minorities of families reported that they had had to reduce family expenditure in fundamental ways between their nine-month and three-year interview, including not being able to pay for basics or being behind with utility bills or rent/mortgage payments. Economic vulnerability (which includes low income, financial stress and household joblessness) at Wave 1 and Wave 2, and persistent economic vulnerability across both waves led to increased risk of socio-emotional and behavioural problems in the children (i.e. an SDQ score in the top decile, see Goodman, 1997) (Watson et al., 2016).
1.4 THE DATA AND mETHODOLOgY
1.4.1 THE SAmpLE AND RESpONSE RATESAs noted, the first interview with Cohort ’08 (at age 9 months) took place between September 2008 and March 2009. The second wave of the study took place (at age 3 years) between January and August 2011. The third wave fieldwork, which provided the data that is the focus of this report, took place between March and September 2013.
Since Growing Up in Ireland is longitudinal in design, the same families have been followed up for interview in successive waves of the study. A total of 11,134 families were successfully interviewed in the first wave. The response rate in that phase was 64.5%. These 11,134 families formed the basis of the sample for the second wave of interviews. Table 1.1 outlines the response rate at that second wave; just over 91% of the base sample of 11,134 participant families from Wave 1 also participated in the second wave.
Chapter 1 • InTRODucTIOn
2525
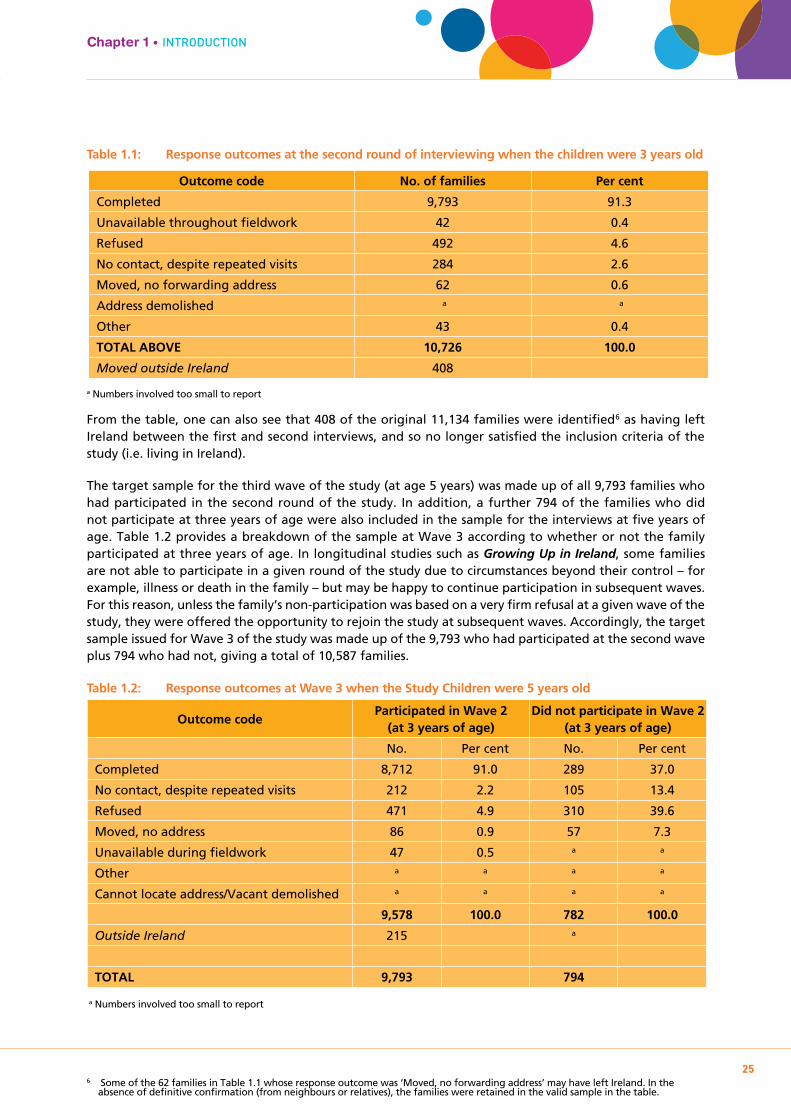
Table 1.1: Response outcomes at the second round of interviewing when the children were 3 years old
a Numbers involved too small to report
From the table, one can also see that 408 of the original 11,134 families were identified6 as having left Ireland between the first and second interviews, and so no longer satisfied the inclusion criteria of the study (i.e. living in Ireland).
The target sample for the third wave of the study (at age 5 years) was made up of all 9,793 families who had participated in the second round of the study. In addition, a further 794 of the families who did not participate at three years of age were also included in the sample for the interviews at five years of age. Table 1.2 provides a breakdown of the sample at Wave 3 according to whether or not the family participated at three years of age. In longitudinal studies such as Growing Up in Ireland, some families are not able to participate in a given round of the study due to circumstances beyond their control – for example, illness or death in the family – but may be happy to continue participation in subsequent waves. For this reason, unless the family’s non-participation was based on a very firm refusal at a given wave of the study, they were offered the opportunity to rejoin the study at subsequent waves. Accordingly, the target sample issued for Wave 3 of the study was made up of the 9,793 who had participated at the second wave plus 794 who had not, giving a total of 10,587 families.
Table 1.2: Response outcomes at Wave 3 when the Study Children were 5 years old
6 Some of the 62 families in Table 1.1 whose response outcome was ‘Moved, no forwarding address’ may have left Ireland. In the absence of definitive confirmation (from neighbours or relatives), the families were retained in the valid sample in the table.
Outcome code No. of families Per cent
Completed 9,793 91.3
Unavailable throughout fieldwork 42 0.4
Refused 492 4.6
No contact, despite repeated visits 284 2.6
Moved, no forwarding address 62 0.6
Address demolished a a
Other 43 0.4
TOTAL ABOVE 10,726 100.0
Moved outside Ireland 408
Outcome codeParticipated in Wave 2
(at 3 years of age)Did not participate in Wave 2
(at 3 years of age)
No. Per cent No. Per cent
Completed 8,712 91.0 289 37.0
No contact, despite repeated visits 212 2.2 105 13.4
Refused 471 4.9 310 39.6
Moved, no address 86 0.9 57 7.3
Unavailable during fieldwork 47 0.5 a a
Other a a a a
Cannot locate address/Vacant demolished a a a a
9,578 100.0 782 100.0
Outside Ireland 215 a
TOTAL 9,793 794
a Numbers involved too small to report
Growing Up in Ireland • THE LIVES OF 5-YEAR-OLDS
26
Of these, 9,001 participated in the study, 87% of the eligible 10,360 families (i.e. excluding those who had moved outside Ireland). Table 1.2 shows that the response rate at Wave 3 was 91% among those who had participated at Wave 2, but much lower among the families who had not participated at Wave 2 (37%). Expressed as a percentage of the 11,134 infants who had participated at nine months of age, the completed sample at age five represents a retention rate of 81%.
1.4.2 REwEIgHTINg THE DATAIn common with all longitudinal studies, attrition between successive waves of Growing Up in Ireland was not random. For example, Watson and Wooden (2009) point out that participation in longitudinal studies is systematically associated with respondent characteristics such as age; sex; race/ethnicity; marital status; household composition and size; educational attainment; labour force status, and family income. As Murray et al. (2015) noted, inter-wave attrition in Growing Up in Ireland was associated with measures of social advantage/disadvantage such as education, income and social class.7 The data contained in this report have been statistically adjusted or ‘reweighted’ to account for differential response and attrition rates according to the family’s background characteristics. This is in line with best international practice in sample surveys and ensures that the data presented are representative of the population under study – in this case five-year-olds resident in Ireland at nine months old and still resident at age five.8 The following characteristics of the family were used to adjust the data prior to analysis:9
• EducationalattainmentofStudyChild’smotherinpreviouswave
• Familystructure/Mother’smaritalstatus(marriedandlivingwithspouse;cohabiting;one-parentfamily) in previous wave
• Mother’sageinpreviouswave
• Regionaldistributionofchildrenbygenderinpreviouswave
• Whetherornotchildwaseverbreastfed
• Mother’sdepressionstatusinpreviouswave
• Mother’sBMIstatusinpreviouswave
• Mother’ssmokingstatusinpreviouswave
• WhetherornotmotherwasborninIreland
• Familyincomequintileinpreviouswave.
1.4.3 INTERpRETINg THE DATA AND pRESENTINg FINDINgSGrowing Up in Ireland is based on what is described as a ‘fixed panel’ design. The design is ‘fixed’ in the sense that the sample includes children who were living in Ireland at nine months of age and who continued to do so at five years. Some five-year-olds, however, came to live in Ireland between the first and third rounds of the survey. They are not included in the sample. On this basis, the sample at the third round of interviewing with Cohort ’08 represents five-year-olds who lived in Ireland when they were nine months of age and who continued to live in the country when they were five years old. It is estimated that 69,000 five-year-olds were living in Ireland at both nine months and five years of age.10
The results reported here come from a sample survey, so that in generalising to all five-year-olds it is necessary to take account of the degree of uncertainty involved, particularly when the number of cases in a Growing Up in Ireland sub-sample is small. To give an idea of the extent of uncertainty, confidence intervals and significance tests are used. For instance, suppose the analysis suggests that a certain percentage of five-year-olds live in two-parent families. The confidence interval is the range within which the ‘true’ population figure would be expected to be found in 95% of samples of this type and size (where 95% is the confidence level that is most often used). It is typically interpreted as the ‘likely range’ for a statistic. A related idea is that of statistical significance. If the confidence intervals for the two figures do not overlap, then, in
7 For details, see: http://www.ucd.ie/t4cms/Summary%20Guide%20%20Infant%20Cohort%20Wave%203.pdf 8 See Section 1.4.3 below for a brief discussion on how to interpret the population in question. 9 A minimum information loss algorithm that adjusts sample totals to column marginal was used (GROSS, Gomulka, J., 1992; 1994). 10 The differences between the longitudinal sample of five-year-olds and the total population of five-year-olds resident in Ireland when
fieldwork was carried out are likely to be small, although the authors point out that there are no data to support this assertion.
Chapter 1 • InTRODucTIOnGrowing Up in Ireland • THE LIVES OF 5-YEAR-OLDS
27
95% of samples of this size and type, a difference this large would not occur by chance. In other words, the difference is ‘statistically significant’. In the figures throughout the report where we focus on group comparisons, error bars are used to indicate the confidence intervals around the estimated percentages. This gives the reader a visual means to assess whether the differences between groups are statistically significant.
Unless explicitly stated, all of the findings and patterns discussed in the text of the report are statistically significant at the 5% level, known as having a p value of <=.05. Because of the size of the Growing Up in Ireland sample, even small differences between two groups can be statistically significant. Throughout the report, the discussion refers not only to whether differences are significant but also to the scale of the difference.
1.4.4 INFORmANTS AND THEIR qUESTIONNAIRESAt five years of age, the main informants were the Study Child and both their Primary and Secondary Caregivers (PCG and SCG).The Study Child completed cognitive tests (the Naming Vocabulary and Picture Similarities subscales of the British Ability Scales (BAS)). The heights and weights of the caregivers and children were also recorded, using medically approved weighing scales and height sticks (stadiometers).11 The home-based interviews were made up of a combination of administered and self-completed questionnaires, completed on a computer laptop.
A questionnaire was also completed by the Study Child’s school principal and teacher, where applicable. These school-based questionnaires were self-completed by the school principal and teacher and were largely administered on a postal basis, with intensive telephone follow-up.
The Principal questionnaire recorded details on the school; its size and the composition of its pupil-base; its resources; management practices, and the principal’s perception of problems the school was encountering at the time of interview. The teacher was asked to complete two questionnaires; the first (the ‘Teacher-on-self’) recorded background details on the teacher’s characteristics, training, qualifications and teaching methods, the second on the Study Child (the ‘Teacher-on-Child’ questionnaire). This second questionnaire recorded detailed information on the child’s social skills and academic performance in the school.
1.4.5 THE TImINg OF FIELDwORkThe timing of fieldwork for the first three rounds of interviews with Cohort ’08 is important and has a major bearing on the environment within which the Study Children were growing up.
From the mid-1990s until 2008, Ireland experienced unprecedented levels of economic growth – the ‘Celtic Tiger’ years. As noted in Watson et al., 2014 (p.21), unemployment fell to a historically low level of 4.4% to 4.7% between 2003 and 2007. The country fell into deep recession in mid-2008. All Study Children in Cohort ’08 were born between December 2007 and June 2008, slightly before the sharp fall in employment. The recession persisted for four years before bottoming out in mid-2012. This meant that the recession was approaching its deepest during the second round of interviewing (between January and August 2011), when the children were three years of age. Recovery started from mid-2012 and was beginning to be felt in some parts and sectors of the country by mid-2013 (when fieldwork with the five-year-olds was taking place). These changes in the economy should be borne in mind when interpreting some of the data presented in the report.
11 The heights of the Primary and Secondary Caregivers were not recorded if they were available from an earlier round of interviewing.

Growing Up in Ireland • THE LIVES OF 5-YEAR-OLDS
28
1.5 DEFINITIONS OF bACkgROUND CHARACTERISTICS USED IN THIS REpORT
In describing some of the key aspects in the lives of five-year-olds and considering how these have changed since the children were nine months of age, much of the discussion in this report is framed by variations in the socio-demographic circumstances of the Study Child’s family. A common set of background characteristics is used throughout the report, similar to those adopted in the comparable reports which described the circumstances of the children at nine months and three years of age. These background characteristics are described briefly below.12
1.5.1 FAmILY SOCIAL CLASS The social class classification used by the (Irish) Central Statistics Office (CSO) was used to assign a social class code to both mother and father (where the latter was resident). This class classification is based on the respondent’s occupation. In line with standard procedures, in two-parent families in which both partners were economically active outside the home, the family’s social class was assigned on the basis of the higher of the two. A fourfold classification of family social class is used throughout this report: Professional/Managerial, Other Non-Manual/Skilled Manual, Semi-skilled/Unskilled Manual and Never Employed. This last group principally refers to families in which there is no history of parental employment outside the home. Families in this group are generally the most socially disadvantaged.
1.5.2 FAmILY INCOmE gROUp To make meaningful comparisons across families in terms of their disposable income, the household size and composition (number of adults and children) were taken into account to create an ‘equivalised’ disposable family income.13 The families were then divided into five equally sized groups, from highest to lowest in terms of their equivalised family income. Each group (or quintile) contains 20% of five-year-olds and their families. Thus, throughout the report the lowest family income quintile refers to the 20% of families at the bottom of the equivalised income distribution. The second lowest income group includes the families in the next 20% of the income distribution and so on, up to the top income quintile which contains the 20% of families with the highest equivalised income.
1.5.3 FAmILY TYpE A fourfold classification of family type, the same as used with Wave 1 data, is used throughout the report:
• One-parent,onechildunder18years
• One-parent,twoormorechildrenunder18years
• Two-parent,onechildunder18years
• Two-parent,twoormorechildrenunder18years
One- and two-parent families refer only to the number of resident caregivers/guardians. The terms do not refer to the relationship of the caregiver to the Study Child. Biological parents and other caregivers are included in the definition of one- or two-parent families although (as will be discussed in subsequent chapters) biological mothers and fathers are overwhelmingly the Primary Caregivers of the children. The term ‘children’ in the classification of family type refers to all children under 18 years of age who were living in the household. These individuals were not necessarily siblings of the Study Child. Any sibling of the five-year-old Study Child who was over 18 years of age and living in the household was not included as a child in this definition.
12 From Williams et al., 2010.13 To do this, the number of ‘equivalised’ adult members who were resident in the household was calculated, by assigning a weight
of 1.0 to the first adult, 0.66 to all subsequent adults (and children over 14 years) and 0.33 to each child (aged 14 years or less). The total number of adult equivalents was then divided into the household’s total disposable income to give the household’s equivalised disposable income.

Chapter 1 • InTRODucTIOnGrowing Up in Ireland • THE LIVES OF 5-YEAR-OLDS
29
1.5.4 HIgHEST LEVEL OF pRImARY CAREgIVER’S EDUCATIONAL ATTAINmENT Much of the international literature points to the important association between a Primary Caregiver’s educational attainment and their child’s development. Throughout the report, a fourfold classification of educational attainment is used, as follows:
• JuniorCertificate(uptolowersecond-level)
• LeavingCertificate(uppersecond-level)
• Diploma/Certificate–apost-second-levelCertificateorDiploma(someofwhichmaybeencompleted in a third-level institution), below degree level
• Degree(includingpost-graduatequalificationsandMaster’s/PhDdegrees)
The key scales used as outcomes in the report are presented in the appendix.
1.6 STRUCTURE OF REpORT
This report contains six subsequent chapters. These address the main outcome domains that are the focus of the project. Each chapter considers the circumstances and relationships of the five-year-olds and how these affect their development, in the broad context of the bio-ecological conceptual model which underlies the project.
Chapter Two provides important contextual information for the understanding of child outcomes in later chapters. It describes the changes over time in the family background of the Study Children and any changes in their socio-economic circumstances. In light of the important changes experienced by families over recent years, it also provides details on the financial stresses facing families interviewed when the children were five years of age. While later chapters focus directly on child outcomes, and how they vary by family socio-economic and demographic characteristics, this chapter focuses on understanding how these socio-economic and demographic characteristics themselves changed over time.
Chapter Three describes the child’s physical health at five years of age and how it has changed since infancy. This includes a discussion of longstanding illnesses and injuries; height, weight and Body Mass Index (BMI); calorific intake and diet; level of GP consultations, and use of antibiotics.
Chapter Four considers the five-year-old’s socio-emotional and behavioural wellbeing. It focuses on the child’s scores on the Strengths and Difficulties Questionnaire, as returned by both the Primary Caregiver and (where relevant) the child’s teacher, and other indicators of socio-emotional wellbeing. Trends in potential socio-emotional or behavioural difficulties since birth are considered. Aspects of play and activities are described, including screen-time and its association with child weight status.
Chapter Five examines parenting and family relationships, including aspects of the parent-child relationship; parenting behaviours and styles; discipline strategies used in the home; parental stress, and family activities undertaken with the five-year-old.
Chapter Six describes the Study Child’s schooling and cognitive development. Topics considered include preparations for making the transition to school; school readiness; the five-year-old’s adjustment to school, and their cognitive development, both as recorded by their teacher and also as directly measured in the home as part of the interview process (using the British Ability Scales (BAS) subscales of Naming Vocabulary and Picture Similarities).
Finally, Chapter Seven provides a brief summary of the main findings on five-year-olds and their families and the implications of the findings for policy.

30
Growing Up in Ireland • THE LIVES OF 5-YEAR-OLDS

31
FAmILY cHARAcTERISTIcS AnD FInAncIAL cIRcumSTAncES
Chapter 2
Growing Up in Ireland • THE LIVES OF 5-YEAR-OLDS
32
2.1 INTRODUCTION
This chapter considers the characteristics of the five-year-old’s family, and how these have changed since the first interviews took place at nine months of age. It explores the characteristics of five-year-olds’ Primary Caregivers, their age, gender, relationship to the child and economic status, and how these characteristics have changed over recent years. As noted in Chapter 1, unless explicitly stated, all of the findings and patterns discussed in the text of this chapter are statistically significant at the 5% level.
The family is a key component of the child’s microsystem, as outlined in Bronfenbrenner’s bio-ecological model (1979), which underlies Growing Up in Ireland. The family represents the innermost and most directly impactful of the numerous systems that affect a child’s development at this age. Family structure and the economic status of the child’s Primary Caregivers are critical to the resources available to the family and its overall financial wellbeing. These in turn have a major bearing on children’s physical, emotional and mental health, as well as their learning and cognitive development (Luby et al., 2013; Burke et al., 2011). A major focus of research in this area over several decades has been the immediate and longer-term implications for a child’s growth and development of growing up in poverty (especially persistent poverty – e.g. Duncan and Brooks-Gunn, 1997; Duncan, 2010). Another key area of discussion has been around the idea of critical periods and timing of disruptions such as poverty. For example, in Growing Up in Ireland it will be possible to contrast the effects of the recession (circa 2008-13) on the younger Cohort ’08 with the older Cohort ’98. Some summary information has also been published comparing outcomes for Cohort ’08 at age nine to those of Cohort ’98 at age nine a decade earlier (Growing Up in Ireland Study Team, 2018 a, b, c and d).
Using the first two rounds of data from both Cohort ’98 and Cohort ’08 of Growing Up in Ireland, Watson et al. (2014) considered the prevalence of economic vulnerability among families and the relationship between economic vulnerability and children’s socio-emotional wellbeing. Similarly, Williams et al. (2013) noted that the mechanisms through which changing family structures and the financial wellbeing of families may affect a child’s outcomes are varied and complex. Some are more direct; for example, the level of financial and related resources available to the immediate family may result in difficulty in affording basics such as adequate food, clothing and heating for the home. Others are indirect, often mediated through the amount and quality of time available to the family; the quality of nutrition; nature of non-parental childcare; parental health; access to childcare; neighbourhood quality, and perhaps the financial stress levels of the parents.
2.2 CHARACTERISTICS OF THE FAmILIES AND pARENTS OF 5-YEAR-OLDS
A number of important aspects of child outcomes and wellbeing have been shown to be related to changing family structures. Cavanagh et al. (2008), Cavanagh and Huston (2006) and Fomby and Cherlin (2007) all note, for example, that children’s socio-emotional, behavioural and health outcomes are often related to relationship transitions and changing family structures. In understanding variations in the developmental outcomes of children in Ireland at five years of age, it is instructive to understand variation in the background characteristics of their families and, in particular, how the socio-demographics of different family types may vary, especially between one- and two-parent families (Hannan and Halpin, 2014).
2.2.1 THE DEmOgRApHIC CHARACTERISTICS OF THE pARENTS OF 5-YEAR-OLDSTable 2.1 summarises demographic details on the five-year-old’s Primary and Secondary Caregivers. The Primary Caregiver (PCG) was self-identified by the family as the person who was most knowledgeable about, and who provided most care to, the Study Child. The Secondary Caregiver (SCG) was his/her resident spouse/partner.
Almost all (98%) of the Primary Caregivers were female, and nearly exclusively the Study Child’s biological mother. On average, the PCG was just over 36 years of age when the child was five years old, with 80% having been themselves born in Ireland. Eighty-six per cent of five-year-olds lived in two-parent families,
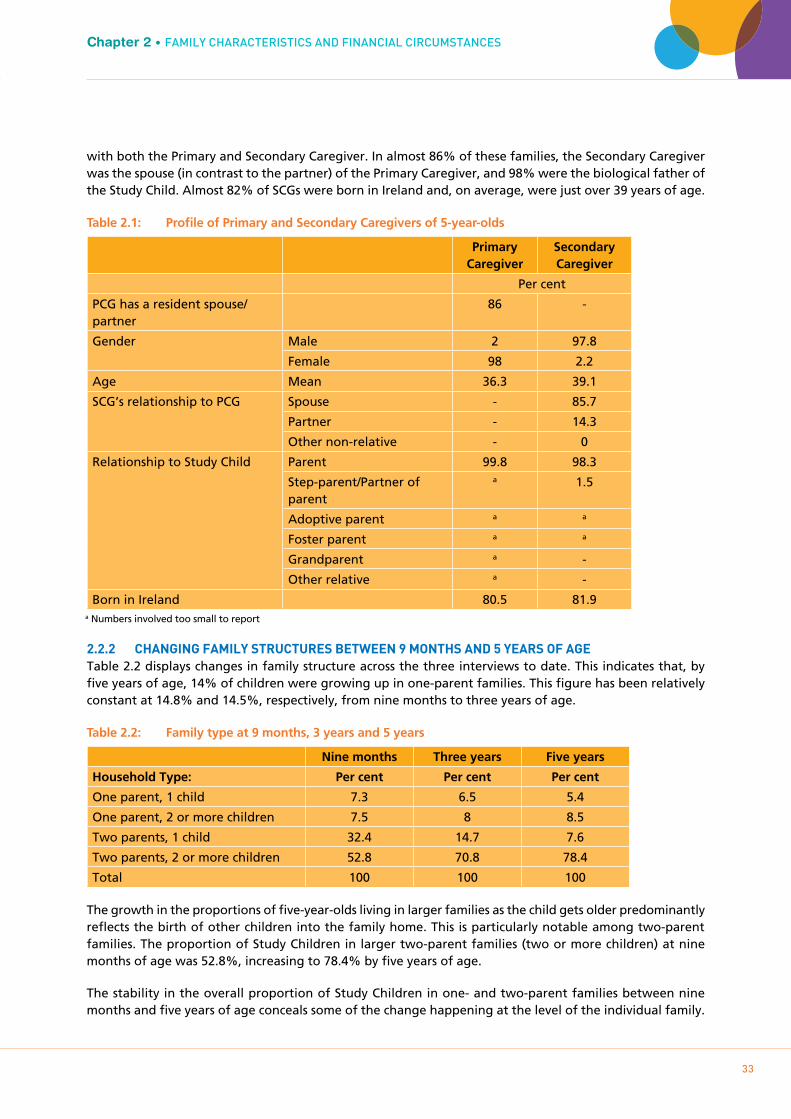
Growing Up in Ireland • THE LIVES OF 5-YEAR-OLDS
33
Chapter 2 • FAmILY cHARAcTERISTIcS AnD FInAncIAL cIRcumSTAncES
with both the Primary and Secondary Caregiver. In almost 86% of these families, the Secondary Caregiver was the spouse (in contrast to the partner) of the Primary Caregiver, and 98% were the biological father of the Study Child. Almost 82% of SCGs were born in Ireland and, on average, were just over 39 years of age.
Table 2.1: Profile of Primary and Secondary Caregivers of 5-year-olds
Primary Caregiver
Secondary Caregiver
Per cent
PCG has a resident spouse/partner
86 -
Gender Male 2 97.8
Female 98 2.2
Age Mean 36.3 39.1
SCG’s relationship to PCG Spouse - 85.7
Partner - 14.3
Other non-relative - 0
Relationship to Study Child Parent 99.8 98.3
Step-parent/Partner of parent
a 1.5
Adoptive parent a a
Foster parent a a
Grandparent a -
Other relative a -
Born in Ireland 80.5 81.9
2.2.2 CHANgINg FAmILY STRUCTURES bETwEEN 9 mONTHS AND 5 YEARS OF AgETable 2.2 displays changes in family structure across the three interviews to date. This indicates that, by five years of age, 14% of children were growing up in one-parent families. This figure has been relatively constant at 14.8% and 14.5%, respectively, from nine months to three years of age.
Table 2.2: Family type at 9 months, 3 years and 5 years
Nine months Three years Five years
Household Type: Per cent Per cent Per cent
One parent, 1 child 7.3 6.5 5.4
One parent, 2 or more children 7.5 8 8.5
Two parents, 1 child 32.4 14.7 7.6
Two parents, 2 or more children 52.8 70.8 78.4
Total 100 100 100
The growth in the proportions of five-year-olds living in larger families as the child gets older predominantly reflects the birth of other children into the family home. This is particularly notable among two-parent families. The proportion of Study Children in larger two-parent families (two or more children) at nine months of age was 52.8%, increasing to 78.4% by five years of age.
The stability in the overall proportion of Study Children in one- and two-parent families between nine months and five years of age conceals some of the change happening at the level of the individual family.
a Numbers involved too small to report
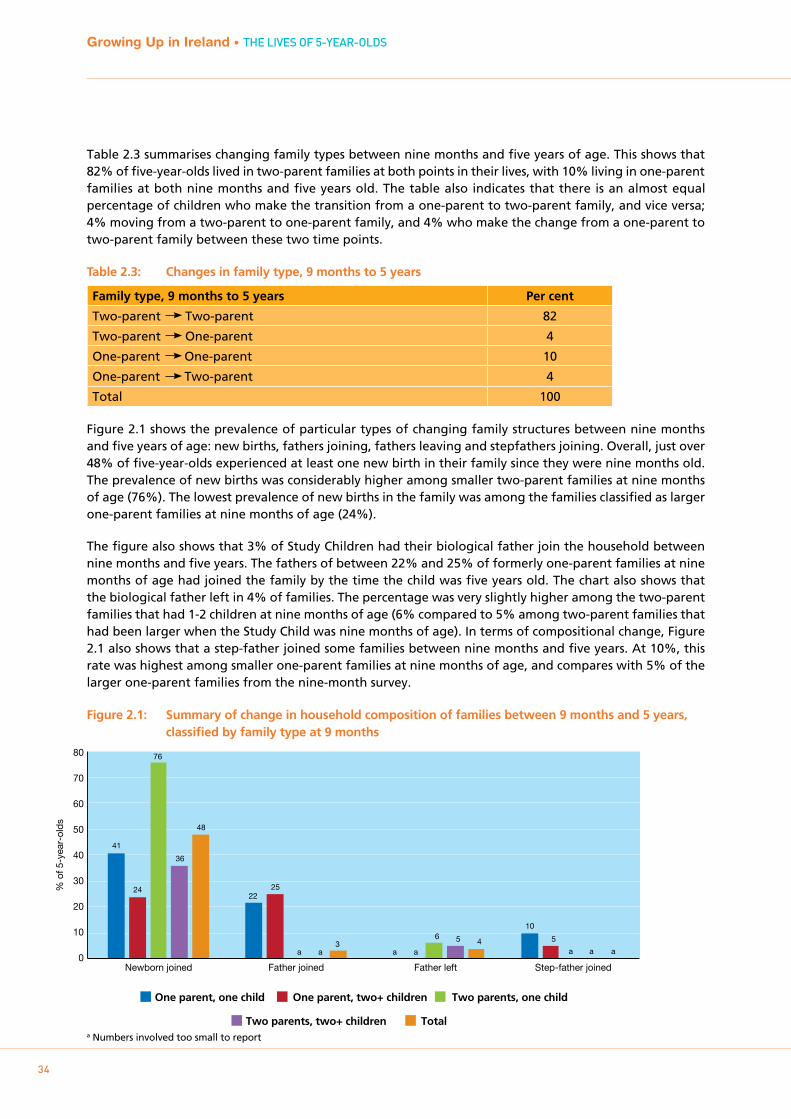
Growing Up in Ireland • THE LIVES OF 5-YEAR-OLDS
34
Table 2.3 summarises changing family types between nine months and five years of age. This shows that 82% of five-year-olds lived in two-parent families at both points in their lives, with 10% living in one-parent families at both nine months and five years old. The table also indicates that there is an almost equal percentage of children who make the transition from a one-parent to two-parent family, and vice versa; 4% moving from a two-parent to one-parent family, and 4% who make the change from a one-parent to two-parent family between these two time points.
Table 2.3: Changes in family type, 9 months to 5 years
Family type, 9 months to 5 years Per cent
Two-parent Two-parent 82
Two-parent One-parent 4
One-parent One-parent 10
One-parent Two-parent 4
Total 100
Figure 2.1 shows the prevalence of particular types of changing family structures between nine months and five years of age: new births, fathers joining, fathers leaving and stepfathers joining. Overall, just over 48% of five-year-olds experienced at least one new birth in their family since they were nine months old. The prevalence of new births was considerably higher among smaller two-parent families at nine months of age (76%). The lowest prevalence of new births in the family was among the families classified as larger one-parent families at nine months of age (24%).
The figure also shows that 3% of Study Children had their biological father join the household between nine months and five years. The fathers of between 22% and 25% of formerly one-parent families at nine months of age had joined the family by the time the child was five years old. The chart also shows that the biological father left in 4% of families. The percentage was very slightly higher among the two-parent families that had 1-2 children at nine months of age (6% compared to 5% among two-parent families that had been larger when the Study Child was nine months of age). In terms of compositional change, Figure 2.1 also shows that a step-father joined some families between nine months and five years. At 10%, this rate was highest among smaller one-parent families at nine months of age, and compares with 5% of the larger one-parent families from the nine-month survey.
Figure 2.1: Summary of change in household composition of families between 9 months and 5 years, classified by family type at 9 months
% o
f 5-y
ear-
olds
80
70
60
50
40
30
20
10
0
One parent, one child One parent, two+ children
Two parents, two+ children Total
Two parents, one child
Newborn joined Father joined Father left Step-father joined
41
22
a
10
24 25
a a a a
5
76
a
6
36
a
5
48
3 4
a Numbers involved too small to report
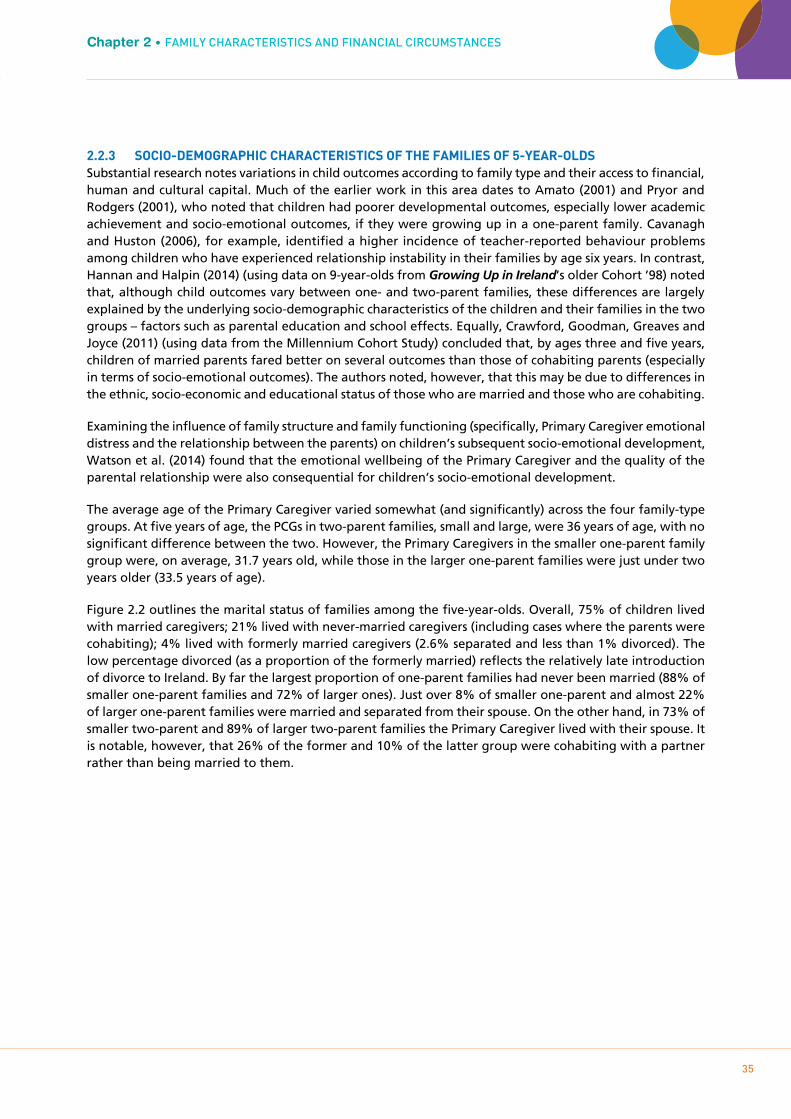
Growing Up in Ireland • THE LIVES OF 5-YEAR-OLDS
35
Chapter 2 • FAmILY cHARAcTERISTIcS AnD FInAncIAL cIRcumSTAncES
2.2.3 SOCIO-DEmOgRApHIC CHARACTERISTICS OF THE FAmILIES OF 5-YEAR-OLDSSubstantial research notes variations in child outcomes according to family type and their access to financial, human and cultural capital. Much of the earlier work in this area dates to Amato (2001) and Pryor and Rodgers (2001), who noted that children had poorer developmental outcomes, especially lower academic achievement and socio-emotional outcomes, if they were growing up in a one-parent family. Cavanagh and Huston (2006), for example, identified a higher incidence of teacher-reported behaviour problems among children who have experienced relationship instability in their families by age six years. In contrast, Hannan and Halpin (2014) (using data on 9-year-olds from Growing Up in Ireland’s older Cohort ’98) noted that, although child outcomes vary between one- and two-parent families, these differences are largely explained by the underlying socio-demographic characteristics of the children and their families in the two groups – factors such as parental education and school effects. Equally, Crawford, Goodman, Greaves and Joyce (2011) (using data from the Millennium Cohort Study) concluded that, by ages three and five years, children of married parents fared better on several outcomes than those of cohabiting parents (especially in terms of socio-emotional outcomes). The authors noted, however, that this may be due to differences in the ethnic, socio-economic and educational status of those who are married and those who are cohabiting.
Examining the influence of family structure and family functioning (specifically, Primary Caregiver emotional distress and the relationship between the parents) on children’s subsequent socio-emotional development, Watson et al. (2014) found that the emotional wellbeing of the Primary Caregiver and the quality of the parental relationship were also consequential for children’s socio-emotional development.
The average age of the Primary Caregiver varied somewhat (and significantly) across the four family-type groups. At five years of age, the PCGs in two-parent families, small and large, were 36 years of age, with no significant difference between the two. However, the Primary Caregivers in the smaller one-parent family group were, on average, 31.7 years old, while those in the larger one-parent families were just under two years older (33.5 years of age).
Figure 2.2 outlines the marital status of families among the five-year-olds. Overall, 75% of children lived with married caregivers; 21% lived with never-married caregivers (including cases where the parents were cohabiting); 4% lived with formerly married caregivers (2.6% separated and less than 1% divorced). The low percentage divorced (as a proportion of the formerly married) reflects the relatively late introduction of divorce to Ireland. By far the largest proportion of one-parent families had never been married (88% of smaller one-parent families and 72% of larger ones). Just over 8% of smaller one-parent and almost 22% of larger one-parent families were married and separated from their spouse. On the other hand, in 73% of smaller two-parent and 89% of larger two-parent families the Primary Caregiver lived with their spouse. It is notable, however, that 26% of the former and 10% of the latter group were cohabiting with a partner rather than being married to them.
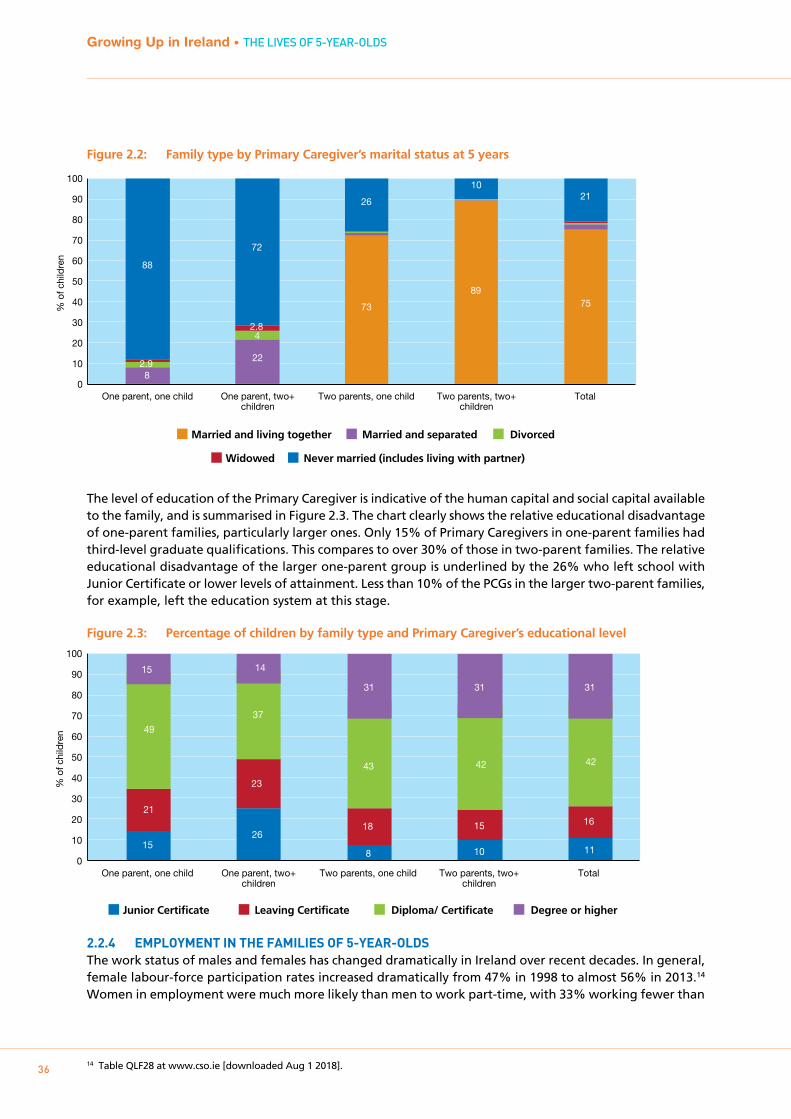
Growing Up in Ireland • THE LIVES OF 5-YEAR-OLDS
36
Figure 2.2: Family type by Primary Caregiver’s marital status at 5 years
The level of education of the Primary Caregiver is indicative of the human capital and social capital available to the family, and is summarised in Figure 2.3. The chart clearly shows the relative educational disadvantage of one-parent families, particularly larger ones. Only 15% of Primary Caregivers in one-parent families had third-level graduate qualifications. This compares to over 30% of those in two-parent families. The relative educational disadvantage of the larger one-parent group is underlined by the 26% who left school with Junior Certificate or lower levels of attainment. Less than 10% of the PCGs in the larger two-parent families, for example, left the education system at this stage.
Figure 2.3: Percentage of children by family type and Primary Caregiver’s educational level
2.2.4 EmpLOYmENT IN THE FAmILIES OF 5-YEAR-OLDSThe work status of males and females has changed dramatically in Ireland over recent decades. In general, female labour-force participation rates increased dramatically from 47% in 1998 to almost 56% in 2013.14
Women in employment were much more likely than men to work part-time, with 33% working fewer than
14 Table QLF28 at www.cso.ie [downloaded Aug 1 2018].
Married and living together Married and separated
Widowed Never married (includes living with partner)
Divorced
One parent, one child One parent, two+ children
Two parents, one child Two parents, two+ children
Total
14
18
24
44
% o
f chi
ldre
n
0
10
20
30
40
50
60
70
80
90
100
73
89 75
8
22 2.9
4 2.8
88
72
26
10 21
One parent, one child One parent, two+ children
Two parents, one child Two parents, two+ children
Total
% o
f chi
ldre
n
0
10
20
30
40
50
60
70
80
90
100
Junior Certificate Leaving Certificate Diploma/ Certificate Degree or higher
1526
8 10 11
21
23
18 15 16
49
37
43 42 42
15 14
31 31 31
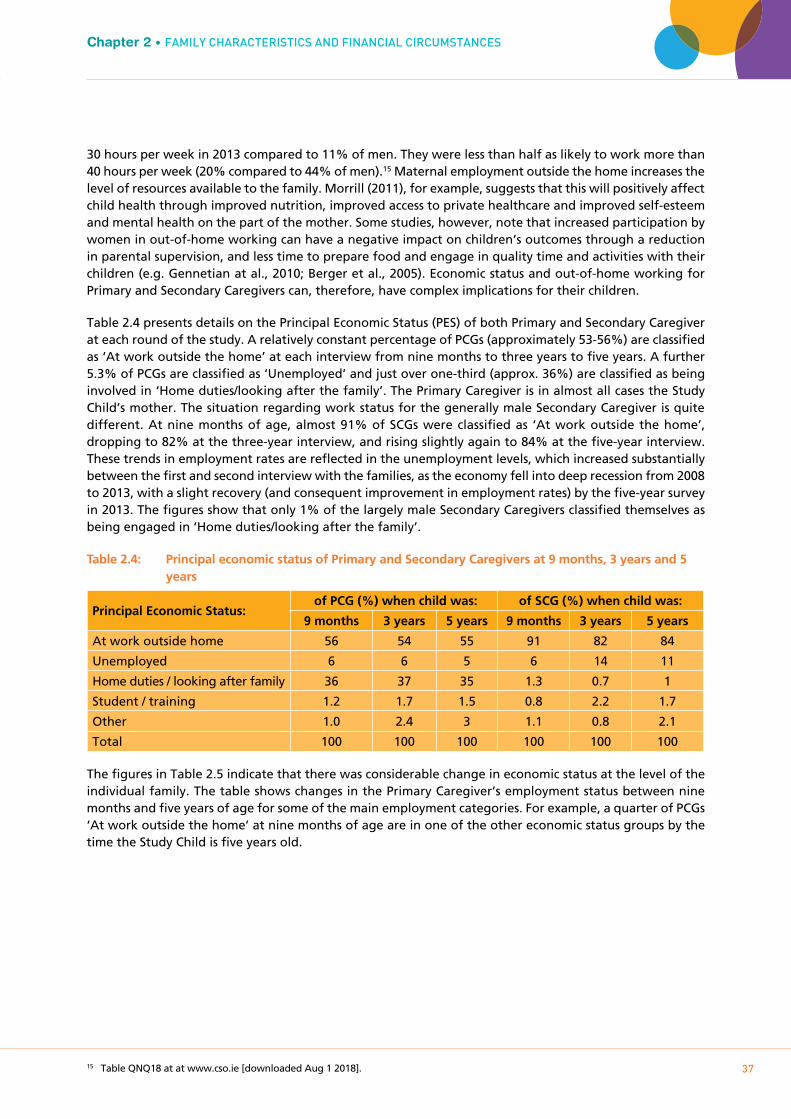
Growing Up in Ireland • THE LIVES OF 5-YEAR-OLDS
37
Chapter 2 • FAmILY cHARAcTERISTIcS AnD FInAncIAL cIRcumSTAncES
30 hours per week in 2013 compared to 11% of men. They were less than half as likely to work more than 40 hours per week (20% compared to 44% of men).15 Maternal employment outside the home increases the level of resources available to the family. Morrill (2011), for example, suggests that this will positively affect child health through improved nutrition, improved access to private healthcare and improved self-esteem and mental health on the part of the mother. Some studies, however, note that increased participation by women in out-of-home working can have a negative impact on children’s outcomes through a reduction in parental supervision, and less time to prepare food and engage in quality time and activities with their children (e.g. Gennetian at al., 2010; Berger et al., 2005). Economic status and out-of-home working for Primary and Secondary Caregivers can, therefore, have complex implications for their children.
Table 2.4 presents details on the Principal Economic Status (PES) of both Primary and Secondary Caregiver at each round of the study. A relatively constant percentage of PCGs (approximately 53-56%) are classified as ‘At work outside the home’ at each interview from nine months to three years to five years. A further 5.3% of PCGs are classified as ‘Unemployed’ and just over one-third (approx. 36%) are classified as being involved in ‘Home duties/looking after the family’. The Primary Caregiver is in almost all cases the Study Child’s mother. The situation regarding work status for the generally male Secondary Caregiver is quite different. At nine months of age, almost 91% of SCGs were classified as ‘At work outside the home’, dropping to 82% at the three-year interview, and rising slightly again to 84% at the five-year interview. These trends in employment rates are reflected in the unemployment levels, which increased substantially between the first and second interview with the families, as the economy fell into deep recession from 2008 to 2013, with a slight recovery (and consequent improvement in employment rates) by the five-year survey in 2013. The figures show that only 1% of the largely male Secondary Caregivers classified themselves as being engaged in ‘Home duties/looking after the family’.
Table 2.4: Principal economic status of Primary and Secondary Caregivers at 9 months, 3 years and 5 years
Principal Economic Status: of PCG (%) when child was: of SCG (%) when child was:
9 months 3 years 5 years 9 months 3 years 5 years
At work outside home 56 54 55 91 82 84
Unemployed 6 6 5 6 14 11
Home duties / looking after family 36 37 35 1.3 0.7 1
Student / training 1.2 1.7 1.5 0.8 2.2 1.7
Other 1.0 2.4 3 1.1 0.8 2.1
Total 100 100 100 100 100 100
The figures in Table 2.5 indicate that there was considerable change in economic status at the level of the individual family. The table shows changes in the Primary Caregiver’s employment status between nine months and five years of age for some of the main employment categories. For example, a quarter of PCGs ‘At work outside the home’ at nine months of age are in one of the other economic status groups by the time the Study Child is five years old.
15 Table QNQ18 at at www.cso.ie [downloaded Aug 1 2018].

Growing Up in Ireland • THE LIVES OF 5-YEAR-OLDS
38
Table 2.5: Principal economic status of Primary Caregiver (PCG) by age of child (9 months and 5 years old)
PCG PES at 5 years of age (%) Per cent at 9
monthsPrincipal Economic Status of PCG at Wave 1, (9-month)
At work outside home
Unemployed Home duties / look after
family
Student / training
Other Total
At work outside home
76 4 16 1.0 2.7 100 56
Unemployed 39 a 41 a a 100 6
Home duties / looking after family
25 5 65 1.6 3 100 36
Total 55 5 35 1.5 3 100 100
a Numbers involved too small to report.
Between the ages of nine months and five years, there were changes in work status. A large proportion of this change is from employment outside the home to ‘Home duties/looking after the family’. Similarly, there is a substantial movement out of unemployment at nine months to another economic status by five years of age. Just over 39% of those who were ‘Unemployed’ when the Study Child was nine months of age (5.5% of all PCGs) were still unemployed when s/he was five years old. More than 41% of those who were unemployed at nine months classified themselves as ‘Home duties/looking after the family’ by the time the child was five years old. Finally, it is clear that there is also substantial movement out of ‘Home duties/looking after the family’ over the four years between the first and third interview with the families – 65% are included in the ‘Home duties’ category at both interviews. However, almost a quarter of those engaged in ‘Home duties’ at nine months of age are ‘At work outside the home’ by the time the child is five years old.
Table 2.6 provides details on the distribution of five-year-olds’ Primary Caregivers according to the number of hours worked outside the home. The average weekly hours worked outside the home among those who undertake any such work is 29 hours. The table indicates that one-quarter of five-year-olds’ Primary Caregivers worked outside the home for more than 30 hours per week.
Table 2.6: Average number of hours worked outside the home by Primary Caregiver of 5-year-old
Number of hours per week worked by PCG: Per cent
None 46
0 to 10 hours 2.7
11 to 20 hours 13
21 to 30 hours 14
31 to 40 hours 20
40+ hours 5
Total 100
Average weekly total 29 hours
Figures 2.4a and 2.4b outline the main economic status of Primary Caregivers (PCG), classified according to highest level of educational attainment and family type. The figures clearly show a strong relationship between out-of-home working and educational attainment: 75% among PCGs with third-level education
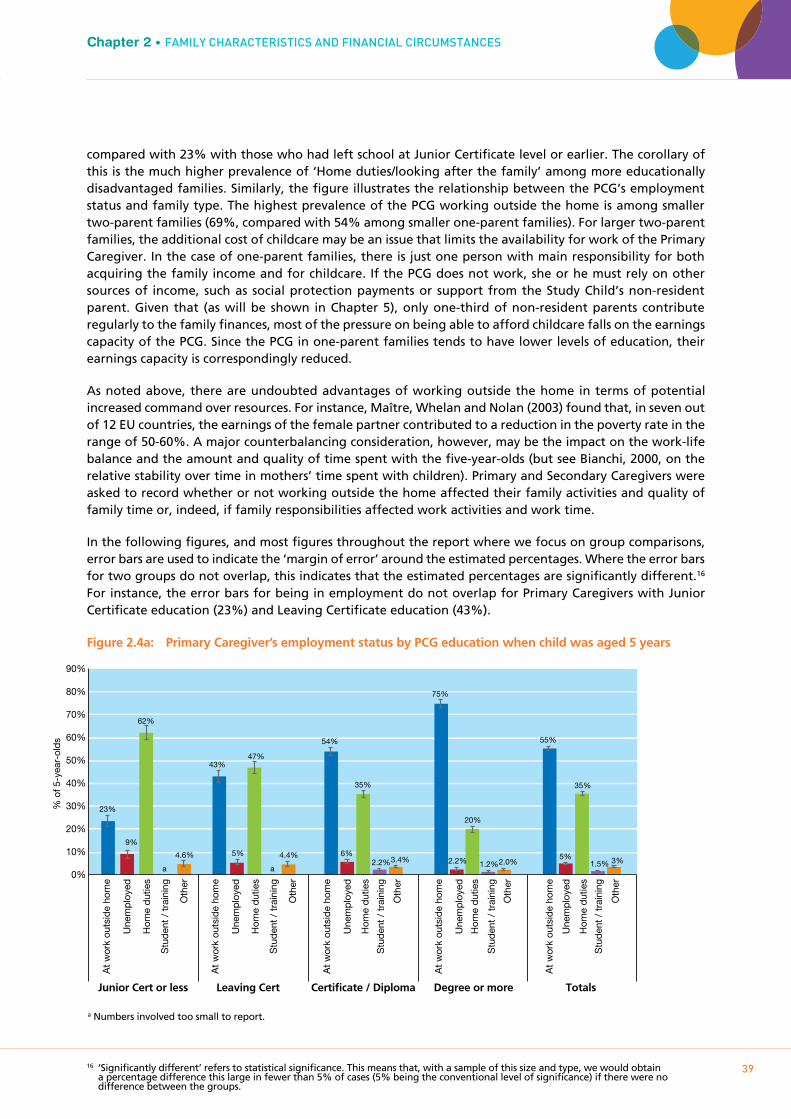
Growing Up in Ireland • THE LIVES OF 5-YEAR-OLDS
39
Chapter 2 • FAmILY cHARAcTERISTIcS AnD FInAncIAL cIRcumSTAncES
compared with 23% with those who had left school at Junior Certificate level or earlier. The corollary of this is the much higher prevalence of ‘Home duties/looking after the family’ among more educationally disadvantaged families. Similarly, the figure illustrates the relationship between the PCG’s employment status and family type. The highest prevalence of the PCG working outside the home is among smaller two-parent families (69%, compared with 54% among smaller one-parent families). For larger two-parent families, the additional cost of childcare may be an issue that limits the availability for work of the Primary Caregiver. In the case of one-parent families, there is just one person with main responsibility for both acquiring the family income and for childcare. If the PCG does not work, she or he must rely on other sources of income, such as social protection payments or support from the Study Child’s non-resident parent. Given that (as will be shown in Chapter 5), only one-third of non-resident parents contribute regularly to the family finances, most of the pressure on being able to afford childcare falls on the earnings capacity of the PCG. Since the PCG in one-parent families tends to have lower levels of education, their earnings capacity is correspondingly reduced.
As noted above, there are undoubted advantages of working outside the home in terms of potential increased command over resources. For instance, Maître, Whelan and Nolan (2003) found that, in seven out of 12 EU countries, the earnings of the female partner contributed to a reduction in the poverty rate in the range of 50-60%. A major counterbalancing consideration, however, may be the impact on the work-life balance and the amount and quality of time spent with the five-year-olds (but see Bianchi, 2000, on the relative stability over time in mothers’ time spent with children). Primary and Secondary Caregivers were asked to record whether or not working outside the home affected their family activities and quality of family time or, indeed, if family responsibilities affected work activities and work time.
In the following figures, and most figures throughout the report where we focus on group comparisons, error bars are used to indicate the ‘margin of error’ around the estimated percentages. Where the error bars for two groups do not overlap, this indicates that the estimated percentages are significantly different.16 For instance, the error bars for being in employment do not overlap for Primary Caregivers with Junior Certificate education (23%) and Leaving Certificate education (43%).
Figure 2.4a: Primary Caregiver’s employment status by PCG education when child was aged 5 years
16 ‘Significantly different’ refers to statistical significance. This means that, with a sample of this size and type, we would obtain a percentage difference this large in fewer than 5% of cases (5% being the conventional level of significance) if there were no difference between the groups.
% o
f 5-y
ear-
olds
0%
10%
20%
30%
40%
50%
60%
70%
80%
90%
23%
9%
62%
a a
4.6%
43%
5%
47%
4.4%
54%
6%
35%
2.2% 3.4%
75%
2.2%
20%
1.2% 2.0%
55%
5%
35%
1.5% 3%
At
wor
k ou
tsid
e ho
me
Une
mp
loye
d
Hom
e d
utie
s
Stu
den
t /
trai
ning
Oth
er
At
wor
k ou
tsid
e ho
me
Une
mp
loye
d
Hom
e d
utie
s
Stu
den
t /
trai
ning
Oth
er
At
wor
k ou
tsid
e ho
me
Une
mp
loye
d
Hom
e d
utie
s
Stu
den
t /
trai
ning
Oth
er
At
wor
k ou
tsid
e ho
me
Une
mp
loye
d
Hom
e d
utie
s
Stu
den
t /
trai
ning
Oth
er
At
wor
k ou
tsid
e ho
me
Une
mp
loye
d
Hom
e d
utie
s
Stu
den
t /
trai
ning
Oth
er
Junior Cert or less Leaving Cert Certificate / Diploma Degree or more Totals
a Numbers involved too small to report.

Growing Up in Ireland • THE LIVES OF 5-YEAR-OLDS
40
Figure 2.4b: Primary Caregiver employment status by family type when child was aged 5 years
The results (based only on the 55% of PCGs and 84% of SCGs who recorded that their principal economic status was working outside the home) are summarised in Table 2.7. It is clear that substantial proportions of Primary (46%) and Secondary Caregivers (54%) who worked outside the home ‘agreed’ or ‘strongly agreed’ that they had missed out on family time because of work responsibilities. Equally, over one-third of both groups felt that the family time they had was less enjoyable because of work responsibilities. The table also indicates that almost 28% of Primary Caregivers and 20% of Secondary Caregivers ‘agreed’ or ‘strongly agreed’ that, because of family responsibilities, they had had to turn down work activities, while 28% of Primary Caregivers and 20% of Secondary Caregivers felt that work was less enjoyable and more pressured because of their family responsibilities.
Table 2.7: Work/life balance of Primary and Secondary Caregivers when the Study Child was 5 years old
Strongly disagree
(%)
Disagree(%)
Neither agree nor
disagree (%)
Agree(%)
Strongly agree(%)
Total(%)
Because of work responsibilities, you missed out on family activities
Primary Caregiver 18 29 7 31 15 100
Secondary Caregiver 13 23 9 35 19 100
Because of work responsibilities, family time is less enjoyable
Primary Caregiver 18 34 11 27 10 100
Secondary Caregiver 17 37 13 25 9 100
Because of family responsibilities, you have to turn down work activities or opportunities
Primary Caregiver 21 41 9 22 6 100
Secondary Caregiver 24 45 11 16 3 100
Because of family responsibilities, work is less enjoyable and more pressured
Primary Caregiver 19 43 11 22 6 100
Secondary Caregiver 21 45 13 17 4 100
% o
f 5-y
ear-
olds
At
wor
k ou
tsid
e ho
me
Une
mp
loye
d
Hom
e d
utie
s
Stu
den
t /
trai
ning
Oth
er
At
wor
k ou
tsid
e ho
me
Une
mp
loye
d
Hom
e d
utie
s
Stu
den
t /
trai
ning
Oth
er
At
wor
k ou
tsid
e ho
me
Une
mp
loye
d
Hom
e d
utie
s
Stu
den
t /
trai
ning
Oth
er
At
wor
k ou
tsid
e ho
me
Une
mp
loye
d
Hom
e d
utie
s
Stu
den
t /
trai
ning
Oth
er 0%
10%
20%
30%
40%
50%
60%
70%
80%
54%
12%
22%
7% 5%
38%
11%
45%
3% 4%
69%
4%
21%
1.2% 5%
56%
4%
37%
1.0% 2.9%
One parent, one child One parent, two+ children Two parents, one child Two parents, two+ children
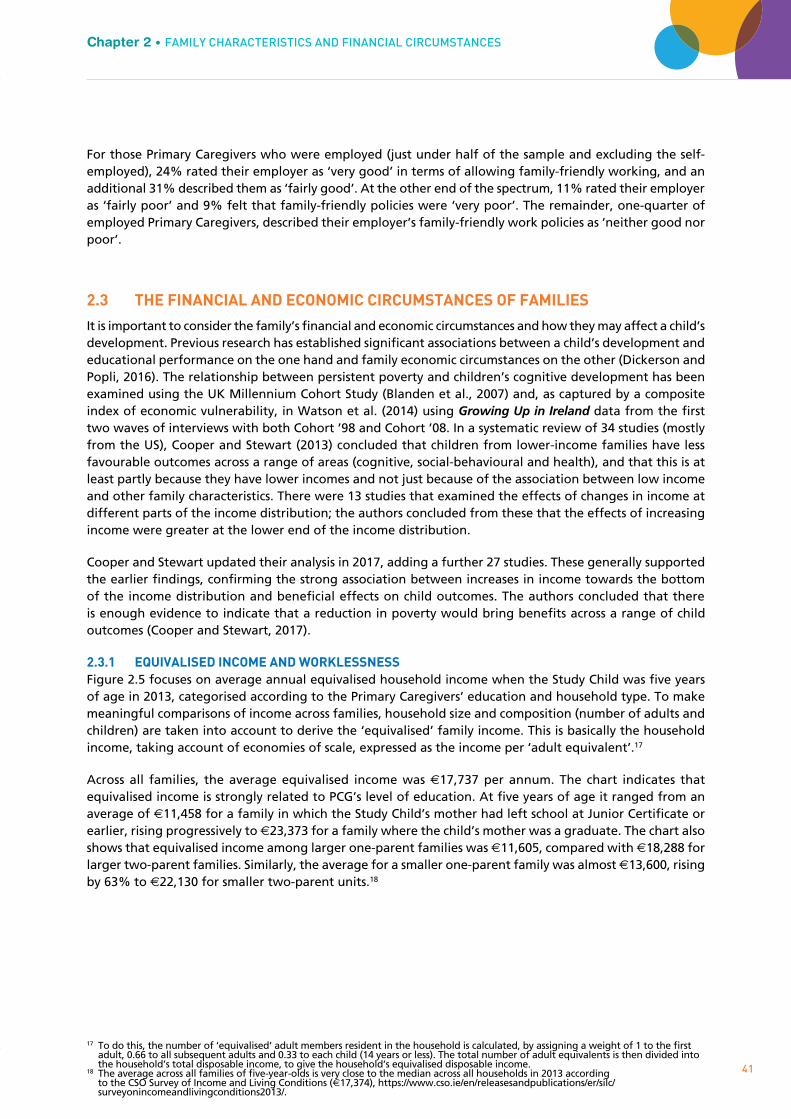
Growing Up in Ireland • THE LIVES OF 5-YEAR-OLDS
41
Chapter 2 • FAmILY cHARAcTERISTIcS AnD FInAncIAL cIRcumSTAncES
For those Primary Caregivers who were employed (just under half of the sample and excluding the self-employed), 24% rated their employer as ‘very good’ in terms of allowing family-friendly working, and an additional 31% described them as ‘fairly good’. At the other end of the spectrum, 11% rated their employer as ‘fairly poor’ and 9% felt that family-friendly policies were ‘very poor’. The remainder, one-quarter of employed Primary Caregivers, described their employer’s family-friendly work policies as ‘neither good nor poor’.
2.3 THE FINANCIAL AND ECONOmIC CIRCUmSTANCES OF FAmILIES
It is important to consider the family’s financial and economic circumstances and how they may affect a child’s development. Previous research has established significant associations between a child’s development and educational performance on the one hand and family economic circumstances on the other (Dickerson and Popli, 2016). The relationship between persistent poverty and children’s cognitive development has been examined using the UK Millennium Cohort Study (Blanden et al., 2007) and, as captured by a composite index of economic vulnerability, in Watson et al. (2014) using Growing Up in Ireland data from the first two waves of interviews with both Cohort ’98 and Cohort ’08. In a systematic review of 34 studies (mostly from the US), Cooper and Stewart (2013) concluded that children from lower-income families have less favourable outcomes across a range of areas (cognitive, social-behavioural and health), and that this is at least partly because they have lower incomes and not just because of the association between low income and other family characteristics. There were 13 studies that examined the effects of changes in income at different parts of the income distribution; the authors concluded from these that the effects of increasing income were greater at the lower end of the income distribution.
Cooper and Stewart updated their analysis in 2017, adding a further 27 studies. These generally supported the earlier findings, confirming the strong association between increases in income towards the bottom of the income distribution and beneficial effects on child outcomes. The authors concluded that there is enough evidence to indicate that a reduction in poverty would bring benefits across a range of child outcomes (Cooper and Stewart, 2017).
2.3.1 EqUIVALISED INCOmE AND wORkLESSNESSFigure 2.5 focuses on average annual equivalised household income when the Study Child was five years of age in 2013, categorised according to the Primary Caregivers’ education and household type. To make meaningful comparisons of income across families, household size and composition (number of adults and children) are taken into account to derive the ‘equivalised’ family income. This is basically the household income, taking account of economies of scale, expressed as the income per ‘adult equivalent’.17
Across all families, the average equivalised income was €17,737 per annum. The chart indicates that equivalised income is strongly related to PCG’s level of education. At five years of age it ranged from an average of €11,458 for a family in which the Study Child’s mother had left school at Junior Certificate or earlier, rising progressively to €23,373 for a family where the child’s mother was a graduate. The chart also shows that equivalised income among larger one-parent families was €11,605, compared with €18,288 for larger two-parent families. Similarly, the average for a smaller one-parent family was almost €13,600, rising by 63% to €22,130 for smaller two-parent units.18
17 To do this, the number of ‘equivalised’ adult members resident in the household is calculated, by assigning a weight of 1 to the first adult, 0.66 to all subsequent adults and 0.33 to each child (14 years or less). The total number of adult equivalents is then divided into the household’s total disposable income, to give the household’s equivalised disposable income.
18 The average across all families of five-year-olds is very close to the median across all households in 2013 according to the CSO Survey of Income and Living Conditions (€17,374), https://www.cso.ie/en/releasesandpublications/er/silc/surveyonincomeandlivingconditions2013/.
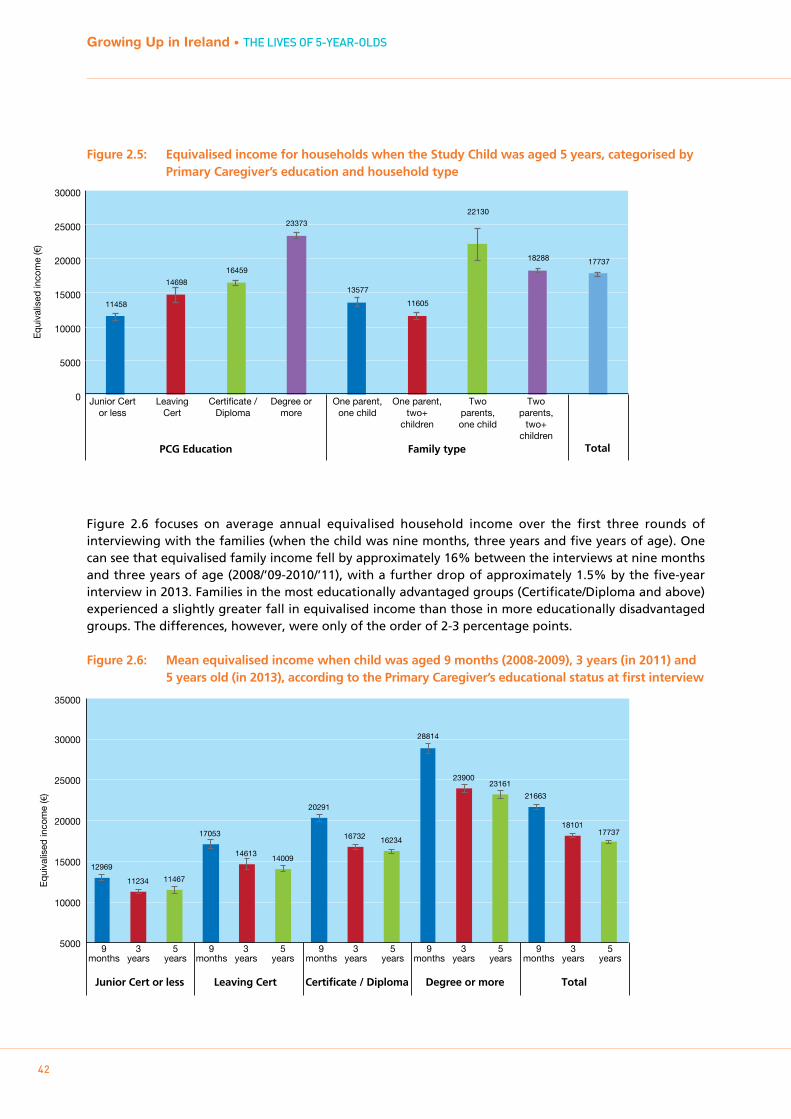
Growing Up in Ireland • THE LIVES OF 5-YEAR-OLDS
42
Figure 2.5: Equivalised income for households when the Study Child was aged 5 years, categorised by Primary Caregiver’s education and household type
Figure 2.6 focuses on average annual equivalised household income over the first three rounds of interviewing with the families (when the child was nine months, three years and five years of age). One can see that equivalised family income fell by approximately 16% between the interviews at nine months and three years of age (2008/’09-2010/’11), with a further drop of approximately 1.5% by the five-year interview in 2013. Families in the most educationally advantaged groups (Certificate/Diploma and above) experienced a slightly greater fall in equivalised income than those in more educationally disadvantaged groups. The differences, however, were only of the order of 2-3 percentage points.
Figure 2.6: Mean equivalised income when child was aged 9 months (2008-2009), 3 years (in 2011) and 5 years old (in 2013), according to the Primary Caregiver’s educational status at first interview
Equ
ival
ised
inco
me
(€)
PCG Education Family type Total
Junior Cert or less
Leaving Cert
Certificate / Diploma
Degree or more
One parent, one child
One parent, two+
children
Two parents, one child
Two parents,
two+ children
11458
14698
16459
23373
13577
11605
22130
18288 17737
0
5000
10000
15000
20000
25000
30000
Equ
ival
ised
inco
me
(€)
9 months
3 years
5years
9 months
3 years
5years
9 months
3 years
5years
9 months
3 years
5years
9 months
3 years
5years
5000
10000
15000
20000
25000
30000
35000
12969
11234 11467
17053
14613 14009
20291
16732 16234
28814
23900 23161
21663
18101 17737
Junior Cert or less Leaving Cert Certificate / Diploma Degree or more Total
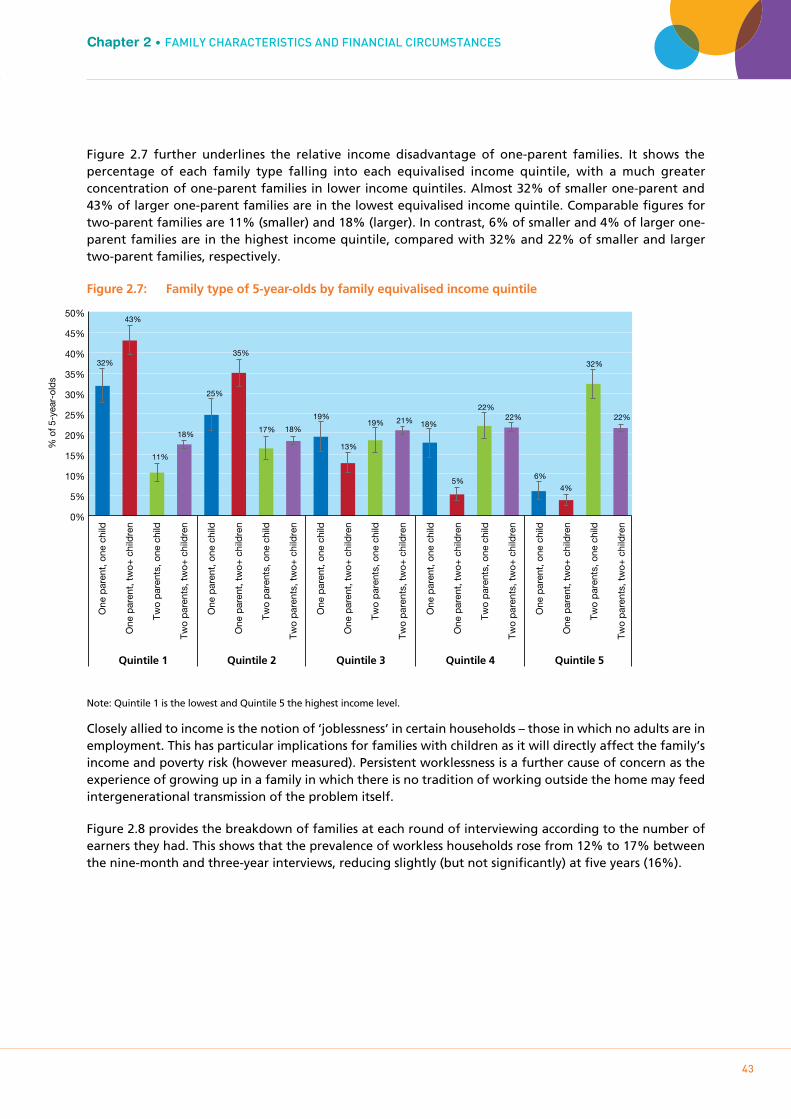
Growing Up in Ireland • THE LIVES OF 5-YEAR-OLDS
43
Chapter 2 • FAmILY cHARAcTERISTIcS AnD FInAncIAL cIRcumSTAncES
Figure 2.7 further underlines the relative income disadvantage of one-parent families. It shows the percentage of each family type falling into each equivalised income quintile, with a much greater concentration of one-parent families in lower income quintiles. Almost 32% of smaller one-parent and 43% of larger one-parent families are in the lowest equivalised income quintile. Comparable figures for two-parent families are 11% (smaller) and 18% (larger). In contrast, 6% of smaller and 4% of larger one-parent families are in the highest income quintile, compared with 32% and 22% of smaller and larger two-parent families, respectively.
Figure 2.7: Family type of 5-year-olds by family equivalised income quintile
Note: Quintile 1 is the lowest and Quintile 5 the highest income level.
Closely allied to income is the notion of ‘joblessness’ in certain households – those in which no adults are in employment. This has particular implications for families with children as it will directly affect the family’s income and poverty risk (however measured). Persistent worklessness is a further cause of concern as the experience of growing up in a family in which there is no tradition of working outside the home may feed intergenerational transmission of the problem itself.
Figure 2.8 provides the breakdown of families at each round of interviewing according to the number of earners they had. This shows that the prevalence of workless households rose from 12% to 17% between the nine-month and three-year interviews, reducing slightly (but not significantly) at five years (16%).
% o
f 5-y
ear-
olds
0%
5%
10%
15%
20%
25%
30%
35%
40%
45%
50%
32%
43%
11%
18%
25%
35%
17% 18%
19%
13%
19% 21% 18%
5%
22% 22%
6%
4%
32%
22%
One
par
ent,
one
chi
ld
One
par
ent,
tw
o+ c
hild
ren
Two
par
ents
, one
chi
ld
Two
par
ents
, tw
o+ c
hild
ren
One
par
ent,
one
chi
ld
One
par
ent,
tw
o+ c
hild
ren
Two
par
ents
, one
chi
ld
Two
par
ents
, tw
o+ c
hild
ren
One
par
ent,
one
chi
ld
One
par
ent,
tw
o+ c
hild
ren
Two
par
ents
, one
chi
ld
Two
par
ents
, tw
o+ c
hild
ren
One
par
ent,
one
chi
ld
One
par
ent,
tw
o+ c
hild
ren
Two
par
ents
, one
chi
ld
Two
par
ents
, tw
o+ c
hild
ren
One
par
ent,
one
chi
ld
One
par
ent,
tw
o+ c
hild
ren
Two
par
ents
, one
chi
ld
Two
par
ents
, tw
o+ c
hild
ren
Quintile 1 Quintile 2 Quintile 3 Quintile 4 Quintile 5
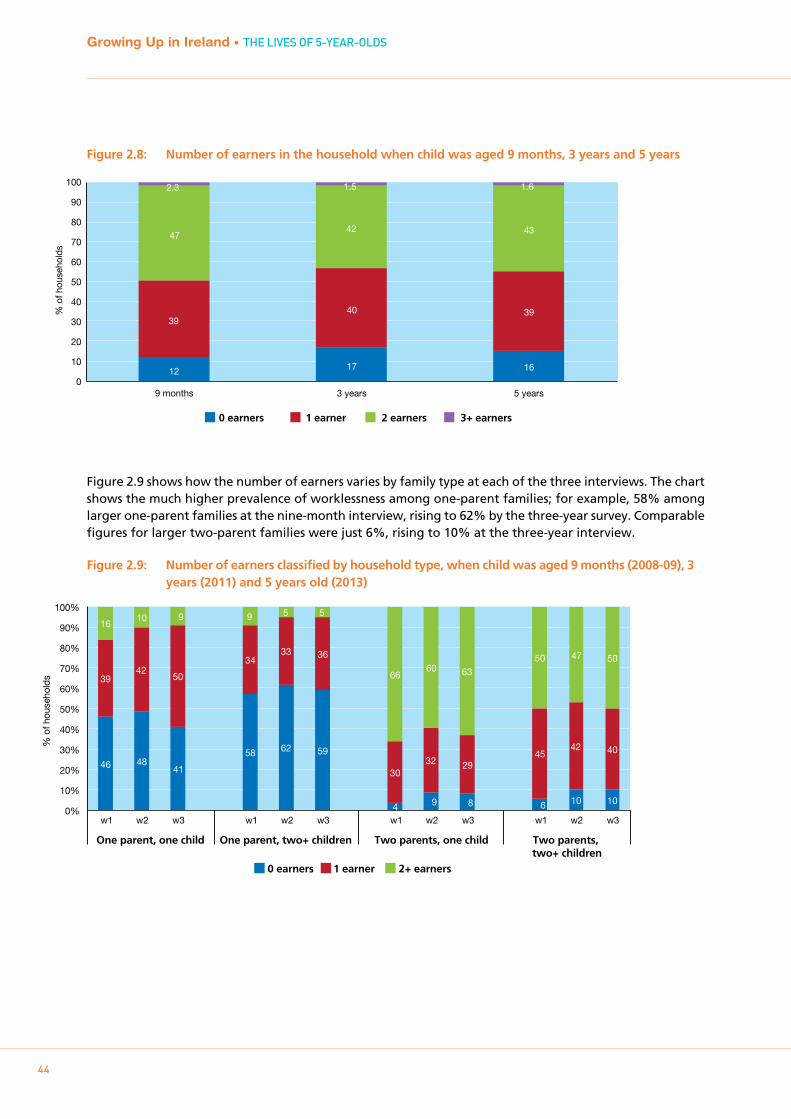
Growing Up in Ireland • THE LIVES OF 5-YEAR-OLDS
44
Figure 2.8: Number of earners in the household when child was aged 9 months, 3 years and 5 years
Figure 2.9 shows how the number of earners varies by family type at each of the three interviews. The chart shows the much higher prevalence of worklessness among one-parent families; for example, 58% among larger one-parent families at the nine-month interview, rising to 62% by the three-year survey. Comparable figures for larger two-parent families were just 6%, rising to 10% at the three-year interview.
Figure 2.9: Number of earners classified by household type, when child was aged 9 months (2008-09), 3 years (2011) and 5 years old (2013)
9 months 3 years 5 years 0
10
20
30
40
50
60
70
80
90
100
0 earners 1 earner 2 earners 3+ earners
12 17 16
39 40 39
47 42 43
2.3 1.5 1.6
% o
f hou
seho
lds
0 earners
One parent, one child Two parents, one child Two parents, two+ children
One parent, two+ children
1 earner 2+ earners
46 58
4 6
39
34
30
45
16 9
66
50
48 62
9 10
42
33
32
42
10 5
60 47
41
59
8 10
50
36
29
40
9 5
63 50
0%
10%
20%
30%
40%
50%
60%
70%
80%
90%
100%
w1 w2 w3 w1 w2 w3 w1 w2 w3 w1 w2 w3
% o
f hou
seho
lds
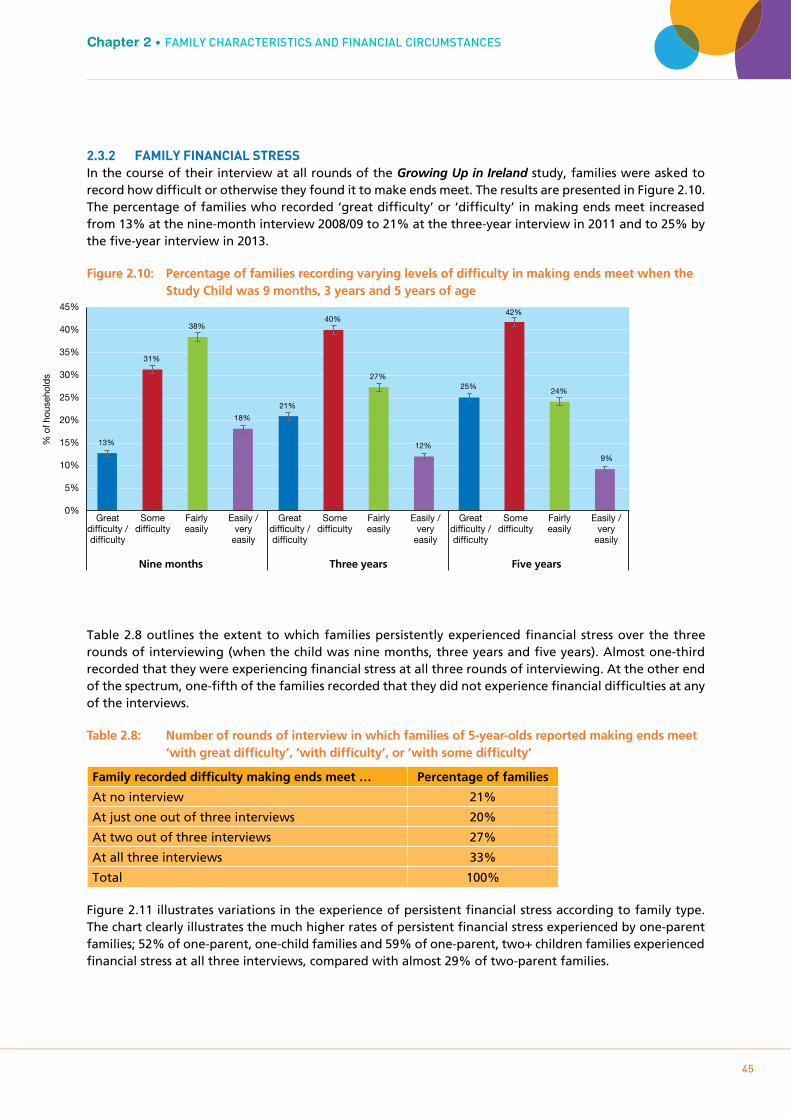
Growing Up in Ireland • THE LIVES OF 5-YEAR-OLDS
45
Chapter 2 • FAmILY cHARAcTERISTIcS AnD FInAncIAL cIRcumSTAncES
2.3.2 FAmILY FINANCIAL STRESSIn the course of their interview at all rounds of the Growing Up in Ireland study, families were asked to record how difficult or otherwise they found it to make ends meet. The results are presented in Figure 2.10. The percentage of families who recorded ‘great difficulty’ or ‘difficulty’ in making ends meet increased from 13% at the nine-month interview 2008/09 to 21% at the three-year interview in 2011 and to 25% by the five-year interview in 2013.
Figure 2.10: Percentage of families recording varying levels of difficulty in making ends meet when the Study Child was 9 months, 3 years and 5 years of age
Table 2.8 outlines the extent to which families persistently experienced financial stress over the three rounds of interviewing (when the child was nine months, three years and five years). Almost one-third recorded that they were experiencing financial stress at all three rounds of interviewing. At the other end of the spectrum, one-fifth of the families recorded that they did not experience financial difficulties at any of the interviews.
Table 2.8: Number of rounds of interview in which families of 5-year-olds reported making ends meet ‘with great difficulty’, ‘with difficulty’, or ’with some difficulty’
Family recorded difficulty making ends meet … Percentage of families
At no interview 21%
At just one out of three interviews 20%
At two out of three interviews 27%
At all three interviews 33%
Total 100%
Figure 2.11 illustrates variations in the experience of persistent financial stress according to family type. The chart clearly illustrates the much higher rates of persistent financial stress experienced by one-parent families; 52% of one-parent, one-child families and 59% of one-parent, two+ children families experienced financial stress at all three interviews, compared with almost 29% of two-parent families.
% o
f hou
seho
lds
Nine months Three years Five years
Great difficulty / difficulty
Some difficulty
Fairly easily
Easily / very
easily
Great difficulty / difficulty
Some difficulty
Fairly easily
Easily / very
easily
Great difficulty / difficulty
Some difficulty
Fairly easily
Easily / very
easily
0%
5%
10%
15%
20%
25%
30%
35%
40%
45%
13%
31%
38%
18%
21%
40%
27%
12%
25%
42%
24%
9%
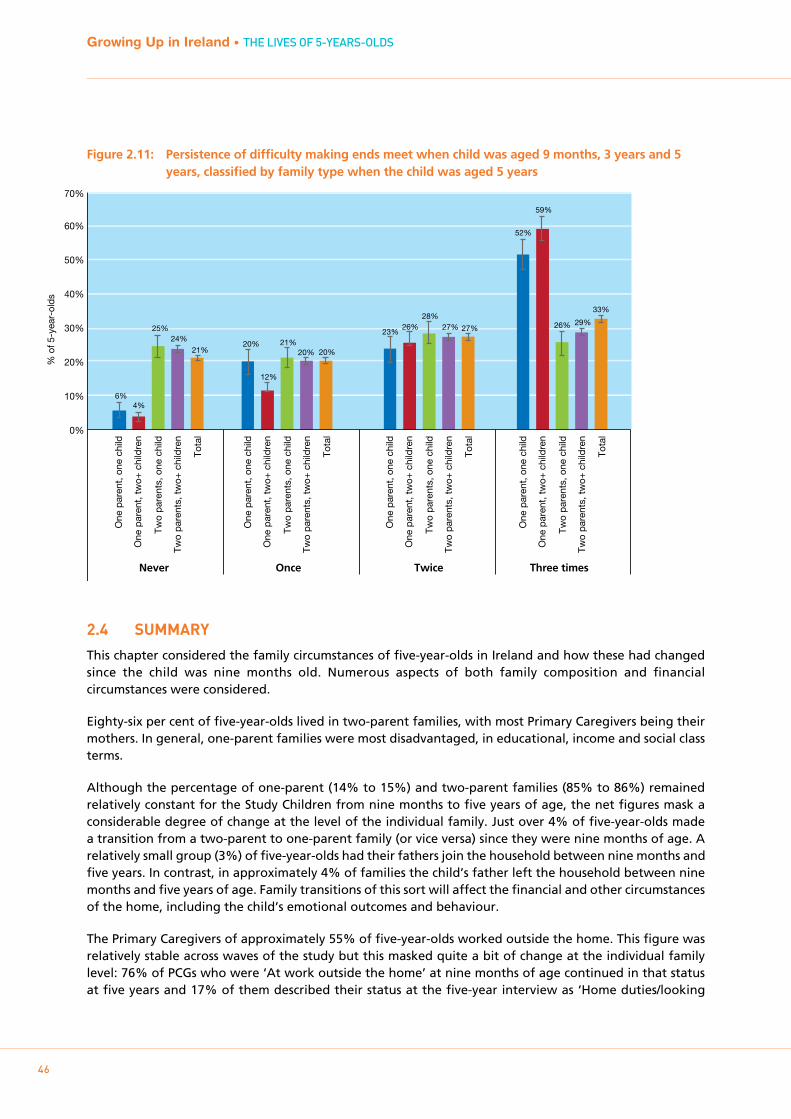
46
Growing Up in Ireland • THE LIVES OF 5-YEARS-OLDS
Figure 2.11: Persistence of difficulty making ends meet when child was aged 9 months, 3 years and 5 years, classified by family type when the child was aged 5 years
2.4 SUmmARY
This chapter considered the family circumstances of five-year-olds in Ireland and how these had changed since the child was nine months old. Numerous aspects of both family composition and financial circumstances were considered.
Eighty-six per cent of five-year-olds lived in two-parent families, with most Primary Caregivers being their mothers. In general, one-parent families were most disadvantaged, in educational, income and social class terms.
Although the percentage of one-parent (14% to 15%) and two-parent families (85% to 86%) remained relatively constant for the Study Children from nine months to five years of age, the net figures mask a considerable degree of change at the level of the individual family. Just over 4% of five-year-olds made a transition from a two-parent to one-parent family (or vice versa) since they were nine months of age. A relatively small group (3%) of five-year-olds had their fathers join the household between nine months and five years. In contrast, in approximately 4% of families the child’s father left the household between nine months and five years of age. Family transitions of this sort will affect the financial and other circumstances of the home, including the child’s emotional outcomes and behaviour.
The Primary Caregivers of approximately 55% of five-year-olds worked outside the home. This figure was relatively stable across waves of the study but this masked quite a bit of change at the individual family level: 76% of PCGs who were ‘At work outside the home’ at nine months of age continued in that status at five years and 17% of them described their status at the five-year interview as ‘Home duties/looking
% o
f 5-y
ear-
olds
0%
10%
20%
30%
40%
50%
60%
70%
6% 4%
25% 24%
21% 20%
12%
21% 20% 20%
23% 26%
28% 27% 27%
52%
59%
26% 29%
33%
One
par
ent,
one
chi
ld
One
par
ent,
tw
o+ c
hild
ren
Two
par
ents
, one
chi
ld
Two
par
ents
, tw
o+ c
hild
ren
Tota
l
One
par
ent,
one
chi
ld
One
par
ent,
tw
o+ c
hild
ren
Two
par
ents
, one
chi
ld
Two
par
ents
, tw
o+ c
hild
ren
Tota
l
One
par
ent,
one
chi
ld
One
par
ent,
tw
o+ c
hild
ren
Two
par
ents
, one
chi
ld
Two
par
ents
, tw
o+ c
hild
ren
Tota
l
One
par
ent,
one
chi
ld
One
par
ent,
tw
o+ c
hild
ren
Two
par
ents
, one
chi
ld
Two
par
ents
, tw
o+ c
hild
ren
Tota
l
Never Once Twice Three times
47
Chapter 2 • FAmILY cHARAcTERISTIcS AnD FInAncIAL cIRcumSTAncES
after the home’. Up to 25% of the Primary Caregivers whose main activity was ‘Home duties/looking after the family’ at nine months recorded that they were ‘at work outside the home’ by the time the child was five years old. Although there are many clear financial advantages to both parents being in employment, there is also evidence of work infringing on family time: 46% of Primary Caregivers and 54% of Secondary Caregivers who worked outside the home ‘agreed’ or ‘strongly agreed’ that they had missed out on family time because of work responsibilities.
Strong social gradients were apparent in the rate of out-of-home working: levels were much higher among families in which the Primary Caregiver had higher levels of education (74% where the PCG had a degree or higher level of education compared to 23% where the PCG had Junior Cert. or lower education).
The effects of the recession from 2008 were reflected in unemployment levels among Primary Caregivers, as well as in the equivalised income of their families. Levels of financial stress increased substantially between 2008/09 and 2013; 12% of PCGs reported difficulty or great difficulty in making ends meet in 2008/09, but 25% reported this level of difficulty by 2013. As with other measures of disadvantage, persistence of difficulty in making ends meet over the study period was heavily concentrated among one-parent families: about one-third of families overall reported some difficulty, difficulty or great difficulty in making ends meet at all three interviews (ages nine months, three years and five years) but one-half of one-parent families did so.
Growing Up in Ireland • THE LIVES OF 5-YEAR-OLDS
48
Growing Up in Ireland • THE LIVES OF 5-YEAR-OLDS
4949
Chapter 3PHYSIcAL HEALTH AnD DEVELOPmEnT
Growing Up in Ireland • THE LIVES OF 5-YEAR-OLDS
50
3.1 INTRODUCTION
3.1.1 bACkgROUNDIndividual health status is a key indicator of wellbeing at any age. Additionally, in childhood ill-health can impinge on the child’s wellbeing in other areas such as socio-emotional development and school participation. It can have an impact on the circumstances of the wider family if health problems limit parents’ capacity for employment, and resources (such as time and money) have to be diverted away from other family members. Individuals who have poor health in childhood are at much greater risk of poor health in adulthood, including work-limiting disabilities and chronic health conditions (Haas, 2007).
In 2017, the UNICEF Innocenti Report Card ranked Ireland only 22nd of 40 developed countries for child health and safety (UNICEF, 2017). Childhood health is a core target of government policy initiatives. The improvement of the physical health and wellbeing of children is listed as a top priority in Better Outcomes, Brighter Futures, the national policy framework for children and young people (DCYA, 2014), while the development of a national healthy childhood programme is a strategic action under the First 5 early-years strategy (Government of Ireland, 2018).
Injuries are among the leading cause of death of children and teenagers in Ireland today (Freyne et al., 2014), the most common of which result from road traffic accidents, falls, drowning, burns, poisoning and choking (O’Sullivan, 2017). Looking specifically at those aged five to nine years, the most common injuries are caused by road traffic accidents (2nd leading cause of death overall), drowning (6th overall), fire/burns (11th) and falls (12th overall; WHO, 2008). Most injuries are potentially preventable through a combination of environmental modification and regulation, improved education on the key risk factors, and improved parental skills.
The issue of overweight and obesity in childhood has been a major public health concern for some time, but has been given a particular urgency by findings from earlier waves of Growing Up in Ireland indicating that around a quarter of Irish children are already overweight or obese by age three (Williams, Murray, McCrory and McNally, 2013). According to another Irish study, the Childhood Obesity Surveillance Initiative (COSI), in 2008 22% of first-class students (roughly 7 years old) were either overweight or obese, although only 17% of first-class students were in this category in 2015 (Bel-Serrat et al., 2017). In terms of the burden associated with childhood obesity, Lobstein & Jackson-Leach (2006, p. 34) estimated that 20,000 obese children in Europe have type two diabetes, 400,000 have impaired glucose intolerance, and more than one million obese children have multiple indicators of cardiovascular disease. These findings indicate that childhood obesity will likely lead to a considerable increase in longstanding diseases among young adults in the near future.
Antibiotic prescription and use, relatively high among Irish children (Ferech et al., 2006), are also explored in this chapter. Antibiotics play a central role in the treatment of bacterial infections, and are the most commonly consumed medication for children. Antibiotic use is a particularly important topic given the increasing awareness and concern about antibiotic resistance. Internationally, the prevalence of antibiotic-resistant infections is increasing among children (Medernach & Logan, 2018). This can be partly explained by excessive prescription of antibiotics, highlighting the need for a more clear-cut strategy on antibiotic use for health professionals and parents alike (Nicolini et al., 2014).
As noted in Chapter 1, unless explicitly stated, all of the findings and patterns discussed in the text of this chapter are statistically significant at the 5% level.
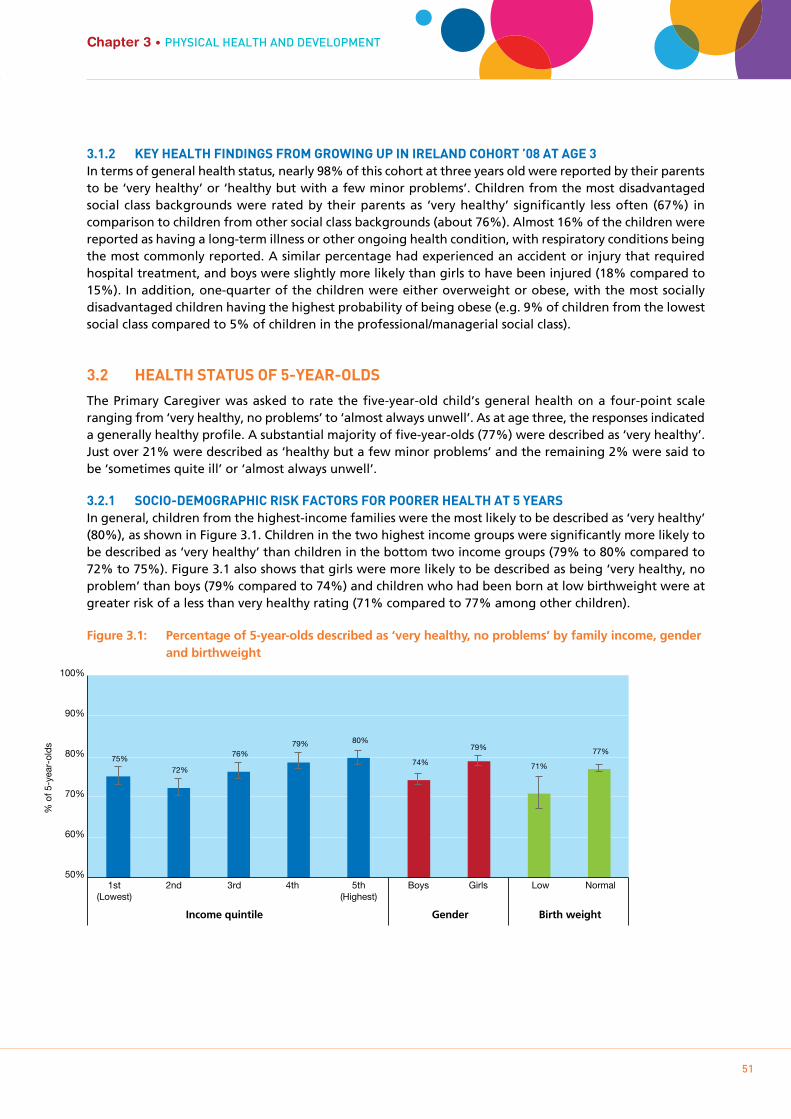
Growing Up in Ireland • THE LIVES OF 5-YEAR-OLDS
51
Chapter 3 • PHYSIcAL HEALTH AnD DEVELOPmEnT
3.1.2 kEY HEALTH FINDINgS FROm gROwINg Up IN IRELAND COHORT ’08 AT AgE 3In terms of general health status, nearly 98% of this cohort at three years old were reported by their parents to be ‘very healthy’ or ‘healthy but with a few minor problems’. Children from the most disadvantaged social class backgrounds were rated by their parents as ‘very healthy’ significantly less often (67%) in comparison to children from other social class backgrounds (about 76%). Almost 16% of the children were reported as having a long-term illness or other ongoing health condition, with respiratory conditions being the most commonly reported. A similar percentage had experienced an accident or injury that required hospital treatment, and boys were slightly more likely than girls to have been injured (18% compared to 15%). In addition, one-quarter of the children were either overweight or obese, with the most socially disadvantaged children having the highest probability of being obese (e.g. 9% of children from the lowest social class compared to 5% of children in the professional/managerial social class).
3.2 HEALTH STATUS OF 5-YEAR-OLDS
The Primary Caregiver was asked to rate the five-year-old child’s general health on a four-point scale ranging from ‘very healthy, no problems’ to ‘almost always unwell’. As at age three, the responses indicated a generally healthy profile. A substantial majority of five-year-olds (77%) were described as ‘very healthy’. Just over 21% were described as ‘healthy but a few minor problems’ and the remaining 2% were said to be ‘sometimes quite ill’ or ‘almost always unwell’.
3.2.1 SOCIO-DEmOgRApHIC RISk FACTORS FOR pOORER HEALTH AT 5 YEARSIn general, children from the highest-income families were the most likely to be described as ‘very healthy’ (80%), as shown in Figure 3.1. Children in the two highest income groups were significantly more likely to be described as ‘very healthy’ than children in the bottom two income groups (79% to 80% compared to 72% to 75%). Figure 3.1 also shows that girls were more likely to be described as being ‘very healthy, no problem’ than boys (79% compared to 74%) and children who had been born at low birthweight were at greater risk of a less than very healthy rating (71% compared to 77% among other children).
Figure 3.1: Percentage of 5-year-olds described as ‘very healthy, no problems’ by family income, gender and birthweight
Income quintile Gender Birth weight
1st (Lowest)
Boys Girls Low Normal 5th (Highest)
2nd 3rd 4th
% o
f 5-y
ear-
olds
50%
60%
70%
80%
90%
100%
75%
72%
76% 79% 80%
74%
79%
71%
77%
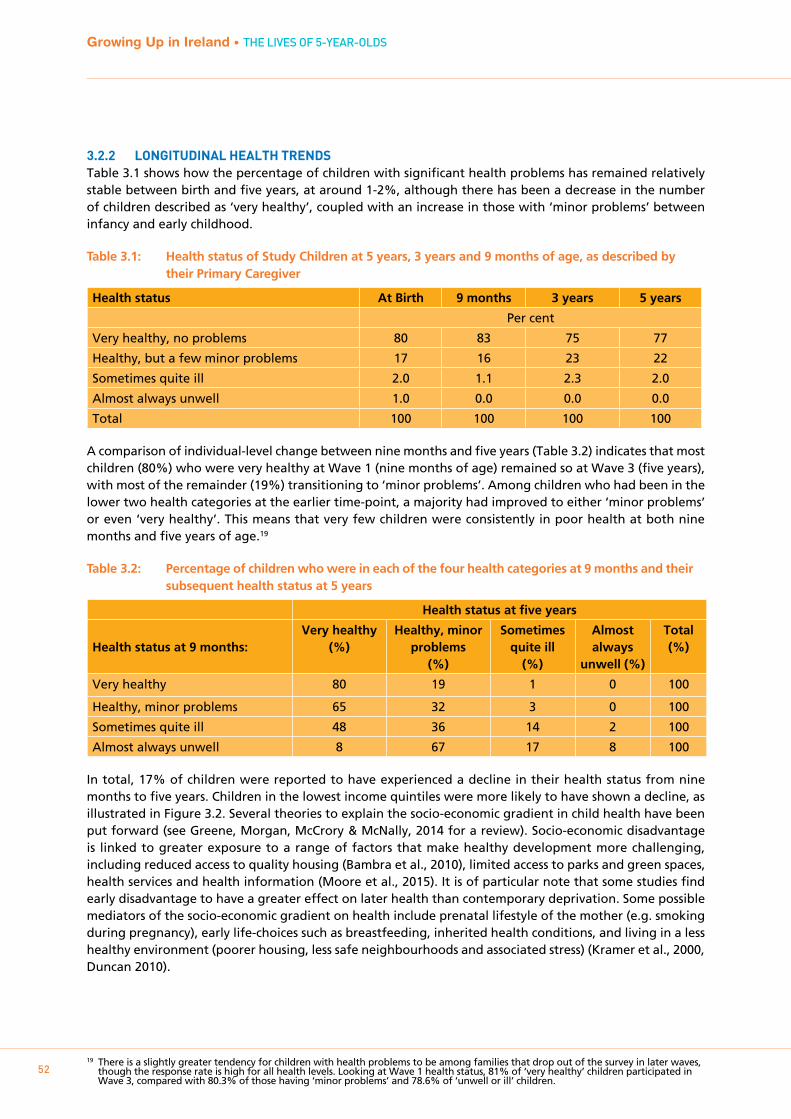
Growing Up in Ireland • THE LIVES OF 5-YEAR-OLDS
52
3.2.2 LONgITUDINAL HEALTH TRENDSTable 3.1 shows how the percentage of children with significant health problems has remained relatively stable between birth and five years, at around 1-2%, although there has been a decrease in the number of children described as ‘very healthy’, coupled with an increase in those with ‘minor problems’ between infancy and early childhood.
Table 3.1: Health status of Study Children at 5 years, 3 years and 9 months of age, as described by their Primary Caregiver
Health status At Birth 9 months 3 years 5 years
Per cent
Very healthy, no problems 80 83 75 77
Healthy, but a few minor problems 17 16 23 22
Sometimes quite ill 2.0 1.1 2.3 2.0
Almost always unwell 1.0 0.0 0.0 0.0
Total 100 100 100 100
A comparison of individual-level change between nine months and five years (Table 3.2) indicates that most children (80%) who were very healthy at Wave 1 (nine months of age) remained so at Wave 3 (five years), with most of the remainder (19%) transitioning to ‘minor problems’. Among children who had been in the lower two health categories at the earlier time-point, a majority had improved to either ‘minor problems’ or even ‘very healthy’. This means that very few children were consistently in poor health at both nine months and five years of age.19
Table 3.2: Percentage of children who were in each of the four health categories at 9 months and their subsequent health status at 5 years
Health status at five years
Health status at 9 months: Very healthy
(%)Healthy, minor
problems(%)
Sometimes quite ill
(%)
Almost always
unwell (%)
Total(%)
Very healthy 80 19 1 0 100
Healthy, minor problems 65 32 3 0 100
Sometimes quite ill 48 36 14 2 100
Almost always unwell 8 67 17 8 100
In total, 17% of children were reported to have experienced a decline in their health status from nine months to five years. Children in the lowest income quintiles were more likely to have shown a decline, as illustrated in Figure 3.2. Several theories to explain the socio-economic gradient in child health have been put forward (see Greene, Morgan, McCrory & McNally, 2014 for a review). Socio-economic disadvantage is linked to greater exposure to a range of factors that make healthy development more challenging, including reduced access to quality housing (Bambra et al., 2010), limited access to parks and green spaces, health services and health information (Moore et al., 2015). It is of particular note that some studies find early disadvantage to have a greater effect on later health than contemporary deprivation. Some possible mediators of the socio-economic gradient on health include prenatal lifestyle of the mother (e.g. smoking during pregnancy), early life-choices such as breastfeeding, inherited health conditions, and living in a less healthy environment (poorer housing, less safe neighbourhoods and associated stress) (Kramer et al., 2000, Duncan 2010).
19 There is a slightly greater tendency for children with health problems to be among families that drop out of the survey in later waves, though the response rate is high for all health levels. Looking at Wave 1 health status, 81% of ‘very healthy’ children participated in Wave 3, compared with 80.3% of those having ‘minor problems’ and 78.6% of ‘unwell or ill’ children.

Growing Up in Ireland • THE LIVES OF 5-YEAR-OLDS
53
Chapter 3 • PHYSIcAL HEALTH AnD DEVELOPmEnT
Figure 3.2: Percentage of children experiencing a decline in health rating between 9 months and 5 years for each family income group and gender
3.2.3 LONgSTANDINg ILLNESS, CONDITION OR DISAbILITYBy age five years, 18% of children were described by the Primary Caregiver as having a longstanding illness, condition or disability (not necessarily diagnosed by a specialist). This represented only a minor increase from 16% of children at three years of age. Most five-year-olds reported to have had a long-standing illness, condition or disability had just one such condition but almost a third of affected children had multiple conditions or illnesses; 19% had two conditions/illnesses and 11% had three or more (respondents could only enter a maximum of three conditions on the questionnaire). Boys, children who had been born at low birthweight, children of larger one-parent-parent families, and children in the most socially disadvantaged groups (as illustrated by the social class pattern) were all more likely to have some kind of longstanding health condition (Figure 3.3).
Figure 3.3: Frequency of having a longstanding illness, health condition or disability for each gender, birthweight category, family type and social class group
Income quintile Gender
1st (Lowest)
Boys Girls 5th (Highest)
2nd 3rd 4th
% o
f 5-y
ear-
olds
0%
5%
10%
15%
20%
25%
19%
22%
18%
16% 15%
19%
16%
Boy
s
Girl
s
Low
Nor
mal
One
par
ent,
one
chi
ld
One
par
ent,
tw
o+ c
hild
ren
Two
par
ents
, one
chi
ld
Two
par
ents
, tw
o+ c
hild
ren
Pro
fess
iona
l / M
anag
eria
l
Non
-man
ual /
Ski
lled
Man
ual
Sem
i- /
Uns
kille
d
Nev
er W
orke
d 0%
5%
10%
15%
20%
25%
30%
21%
15%
21%
18%
21% 22%
19%
17% 17%
18% 17%
22%
Gender Birth weight Family type Social class
% o
f 5-y
ear-
olds
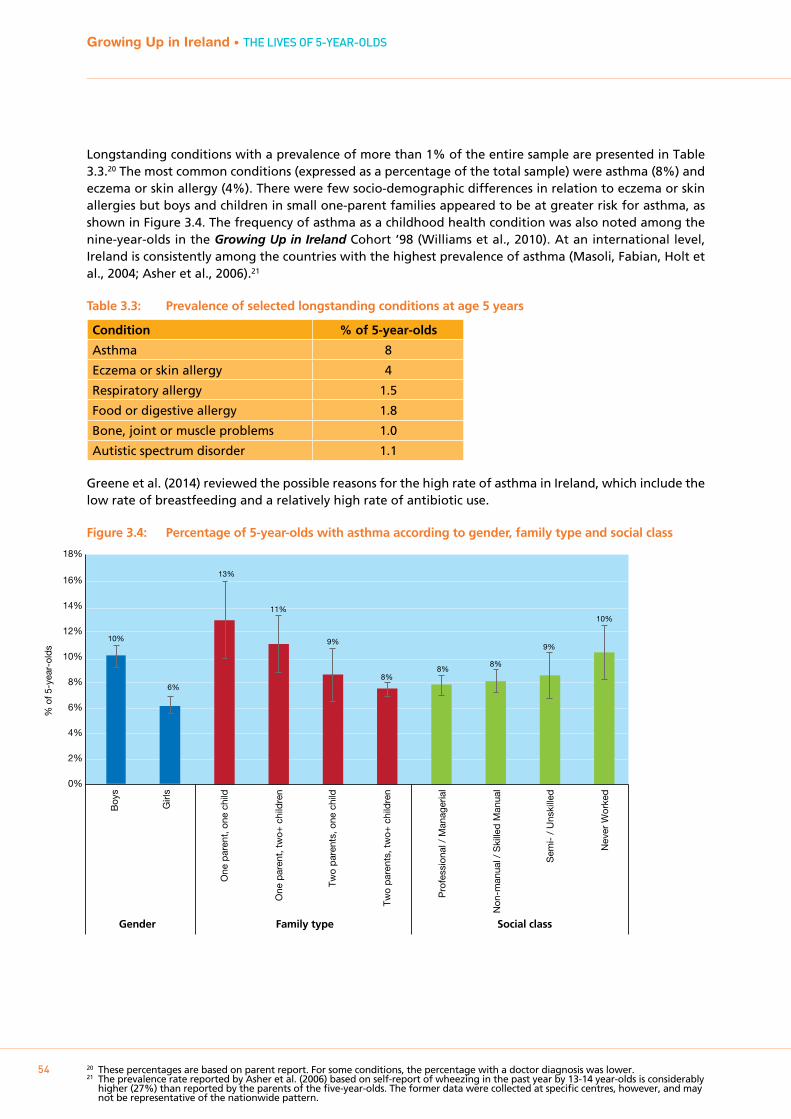
Growing Up in Ireland • THE LIVES OF 5-YEAR-OLDS
54
Longstanding conditions with a prevalence of more than 1% of the entire sample are presented in Table 3.3.20 The most common conditions (expressed as a percentage of the total sample) were asthma (8%) and eczema or skin allergy (4%). There were few socio-demographic differences in relation to eczema or skin allergies but boys and children in small one-parent families appeared to be at greater risk for asthma, as shown in Figure 3.4. The frequency of asthma as a childhood health condition was also noted among the nine-year-olds in the Growing Up in Ireland Cohort ’98 (Williams et al., 2010). At an international level, Ireland is consistently among the countries with the highest prevalence of asthma (Masoli, Fabian, Holt et al., 2004; Asher et al., 2006).21
Table 3.3: Prevalence of selected longstanding conditions at age 5 years
Condition % of 5-year-olds
Asthma 8
Eczema or skin allergy 4
Respiratory allergy 1.5
Food or digestive allergy 1.8
Bone, joint or muscle problems 1.0
Autistic spectrum disorder 1.1
Greene et al. (2014) reviewed the possible reasons for the high rate of asthma in Ireland, which include the low rate of breastfeeding and a relatively high rate of antibiotic use.
Figure 3.4: Percentage of 5-year-olds with asthma according to gender, family type and social class
20 These percentages are based on parent report. For some conditions, the percentage with a doctor diagnosis was lower. 21 The prevalence rate reported by Asher et al. (2006) based on self-report of wheezing in the past year by 13-14 year-olds is considerably
higher (27%) than reported by the parents of the five-year-olds. The former data were collected at specific centres, however, and may not be representative of the nationwide pattern.
Boy
s
Girl
s
One
par
ent,
one
chi
ld
One
par
ent,
tw
o+ c
hild
ren
Two
par
ents
, one
chi
ld
Two
par
ents
, tw
o+ c
hild
ren
Pro
fess
iona
l / M
anag
eria
l
Non
-man
ual /
Ski
lled
Man
ual
Sem
i- /
Uns
kille
d
Nev
er W
orke
d
% o
f 5-y
ear-
olds
0%
2%
4%
6%
8%
10%
12%
14%
16%
18%
10%
6%
13%
11%
9%
8% 8%
8%
9%
10%
Gender Family type Social class
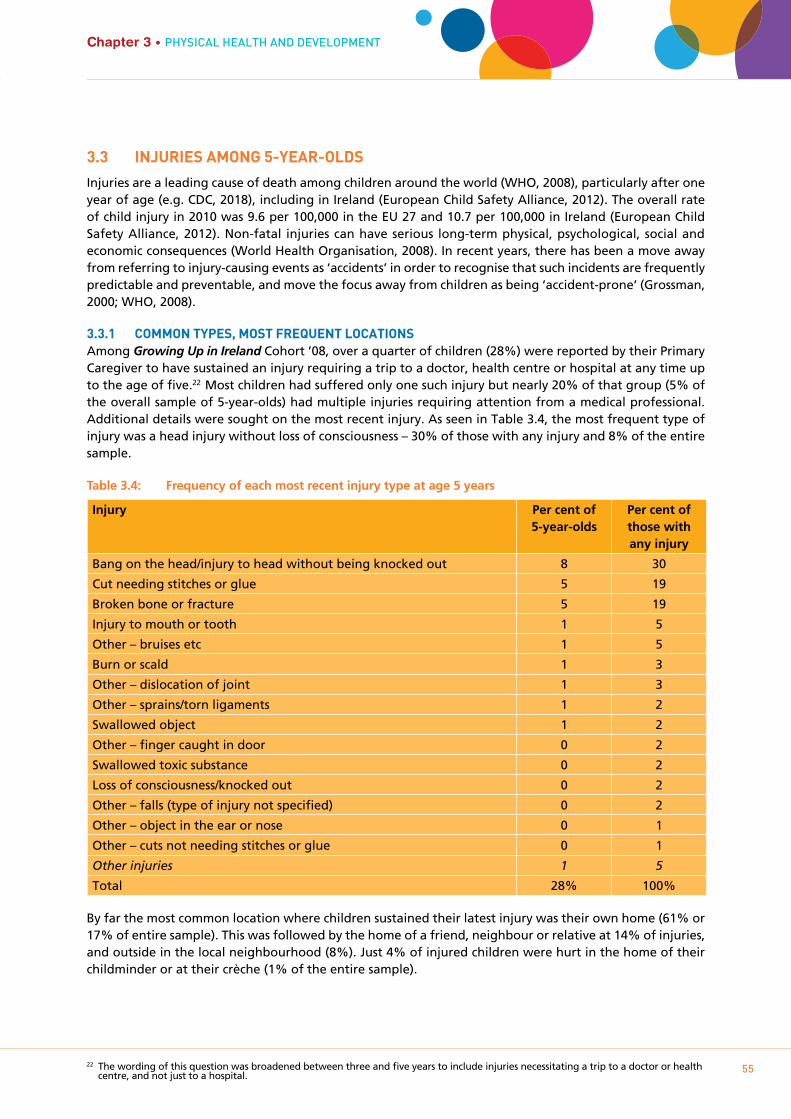
Growing Up in Ireland • THE LIVES OF 5-YEAR-OLDS
55
Chapter 3 • PHYSIcAL HEALTH AnD DEVELOPmEnT
3.3 INjURIES AmONg 5-YEAR-OLDS
Injuries are a leading cause of death among children around the world (WHO, 2008), particularly after one year of age (e.g. CDC, 2018), including in Ireland (European Child Safety Alliance, 2012). The overall rate of child injury in 2010 was 9.6 per 100,000 in the EU 27 and 10.7 per 100,000 in Ireland (European Child Safety Alliance, 2012). Non-fatal injuries can have serious long-term physical, psychological, social and economic consequences (World Health Organisation, 2008). In recent years, there has been a move away from referring to injury-causing events as ‘accidents’ in order to recognise that such incidents are frequently predictable and preventable, and move the focus away from children as being ‘accident-prone’ (Grossman, 2000; WHO, 2008).
3.3.1 COmmON TYpES, mOST FREqUENT LOCATIONSAmong Growing Up in Ireland Cohort ’08, over a quarter of children (28%) were reported by their Primary Caregiver to have sustained an injury requiring a trip to a doctor, health centre or hospital at any time up to the age of five.22 Most children had suffered only one such injury but nearly 20% of that group (5% of the overall sample of 5-year-olds) had multiple injuries requiring attention from a medical professional. Additional details were sought on the most recent injury. As seen in Table 3.4, the most frequent type of injury was a head injury without loss of consciousness – 30% of those with any injury and 8% of the entire sample.
Table 3.4: Frequency of each most recent injury type at age 5 years
Injury Per cent of 5-year-olds
Per cent of those with any injury
Bang on the head/injury to head without being knocked out 8 30
Cut needing stitches or glue 5 19
Broken bone or fracture 5 19
Injury to mouth or tooth 1 5
Other – bruises etc 1 5
Burn or scald 1 3
Other – dislocation of joint 1 3
Other – sprains/torn ligaments 1 2
Swallowed object 1 2
Other – finger caught in door 0 2
Swallowed toxic substance 0 2
Loss of consciousness/knocked out 0 2
Other – falls (type of injury not specified) 0 2
Other – object in the ear or nose 0 1
Other – cuts not needing stitches or glue 0 1
Other injuries 1 5
Total 28% 100%
By far the most common location where children sustained their latest injury was their own home (61% or 17% of entire sample). This was followed by the home of a friend, neighbour or relative at 14% of injuries, and outside in the local neighbourhood (8%). Just 4% of injured children were hurt in the home of their childminder or at their crèche (1% of the entire sample).
22 The wording of this question was broadened between three and five years to include injuries necessitating a trip to a doctor or health centre, and not just to a hospital.

Growing Up in Ireland • THE LIVES OF 5-YEAR-OLDS
56
Table 3.5: Location where injury occurred
Location Per cent of 5-year-olds Per cent of those with any injury
Child’s home 17 61
Home of friend, neighbour or relative 4 14
Outside in the local neighbourhood 2 8
Outside, somewhere other than local neighbourhood 2 6
Childminder’s house or crèche 1 4
Other locations 2 7
Total 28% 100%
Over three-quarters of injured five-year-olds had to attend hospital but only 13% of them were admitted to a hospital ward because of it. Effectively this means that, by the age of five years, 3% of all children have a hospital admission as a result of their most recent injury and an additional 20% of all children had to be treated in hospital without being admitted. The median age for receiving the most recent injury was 3.5 years.
3.3.2 SOCIO-DEmOgRApHIC RISk FACTORS FOR INjURIESThe international literature suggests that individual child characteristics, such as gender and temperament, and familial or environment factors play a role in injury risk, with socio-economic disadvantage associated (although not consistently) with an increase in risk (see Murray & Morgan, in press, for a review). Among Growing Up in Ireland Cohort ’08 at five years, there were generally few socio-demographic differences in relation to overall injury risk, with the exception of child’s gender. Boys were more likely than girls to have sustained any injury (30% compared with 25%). They were also more likely to have sustained multiple injuries (7% and 4% respectively). While these gender differences are statistically significant, the practical implications of the differences will depend on the severity of the injury involved, with head injuries in childhood found to be associated with a range of serious consequences in both the long and short term (Sariaslan et al., 2016).
There were some socio-demographic trends in relation to location where the injury occurred. Although relatively infrequent overall, children living in urban areas were twice as likely to have been injured outside in their local neighbourhood than were those in rural areas (3.6% and 1.5% respectively). There was no effect of family type in overall injury risk but children living with two parents and no siblings had the lowest risk of being injured in their own home, as illustrated in Figure 3.4. There was also a trend for one-parent families with one child to have a reduced risk of a home injury compared to those living with siblings23 (15% and 17% respectively). This could relate to a dilution of parental supervision in households with multiple children, or perhaps an older sibling potentially leading the five-year-old into more hazardous play activities, thus increasing the risk of injury (Nathen et al., 2000).
23 However, in a regression model the one-parent, one-child group did not differ significantly from the two-parent, multi-child reference group.
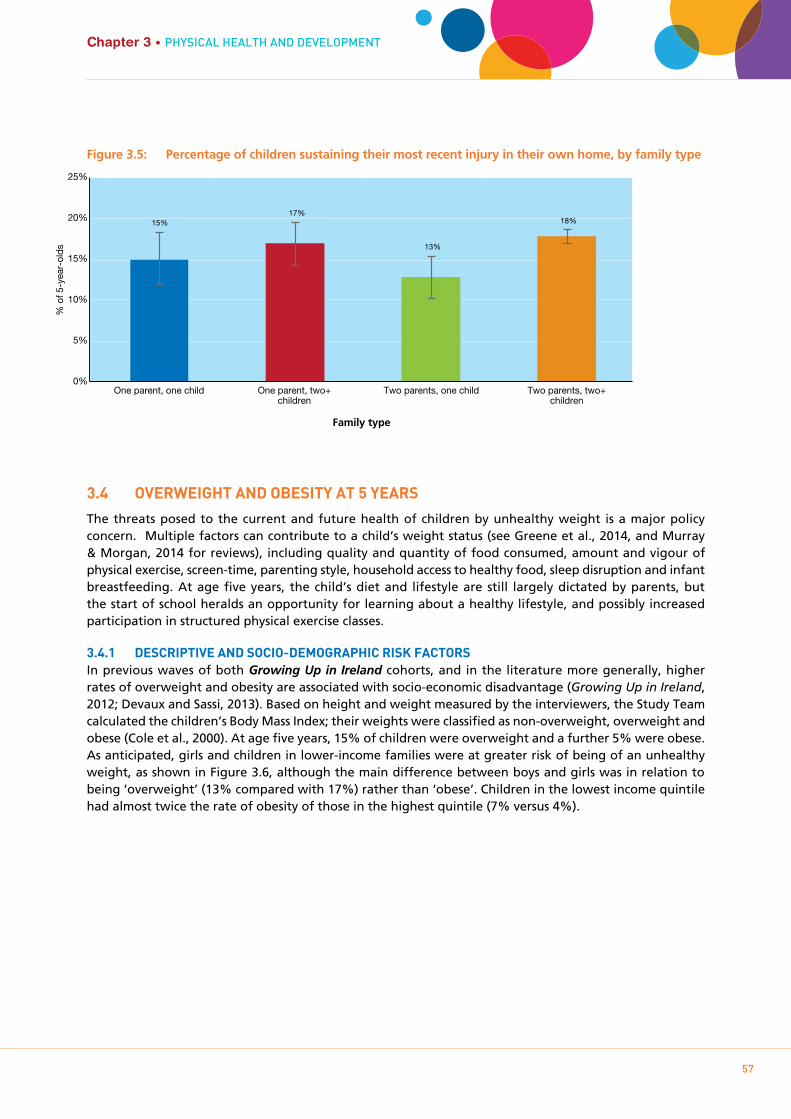
Growing Up in Ireland • THE LIVES OF 5-YEAR-OLDS
57
Chapter 3 • PHYSIcAL HEALTH AnD DEVELOPmEnT
Figure 3.5: Percentage of children sustaining their most recent injury in their own home, by family type
3.4 OVERwEIgHT AND ObESITY AT 5 YEARS
The threats posed to the current and future health of children by unhealthy weight is a major policy concern. Multiple factors can contribute to a child’s weight status (see Greene et al., 2014, and Murray & Morgan, 2014 for reviews), including quality and quantity of food consumed, amount and vigour of physical exercise, screen-time, parenting style, household access to healthy food, sleep disruption and infant breastfeeding. At age five years, the child’s diet and lifestyle are still largely dictated by parents, but the start of school heralds an opportunity for learning about a healthy lifestyle, and possibly increased participation in structured physical exercise classes.
3.4.1 DESCRIpTIVE AND SOCIO-DEmOgRApHIC RISk FACTORSIn previous waves of both Growing Up in Ireland cohorts, and in the literature more generally, higher rates of overweight and obesity are associated with socio-economic disadvantage (Growing Up in Ireland, 2012; Devaux and Sassi, 2013). Based on height and weight measured by the interviewers, the Study Team calculated the children’s Body Mass Index; their weights were classified as non-overweight, overweight and obese (Cole et al., 2000). At age five years, 15% of children were overweight and a further 5% were obese. As anticipated, girls and children in lower-income families were at greater risk of being of an unhealthy weight, as shown in Figure 3.6, although the main difference between boys and girls was in relation to being ‘overweight’ (13% compared with 17%) rather than ‘obese’. Children in the lowest income quintile had almost twice the rate of obesity of those in the highest quintile (7% versus 4%).
% o
f 5-y
ear-
olds
One parent, one child One parent, two+ children
Two parents, one child Two parents, two+ children
0%
5%
10%
15%
20%
25%
15% 17%
13%
18%
Family type
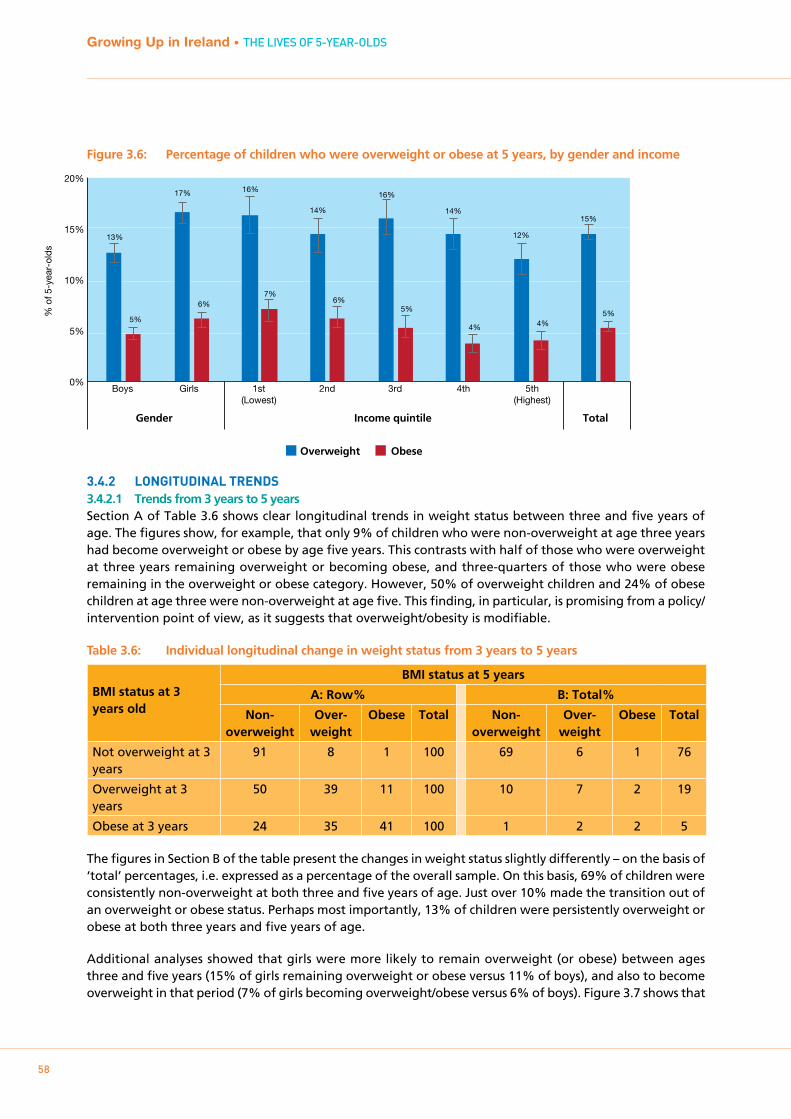
Growing Up in Ireland • THE LIVES OF 5-YEAR-OLDS
58
Figure 3.6: Percentage of children who were overweight or obese at 5 years, by gender and income
3.4.2 LONgITUDINAL TRENDS3.4.2.1 Trends from 3 years to 5 yearsSection A of Table 3.6 shows clear longitudinal trends in weight status between three and five years of age. The figures show, for example, that only 9% of children who were non-overweight at age three years had become overweight or obese by age five years. This contrasts with half of those who were overweight at three years remaining overweight or becoming obese, and three-quarters of those who were obese remaining in the overweight or obese category. However, 50% of overweight children and 24% of obese children at age three were non-overweight at age five. This finding, in particular, is promising from a policy/intervention point of view, as it suggests that overweight/obesity is modifiable.
Table 3.6: Individual longitudinal change in weight status from 3 years to 5 years
BMI status at 3 years old
BMI status at 5 years
A: Row% B: Total%
Non-overweight
Over-weight
Obese Total Non-overweight
Over-weight
Obese Total
Not overweight at 3 years
91 8 1 100 69 6 1 76
Overweight at 3 years
50 39 11 100 10 7 2 19
Obese at 3 years 24 35 41 100 1 2 2 5
The figures in Section B of the table present the changes in weight status slightly differently – on the basis of ‘total’ percentages, i.e. expressed as a percentage of the overall sample. On this basis, 69% of children were consistently non-overweight at both three and five years of age. Just over 10% made the transition out of an overweight or obese status. Perhaps most importantly, 13% of children were persistently overweight or obese at both three years and five years of age.
Additional analyses showed that girls were more likely to remain overweight (or obese) between ages three and five years (15% of girls remaining overweight or obese versus 11% of boys), and also to become overweight in that period (7% of girls becoming overweight/obese versus 6% of boys). Figure 3.7 shows that
Gender Income quintile Total
1st (Lowest)
Boys Girls 5th (Highest)
2nd 3rd 4th
% o
f 5-y
ear-
olds
0%
5%
10%
15%
20%
13%
17% 16%
14%
16%
14%
12%
15%
5%
6% 7%
6% 5%
4% 4% 5%
Overweight Obese
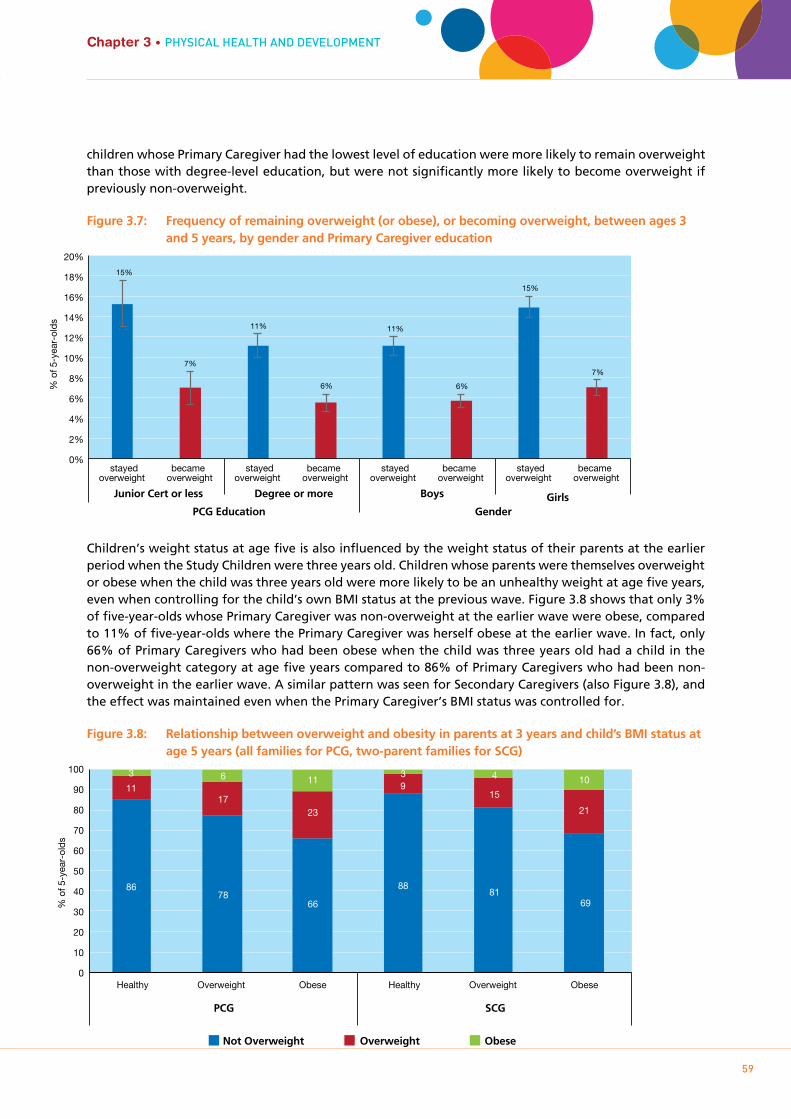
Growing Up in Ireland • THE LIVES OF 5-YEAR-OLDS
59
Chapter 3 • PHYSIcAL HEALTH AnD DEVELOPmEnT
children whose Primary Caregiver had the lowest level of education were more likely to remain overweight than those with degree-level education, but were not significantly more likely to become overweight if previously non-overweight.
Figure 3.7: Frequency of remaining overweight (or obese), or becoming overweight, between ages 3 and 5 years, by gender and Primary Caregiver education
Children’s weight status at age five is also influenced by the weight status of their parents at the earlier period when the Study Children were three years old. Children whose parents were themselves overweight or obese when the child was three years old were more likely to be an unhealthy weight at age five years, even when controlling for the child’s own BMI status at the previous wave. Figure 3.8 shows that only 3% of five-year-olds whose Primary Caregiver was non-overweight at the earlier wave were obese, compared to 11% of five-year-olds where the Primary Caregiver was herself obese at the earlier wave. In fact, only 66% of Primary Caregivers who had been obese when the child was three years old had a child in the non-overweight category at age five years compared to 86% of Primary Caregivers who had been non-overweight in the earlier wave. A similar pattern was seen for Secondary Caregivers (also Figure 3.8), and the effect was maintained even when the Primary Caregiver’s BMI status was controlled for.
Figure 3.8: Relationship between overweight and obesity in parents at 3 years and child’s BMI status at age 5 years (all families for PCG, two-parent families for SCG)
15%
7%
11%
6%
11%
6%
15%
7%
0%
2%
4%
6%
8%
10%
12%
14%
16%
18%
20%
stayed overweight
became overweight
stayed overweight
became overweight
stayed overweight
became overweight
stayed overweight
became overweight
Junior Cert or less Degree or more Boys Girls PCG Education Gender
% o
f 5-y
ear-
olds
Healthy Overweight Obese Healthy Overweight Obese
% o
f 5-y
ear-
olds
0
10
20
30
40
50
60
70
80
90
100
Not Overweight Overweight Obese
86 78
66
88 81
69
11 17
23
915
21
3 6 11 3 4 10
PCG SCG
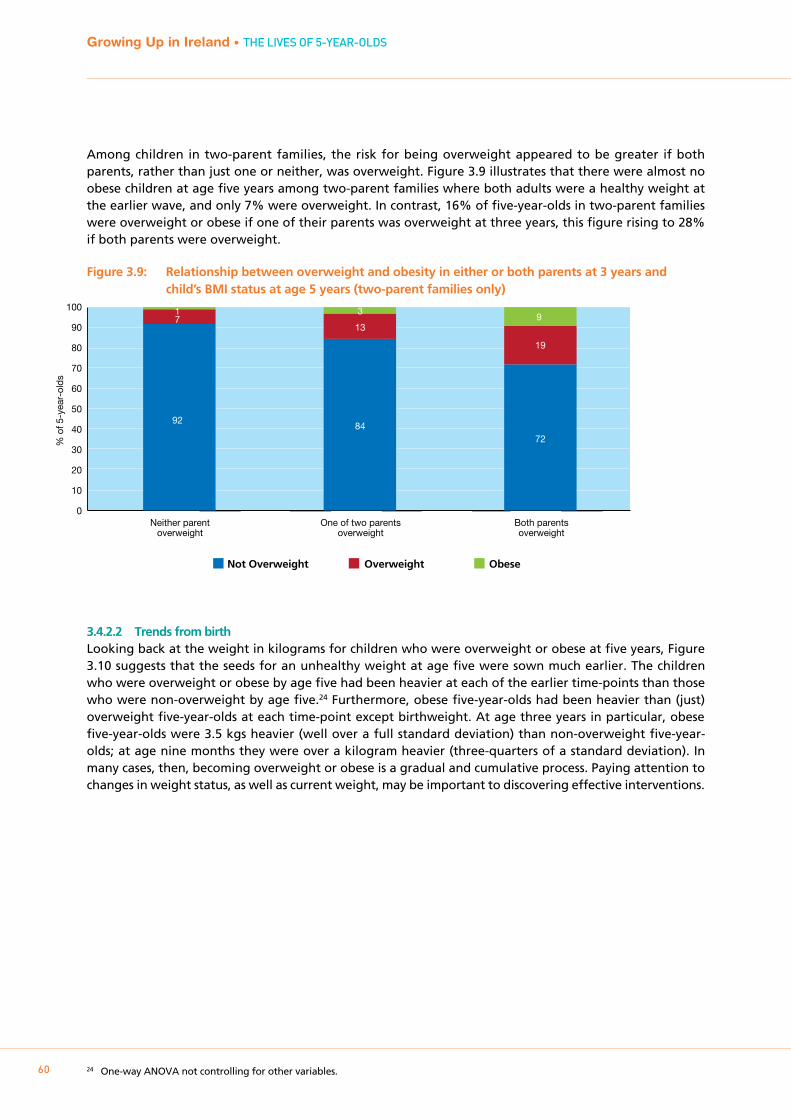
Growing Up in Ireland • THE LIVES OF 5-YEAR-OLDS
60
Among children in two-parent families, the risk for being overweight appeared to be greater if both parents, rather than just one or neither, was overweight. Figure 3.9 illustrates that there were almost no obese children at age five years among two-parent families where both adults were a healthy weight at the earlier wave, and only 7% were overweight. In contrast, 16% of five-year-olds in two-parent families were overweight or obese if one of their parents was overweight at three years, this figure rising to 28% if both parents were overweight.
Figure 3.9: Relationship between overweight and obesity in either or both parents at 3 years and child’s BMI status at age 5 years (two-parent families only)
3.4.2.2 Trends from birthLooking back at the weight in kilograms for children who were overweight or obese at five years, Figure 3.10 suggests that the seeds for an unhealthy weight at age five were sown much earlier. The children who were overweight or obese by age five had been heavier at each of the earlier time-points than those who were non-overweight by age five.24 Furthermore, obese five-year-olds had been heavier than (just) overweight five-year-olds at each time-point except birthweight. At age three years in particular, obese five-year-olds were 3.5 kgs heavier (well over a full standard deviation) than non-overweight five-year-olds; at age nine months they were over a kilogram heavier (three-quarters of a standard deviation). In many cases, then, becoming overweight or obese is a gradual and cumulative process. Paying attention to changes in weight status, as well as current weight, may be important to discovering effective interventions.
24 One-way ANOVA not controlling for other variables.
Neither parent overweight
One of two parents overweight
Both parents overweight
% o
f 5-y
ear-
olds
0
10
20
30
40
50
60
70
80
90
100
Not Overweight Overweight Obese
92 84
72
7 13
19
1 3 9

Growing Up in Ireland • THE LIVES OF 5-YEAR-OLDS
61
Chapter 3 • PHYSIcAL HEALTH AnD DEVELOPmEnT
Figure 3.10: Retrospective trajectories in earlier weight for children who were non-overweight, overweight or obese at age 5 years
3.5 CALORIE INTAkE OF 5-YEAR-OLDS
The Primary Caregiver was asked to complete a detailed diet and nutrition food frequency module in respect of the five-year-old. This allows for more in-depth analysis of dietary patterns.25 Based on the parent reports, the average five-year-old was calculated to have consumed approximately 1,550 calories per day. Boys consumed marginally (but significantly) more calories per day than girls. On average, children from more socially disadvantaged families (regardless of how this was measured) consumed somewhat more calories per day (Figure 3.11).
Figure 3.11: Average calories consumed per day, classified by equivalised income quintile, Primary Caregiver’s education and child’s gender
25 The module was developed by Dr Celine Murrin for use in the LifeWays Study, based in University College Dublin. The instrument has 53 items. The Primary Caregiver recorded the average frequency with which the five-year-old consumed different types of foods and drinks in the last year. Outcome codes include: Never, Less than once per month, At least once per month, At least once per week, Most days, Once a day, 2-3 per day, 4-5 per day, 6+ per day. The resulting in-depth data indicate total consumption of different foods plus the nutrient intake consumed as part of each class of food, along with its calorific value.
Wei
ght i
n kg
.
0
5
10
15
20
25
30
Non-overweight at age 5 Overweight at age 5 Obese at age 5
Birth 9 months 3 years 5 years
1st (Lowest)
Junior Cert or less
Leaving Cert
Certificate / Diploma
Degree or more
Boys Girls5th (Highest)
2nd 3rd 4th
Cal
orie
s (k
cal)
0
200
400
600
800
1000
1200
1400
1600
1800
2000
1696 1630
1543 1489
1401
1733 1656
1568
1400
1571 1525
Income quintile PCG Education Gender
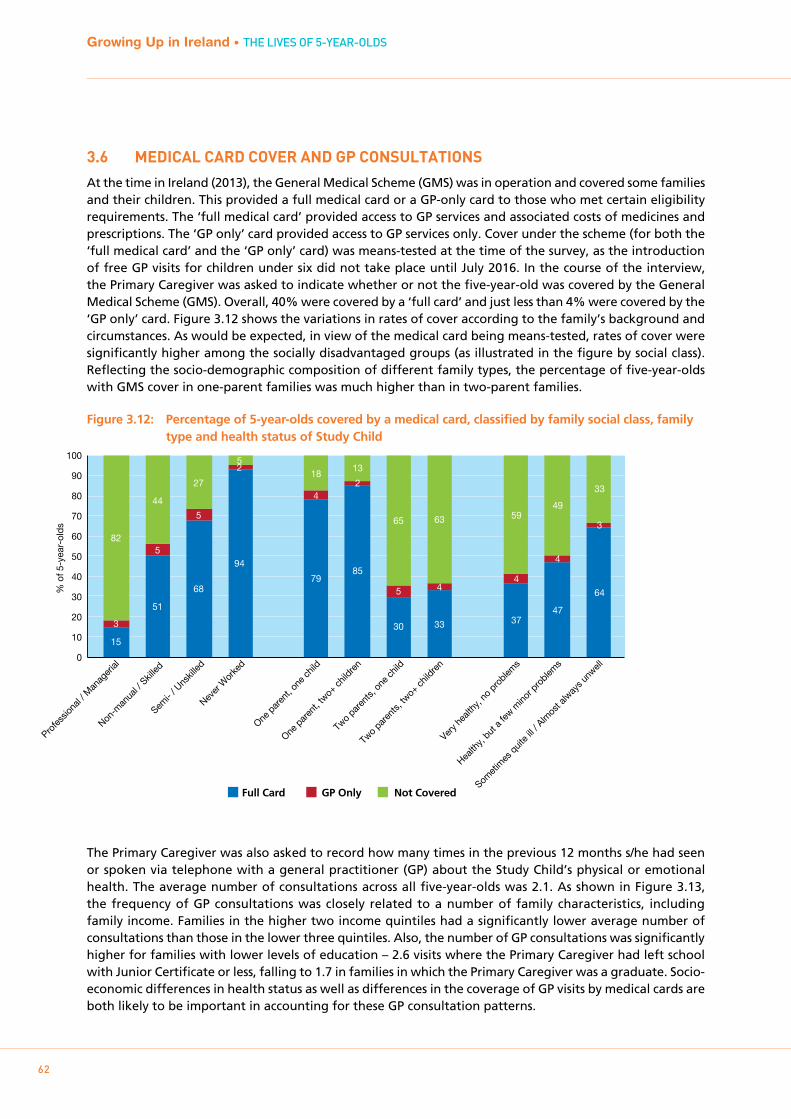
Growing Up in Ireland • THE LIVES OF 5-YEAR-OLDS
62
3.6 mEDICAL CARD COVER AND gp CONSULTATIONS
At the time in Ireland (2013), the General Medical Scheme (GMS) was in operation and covered some families and their children. This provided a full medical card or a GP-only card to those who met certain eligibility requirements. The ‘full medical card’ provided access to GP services and associated costs of medicines and prescriptions. The ‘GP only’ card provided access to GP services only. Cover under the scheme (for both the ‘full medical card’ and the ‘GP only’ card) was means-tested at the time of the survey, as the introduction of free GP visits for children under six did not take place until July 2016. In the course of the interview, the Primary Caregiver was asked to indicate whether or not the five-year-old was covered by the General Medical Scheme (GMS). Overall, 40% were covered by a ‘full card’ and just less than 4% were covered by the ‘GP only’ card. Figure 3.12 shows the variations in rates of cover according to the family’s background and circumstances. As would be expected, in view of the medical card being means-tested, rates of cover were significantly higher among the socially disadvantaged groups (as illustrated in the figure by social class). Reflecting the socio-demographic composition of different family types, the percentage of five-year-olds with GMS cover in one-parent families was much higher than in two-parent families.
Figure 3.12: Percentage of 5-year-olds covered by a medical card, classified by family social class, family type and health status of Study Child
The Primary Caregiver was also asked to record how many times in the previous 12 months s/he had seen or spoken via telephone with a general practitioner (GP) about the Study Child’s physical or emotional health. The average number of consultations across all five-year-olds was 2.1. As shown in Figure 3.13, the frequency of GP consultations was closely related to a number of family characteristics, including family income. Families in the higher two income quintiles had a significantly lower average number of consultations than those in the lower three quintiles. Also, the number of GP consultations was significantly higher for families with lower levels of education – 2.6 visits where the Primary Caregiver had left school with Junior Certificate or less, falling to 1.7 in families in which the Primary Caregiver was a graduate. Socio-economic differences in health status as well as differences in the coverage of GP visits by medical cards are both likely to be important in accounting for these GP consultation patterns.
% o
f 5-y
ear-
olds
0
10
20
30
40
50
60
70
80
90
100
Full Card GP Only Not Covered
Profes
siona
l / M
anag
erial
Non-m
anua
l / Skil
led
Semi-
/ Uns
killed
Never
Wor
ked
One p
aren
t, on
e chil
d
One p
aren
t, tw
o+ ch
ildre
n
Two
paren
ts, o
ne ch
ild
Two
paren
ts, tw
o+ ch
ildre
n
Very h
ealth
y, no
pro
blems
Health
y, but
a few
mino
r pro
blems
Somet
imes
quit
e ill /
Alm
ost a
lway
s unw
ell
15
51
68
94
79 85
30 33 37 47
64
3
5
5
2
4 2
5 4 4
4
3 82
44
27
5 18
13
65 63 59 49
33

Growing Up in Ireland • THE LIVES OF 5-YEAR-OLDS
63
Chapter 3 • PHYSIcAL HEALTH AnD DEVELOPmEnT
Figure 3.13: Average number of consultations with a GP, classified by family income quintile, Primary Caregiver education and Study Child’s health status
As one would expect, the average number of consultations was also strongly related to the child’s health status: 1.4 where the child’s mother described the five-year-old as being ‘Very healthy, no problems’, rising to 3.6 where the child was described as ‘Healthy, a few minor problems’ and to 8.9 in cases where the child was described as ‘Sometimes quite ill/Almost always unwell’. This trend has previously been identified in the older Cohort ’98 at nine years of age and also in the younger Cohort ’08 at three years of age (see Williams et al., 2009, 2013).
Therefore, a possible explanation for the greater number of GP consultations among more disadvantaged families is that the health of children in these families is worse. To explore the possible explanations for the observed relationships, Figure 3.14 summarises the average number of consultations by combined GMS cover and health status of the five-year-old. The message from the chart is clear; across all three categories of maternal-assessed health status, children covered by a medical card had a higher number of consultations with their GP in the previous 12 months than those not covered under the GMS. The difference in the average number of consultations among the children in the ‘Sometimes quite ill/Almost always unwell’ group (10 compared with 7) was not significant, however. As Nolan and Layte (2017) note, medical-card entitlement among more disadvantaged families permits greater use of GP services by removing the financial barrier the family might otherwise face. However, as the authors note, even controlling for differences in health status, eligibility for free GP care would be expected to increase the number of consultations, as also shown in Figure 3.14.
1st (Lowest)
Junior Cert or
less
Leaving Cert
Certificate / Diploma
Degree or more
Very healthy
Healthy / Minor
problem
Quite ill / Unwell
5th (Highest)
2nd 3rd 4th
Num
ber
of G
P C
onsu
ltatio
ns
0.0
2.0
4.0
6.0
8.0
10.0
12.0
2.3 2.3 2.2 1.7 1.6
2.6 2.2 2.0
1.7 1.4
3.6
8.9
Income quintile PCG Education Health Status
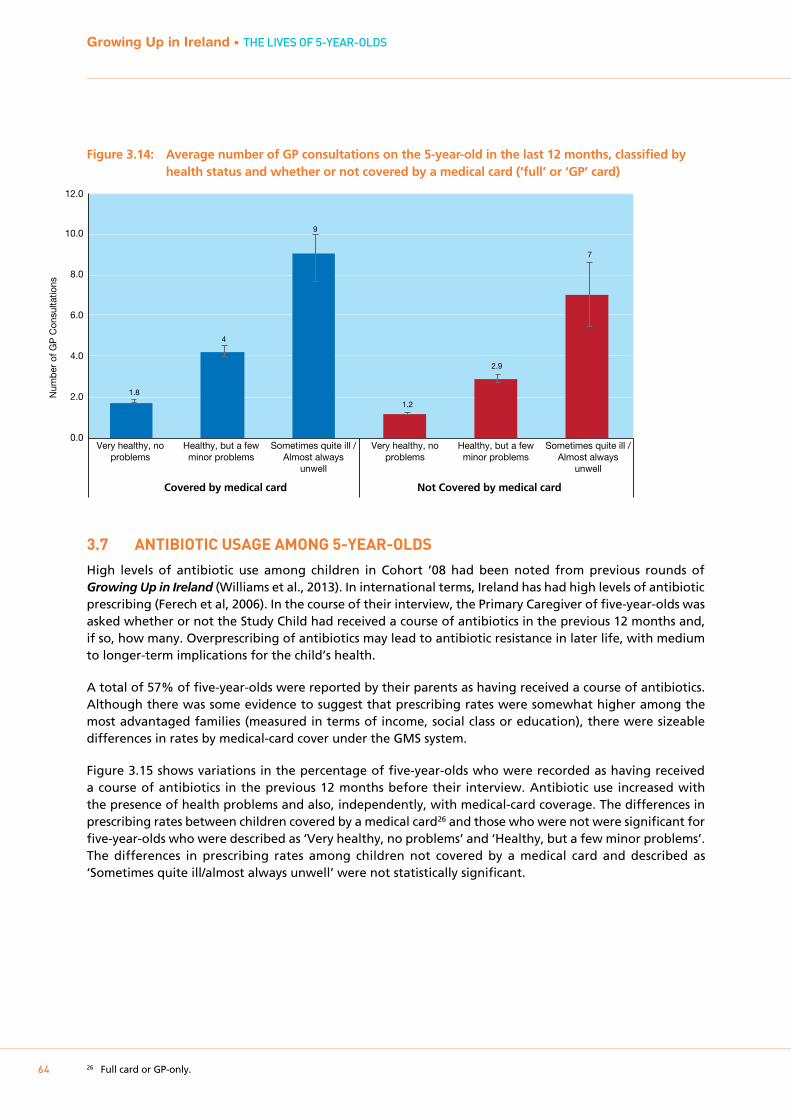
Growing Up in Ireland • THE LIVES OF 5-YEAR-OLDS
64
Figure 3.14: Average number of GP consultations on the 5-year-old in the last 12 months, classified by health status and whether or not covered by a medical card (‘full’ or ‘GP’ card)
3.7 ANTIbIOTIC USAgE AmONg 5-YEAR-OLDS
High levels of antibiotic use among children in Cohort ’08 had been noted from previous rounds of Growing Up in Ireland (Williams et al., 2013). In international terms, Ireland has had high levels of antibiotic prescribing (Ferech et al, 2006). In the course of their interview, the Primary Caregiver of five-year-olds was asked whether or not the Study Child had received a course of antibiotics in the previous 12 months and, if so, how many. Overprescribing of antibiotics may lead to antibiotic resistance in later life, with medium to longer-term implications for the child’s health.
A total of 57% of five-year-olds were reported by their parents as having received a course of antibiotics. Although there was some evidence to suggest that prescribing rates were somewhat higher among the most advantaged families (measured in terms of income, social class or education), there were sizeable differences in rates by medical-card cover under the GMS system.
Figure 3.15 shows variations in the percentage of five-year-olds who were recorded as having received a course of antibiotics in the previous 12 months before their interview. Antibiotic use increased with the presence of health problems and also, independently, with medical-card coverage. The differences in prescribing rates between children covered by a medical card26 and those who were not were significant for five-year-olds who were described as ‘Very healthy, no problems’ and ‘Healthy, but a few minor problems’. The differences in prescribing rates among children not covered by a medical card and described as ‘Sometimes quite ill/almost always unwell’ were not statistically significant.
26 Full card or GP-only.
Very healthy, no problems
Healthy, but a few minor problems
Sometimes quite ill / Almost always
unwell
Very healthy, no problems
Healthy, but a few minor problems
Sometimes quite ill / Almost always
unwell
Num
ber
of G
P C
onsu
ltatio
ns
0.0
2.0
4.0
6.0
8.0
10.0
12.0
1.8
4
9
1.2
2.9
7
Covered by medical card Not Covered by medical card
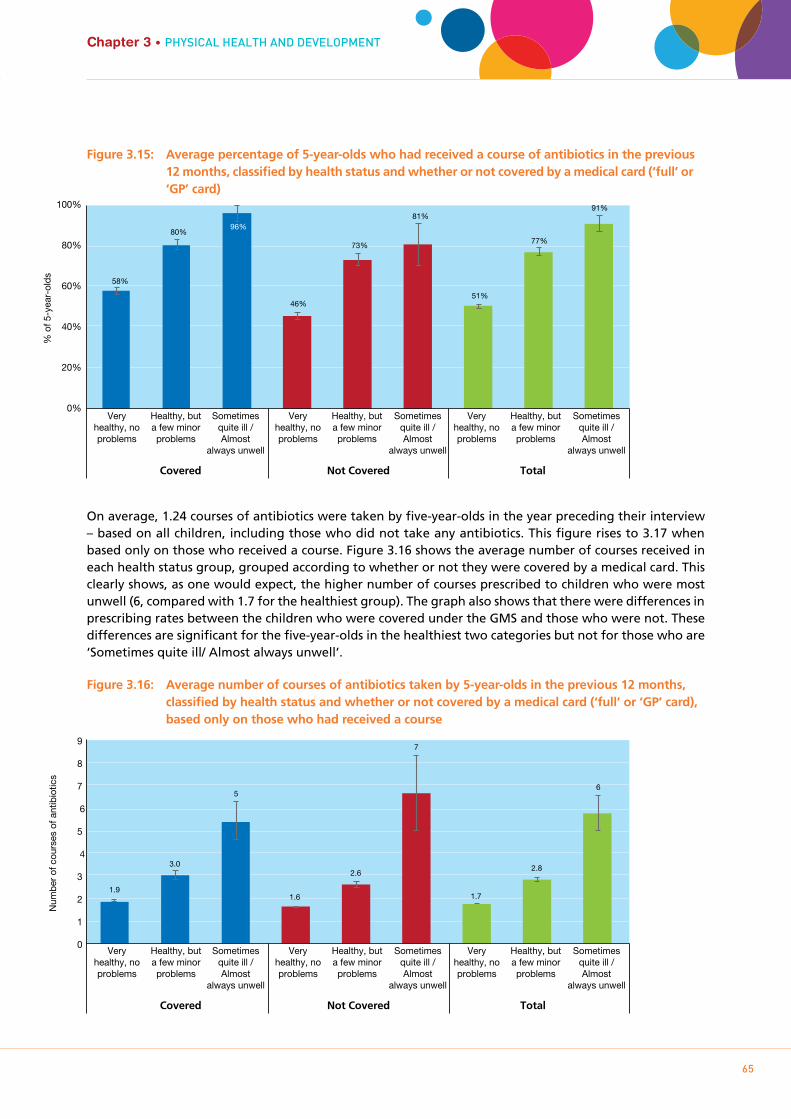
Growing Up in Ireland • THE LIVES OF 5-YEAR-OLDS
65
Chapter 3 • PHYSIcAL HEALTH AnD DEVELOPmEnT
Figure 3.15: Average percentage of 5-year-olds who had received a course of antibiotics in the previous 12 months, classified by health status and whether or not covered by a medical card (‘full’ or ‘GP’ card)
On average, 1.24 courses of antibiotics were taken by five-year-olds in the year preceding their interview – based on all children, including those who did not take any antibiotics. This figure rises to 3.17 when based only on those who received a course. Figure 3.16 shows the average number of courses received in each health status group, grouped according to whether or not they were covered by a medical card. This clearly shows, as one would expect, the higher number of courses prescribed to children who were most unwell (6, compared with 1.7 for the healthiest group). The graph also shows that there were differences in prescribing rates between the children who were covered under the GMS and those who were not. These differences are significant for the five-year-olds in the healthiest two categories but not for those who are ‘Sometimes quite ill/ Almost always unwell’.
Figure 3.16: Average number of courses of antibiotics taken by 5-year-olds in the previous 12 months, classified by health status and whether or not covered by a medical card (‘full’ or ‘GP’ card), based only on those who had received a course
Very healthy, no problems
Healthy, but a few minor problems
Sometimes quite ill / Almost
always unwell
Very healthy, no problems
Healthy, but a few minor problems
Sometimes quite ill / Almost
always unwell
Very healthy, no problems
Healthy, but a few minor problems
Sometimes quite ill / Almost
always unwell
% o
f 5-y
ear-
olds
0%
20%
40%
60%
80%
100%
58%
80% 96%
46%
73%
81%
51%
77%
91%
Covered Not Covered Total
Very healthy, no problems
Healthy, but a few minor problems
Sometimes quite ill / Almost
always unwell
Very healthy, no problems
Healthy, but a few minor problems
Sometimes quite ill / Almost
always unwell
Very healthy, no problems
Healthy, but a few minor problems
Sometimes quite ill / Almost
always unwell
Num
ber
of c
ours
es o
f ant
ibio
tics
Covered Not Covered Total
0
1
2
3
4
5
6
7
8
9
1.9
3.0
5
1.6
2.6
7
1.7
2.8
6

Growing Up in Ireland • THE LIVES OF 5-YEAR-OLDS
66
3.8 SUmmARY
The majority of five-year-olds were reported to be ‘very healthy’ (77%), and most of the remainder were ‘Healthy, but with a few minor problems’ (21%). Despite this, the socio-economic gradient in child’s health that emerged for this cohort at age three years looks to be continuing. For instance, at age five, 80% of children in the highest income quintile were rated as ‘very healthy’ compared to 75% of children in the lowest income quintile. Boys (74%) and children who had been born at low birthweight (71%) were also less likely to be rated as ‘very healthy’.
The percentages for children with a long-standing health condition were similar at ages three and five years (16% and 17% respectively). The most common condition was asthma. This echoes trends observed among nine-year-olds in the older cohort. Once again, being male and low birthweight were risk factors for a chronic illness or disability.
More detail was collected about injuries at age five years than in any previous wave of Growing Up in Ireland. These new data revealed that head injuries (without losing consciousness) were the most common injury type (30% of children with an injury and 8% of all 5-year-olds), and that the child’s home was where most injuries happened (61% of injuries). Over a quarter of five-year-olds had to get medical treatment for an injury at some point in their lives. There were generally few socio-demographic differences in relation to overall injury risk with the exception of child’s gender, with 30% of boys and 25% of girls having sustained an injury.
The Primary Caregivers reported having visited or consulted a GP on the telephone about their child an average of 2.1 times in the previous 12 months. The number of consultations increased with both the child’s health status (as reported by the PCG) and whether the child was covered under the General Medical Scheme. For instance, among children reported as being ‘Very healthy’ the average number of consultations was 1.4, compared to 8.9 for those who were ‘Sometimes quite ill/Almost always unwell’.
Primary caregivers reported that 57% of five-year-olds received a course of antibiotics in the previous 12 months. As was observed in the case of GP consultations, reported prescribing rates were higher for children with health problems and for those covered by the GMS. For instance, among children reported as being ‘healthy, but with a few minor problems’, 80% of those covered by a medical card had been prescribed antibiotics compared to 73% of those not covered.
The final section of this chapter on physical health and development looked at rates and risk factors for being overweight or obese. One-in-five children were overweight (15%) or obese (5%) at age five years, and the risk was greater for girls (23% overweight or obese), children in lower income families (23%), those with overweight parents, and particularly children who had been overweight or obese at the previous wave (three years). Of those who had been overweight at three, 51% were overweight or obese at five and of those who had been obese at three, 75% were overweight or obese at age five. Nevertheless, the fact that nearly half of those who had been overweight at age three were non-overweight by age five shows that improvement is possible.
A common pattern in these new analyses of health and development at five years has been the prevalence of significant differences according to child’s gender. Boys were less likely to be ‘very healthy’ (74% compared to 79% of girls), more likely to have a chronic health condition (21% compared to 15%), and more likely to sustain an injury requiring medical attention (30% compared to 25%). The only area in which boys fared better than girls was in relation to being overweight/obesity (18% compared to 23% of girls).
Growing Up in Ireland • THE LIVES OF 5-YEAR-OLDS
67
Chapter 3 • PHYSIcAL HEALTH AnD DEVELOPmEnT
As noted at the outset, the analysis in this descriptive report has focused on overall patterns and variations by a limited number of socio-demographic characteristics. There is potential for a much more detailed analysis of the associations and patterns across outcomes, such as the links between obesity and general health or between dietary patterns and general health status. In addition, it was beyond the scope of this chapter to examine the potentially mediating role of factors such as parent-child relationship, parental depression and family financial stress in accounting for the patterns by social class and maternal education. Further in-depth analysis of these issues may provide additional useful insights into areas where policy intervention may be worthwhile.

Chapter 4SOcIO-EmOTIOnAL DEVELOPmEnT AnD PLAY
69
Growing Up in Ireland • THE LIVES OF 5-YEAR-OLDS
70
4.1 INTRODUCTION
4.1.1 bACkgROUNDOne of the biggest changes in the lives of most children at five years old is starting school. Ireland has traditionally had a much earlier start to formal schooling (ages 4-5 years) than other European countries (Eivers and Clerkin, 2013). Aside from the emotional adjustment required for this major transition, research suggests that social, emotional and behavioural skills, as well as cognitive ones, are important for school readiness (Smart et al., 2008; Forget-Dubois et al., 2007).
The child’s socio-emotional and cognitive skills develop in tandem, with representational thought, self-regulation and planning all being important components of school-readiness (Hyson et al., 2006). For example, expanding skills in vocabulary help children to better communicate their needs to caregivers, to ‘label’ and recognise their emotional states, and to co-operate in games with other children. Likewise, the child’s enhanced ability to self-regulate their behaviour, maintain concentration and be emotionally secure enough to spend the school day away from their parents facilitates their learning, particularly in a school environment.
By age five years, children have a more proactive role in the construction of their social world (see Qvortrup et al., 2009). Both the need to negotiate and the desire to interact with peers become a more prominent feature of their everyday context (Corsaro and Eder, 1990), particularly as many will have started formal schooling. With adults too, children will typically be able for more complex social interactions, facilitated by better understanding of another’s perspective, having more emotional control and growing language skills (e.g. Centres for Disease Control and Prevention, 2017). In turn, adult expectations for the child’s behaviour will likely have increased compared to when they were only three years old.
From the perspective of a major theory of psychosocial development such as that of Erikson (1968), age five years is a time when the individual seeks purpose in their everyday life – such as exploring through play – and will start to become orientated towards developing their skills and competence in all areas. Theories of moral development (such as Kohlberg, 1984) suggest that, at age five years, children have yet to solidify a sense of morality per se and are guided more by adult-imposed rules and the consequences or punishments for breaking those rules. Nonetheless, five-year-olds would be expected to have improved their capacity for understanding other’s feelings compared to earlier ages; research suggests that the development of empathy is guided both by genetics and shared environment (Knafo et al., 2008). To reflect greater socio-emotional complexity and capacity, at age five years in Growing Up in Ireland, parents were asked about a wider range of social skills, including empathy and assertion.
Play is an important mechanism for children’s socio-emotional and cognitive development. An understanding of the importance of play has evolved from an early 20th century view of it as a simple means of expending surplus childhood energy to a key activity that influences brain development, and social, cognitive and language skills, and a possible avenue for healing after traumatic experiences (Hyder, 2004). A number of theorists (including Piaget, 1936; Vygotsky, 1978) have particularly emphasised play as a mechanism for developing skills in symbolic representation and perspective-taking (Passer et al., 2009). Play may be a solo activity, with peers or with adults. Influential work by Bandura (1963) and colleagues demonstrated how children imitate the observed behaviour of adults (in that case, aggressive behaviour) in their play; this furthered concerns about the impact on children’s social development of watching violent television content. Better Outcomes, Brighter Futures, the national policy framework for children and young people, recognises the importance of play in children’s lives, both as a contributor to child development and because it is enjoyable. One of the aims of the framework is to ensure that children are “enjoying play, recreation, sports, arts, culture and nature” (Department of Children and Youth Affairs, 2014, p. 49) since these “are essential to the health and wellbeing of children and young people, and promote the development of

Growing Up in Ireland • THE LIVES OF 5-YEAR-OLDS
71
Chapter 4 • SOcIO-EmOTIOnAL DEVELOPmEnT AnD PLAY
creativity, imagination, self-confidence and self-efficacy, as well as physical, social, cognitive and emotional strength and skills” (p. 55).
Increasingly at five years, children are spending prolonged portions of their free time on screen-based activities (Growing Up in Ireland Study Team, 2013). This has been facilitated by a rise in mobile devices such as tablets and smartphones that children can use to watch television, play video games and access the Internet. Recent indicators (e.g. Ofcom UK report, 2013) suggest that a majority of families now have these devices in the home and they are frequently used by young children. There are concerns that excessive use of such devices will have negative repercussions for children’s physical and socio-emotional wellbeing (see Murray & Morgan, in press, for a review). The national policy framework for children and young people sets out the need “to better understand and respond to the increasing influences on childhood of new technologies, digital media, sexualisation and commercialisation” (DCYA, 2014, p.xii) as part of its priority of “promoting positive influences for childhood”.
As noted in Chapter 1, unless explicitly stated, all of the findings and patterns discussed in the text of this chapter are statistically significant at the 5% level.
4.1.2 kEY FINDINgS FROm COHORT ’08 AT 3 YEARSThe Strengths and Difficulties (SDQ) questionnaire (Goodman, 1997) is a widely used screening instrument to measure socio-emotional and behavioural wellbeing (and potential problems) in children and young people. In Growing Up in Ireland, it was completed by the Primary Caregiver at three years, as well as at five years of age. Parents rated their children on items related to four ‘problem’ areas (hyperactivity, emotionality, conduct problems and peer problems) that sum to a ‘total difficulties’ score. Example items include whether the child ‘often has temper tantrums or hot tempers’ (emotionality) or is ‘easily distracted, concentration wanders’ (hyperactivity). Parents also rated their children on items related to positive social behaviour (‘pro-social’ subscale). Higher scores on the pro-social scale indicate more positive behaviour; parents are asked if their child ‘has at least one good friend’ or ‘often volunteers to help others’.
The top decile of the ‘total difficulties’ scale can be used to identify a group of children ‘at risk’ of socio-emotional or behavioural problems (Goodman, 1997). It is important to note that the SDQ ‘total difficulties’ scale is a screening tool, identifying children who may be at risk of such problems rather than a diagnostic tool that can definitively establish the presence of such problems.
At three years, children generally performed quite well on the SDQ; scoring low in terms of emotional, conduct, hyperactivity and peer problems, but high in terms of pro-social behaviour. However, boys and children living in socio-economic disadvantage were more likely to be ‘at risk’ of socio-emotional or behavioural problems. An association between socio-economic disadvantage and higher durations of television-watching was also observed; high levels of screen-time are associated with being in the top (‘at risk’) decile on the ‘total difficulties’ scale (Egan & Murray, 2014). Other factors associated with less favourable SDQ scores at three years were parenting styles characterised by low warmth and consistency or high hostility, and having been rated as a more difficult infant temperamentally at nine months.
4.2 STRENgTHS AND DIFFICULTIES qUESTIONNAIRE
4.2.1 pARENT REpORTIn Growing Up in Ireland, at ages three and five years, the main indicator of the child’s socio-emotional and behavioural wellbeing was the parent-reported Strengths and Difficulties Questionnaire (SDQ) (with teachers also completing the SDQ at 5 years). The scale is described in detail in the appendix. Table 4.1 outlines the mean scores and achieved ranges on each subscale at five years, the total score, and the percentage of children scoring 0 on each of the difficulties subscales (i.e. no problems at all indicated in
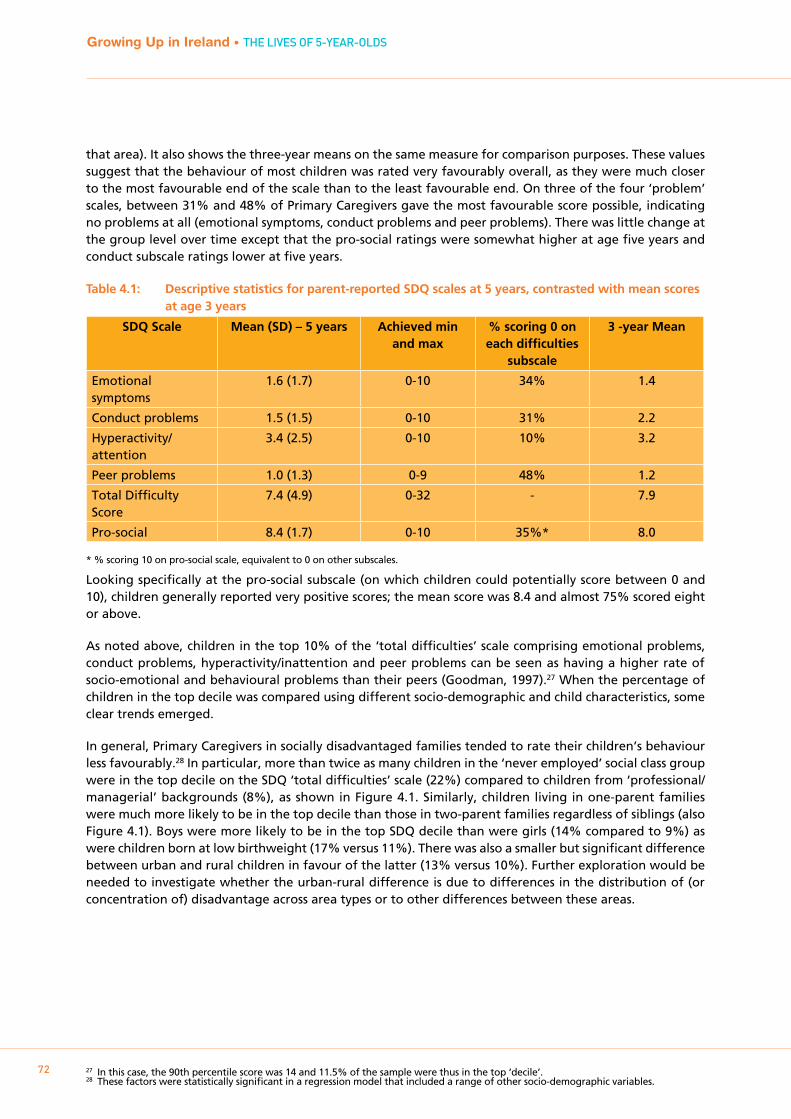
Growing Up in Ireland • THE LIVES OF 5-YEAR-OLDS
72
that area). It also shows the three-year means on the same measure for comparison purposes. These values suggest that the behaviour of most children was rated very favourably overall, as they were much closer to the most favourable end of the scale than to the least favourable end. On three of the four ‘problem’ scales, between 31% and 48% of Primary Caregivers gave the most favourable score possible, indicating no problems at all (emotional symptoms, conduct problems and peer problems). There was little change at the group level over time except that the pro-social ratings were somewhat higher at age five years and conduct subscale ratings lower at five years.
Table 4.1: Descriptive statistics for parent-reported SDQ scales at 5 years, contrasted with mean scores at age 3 years
SDQ Scale Mean (SD) – 5 years Achieved min and max
% scoring 0 on each difficulties
subscale
3 -year Mean
Emotional symptoms
1.6 (1.7) 0-10 34% 1.4
Conduct problems 1.5 (1.5) 0-10 31% 2.2
Hyperactivity/attention
3.4 (2.5) 0-10 10% 3.2
Peer problems 1.0 (1.3) 0-9 48% 1.2
Total Difficulty Score
7.4 (4.9) 0-32 - 7.9
Pro-social 8.4 (1.7) 0-10 35%* 8.0
* % scoring 10 on pro-social scale, equivalent to 0 on other subscales.
Looking specifically at the pro-social subscale (on which children could potentially score between 0 and 10), children generally reported very positive scores; the mean score was 8.4 and almost 75% scored eight or above.
As noted above, children in the top 10% of the ‘total difficulties’ scale comprising emotional problems, conduct problems, hyperactivity/inattention and peer problems can be seen as having a higher rate of socio-emotional and behavioural problems than their peers (Goodman, 1997).27 When the percentage of children in the top decile was compared using different socio-demographic and child characteristics, some clear trends emerged.
In general, Primary Caregivers in socially disadvantaged families tended to rate their children’s behaviour less favourably.28 In particular, more than twice as many children in the ‘never employed’ social class group were in the top decile on the SDQ ‘total difficulties’ scale (22%) compared to children from ‘professional/managerial’ backgrounds (8%), as shown in Figure 4.1. Similarly, children living in one-parent families were much more likely to be in the top decile than those in two-parent families regardless of siblings (also Figure 4.1). Boys were more likely to be in the top SDQ decile than were girls (14% compared to 9%) as were children born at low birthweight (17% versus 11%). There was also a smaller but significant difference between urban and rural children in favour of the latter (13% versus 10%). Further exploration would be needed to investigate whether the urban-rural difference is due to differences in the distribution of (or concentration of) disadvantage across area types or to other differences between these areas.
27 In this case, the 90th percentile score was 14 and 11.5% of the sample were thus in the top ‘decile’.28 These factors were statistically significant in a regression model that included a range of other socio-demographic variables.
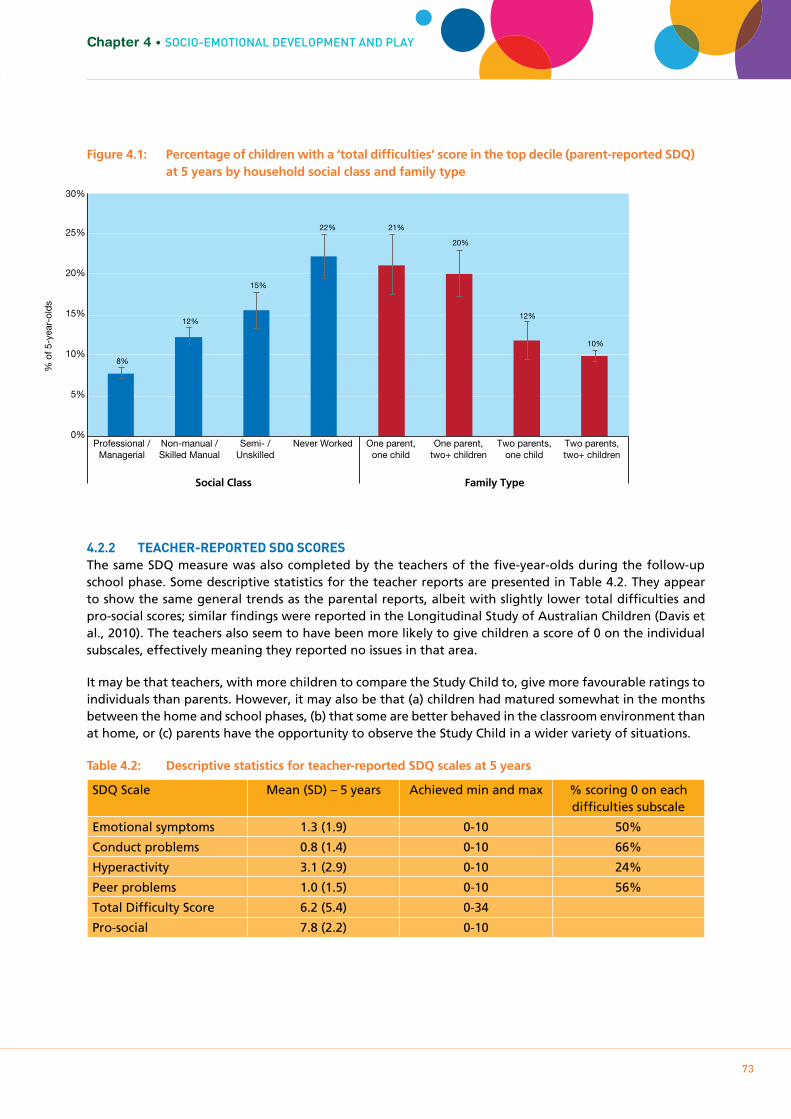
Growing Up in Ireland • THE LIVES OF 5-YEAR-OLDS
73
Chapter 4 • SOcIO-EmOTIOnAL DEVELOPmEnT AnD PLAY
Figure 4.1: Percentage of children with a ‘total difficulties’ score in the top decile (parent-reported SDQ) at 5 years by household social class and family type
4.2.2 TEACHER-REpORTED SDq SCORESThe same SDQ measure was also completed by the teachers of the five-year-olds during the follow-up school phase. Some descriptive statistics for the teacher reports are presented in Table 4.2. They appear to show the same general trends as the parental reports, albeit with slightly lower total difficulties and pro-social scores; similar findings were reported in the Longitudinal Study of Australian Children (Davis et al., 2010). The teachers also seem to have been more likely to give children a score of 0 on the individual subscales, effectively meaning they reported no issues in that area.
It may be that teachers, with more children to compare the Study Child to, give more favourable ratings to individuals than parents. However, it may also be that (a) children had matured somewhat in the months between the home and school phases, (b) that some are better behaved in the classroom environment than at home, or (c) parents have the opportunity to observe the Study Child in a wider variety of situations.
Table 4.2: Descriptive statistics for teacher-reported SDQ scales at 5 years
SDQ Scale Mean (SD) – 5 years Achieved min and max % scoring 0 on each difficulties subscale
Emotional symptoms 1.3 (1.9) 0-10 50%
Conduct problems 0.8 (1.4) 0-10 66%
Hyperactivity 3.1 (2.9) 0-10 24%
Peer problems 1.0 (1.5) 0-10 56%
Total Difficulty Score 6.2 (5.4) 0-34
Pro-social 7.8 (2.2) 0-10
Non-manual / Skilled Manual
Professional / Managerial
Never Worked Semi- / Unskilled
One parent, two+ children
One parent, one child
Two parents, two+ children
Two parents, one child
% o
f 5-y
ear-
olds
0%
5%
10%
15%
20%
25%
30%
8%
12%
15%
22% 21%
20%
12%
10%
Social Class Family Type
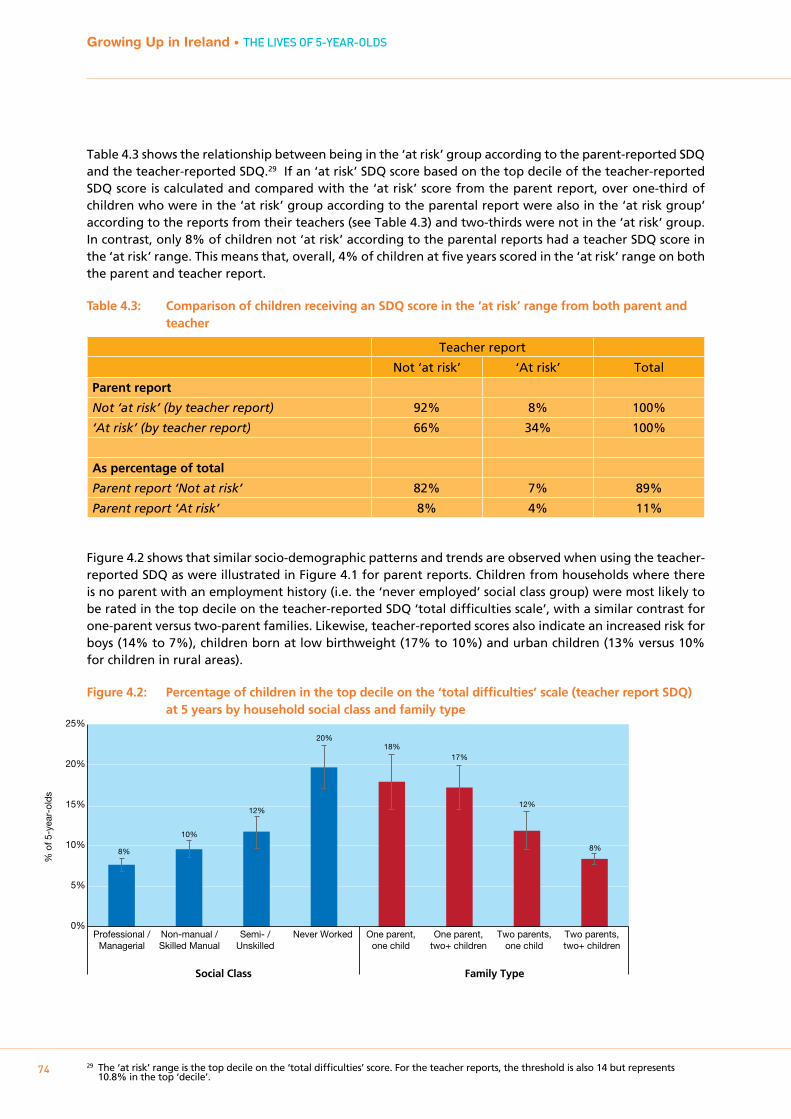
Growing Up in Ireland • THE LIVES OF 5-YEAR-OLDS
74
Table 4.3 shows the relationship between being in the ‘at risk’ group according to the parent-reported SDQ and the teacher-reported SDQ.29 If an ‘at risk’ SDQ score based on the top decile of the teacher-reported SDQ score is calculated and compared with the ‘at risk’ score from the parent report, over one-third of children who were in the ‘at risk’ group according to the parental report were also in the ‘at risk group’ according to the reports from their teachers (see Table 4.3) and two-thirds were not in the ‘at risk’ group. In contrast, only 8% of children not ‘at risk’ according to the parental reports had a teacher SDQ score in the ‘at risk’ range. This means that, overall, 4% of children at five years scored in the ‘at risk’ range on both the parent and teacher report.
Table 4.3: Comparison of children receiving an SDQ score in the ‘at risk’ range from both parent and teacher
Teacher report
Not ‘at risk’ ‘At risk’ Total
Parent report
Not ‘at risk’ (by teacher report) 92% 8% 100%
‘At risk’ (by teacher report) 66% 34% 100%
As percentage of total
Parent report ‘Not at risk’ 82% 7% 89%
Parent report ‘At risk’ 8% 4% 11%
Figure 4.2 shows that similar socio-demographic patterns and trends are observed when using the teacher-reported SDQ as were illustrated in Figure 4.1 for parent reports. Children from households where there is no parent with an employment history (i.e. the ‘never employed’ social class group) were most likely to be rated in the top decile on the teacher-reported SDQ ‘total difficulties scale’, with a similar contrast for one-parent versus two-parent families. Likewise, teacher-reported scores also indicate an increased risk for boys (14% to 7%), children born at low birthweight (17% to 10%) and urban children (13% versus 10% for children in rural areas).
Figure 4.2: Percentage of children in the top decile on the ‘total difficulties’ scale (teacher report SDQ) at 5 years by household social class and family type
29 The ‘at risk’ range is the top decile on the ‘total difficulties’ score. For the teacher reports, the threshold is also 14 but represents 10.8% in the top ‘decile’.
Non-manual / Skilled Manual
Professional / Managerial
Never Worked Semi- / Unskilled
One parent, two+ children
One parent, one child
Two parents, two+ children
Two parents, one child
% o
f 5-y
ear-
olds
0%
5%
10%
15%
20%
25%
Social Class Family Type
8%
10%
12%
20% 18%
17%
12%
8%
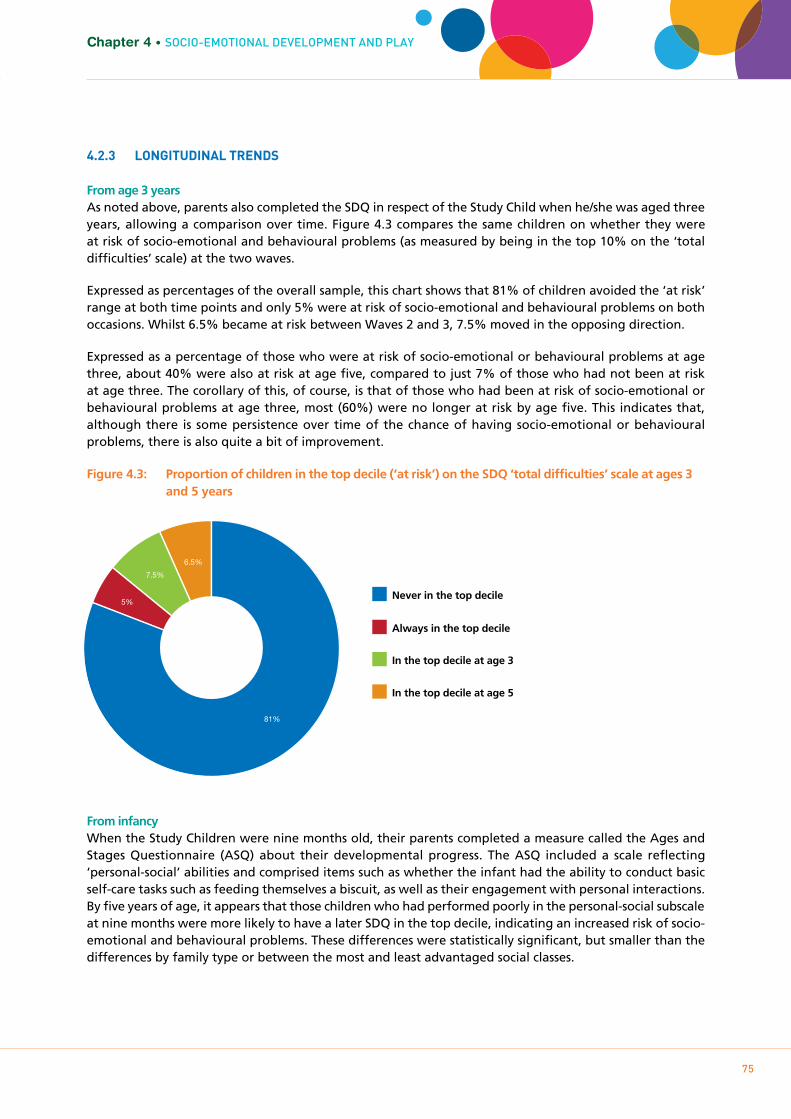
Growing Up in Ireland • THE LIVES OF 5-YEAR-OLDS
75
Chapter 4 • SOcIO-EmOTIOnAL DEVELOPmEnT AnD PLAY
4.2.3 LONgITUDINAL TRENDS
From age 3 yearsAs noted above, parents also completed the SDQ in respect of the Study Child when he/she was aged three years, allowing a comparison over time. Figure 4.3 compares the same children on whether they were at risk of socio-emotional and behavioural problems (as measured by being in the top 10% on the ‘total difficulties’ scale) at the two waves.
Expressed as percentages of the overall sample, this chart shows that 81% of children avoided the ‘at risk’ range at both time points and only 5% were at risk of socio-emotional and behavioural problems on both occasions. Whilst 6.5% became at risk between Waves 2 and 3, 7.5% moved in the opposing direction.
Expressed as a percentage of those who were at risk of socio-emotional or behavioural problems at age three, about 40% were also at risk at age five, compared to just 7% of those who had not been at risk at age three. The corollary of this, of course, is that of those who had been at risk of socio-emotional or behavioural problems at age three, most (60%) were no longer at risk by age five. This indicates that, although there is some persistence over time of the chance of having socio-emotional or behavioural problems, there is also quite a bit of improvement.
Figure 4.3: Proportion of children in the top decile (‘at risk’) on the SDQ ‘total difficulties’ scale at ages 3 and 5 years
From infancyWhen the Study Children were nine months old, their parents completed a measure called the Ages and Stages Questionnaire (ASQ) about their developmental progress. The ASQ included a scale reflecting ‘personal-social’ abilities and comprised items such as whether the infant had the ability to conduct basic self-care tasks such as feeding themselves a biscuit, as well as their engagement with personal interactions. By five years of age, it appears that those children who had performed poorly in the personal-social subscale at nine months were more likely to have a later SDQ in the top decile, indicating an increased risk of socio-emotional and behavioural problems. These differences were statistically significant, but smaller than the differences by family type or between the most and least advantaged social classes.
In the top decile at age 5
In the top decile at age 3
Always in the top decile
Never in the top decile
81%
5%
7.5%
6.5%
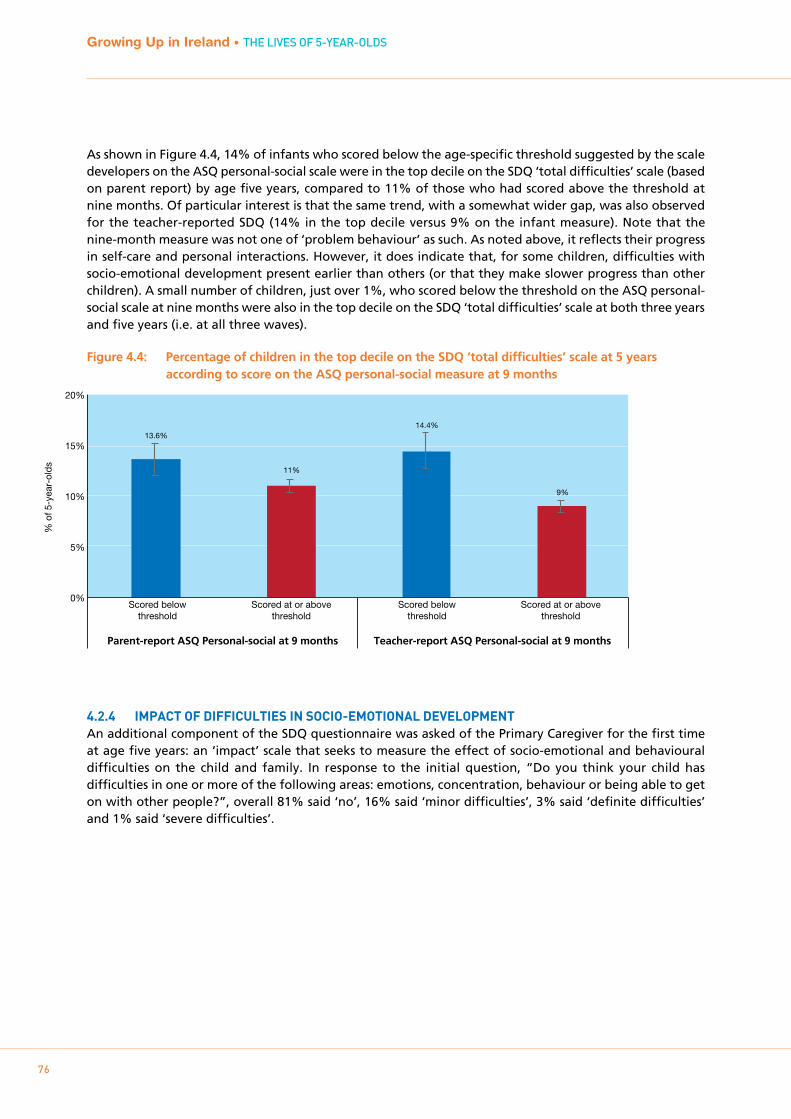
Growing Up in Ireland • THE LIVES OF 5-YEAR-OLDS
76
As shown in Figure 4.4, 14% of infants who scored below the age-specific threshold suggested by the scale developers on the ASQ personal-social scale were in the top decile on the SDQ ‘total difficulties’ scale (based on parent report) by age five years, compared to 11% of those who had scored above the threshold at nine months. Of particular interest is that the same trend, with a somewhat wider gap, was also observed for the teacher-reported SDQ (14% in the top decile versus 9% on the infant measure). Note that the nine-month measure was not one of ‘problem behaviour’ as such. As noted above, it reflects their progress in self-care and personal interactions. However, it does indicate that, for some children, difficulties with socio-emotional development present earlier than others (or that they make slower progress than other children). A small number of children, just over 1%, who scored below the threshold on the ASQ personal-social scale at nine months were also in the top decile on the SDQ ‘total difficulties’ scale at both three years and five years (i.e. at all three waves).
Figure 4.4: Percentage of children in the top decile on the SDQ ‘total difficulties’ scale at 5 years according to score on the ASQ personal-social measure at 9 months
4.2.4 ImpACT OF DIFFICULTIES IN SOCIO-EmOTIONAL DEVELOpmENTAn additional component of the SDQ questionnaire was asked of the Primary Caregiver for the first time at age five years: an ‘impact’ scale that seeks to measure the effect of socio-emotional and behavioural difficulties on the child and family. In response to the initial question, “Do you think your child has difficulties in one or more of the following areas: emotions, concentration, behaviour or being able to get on with other people?”, overall 81% said ‘no’, 16% said ‘minor difficulties’, 3% said ‘definite difficulties’ and 1% said ‘severe difficulties’.
Scored below threshold
Scored at or above threshold
Scored below threshold
Scored at or above threshold
% o
f 5-y
ear-
olds
0%
5%
10%
15%
20%
13.6%
11%
14.4%
9%
Parent-report ASQ Personal-social at 9 months Teacher-report ASQ Personal-social at 9 months
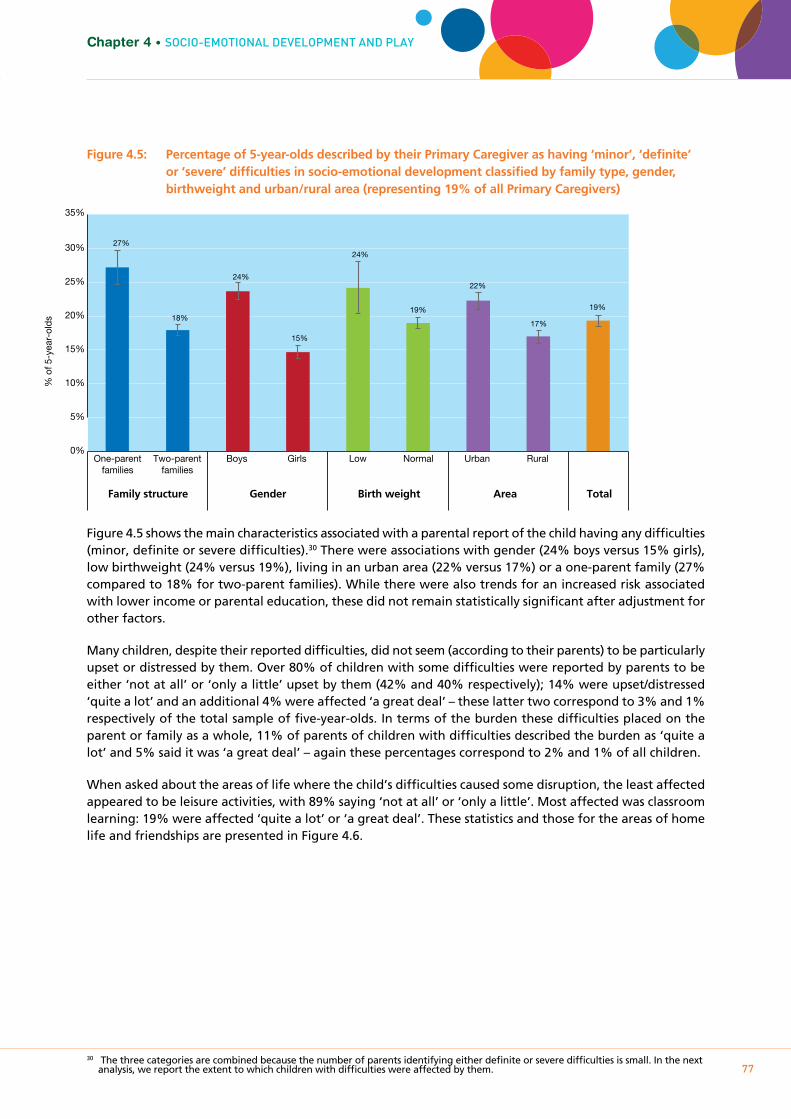
Growing Up in Ireland • THE LIVES OF 5-YEAR-OLDS
77
Chapter 4 • SOcIO-EmOTIOnAL DEVELOPmEnT AnD PLAY
Figure 4.5: Percentage of 5-year-olds described by their Primary Caregiver as having ‘minor’, ‘definite’ or ‘severe’ difficulties in socio-emotional development classified by family type, gender, birthweight and urban/rural area (representing 19% of all Primary Caregivers)
Figure 4.5 shows the main characteristics associated with a parental report of the child having any difficulties (minor, definite or severe difficulties).30 There were associations with gender (24% boys versus 15% girls), low birthweight (24% versus 19%), living in an urban area (22% versus 17%) or a one-parent family (27% compared to 18% for two-parent families). While there were also trends for an increased risk associated with lower income or parental education, these did not remain statistically significant after adjustment for other factors.
Many children, despite their reported difficulties, did not seem (according to their parents) to be particularly upset or distressed by them. Over 80% of children with some difficulties were reported by parents to be either ‘not at all’ or ‘only a little’ upset by them (42% and 40% respectively); 14% were upset/distressed ‘quite a lot’ and an additional 4% were affected ‘a great deal’ – these latter two correspond to 3% and 1% respectively of the total sample of five-year-olds. In terms of the burden these difficulties placed on the parent or family as a whole, 11% of parents of children with difficulties described the burden as ‘quite a lot’ and 5% said it was ‘a great deal’ – again these percentages correspond to 2% and 1% of all children.
When asked about the areas of life where the child’s difficulties caused some disruption, the least affected appeared to be leisure activities, with 89% saying ‘not at all’ or ‘only a little’. Most affected was classroom learning: 19% were affected ‘quite a lot’ or ‘a great deal’. These statistics and those for the areas of home life and friendships are presented in Figure 4.6.
30 The three categories are combined because the number of parents identifying either definite or severe difficulties is small. In the next analysis, we report the extent to which children with difficulties were affected by them.
One-parent families
Two-parent families
Boys Low Urban Rural Normal Girls
% o
f 5-y
ear-
olds
0%
5%
10%
15%
20%
25%
30%
35%
27%
18%
24%
15%
24%
19%
22%
17%
19%
Family structure Gender Birth weight Area Total
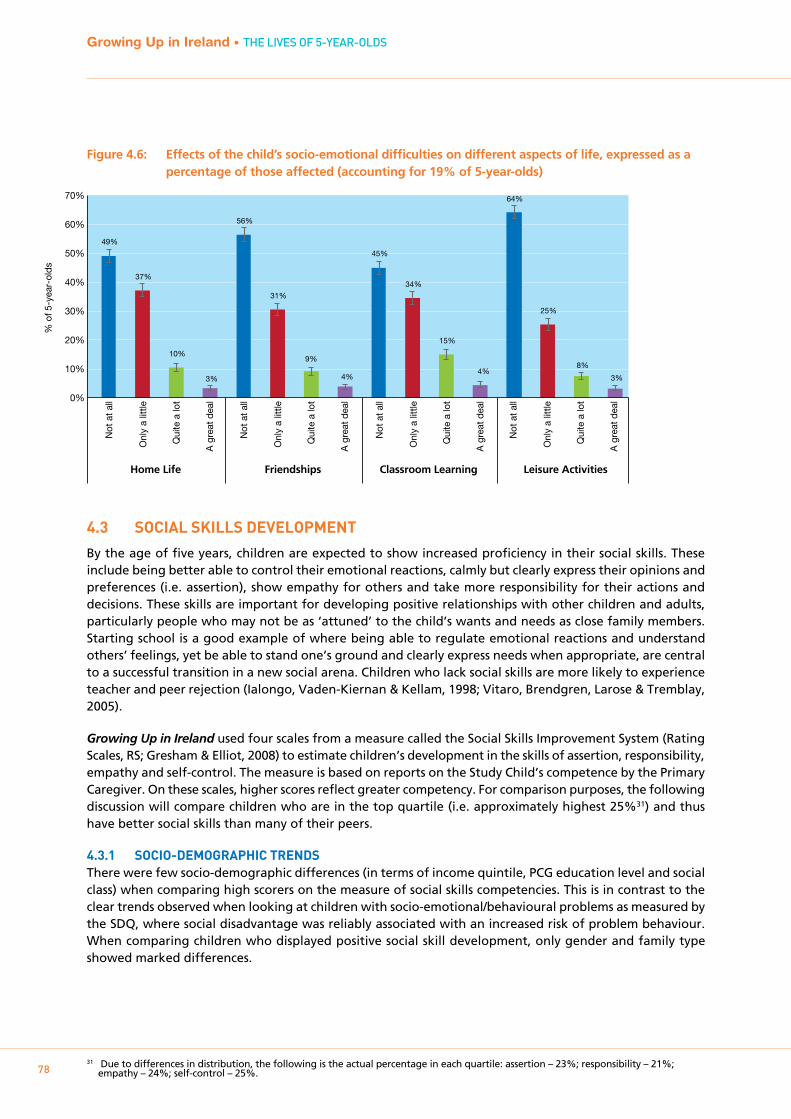
Growing Up in Ireland • THE LIVES OF 5-YEAR-OLDS
78
Figure 4.6: Effects of the child’s socio-emotional difficulties on different aspects of life, expressed as a percentage of those affected (accounting for 19% of 5-year-olds)
4.3 SOCIAL SkILLS DEVELOpmENT
By the age of five years, children are expected to show increased proficiency in their social skills. These include being better able to control their emotional reactions, calmly but clearly express their opinions and preferences (i.e. assertion), show empathy for others and take more responsibility for their actions and decisions. These skills are important for developing positive relationships with other children and adults, particularly people who may not be as ‘attuned’ to the child’s wants and needs as close family members. Starting school is a good example of where being able to regulate emotional reactions and understand others’ feelings, yet be able to stand one’s ground and clearly express needs when appropriate, are central to a successful transition in a new social arena. Children who lack social skills are more likely to experience teacher and peer rejection (Ialongo, Vaden-Kiernan & Kellam, 1998; Vitaro, Brendgren, Larose & Tremblay, 2005).
Growing Up in Ireland used four scales from a measure called the Social Skills Improvement System (Rating Scales, RS; Gresham & Elliot, 2008) to estimate children’s development in the skills of assertion, responsibility, empathy and self-control. The measure is based on reports on the Study Child’s competence by the Primary Caregiver. On these scales, higher scores reflect greater competency. For comparison purposes, the following discussion will compare children who are in the top quartile (i.e. approximately highest 25%31) and thus have better social skills than many of their peers.
4.3.1 SOCIO-DEmOgRApHIC TRENDSThere were few socio-demographic differences (in terms of income quintile, PCG education level and social class) when comparing high scorers on the measure of social skills competencies. This is in contrast to the clear trends observed when looking at children with socio-emotional/behavioural problems as measured by the SDQ, where social disadvantage was reliably associated with an increased risk of problem behaviour. When comparing children who displayed positive social skill development, only gender and family type showed marked differences.
31 Due to differences in distribution, the following is the actual percentage in each quartile: assertion – 23%; responsibility – 21%; empathy – 24%; self-control – 25%.
% o
f 5-y
ear-
olds
0%
10%
20%
30%
40%
50%
60%
70%
49%
37%
10%
3%
56%
31%
9%
4%
45%
34%
15%
4%
64%
25%
8%
3%
Home Life Friendships Classroom Learning Leisure Activities
Not
at a
ll
Onl
y a
little
Qui
te a
lot
A g
reat
dea
l
Not
at a
ll
Onl
y a
little
Qui
te a
lot
A g
reat
dea
l
Not
at a
ll
Onl
y a
little
Qui
te a
lot
A g
reat
dea
l
Not
at a
ll
Onl
y a
little
Qui
te a
lot
A g
reat
dea
l

Growing Up in Ireland • THE LIVES OF 5-YEAR-OLDS
79
Chapter 4 • SOcIO-EmOTIOnAL DEVELOPmEnT AnD PLAY
Figure 4.7: Percentage of 5-year-olds in the top quartile for each of the social skills scales (assertion, responsibility, empathy and self-control) according to their family type
Figure 4.7 shows the trends in relation to family type for the four skill sets of assertion, responsibility, empathy and self-control. For each competency, it is evident that individuals who are an only child living with two parents are the most likely to be in the highest-scoring quartile. In contrast, children who live with siblings and one parent tend to feature in the top-quartile least often. The largest contrast is observed for self-control; 32% of children in two-parent/one-child families are in the top quartile compared to just 17% of those in one-parent/multi-child families. The pattern for the other two family types – one-parent/one-child and two-parent/multi-child – is more mixed: for assertion, the latter do better than the former but in other areas they are roughly equivalent.
The other characteristic where differences in social skills are observed is gender. For all four areas of social skills competencies, girls are more likely to be in the top quartile than boys. This pattern is illustrated in Figure 4.8. The biggest difference was observed in relation to empathy, with 29% of girls in the top quartile compared to just 20% of boys.
% o
f 5-y
ear-
olds
One
par
ent,
one
child
One
par
ent,
two+
chi
ldre
n
Two
pare
nts,
one
chi
ld
Two
pare
nts,
two+
chi
ldre
n
One
par
ent,
one
child
One
par
ent,
two+
chi
ldre
n
Two
pare
nts,
one
chi
ld
Two
pare
nts,
two+
chi
ldre
n
One
par
ent,
one
child
One
par
ent,
two+
chi
ldre
n
Two
pare
nts,
one
chi
ld
Two
pare
nts,
two+
chi
ldre
n
One
par
ent,
one
child
One
par
ent,
two+
chi
ldre
n
Two
pare
nts,
one
chi
ld
Two
pare
nts,
two+
chi
ldre
n
0%
5%
10%
15%
20%
25%
30%
35%
40%
15%
19%
24%
23% 21%
19%
27%
21%
26%
23%
30%
24%
27%
17%
32%
25%
Assertion Responsibility Empathy Self-control
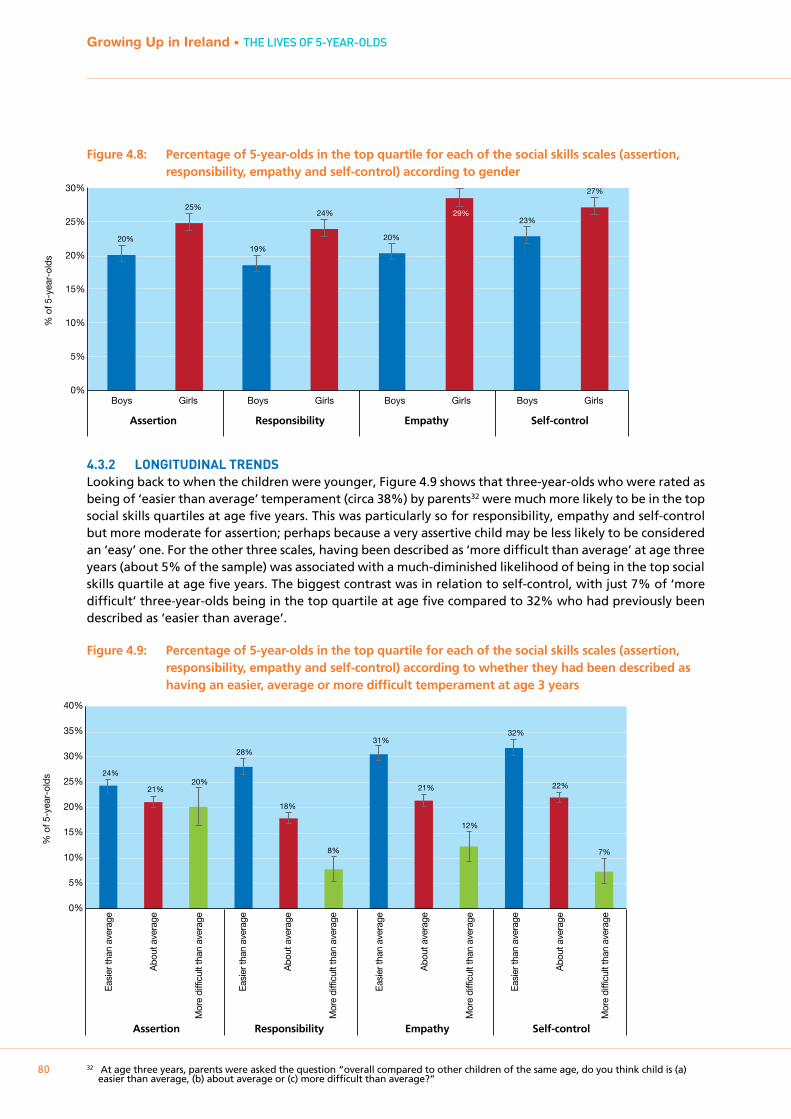
Growing Up in Ireland • THE LIVES OF 5-YEAR-OLDS
80
Figure 4.8: Percentage of 5-year-olds in the top quartile for each of the social skills scales (assertion, responsibility, empathy and self-control) according to gender
4.3.2 LONgITUDINAL TRENDSLooking back to when the children were younger, Figure 4.9 shows that three-year-olds who were rated as being of ‘easier than average’ temperament (circa 38%) by parents32 were much more likely to be in the top social skills quartiles at age five years. This was particularly so for responsibility, empathy and self-control but more moderate for assertion; perhaps because a very assertive child may be less likely to be considered an ‘easy’ one. For the other three scales, having been described as ‘more difficult than average’ at age three years (about 5% of the sample) was associated with a much-diminished likelihood of being in the top social skills quartile at age five years. The biggest contrast was in relation to self-control, with just 7% of ‘more difficult’ three-year-olds being in the top quartile at age five compared to 32% who had previously been described as ‘easier than average’.
Figure 4.9: Percentage of 5-year-olds in the top quartile for each of the social skills scales (assertion, responsibility, empathy and self-control) according to whether they had been described as having an easier, average or more difficult temperament at age 3 years
32 At age three years, parents were asked the question “overall compared to other children of the same age, do you think child is (a) easier than average, (b) about average or (c) more difficult than average?”
% o
f 5-y
ear-
olds
0%
5%
10%
15%
20%
25%
30%
20%
25%
19%
24%
20%
29% 23%
27%
Boys Girls Boys Girls Boys Girls Boys Girls
Assertion Responsibility Empathy Self-control
% o
f 5-y
ear-
olds
Easi
er th
an a
vera
ge
Abo
ut a
vera
ge
Mor
e di
fficu
lt th
an a
vera
ge
Easi
er th
an a
vera
ge
Abo
ut a
vera
ge
Mor
e di
fficu
lt th
an a
vera
ge
Easi
er th
an a
vera
ge
Abo
ut a
vera
ge
Mor
e di
fficu
lt th
an a
vera
ge
Easi
er th
an a
vera
ge
Abo
ut a
vera
ge
Mor
e di
fficu
lt th
an a
vera
ge
0%
5%
10%
15%
20%
25%
30%
35%
40%
Assertion Responsibility Empathy Self-control
24%
21% 20%
28%
18%
8%
31%
21%
12%
32%
22%
7%
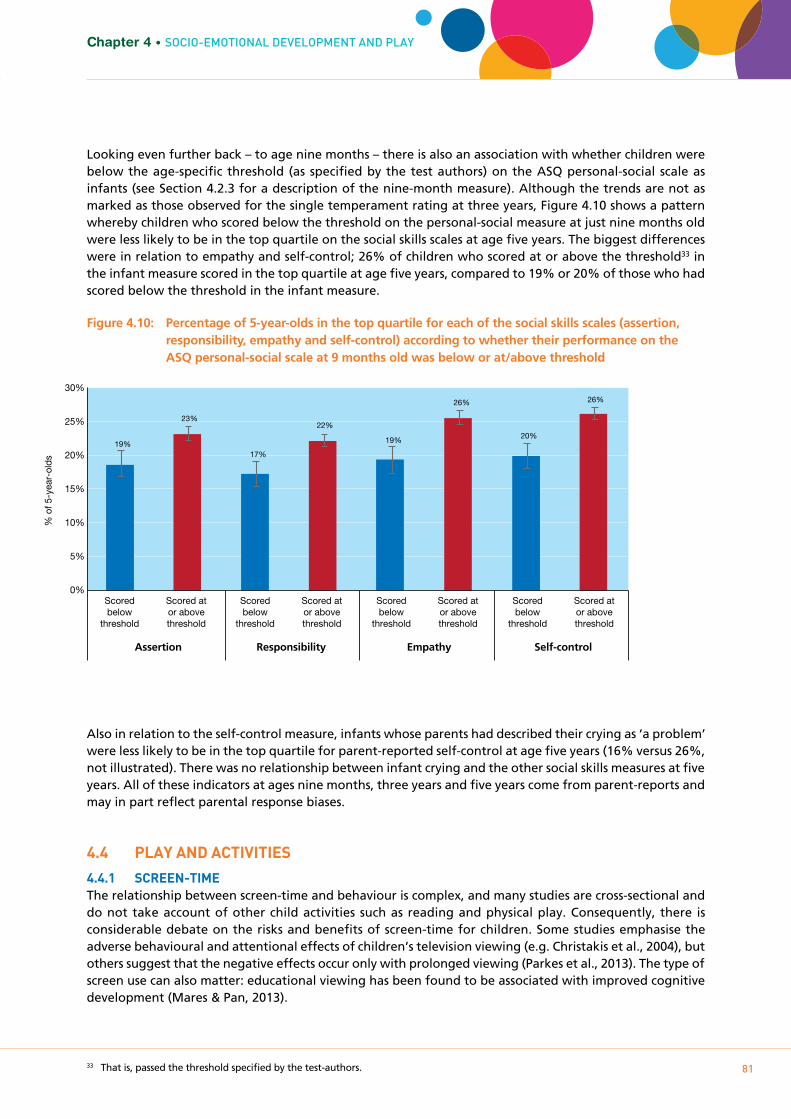
Growing Up in Ireland • THE LIVES OF 5-YEAR-OLDS
81
Chapter 4 • SOcIO-EmOTIOnAL DEVELOPmEnT AnD PLAY
Looking even further back – to age nine months – there is also an association with whether children were below the age-specific threshold (as specified by the test authors) on the ASQ personal-social scale as infants (see Section 4.2.3 for a description of the nine-month measure). Although the trends are not as marked as those observed for the single temperament rating at three years, Figure 4.10 shows a pattern whereby children who scored below the threshold on the personal-social measure at just nine months old were less likely to be in the top quartile on the social skills scales at age five years. The biggest differences were in relation to empathy and self-control; 26% of children who scored at or above the threshold33 in the infant measure scored in the top quartile at age five years, compared to 19% or 20% of those who had scored below the threshold in the infant measure.
Figure 4.10: Percentage of 5-year-olds in the top quartile for each of the social skills scales (assertion, responsibility, empathy and self-control) according to whether their performance on the ASQ personal-social scale at 9 months old was below or at/above threshold
Also in relation to the self-control measure, infants whose parents had described their crying as ‘a problem’ were less likely to be in the top quartile for parent-reported self-control at age five years (16% versus 26%, not illustrated). There was no relationship between infant crying and the other social skills measures at five years. All of these indicators at ages nine months, three years and five years come from parent-reports and may in part reflect parental response biases.
4.4 pLAY AND ACTIVITIES
4.4.1 SCREEN-TImEThe relationship between screen-time and behaviour is complex, and many studies are cross-sectional and do not take account of other child activities such as reading and physical play. Consequently, there is considerable debate on the risks and benefits of screen-time for children. Some studies emphasise the adverse behavioural and attentional effects of children’s television viewing (e.g. Christakis et al., 2004), but others suggest that the negative effects occur only with prolonged viewing (Parkes et al., 2013). The type of screen use can also matter: educational viewing has been found to be associated with improved cognitive development (Mares & Pan, 2013).
33 That is, passed the threshold specified by the test-authors.
0%
5%
10%
15%
20%
25%
30%
% o
f 5-y
ear-
olds
Assertion Responsibility Empathy Self-control
19%
23%
17%
22%
19%
26%
20%
26%
Scored below
threshold
Scored at or above threshold
Scored below
threshold
Scored at or above threshold
Scored below
threshold
Scored at or above threshold
Scored below
threshold
Scored at or above threshold
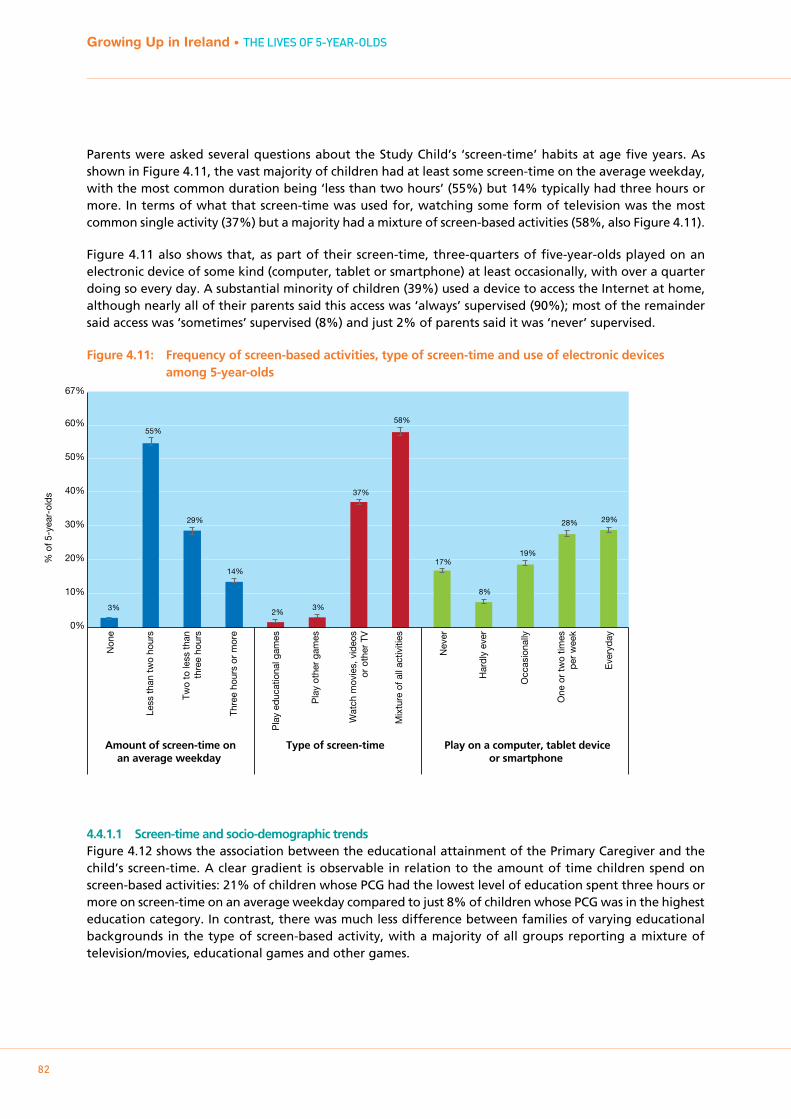
Growing Up in Ireland • THE LIVES OF 5-YEAR-OLDS
82
Parents were asked several questions about the Study Child’s ‘screen-time’ habits at age five years. As shown in Figure 4.11, the vast majority of children had at least some screen-time on the average weekday, with the most common duration being ‘less than two hours’ (55%) but 14% typically had three hours or more. In terms of what that screen-time was used for, watching some form of television was the most common single activity (37%) but a majority had a mixture of screen-based activities (58%, also Figure 4.11).
Figure 4.11 also shows that, as part of their screen-time, three-quarters of five-year-olds played on an electronic device of some kind (computer, tablet or smartphone) at least occasionally, with over a quarter doing so every day. A substantial minority of children (39%) used a device to access the Internet at home, although nearly all of their parents said this access was ‘always’ supervised (90%); most of the remainder said access was ‘sometimes’ supervised (8%) and just 2% of parents said it was ‘never’ supervised.
Figure 4.11: Frequency of screen-based activities, type of screen-time and use of electronic devices among 5-year-olds
4.4.1.1 Screen-time and socio-demographic trendsFigure 4.12 shows the association between the educational attainment of the Primary Caregiver and the child’s screen-time. A clear gradient is observable in relation to the amount of time children spend on screen-based activities: 21% of children whose PCG had the lowest level of education spent three hours or more on screen-time on an average weekday compared to just 8% of children whose PCG was in the highest education category. In contrast, there was much less difference between families of varying educational backgrounds in the type of screen-based activity, with a majority of all groups reporting a mixture of television/movies, educational games and other games.
% o
f 5-y
ear-
olds
Non
e
Less
than
two
hour
s
Two
to le
ss th
anth
ree
hour
s
Thre
e ho
urs
or m
ore
Pla
y ed
ucat
iona
l gam
es
Pla
y ot
her
gam
es
Wat
ch m
ovie
s, v
ideo
sor
oth
er T
V
Mix
ture
of a
ll ac
tiviti
es
Nev
er
Har
dly
ever
Occ
asio
nally
One
or
two
times
per
wee
k
Eve
ryda
y
Amount of screen-time onan average weekday
Play on a computer, tablet deviceor smartphone
Type of screen-time
0%
10%
20%
30%
40%
50%
60%
67%
3%
55%
29%
14%
2% 3%
37%
58%
17%
8%
19%
28% 29%
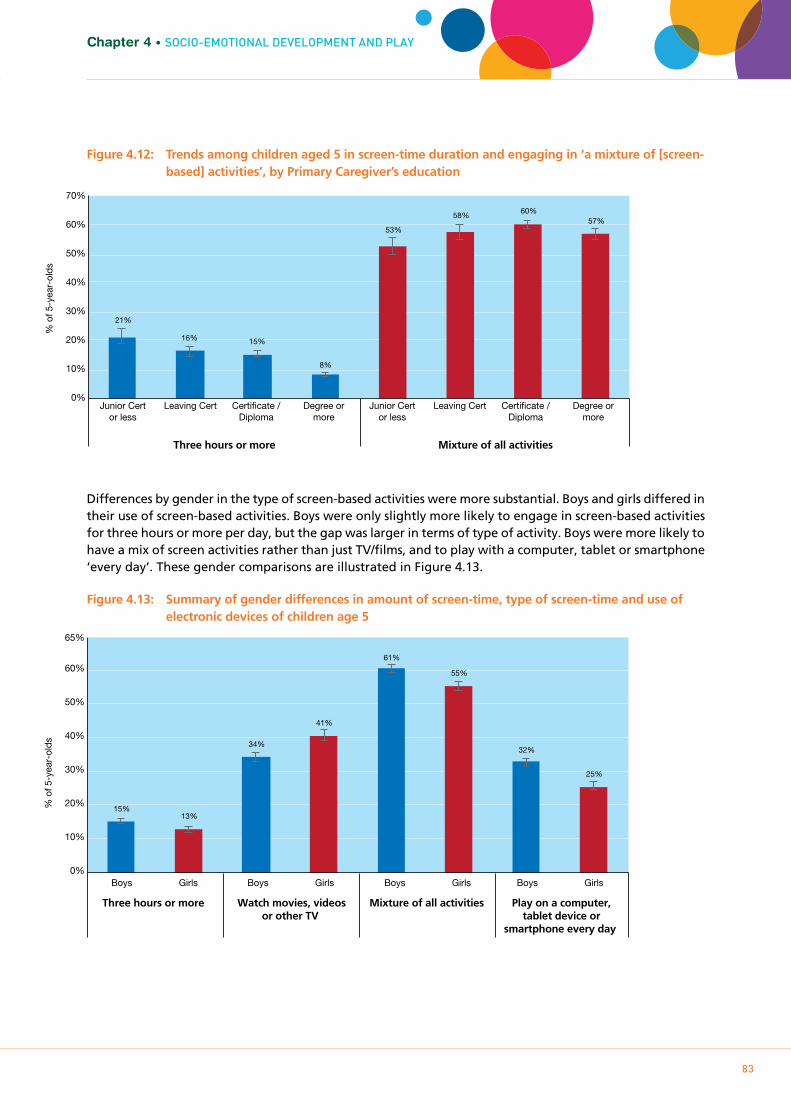
Growing Up in Ireland • THE LIVES OF 5-YEAR-OLDS
83
Chapter 4 • SOcIO-EmOTIOnAL DEVELOPmEnT AnD PLAY
Figure 4.12: Trends among children aged 5 in screen-time duration and engaging in ‘a mixture of [screen- based] activities’, by Primary Caregiver’s education
Differences by gender in the type of screen-based activities were more substantial. Boys and girls differed in their use of screen-based activities. Boys were only slightly more likely to engage in screen-based activities for three hours or more per day, but the gap was larger in terms of type of activity. Boys were more likely to have a mix of screen activities rather than just TV/films, and to play with a computer, tablet or smartphone ‘every day’. These gender comparisons are illustrated in Figure 4.13.
Figure 4.13: Summary of gender differences in amount of screen-time, type of screen-time and use of electronic devices of children age 5
Leaving Cert Junior Certor less
Degree or more
Certificate / Diploma
Leaving Cert Junior Certor less
Degree or more
Certificate / Diploma
% o
f 5-y
ear-
olds
Three hours or more Mixture of all activities
0%
10%
20%
30%
40%
50%
60%
70%
21%
16% 15%
8%
53%
58% 60%
57%
0%
10%
20%
30%
40%
50%
60%
65%
% o
f 5-y
ear-
olds
Boys Girls Boys Girls Boys Girls Boys Girls
Three hours or more Watch movies, videosor other TV
Mixture of all activities Play on a computer,tablet device or
smartphone every day
15% 13%
34%
41%
61%
55%
32%
25%
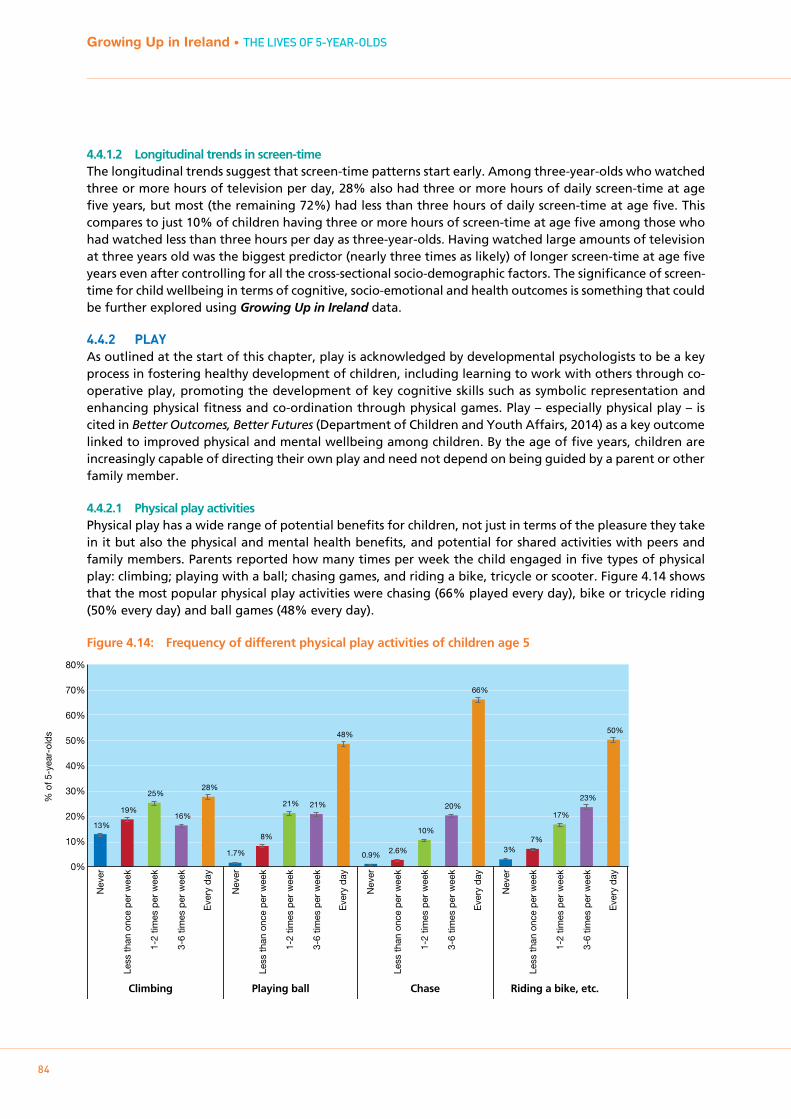
Growing Up in Ireland • THE LIVES OF 5-YEAR-OLDS
84
4.4.1.2 Longitudinal trends in screen-timeThe longitudinal trends suggest that screen-time patterns start early. Among three-year-olds who watched three or more hours of television per day, 28% also had three or more hours of daily screen-time at age five years, but most (the remaining 72%) had less than three hours of daily screen-time at age five. This compares to just 10% of children having three or more hours of screen-time at age five among those who had watched less than three hours per day as three-year-olds. Having watched large amounts of television at three years old was the biggest predictor (nearly three times as likely) of longer screen-time at age five years even after controlling for all the cross-sectional socio-demographic factors. The significance of screen-time for child wellbeing in terms of cognitive, socio-emotional and health outcomes is something that could be further explored using Growing Up in Ireland data.
4.4.2 pLAYAs outlined at the start of this chapter, play is acknowledged by developmental psychologists to be a key process in fostering healthy development of children, including learning to work with others through co-operative play, promoting the development of key cognitive skills such as symbolic representation and enhancing physical fitness and co-ordination through physical games. Play – especially physical play – is cited in Better Outcomes, Better Futures (Department of Children and Youth Affairs, 2014) as a key outcome linked to improved physical and mental wellbeing among children. By the age of five years, children are increasingly capable of directing their own play and need not depend on being guided by a parent or other family member.
4.4.2.1 Physical play activitiesPhysical play has a wide range of potential benefits for children, not just in terms of the pleasure they take in it but also the physical and mental health benefits, and potential for shared activities with peers and family members. Parents reported how many times per week the child engaged in five types of physical play: climbing; playing with a ball; chasing games, and riding a bike, tricycle or scooter. Figure 4.14 shows that the most popular physical play activities were chasing (66% played every day), bike or tricycle riding (50% every day) and ball games (48% every day).
Figure 4.14: Frequency of different physical play activities of children age 5
% o
f 5-y
ear-
olds
0%
10%
20%
30%
40%
50%
60%
70%
80%
13%
19%
25%
16%
28%
1.7%
8%
21% 21%
48%
0.9% 2.6%
10%
20%
66%
3% 7%
17%
23%
50%
Nev
er
Less
than
onc
e pe
r w
eek
1-2
times
per
wee
k
3-6
times
per
wee
k
Eve
ry d
ay
Nev
er
Less
than
onc
e pe
r w
eek
1-2
times
per
wee
k
3-6
times
per
wee
k
Eve
ry d
ay
Nev
er
Less
than
onc
e pe
r w
eek
1-2
times
per
wee
k
3-6
times
per
wee
k
Eve
ry d
ay
Nev
er
Less
than
onc
e pe
r w
eek
1-2
times
per
wee
k
3-6
times
per
wee
k
Eve
ry d
ay
Climbing Playing ball Chase Riding a bike, etc.

Growing Up in Ireland • THE LIVES OF 5-YEAR-OLDS
85
Chapter 4 • SOcIO-EmOTIOnAL DEVELOPmEnT AnD PLAY
There were significant differences in frequency of physical play between children according to gender, whether they lived in an urban or rural area, and also family income. In general, boys, children from rural areas and from lower-income families were more likely to engage in the different types of physical play, as shown in Figure 4.15. The activity with the biggest gender difference was playing ball; 60% of boys did this every day compared to 38% of girls. The biggest urban/rural divide was in relation to riding a bike, tricycle, etc: 55% of rural children did this every day in contrast to 43% of urban children. Bike-riding also showed the biggest income gap; 59% of children in the lowest income quintile were said to do this every day compared to 41% of children in families with the highest income.
Figure 4.15: Differences in likelihood of engaging in various physical play activities ‘every day’ according to gender, urban/rural area, and family income (only lowest and highest quintiles shown) of children aged 5
4.4.2.1 Other types of playThe Primary Caregiver was asked how often the Study Child engaged in other types of play: ‘make believe’ or pretend play; art (paints, draws or makes models) and dance, music and movement. There were five answer options ranging from ‘never’ to ‘every day’. Some of these activities may be quite active and ‘physical’ (e.g. dance), but that is not necessarily the case so they are considered separately here. As can be seen in Figure 4.16, all three types of play were engaged in regularly, and a majority did so ‘every day’, with ‘playing “make believe” and pretend games’ the most popular (68% played at this every day).
% o
f 5-y
ear-
olds
0%
10%
20%
30%
40%
50%
60%
70%
80%
35%
26% 27%
32% 34%
27%
60%
38%
44%
52%
57%
41%
70%
63% 64% 68%
72%
60%
52%
48% 43%
55%
59%
41%
Boy
s
Girl
s
Urb
an
Rur
al
Low
est
Hig
hest
Boy
s
Girl
s
Urb
an
Rur
al
Low
est
Hig
hest
Boy
s
Girl
s
Urb
an
Rur
al
Low
est
Hig
hest
Boy
s
Girl
s
Urb
an
Rur
al
Low
est
Hig
hest
Gender Area Income Gender Area Income Gender Area Income Gender Area Income
Climbing every day Playing ball every day Chase every day Riding a bike every day

Growing Up in Ireland • THE LIVES OF 5-YEAR-OLDS
86
Figure 4.16: Frequency of non-physical play types of children aged 5 years
Some of the biggest contrasts in these play activities were between boys and girls. As Figure 4.17 shows, a much higher percentage of girls were reported to engage in pretend play, art activities and dance or music ‘every day’; this was particularly marked for art (paints, draws, makes models) and music-related activities (dance, music, movement).
Figure 4.17: Gender differences among children aged 5 in the frequency of engaging in pretend play, art activities or dance/music/movement
0%
10%
20%
30%
40%
50%
60%
70%
80%
% o
f 5-y
ear-
olds
1.6% 2.0%
10%
18%
68%
0.9% 1.9%
11%
32%
54%
1.0% 2.9%
12%
25%
59%
Nev
er
Har
dly
ever
Occ
asio
nally
1-2
times
per
wee
k
Eve
ry d
ay
Nev
er
Har
dly
ever
Occ
asio
nally
1-2
times
per
wee
k
Eve
ry d
ay
Nev
er
Har
dly
ever
Occ
asio
nally
1-2
times
per
wee
k
Eve
ry d
ay
Plays 'make believe' orpretend games
Paints, draws or makes models Enjoys dance, music, movement
% o
f 5-y
ear-
olds
Boys Girls Boys Girls Boys Girls
Plays 'make believe' orpretend games every day
Paints, draws or makesmodels every day
Enjoys dance, music,movement every day
0%
10%
20%
30%
40%
50%
60%
70%
80%
62%
74%
42%
67%
46%
73%
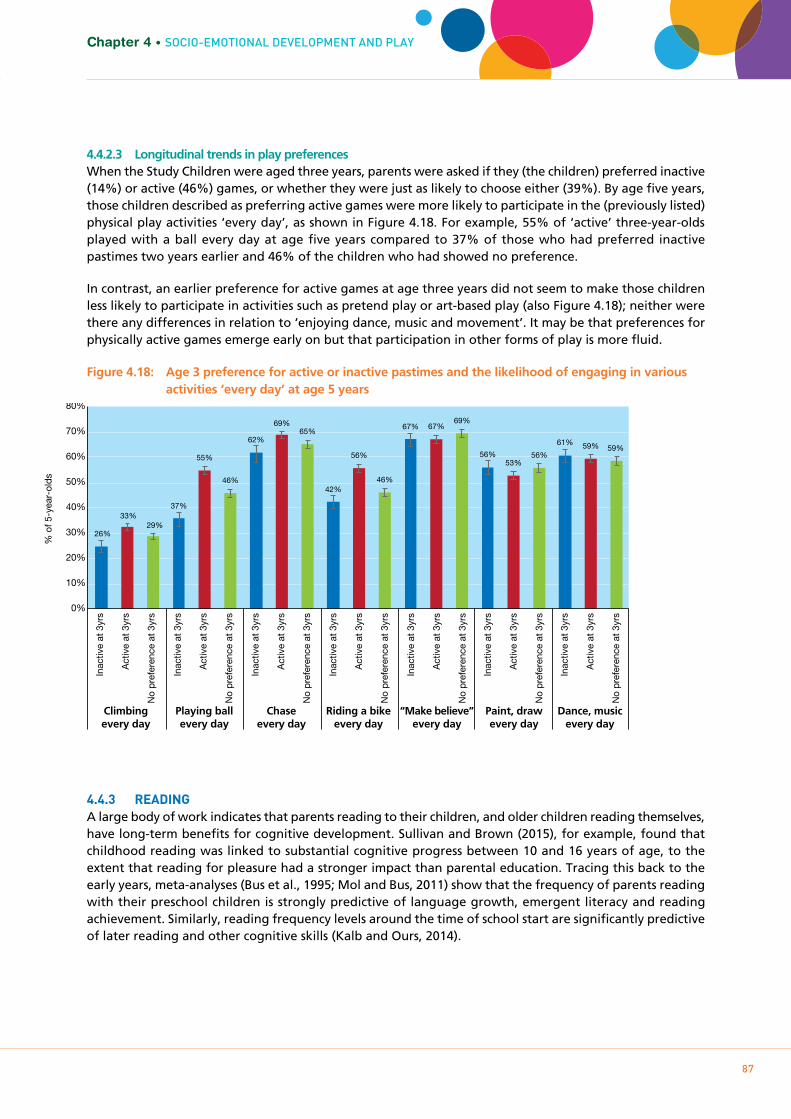
Growing Up in Ireland • THE LIVES OF 5-YEAR-OLDS
87
Chapter 4 • SOcIO-EmOTIOnAL DEVELOPmEnT AnD PLAY
4.4.2.3 Longitudinal trends in play preferencesWhen the Study Children were aged three years, parents were asked if they (the children) preferred inactive (14%) or active (46%) games, or whether they were just as likely to choose either (39%). By age five years, those children described as preferring active games were more likely to participate in the (previously listed) physical play activities ‘every day’, as shown in Figure 4.18. For example, 55% of ‘active’ three-year-olds played with a ball every day at age five years compared to 37% of those who had preferred inactive pastimes two years earlier and 46% of the children who had showed no preference.
In contrast, an earlier preference for active games at age three years did not seem to make those children less likely to participate in activities such as pretend play or art-based play (also Figure 4.18); neither were there any differences in relation to ‘enjoying dance, music and movement’. It may be that preferences for physically active games emerge early on but that participation in other forms of play is more fluid.
Figure 4.18: Age 3 preference for active or inactive pastimes and the likelihood of engaging in various activities ‘every day’ at age 5 years
4.4.3 READINgA large body of work indicates that parents reading to their children, and older children reading themselves, have long-term benefits for cognitive development. Sullivan and Brown (2015), for example, found that childhood reading was linked to substantial cognitive progress between 10 and 16 years of age, to the extent that reading for pleasure had a stronger impact than parental education. Tracing this back to the early years, meta-analyses (Bus et al., 1995; Mol and Bus, 2011) show that the frequency of parents reading with their preschool children is strongly predictive of language growth, emergent literacy and reading achievement. Similarly, reading frequency levels around the time of school start are significantly predictive of later reading and other cognitive skills (Kalb and Ours, 2014).
0%
10%
20%
30%
40%
50%
60%
70%
80%
% o
f 5-y
ear-
olds
26%
33% 29%
37%
55%
46%
62%
69% 65%
42%
56%
46%
67% 67% 69%
56% 53%
56%
61% 59% 59%
Inac
tive
at 3
yrs
Act
ive
at 3
yrs
No
pref
eren
ce a
t 3yr
s
Inac
tive
at 3
yrs
Act
ive
at 3
yrs
No
pref
eren
ce a
t 3yr
s
Inac
tive
at 3
yrs
Act
ive
at 3
yrs
No
pref
eren
ce a
t 3yr
s
Inac
tive
at 3
yrs
Act
ive
at 3
yrs
No
pref
eren
ce a
t 3yr
s
Inac
tive
at 3
yrs
Act
ive
at 3
yrs
No
pref
eren
ce a
t 3yr
s
Inac
tive
at 3
yrs
Act
ive
at 3
yrs
No
pref
eren
ce a
t 3yr
s
Inac
tive
at 3
yrs
Act
ive
at 3
yrs
No
pref
eren
ce a
t 3yr
s
Climbingevery day
Playing ballevery day
Chaseevery day
Riding a bikeevery day
“Make believe”every day
Paint, drawevery day
Dance, musicevery day
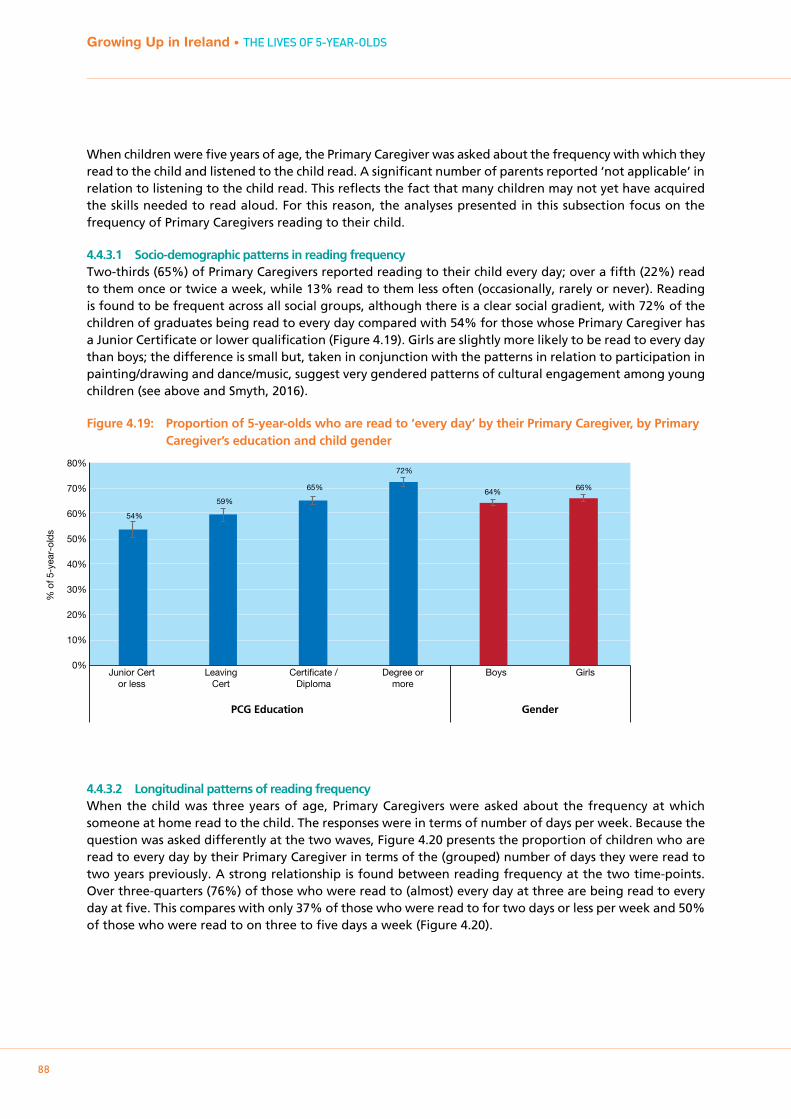
Growing Up in Ireland • THE LIVES OF 5-YEAR-OLDS
88
When children were five years of age, the Primary Caregiver was asked about the frequency with which they read to the child and listened to the child read. A significant number of parents reported ‘not applicable’ in relation to listening to the child read. This reflects the fact that many children may not yet have acquired the skills needed to read aloud. For this reason, the analyses presented in this subsection focus on the frequency of Primary Caregivers reading to their child.
4.4.3.1 Socio-demographic patterns in reading frequencyTwo-thirds (65%) of Primary Caregivers reported reading to their child every day; over a fifth (22%) read to them once or twice a week, while 13% read to them less often (occasionally, rarely or never). Reading is found to be frequent across all social groups, although there is a clear social gradient, with 72% of the children of graduates being read to every day compared with 54% for those whose Primary Caregiver has a Junior Certificate or lower qualification (Figure 4.19). Girls are slightly more likely to be read to every day than boys; the difference is small but, taken in conjunction with the patterns in relation to participation in painting/drawing and dance/music, suggest very gendered patterns of cultural engagement among young children (see above and Smyth, 2016).
Figure 4.19: Proportion of 5-year-olds who are read to ‘every day’ by their Primary Caregiver, by Primary Caregiver’s education and child gender
4.4.3.2 Longitudinal patterns of reading frequencyWhen the child was three years of age, Primary Caregivers were asked about the frequency at which someone at home read to the child. The responses were in terms of number of days per week. Because the question was asked differently at the two waves, Figure 4.20 presents the proportion of children who are read to every day by their Primary Caregiver in terms of the (grouped) number of days they were read to two years previously. A strong relationship is found between reading frequency at the two time-points. Over three-quarters (76%) of those who were read to (almost) every day at three are being read to every day at five. This compares with only 37% of those who were read to for two days or less per week and 50% of those who were read to on three to five days a week (Figure 4.20).
0%
10%
20%
30%
40%
50%
60%
70%
80%
Junior Cert or less
Leaving Cert
Certificate / Diploma
Degree or more
Boys Girls
% o
f 5-y
ear-
olds
54%
59%
65%
72%
64% 66%
PCG Education Gender
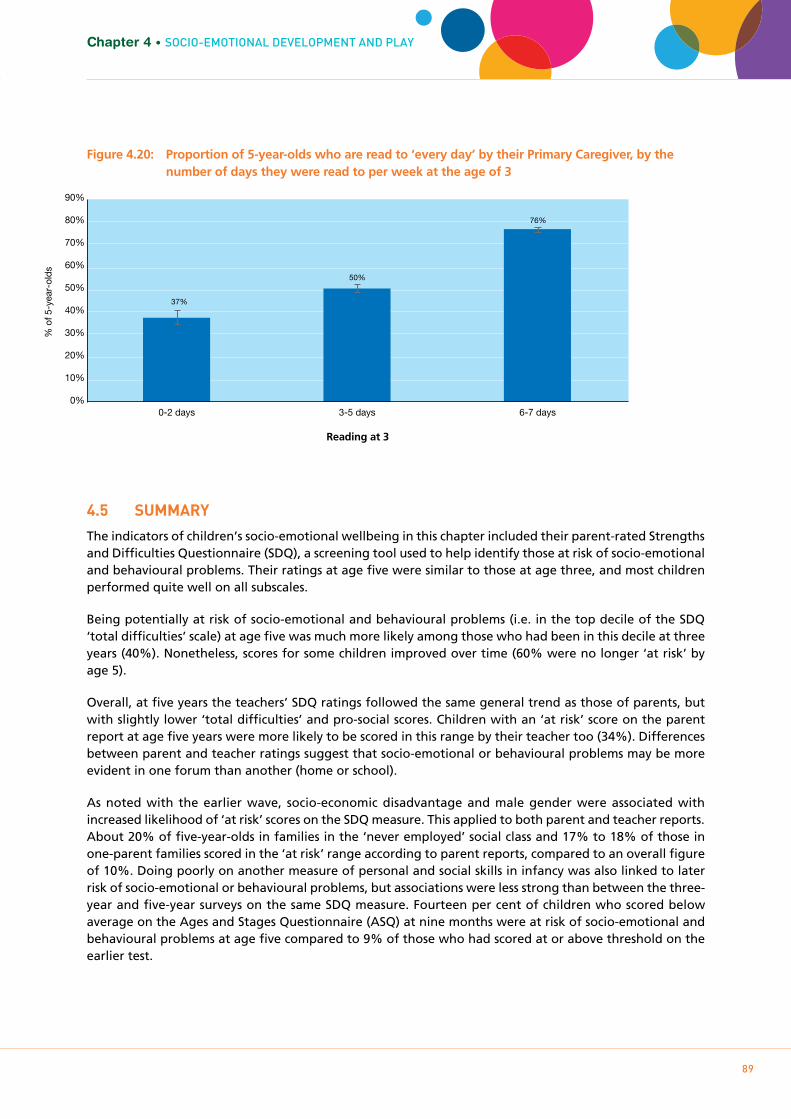
Growing Up in Ireland • THE LIVES OF 5-YEAR-OLDS
89
Chapter 4 • SOcIO-EmOTIOnAL DEVELOPmEnT AnD PLAY
Figure 4.20: Proportion of 5-year-olds who are read to ‘every day’ by their Primary Caregiver, by the number of days they were read to per week at the age of 3
4.5 SUmmARY
The indicators of children’s socio-emotional wellbeing in this chapter included their parent-rated Strengths and Difficulties Questionnaire (SDQ), a screening tool used to help identify those at risk of socio-emotional and behavioural problems. Their ratings at age five were similar to those at age three, and most children performed quite well on all subscales.
Being potentially at risk of socio-emotional and behavioural problems (i.e. in the top decile of the SDQ ‘total difficulties’ scale) at age five was much more likely among those who had been in this decile at three years (40%). Nonetheless, scores for some children improved over time (60% were no longer ‘at risk’ by age 5).
Overall, at five years the teachers’ SDQ ratings followed the same general trend as those of parents, but with slightly lower ‘total difficulties’ and pro-social scores. Children with an ‘at risk’ score on the parent report at age five years were more likely to be scored in this range by their teacher too (34%). Differences between parent and teacher ratings suggest that socio-emotional or behavioural problems may be more evident in one forum than another (home or school).
As noted with the earlier wave, socio-economic disadvantage and male gender were associated with increased likelihood of ‘at risk’ scores on the SDQ measure. This applied to both parent and teacher reports. About 20% of five-year-olds in families in the ‘never employed’ social class and 17% to 18% of those in one-parent families scored in the ‘at risk’ range according to parent reports, compared to an overall figure of 10%. Doing poorly on another measure of personal and social skills in infancy was also linked to later risk of socio-emotional or behavioural problems, but associations were less strong than between the three-year and five-year surveys on the same SDQ measure. Fourteen per cent of children who scored below average on the Ages and Stages Questionnaire (ASQ) at nine months were at risk of socio-emotional and behavioural problems at age five compared to 9% of those who had scored at or above threshold on the earlier test.
% o
f 5-y
ear-
olds
Reading at 3
37%
50%
76%
0%
10%
20%
30%
40%
50%
60%
70%
80%
90%
0-2 days 3-5 days 6-7 days

Growing Up in Ireland • THE LIVES OF 5-YEARS-OLDS
90
The age-five wave introduced a new parent-reported measure of competency in social skill development in the form of four subscales from the Social Skills Improvement System Rating Scales (SSIS-RS). The subscales were assertion, responsibility, empathy and self-control. Interestingly, there were fewer socio-demographic trends on this positively oriented measure, with the exception of family type, where single children in two-parent households scored better than others (30% to 32% in the most favourable quartile on empathy and self-control compared to 25% overall). Girls (29% on empathy) also tended to score more positively than boys (20% on empathy). Again some longitudinal trends emerged compared to both nine months (a low age-specific personal-social score on the ASQ scale at 9 months was linked to a low social skills score later on) and three years (an easier temperament was associated with a higher score in terms of responsibility, empathy and self-control).
This chapter also looked at children’s pastimes and play. Play is generally accepted as being a key activity in fostering the healthy development of children, and the role of physical play, in particular, is acknowledged in Better Outcomes, Brighter Futures.
In relation to screen-time, overall, children typically spent less than two hours a day on screen-time (including watching television, videos/DVDs, movies, playing computer games, using a computer or smartphone) but 13% of five-year-olds spent three hours or more on these kinds of activities on a typical day.
There were strong socio-demographic trends in relation to lengthy periods of screen-time. Children from socially disadvantaged families were more likely to be spending three or more hours a day on screen-based activities (21% of children whose Primary Caregiver has education to Junior Cert level spend three or more hours a day on screen-based activities compared to 8% of children whose Primary Caregiver has a degree).
Most five-year-old children used their screen-time for a mixture of activities (58%) but a sizeable minority used it only for watching television/DVDs (37%). There were some gender differences; girls were more likely to just watch television content (41% compared to 34%) and spend somewhat less time on it in total (13% spend 3 or more hours compared to 15% of boys).
Future research possibilities using Growing Up in Ireland data include an examination of associations between screen-time and wellbeing in cognitive, socio-emotional, behavioural and physical health domains, and the mechanisms underlying these associations.
In other types of play, gender again emerged as a key predictor. Boys were more likely to engage in physical play (60% compared to 36%), and less likely to engage in other forms of play, such as crafts (42% compared to 67%) and dance/music (46% compared to 73% of girls).
Further analysis of household characteristics tended to show that physical play activities, such as climbing and riding a bike, were more common among children from lower-income families and those who lived in rural areas. For instance, 72% of children in the lowest-income group and 68% of those living in rural areas played ‘chase’ every day, compared to 66% overall. A preference for physical activities seemed more likely to persist over time than preferences for other types of play activities. For example, 69% of children who had preferred ‘active’ games at three years old played chase every day at age five compared to 61% of those who had preferred ‘inactive’ games at age three.
Being read to at home is an important influence on children’s language development and literacy skills. Two-thirds of five-year-old children are read to every day by their Primary Caregiver. This is more common among the children of graduates (72%) than in families with Junior Certificate or lower qualifications (54%). Reading frequency at three and five years of age are strongly related; the majority of families who read to their three-year-old (almost) every day continue to do so as their child gets older.
Chapter 5PAREnTIng AnD FAmILY RELATIOnSHIPS
91
Growing Up in Ireland • THE LIVES OF 5-YEAR-OLDS
92
5.1 INTRODUCTION
5.1.1 bACkgROUNDThe child’s Primary and Secondary Caregivers are probably the most important external agents in the child’s early development. At five years old, the child remains almost entirely dependent on them for their basic needs of accommodation, food and safety, and for their other fundamental requirements of warmth and affection, emotional security, support for their early learning, and guidance on their behaviour. It follows that parenting and the child-parent relationship are central to optimal development in all areas of the child’s life, including health, socio-emotional wellbeing, and cognitive development and school achievement.
Unlike most professionals in the child’s life such as nurses, teachers and crèche workers, parents are not required to receive training prior to looking after children. Hence, many parents may rely on informal support and advice from grandparents, friends, siblings or, increasingly, online sources of information. Some parents may be able to share parenting tasks with a resident spouse or partner (or a non-resident parent) but many are effectively managing on their own.
International research suggests that parent-child interactions that are characterised by sensitivity, warmth and consistency are associated with more favourable outcomes in childhood and beyond (see Williams et al., 2010 (b) and Greene et al., 2014 for reviews). A positive parent-child relationship will likely benefit parents as well as children. The National Policy Framework for Children and Young People 2014-2020 (DCYA, 2014) lists “better support [for] parents and families” first in its summary of priorities for the seven years of the framework. In particular, it commits to “increase the provision of supports to all parents through universal access to good-quality parenting advice and programmes, and access to affordable quality childcare, as well as targeted, evidence-based supports to those parents with greatest needs”. This recognition of the importance of the family context is noted in the First 5 early-years strategy (First 5: A Whole-of-Government Strategy for Babies, Young Children and their Families 2019-2028), where the first two goals are to assist parents in balancing work and caring and to develop a new model of parenting support (Government of Ireland, 2018).
5.1.2 kEY FINDINgS ON pARENTINg AT 3 YEARSThe study of Cohort ’08 at age three showed that the vast majority of parents reported themselves as high in warmth and consistency, and low in hostility in their interactions with their three-year-old. However, Primary Caregivers with low levels of education reported being less consistent than those with degree-level education. The majority of parents described their relationship with their three-year-old positively, with little conflict; talking to the child about their misbehaviour was the most commonly reported discipline strategy. Smacking was used rarely, or not at all, by most parents, although boys were more likely than girls to be smacked.34 There was some evidence from the analysis of Cohort ’08 at three years old of an association between parental stress and less favourable aspects of the parent-child relationship, such as reduced warmth and consistency and increased hostility (Williams et al., 2013).
In the following sections we turn to the parent-child relationship of Growing Up in Ireland Cohort ’08 at age five. As noted in Chapter 1, unless explicitly stated, all of the findings and patterns discussed in the text of this chapter are statistically significant at the 5% level.
34 The 2015 Children First Act abolished ‘reasonable chastisement’ as a defence for hitting a child. This was after the fieldwork in 2011, although the issue of ‘smacking’ was receiving media attention at the time of fieldwork.

Growing Up in Ireland • THE LIVES OF 5-YEAR-OLDS
93
Chapter 5 • PAREnTIng AnD FAmILY RELATIOnSHIPS
5.2 pARENT-CHILD RELATIONSHIp
Interactions between parents and children are influenced by a wide range of factors. Some are parental (e.g. mental wellbeing), others are characteristics of the child (e.g. gender and temperament), and some may relate to the family environment, such as the relationship between parents (Greene et al., 2014). Parents’ perceptions of the emotional quality of his or her relationship with the Study Child were measured using a 15-item parent-child relationship scale (Pianta, 1992). This measures closeness and conflict in the parent-child relationship, and was completed by both mothers and fathers (where the father was resident). This is the same measure parents completed when the child was aged three years, facilitating a comparison over time. Note that this measure is different to that focusing on parenting styles, which is discussed in the next section.
The Pianta scale measures aspects of closeness and conflict. The items emphasise mutual interaction, particularly those driven by the child (e.g. if upset, my child will seek comfort from me and when my child is in a bad mood I know we’re in for a long and difficult day). Parenting style (see later subsection), in contrast, captures the adult’s approach to the task of child-rearing.
5.2.1 pRImARY AND SECONDARY CAREgIVER’S RELATIONSHIp wITH THE CHILD AT 5 YEARSDescriptive statistics for the Pianta subscales, summarised in Table 5.1, show that, in general, scores for closeness tended to be much higher than those for conflict. In fact, the scores on closeness in particular were heavily skewed towards high scores, with a full half of Primary Caregivers recording the highest possible score.
Between parents, the trend was similar for both Primary and Secondary Caregivers. The correlations (where applicable) between Primary and Secondary Caregivers were .27 and .46 on the closeness and conflict subscales, respectively.35 While both correlations are statistically significant, their modest sizes suggest that there can be differences in the child’s relationships with the Primary and Secondary Caregivers. The mean scores were also generally similar to levels for the same children at three years old, but with somewhat lower conflict scores.
Table 5.1: Descriptive statistics for Pianta parent-child relationship scales at 5 years, contrasted with mean scores at age 3 years
Pianta Scale Mean (SD) – 5 years
Min—max % giving ‘best’ possible score
Mean, 3-year
Closeness - PCG 33.7 (2.0) 7 - 35 51% 33.8
Closeness - SCG 32.9 (2.4) 7 - 35 32% 33.0
Conflict - PCG 14.9 (5.7) 8 – 40 11% 15.6
Conflict - SCG 14.7 (5.3) 8 - 40 11% 15.0
NB: ‘Best’ possible score is the maximum score on the positive aspects scale or the minimum score on the conflict scale.
To investigate socio-demographic differences in the parent-child relationship, both scales were divided into deciles36 with a focus on the lowest decile on the positive aspects scale and highest decile on the conflict scale (i.e. the ‘least favourable’ relationship scores). It is important to note that due to the very positive scores given by most parents, relationships in the ‘least favourable decile’ are better construed as parents reporting relationships that are less favourable than others rather than ‘poor relationships’ per se.
Overall, socio-demographic characteristics were not strong predictors of outcomes in the parent-child relationship, particularly when compared to other types of outcomes detailed elsewhere in this report. The main differentiating characteristic was the child’s gender. As shown in Figure 5.1, boys were more likely to be in the least favourable decile for closeness for both.
35 A correlation can range between 0 and plus or minus 1, with 0 indicating the weakest association.36 Due to variations in the distributions, the actual numbers in the relevant deciles were: low PCG positive = 11.4%, low SCG positive =
9.8%, high PCG conflict = 9.6% and high SCG conflict = 10.6%.
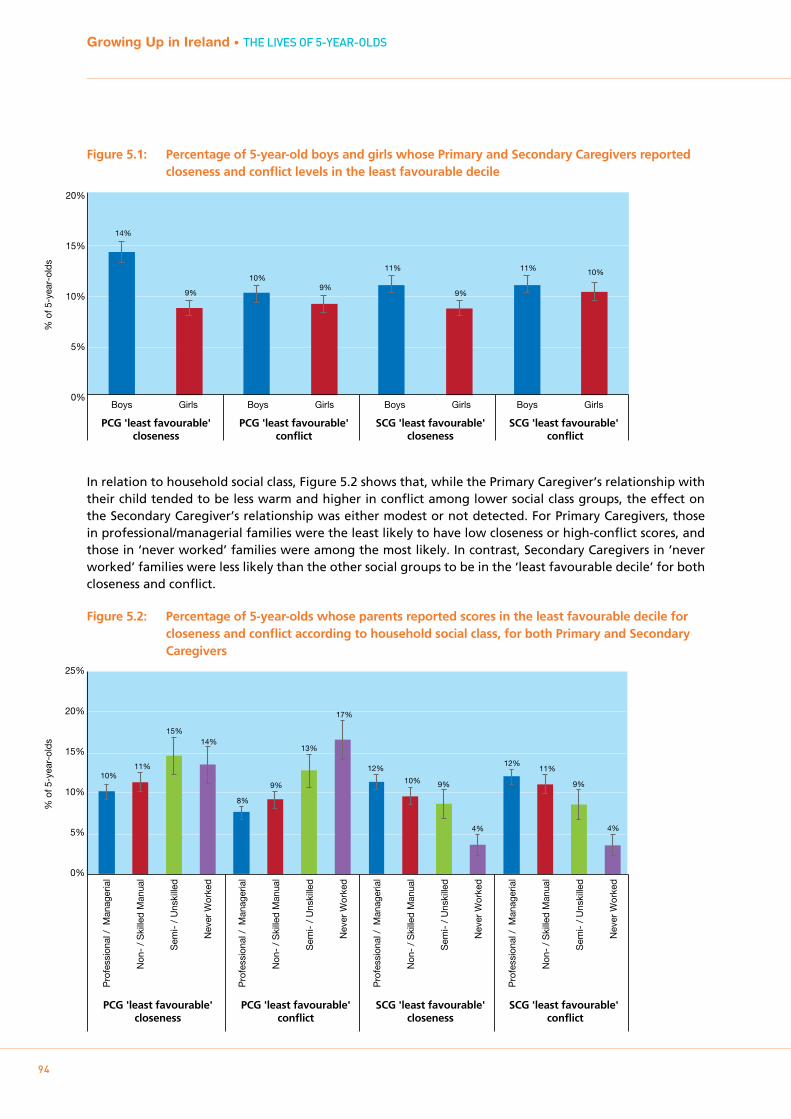
Growing Up in Ireland • THE LIVES OF 5-YEAR-OLDS
94
Figure 5.1: Percentage of 5-year-old boys and girls whose Primary and Secondary Caregivers reported closeness and conflict levels in the least favourable decile
In relation to household social class, Figure 5.2 shows that, while the Primary Caregiver’s relationship with their child tended to be less warm and higher in conflict among lower social class groups, the effect on the Secondary Caregiver’s relationship was either modest or not detected. For Primary Caregivers, those in professional/managerial families were the least likely to have low closeness or high-conflict scores, and those in ‘never worked’ families were among the most likely. In contrast, Secondary Caregivers in ‘never worked’ families were less likely than the other social groups to be in the ‘least favourable decile’ for both closeness and conflict.
Figure 5.2: Percentage of 5-year-olds whose parents reported scores in the least favourable decile for closeness and conflict according to household social class, for both Primary and Secondary Caregivers
% o
f 5-y
ear-
olds
Boys Girls Boys Girls Boys Girls Boys Girls 0%
5%
10%
15%
20%
PCG 'least favourable'closeness
PCG 'least favourable'conflict
SCG 'least favourable'closeness
SCG 'least favourable' conflict
14%
9%
10% 9%
11%
9%
11% 10%
0%
5%
10%
15%
20%
25%
% o
f 5-y
ear-
olds
10% 11%
15% 14%
8%
9%
13%
17%
12%
10% 9%
4%
12% 11%
9%
4%
Pro
fess
iona
l / M
anag
eria
l
Non
- /
Ski
lled
Man
ual
Sem
i- /
Uns
kille
d
Nev
er W
orke
d
Pro
fess
iona
l / M
anag
eria
l
Non
- /
Ski
lled
Man
ual
Sem
i- /
Uns
kille
d
Nev
er W
orke
d
Pro
fess
iona
l / M
anag
eria
l
Non
- /
Ski
lled
Man
ual
Sem
i- /
Uns
kille
d
Nev
er W
orke
d
Pro
fess
iona
l / M
anag
eria
l
Non
- /
Ski
lled
Man
ual
Sem
i- /
Uns
kille
d
Nev
er W
orke
d
PCG 'least favourable'closeness
PCG 'least favourable'conflict
SCG 'least favourable'closeness
SCG 'least favourable' conflict
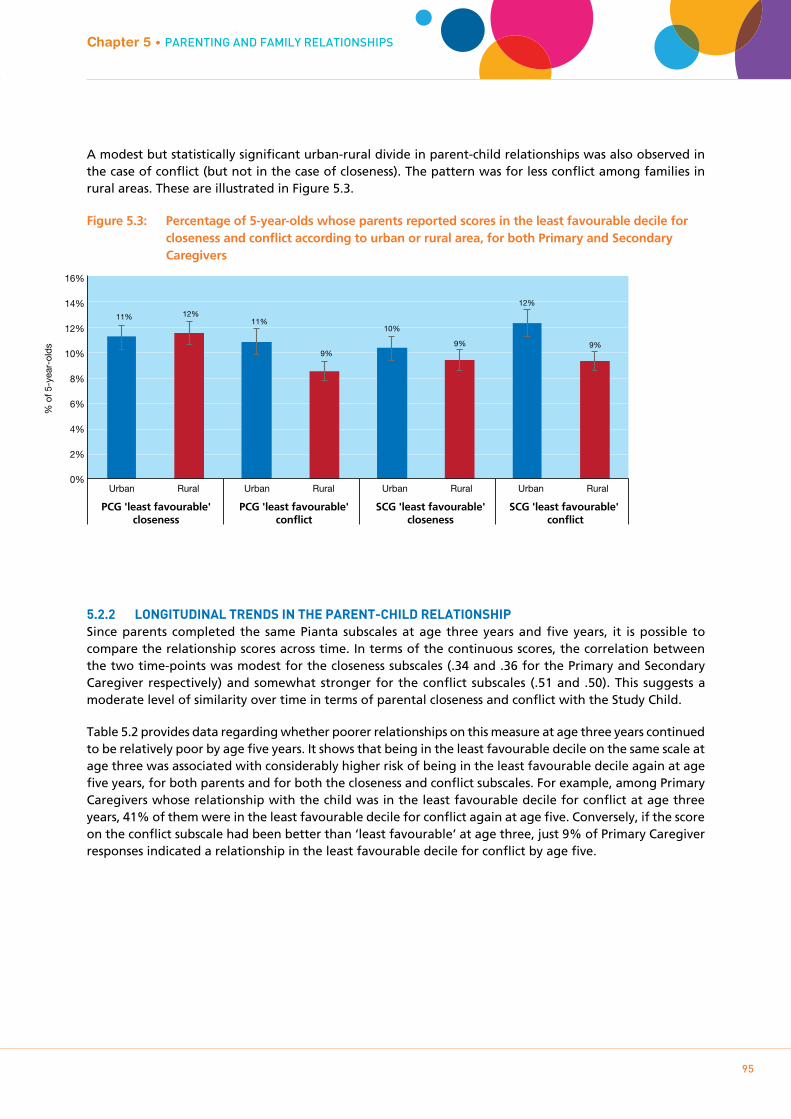
Growing Up in Ireland • THE LIVES OF 5-YEAR-OLDS
95
A modest but statistically significant urban-rural divide in parent-child relationships was also observed in the case of conflict (but not in the case of closeness). The pattern was for less conflict among families in rural areas. These are illustrated in Figure 5.3.
Figure 5.3: Percentage of 5-year-olds whose parents reported scores in the least favourable decile for closeness and conflict according to urban or rural area, for both Primary and Secondary Caregivers
5.2.2 LONgITUDINAL TRENDS IN THE pARENT-CHILD RELATIONSHIpSince parents completed the same Pianta subscales at age three years and five years, it is possible to compare the relationship scores across time. In terms of the continuous scores, the correlation between the two time-points was modest for the closeness subscales (.34 and .36 for the Primary and Secondary Caregiver respectively) and somewhat stronger for the conflict subscales (.51 and .50). This suggests a moderate level of similarity over time in terms of parental closeness and conflict with the Study Child.
Table 5.2 provides data regarding whether poorer relationships on this measure at age three years continued to be relatively poor by age five years. It shows that being in the least favourable decile on the same scale at age three was associated with considerably higher risk of being in the least favourable decile again at age five years, for both parents and for both the closeness and conflict subscales. For example, among Primary Caregivers whose relationship with the child was in the least favourable decile for conflict at age three years, 41% of them were in the least favourable decile for conflict again at age five. Conversely, if the score on the conflict subscale had been better than ‘least favourable’ at age three, just 9% of Primary Caregiver responses indicated a relationship in the least favourable decile for conflict by age five.
Chapter 5 • PAREnTIng AnD FAmILY RELATIOnSHIPS%
of 5
-yea
r-ol
ds
Urban Rural Urban Rural Urban Rural Urban Rural
PCG 'least favourable'closeness
PCG 'least favourable'conflict
SCG 'least favourable'closeness
SCG 'least favourable' conflict
0%
2%
4%
6%
8%
10%
12%
14%
16%
11% 12% 11%
9%
10%
9%
12%
9%
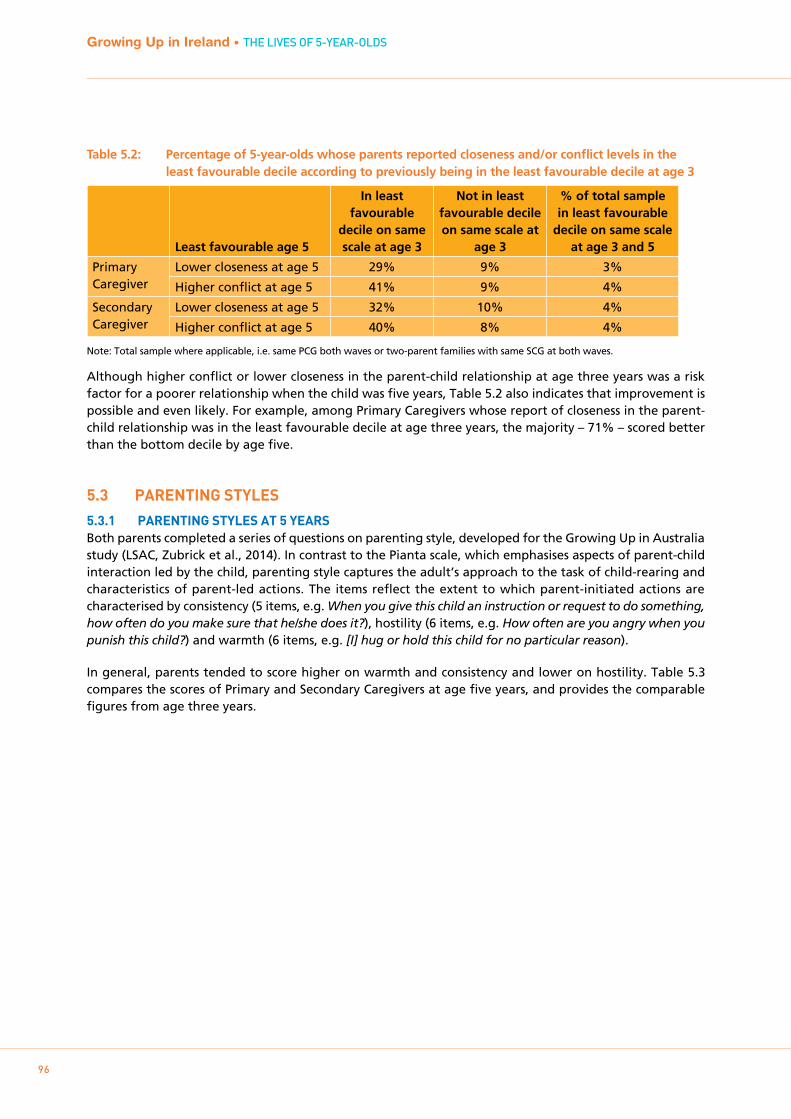
Growing Up in Ireland • THE LIVES OF 5-YEAR-OLDS
96
Table 5.2: Percentage of 5-year-olds whose parents reported closeness and/or conflict levels in the least favourable decile according to previously being in the least favourable decile at age 3
Least favourable age 5
In least favourable
decile on same scale at age 3
Not in least favourable decile on same scale at
age 3
% of total sample in least favourable
decile on same scale at age 3 and 5
Primary Caregiver
Lower closeness at age 5 29% 9% 3%
Higher conflict at age 5 41% 9% 4%
Secondary Caregiver
Lower closeness at age 5 32% 10% 4%
Higher conflict at age 5 40% 8% 4%
Note: Total sample where applicable, i.e. same PCG both waves or two-parent families with same SCG at both waves.
Although higher conflict or lower closeness in the parent-child relationship at age three years was a risk factor for a poorer relationship when the child was five years, Table 5.2 also indicates that improvement is possible and even likely. For example, among Primary Caregivers whose report of closeness in the parent-child relationship was in the least favourable decile at age three years, the majority – 71% – scored better than the bottom decile by age five.
5.3 pARENTINg STYLES
5.3.1 pARENTINg STYLES AT 5 YEARSBoth parents completed a series of questions on parenting style, developed for the Growing Up in Australia study (LSAC, Zubrick et al., 2014). In contrast to the Pianta scale, which emphasises aspects of parent-child interaction led by the child, parenting style captures the adult’s approach to the task of child-rearing and characteristics of parent-led actions. The items reflect the extent to which parent-initiated actions are characterised by consistency (5 items, e.g. When you give this child an instruction or request to do something, how often do you make sure that he/she does it?), hostility (6 items, e.g. How often are you angry when you punish this child?) and warmth (6 items, e.g. [I] hug or hold this child for no particular reason).
In general, parents tended to score higher on warmth and consistency and lower on hostility. Table 5.3 compares the scores of Primary and Secondary Caregivers at age five years, and provides the comparable figures from age three years.
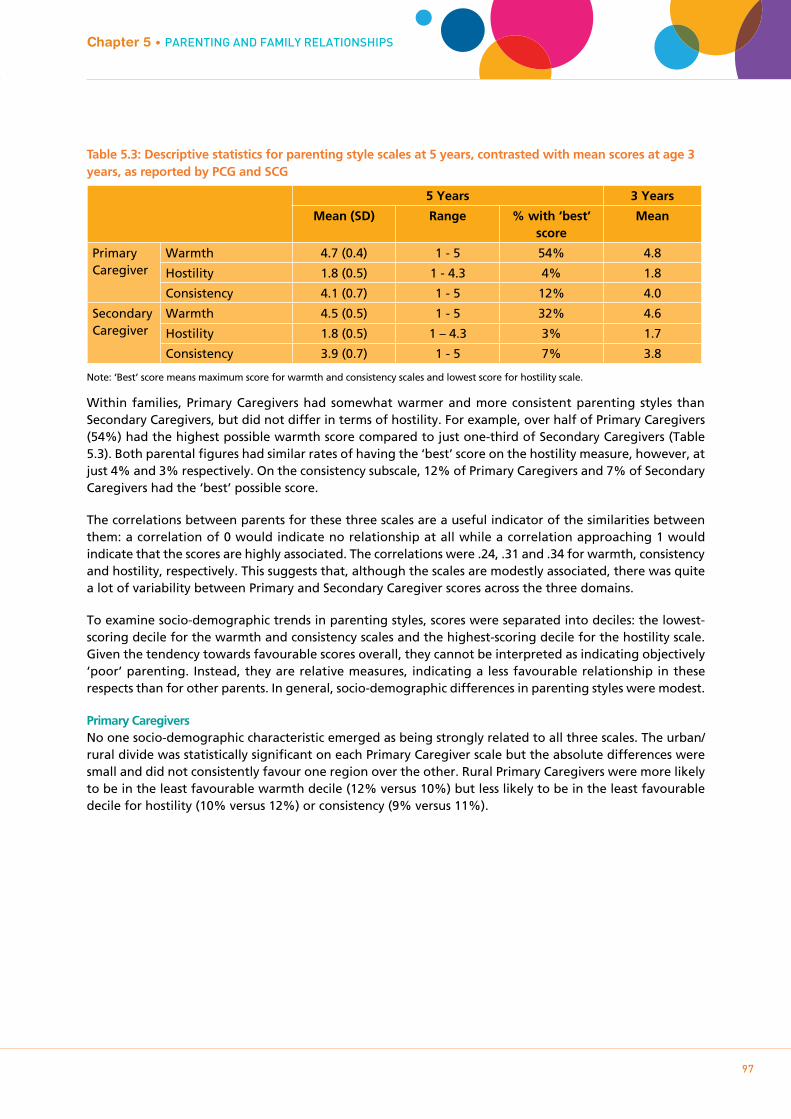
Growing Up in Ireland • THE LIVES OF 5-YEAR-OLDS
97
Table 5.3: Descriptive statistics for parenting style scales at 5 years, contrasted with mean scores at age 3 years, as reported by PCG and SCG
5 Years 3 Years
Mean (SD) Range % with ‘best’ score
Mean
Primary Caregiver
Warmth 4.7 (0.4) 1 - 5 54% 4.8
Hostility 1.8 (0.5) 1 - 4.3 4% 1.8
Consistency 4.1 (0.7) 1 - 5 12% 4.0
Secondary Caregiver
Warmth 4.5 (0.5) 1 - 5 32% 4.6
Hostility 1.8 (0.5) 1 – 4.3 3% 1.7
Consistency 3.9 (0.7) 1 - 5 7% 3.8
Note: ‘Best’ score means maximum score for warmth and consistency scales and lowest score for hostility scale.
Within families, Primary Caregivers had somewhat warmer and more consistent parenting styles than Secondary Caregivers, but did not differ in terms of hostility. For example, over half of Primary Caregivers (54%) had the highest possible warmth score compared to just one-third of Secondary Caregivers (Table 5.3). Both parental figures had similar rates of having the ‘best’ score on the hostility measure, however, at just 4% and 3% respectively. On the consistency subscale, 12% of Primary Caregivers and 7% of Secondary Caregivers had the ‘best’ possible score.
The correlations between parents for these three scales are a useful indicator of the similarities between them: a correlation of 0 would indicate no relationship at all while a correlation approaching 1 would indicate that the scores are highly associated. The correlations were .24, .31 and .34 for warmth, consistency and hostility, respectively. This suggests that, although the scales are modestly associated, there was quite a lot of variability between Primary and Secondary Caregiver scores across the three domains.
To examine socio-demographic trends in parenting styles, scores were separated into deciles: the lowest-scoring decile for the warmth and consistency scales and the highest-scoring decile for the hostility scale. Given the tendency towards favourable scores overall, they cannot be interpreted as indicating objectively ‘poor’ parenting. Instead, they are relative measures, indicating a less favourable relationship in these respects than for other parents. In general, socio-demographic differences in parenting styles were modest.
Primary CaregiversNo one socio-demographic characteristic emerged as being strongly related to all three scales. The urban/rural divide was statistically significant on each Primary Caregiver scale but the absolute differences were small and did not consistently favour one region over the other. Rural Primary Caregivers were more likely to be in the least favourable warmth decile (12% versus 10%) but less likely to be in the least favourable decile for hostility (10% versus 12%) or consistency (9% versus 11%).
Chapter 5 • PAREnTIng AnD FAmILY RELATIOnSHIPS

Growing Up in Ireland • THE LIVES OF 5-YEAR-OLDS
98
Figure 5.4: Percentage of 5-year-olds whose Primary Caregivers reported levels of warmth, hostility and consistency in the least favourable decile, by family type
On the warmth scale, the biggest differences were observed in relation to family size rather than whether it was a one-parent or two-parent family. Primary Caregivers in one-child families were less likely to be in the least favourable warmth decile (Figure 5.4). Only 6% of one-parent/one-child Primary Caregivers were lower in warmth, compared to 13% of those in one-parent/multi-child families. Similarly, for two-parent families, only 7% of Primary Caregivers with one child were in the least favourable warmth decile compared to 12% of those with more than one child.
On the hostility scale, Primary Caregivers were more likely to be in the least favourable decile if the Study Child was a boy, but again, the absolute differences were small (12% compared to 10%). Primary Caregivers in one-parent families with multiple children were the most likely to be in the least favourable hostility category (15%) and those in two- parent/one-child families were the least likely (8%).
Primary Caregivers in one-parent/multi-child families were also the most likely to feature in the least favourable decile for consistency (18%), with those in two-parent/multi-child families the least likely (9%). The consistency measure showed more socio-demographic trends than either warmth or hostility, with an increased likelihood of a Primary Caregiver being in the least favourable decile also observed for income (lowest income quintile 15% versus 7% in highest); education (Junior Cert. education 19% versus 7% for degree-level) and social class (13% semi/unskilled versus 7% professional/managerial).
Secondary CaregiversThere were also relatively few socio-demographic trends for the Secondary Caregivers’ parenting styles. Child’s gender was statistically significant for two of the scales, but with modest absolute differences: Secondary Caregivers were more hostile towards boys than girls (12% versus 9%) but less consistent with girls (16% in lowest decile compared to 11% for boys).
% o
f 5-y
ear-
olds
0%
2%
4%
6%
8%
10%
12%
14%
16%
18%
20%
22%
6%
13%
7%
12%
12%
15%
8%
11%
13%
18%
11%
9%
One
par
ent,
one
child
One
par
ent,
two+
chi
ldre
n
Two
pare
nts,
one
chi
ld
Two
pare
nts,
two+
chi
ldre
n
One
par
ent,
one
child
One
par
ent,
two+
chi
ldre
n
Two
pare
nts,
one
chi
ld
Two
pare
nts,
two+
chi
ldre
n
One
par
ent,
one
child
One
par
ent,
two+
chi
ldre
n
Two
pare
nts,
one
chi
ld
Two
pare
nts,
two+
chi
ldre
n
Lower warmth Higher hostility Lower consistency
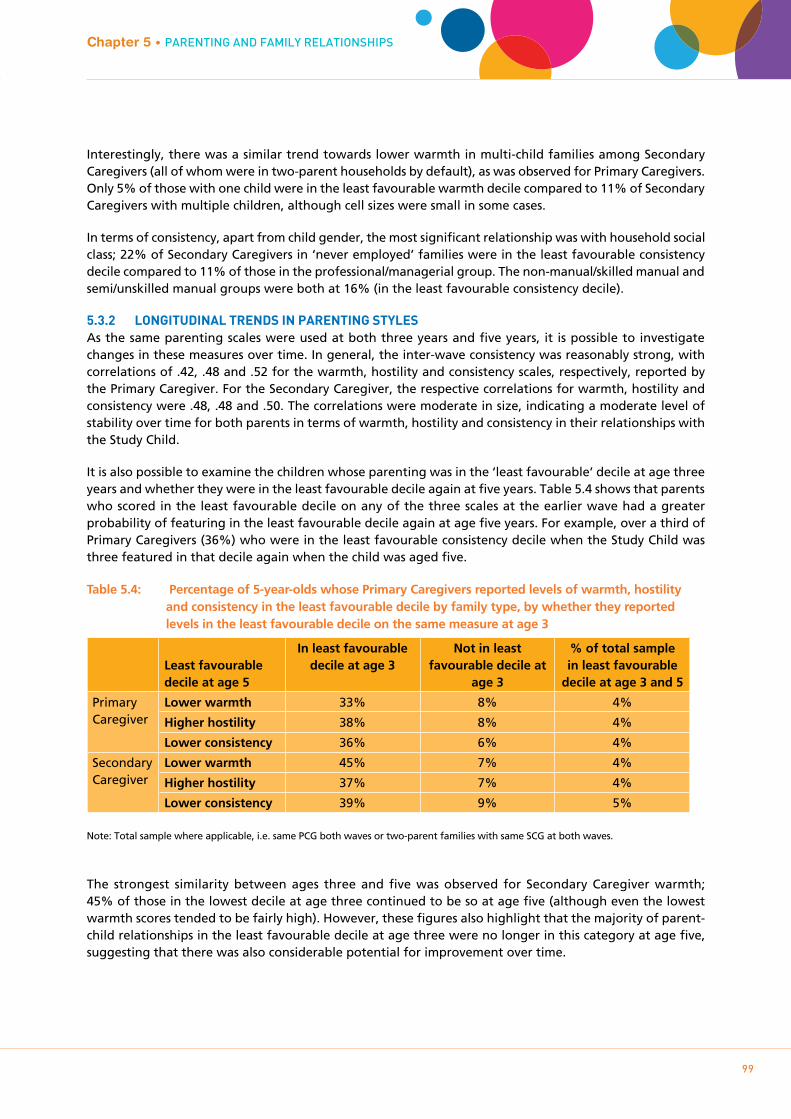
Growing Up in Ireland • THE LIVES OF 5-YEAR-OLDS
99
Interestingly, there was a similar trend towards lower warmth in multi-child families among Secondary Caregivers (all of whom were in two-parent households by default), as was observed for Primary Caregivers. Only 5% of those with one child were in the least favourable warmth decile compared to 11% of Secondary Caregivers with multiple children, although cell sizes were small in some cases.
In terms of consistency, apart from child gender, the most significant relationship was with household social class; 22% of Secondary Caregivers in ‘never employed’ families were in the least favourable consistency decile compared to 11% of those in the professional/managerial group. The non-manual/skilled manual and semi/unskilled manual groups were both at 16% (in the least favourable consistency decile).
5.3.2 LONgITUDINAL TRENDS IN pARENTINg STYLESAs the same parenting scales were used at both three years and five years, it is possible to investigate changes in these measures over time. In general, the inter-wave consistency was reasonably strong, with correlations of .42, .48 and .52 for the warmth, hostility and consistency scales, respectively, reported by the Primary Caregiver. For the Secondary Caregiver, the respective correlations for warmth, hostility and consistency were .48, .48 and .50. The correlations were moderate in size, indicating a moderate level of stability over time for both parents in terms of warmth, hostility and consistency in their relationships with the Study Child.
It is also possible to examine the children whose parenting was in the ‘least favourable’ decile at age three years and whether they were in the least favourable decile again at five years. Table 5.4 shows that parents who scored in the least favourable decile on any of the three scales at the earlier wave had a greater probability of featuring in the least favourable decile again at age five years. For example, over a third of Primary Caregivers (36%) who were in the least favourable consistency decile when the Study Child was three featured in that decile again when the child was aged five.
Table 5.4: Percentage of 5-year-olds whose Primary Caregivers reported levels of warmth, hostility and consistency in the least favourable decile by family type, by whether they reported levels in the least favourable decile on the same measure at age 3
Least favourable decile at age 5
In least favourable decile at age 3
Not in least favourable decile at
age 3
% of total sample in least favourable
decile at age 3 and 5
Primary Caregiver
Lower warmth 33% 8% 4%
Higher hostility 38% 8% 4%
Lower consistency 36% 6% 4%
Secondary Caregiver
Lower warmth 45% 7% 4%
Higher hostility 37% 7% 4%
Lower consistency 39% 9% 5%
Note: Total sample where applicable, i.e. same PCG both waves or two-parent families with same SCG at both waves.
The strongest similarity between ages three and five was observed for Secondary Caregiver warmth; 45% of those in the lowest decile at age three continued to be so at age five (although even the lowest warmth scores tended to be fairly high). However, these figures also highlight that the majority of parent-child relationships in the least favourable decile at age three were no longer in this category at age five, suggesting that there was also considerable potential for improvement over time.
Chapter 5 • PAREnTIng AnD FAmILY RELATIOnSHIPS
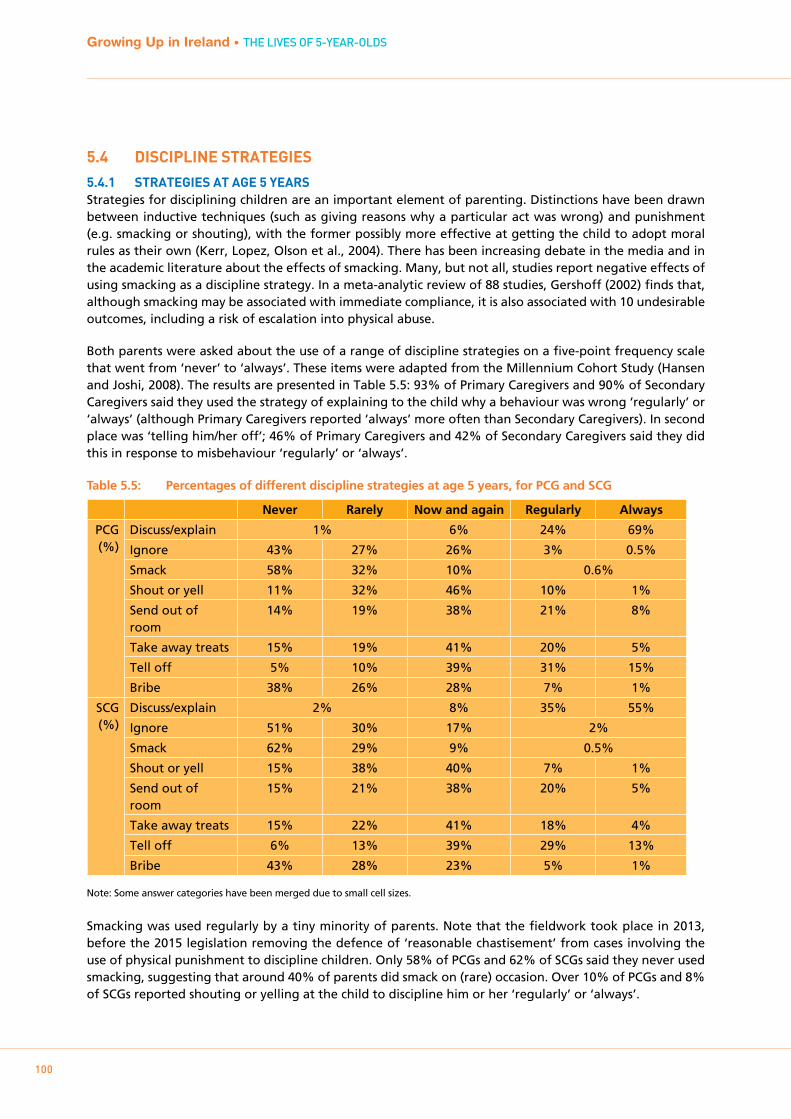
Growing Up in Ireland • THE LIVES OF 5-YEAR-OLDS
100
5.4 DISCIpLINE STRATEgIES
5.4.1 STRATEgIES AT AgE 5 YEARSStrategies for disciplining children are an important element of parenting. Distinctions have been drawn between inductive techniques (such as giving reasons why a particular act was wrong) and punishment (e.g. smacking or shouting), with the former possibly more effective at getting the child to adopt moral rules as their own (Kerr, Lopez, Olson et al., 2004). There has been increasing debate in the media and in the academic literature about the effects of smacking. Many, but not all, studies report negative effects of using smacking as a discipline strategy. In a meta-analytic review of 88 studies, Gershoff (2002) finds that, although smacking may be associated with immediate compliance, it is also associated with 10 undesirable outcomes, including a risk of escalation into physical abuse.
Both parents were asked about the use of a range of discipline strategies on a five-point frequency scale that went from ‘never’ to ‘always’. These items were adapted from the Millennium Cohort Study (Hansen and Joshi, 2008). The results are presented in Table 5.5: 93% of Primary Caregivers and 90% of Secondary Caregivers said they used the strategy of explaining to the child why a behaviour was wrong ‘regularly’ or ‘always’ (although Primary Caregivers reported ‘always’ more often than Secondary Caregivers). In second place was ‘telling him/her off’; 46% of Primary Caregivers and 42% of Secondary Caregivers said they did this in response to misbehaviour ‘regularly’ or ‘always’.
Table 5.5: Percentages of different discipline strategies at age 5 years, for PCG and SCG
Never Rarely Now and again Regularly Always
PCG (%)
Discuss/explain 1% 6% 24% 69%
Ignore 43% 27% 26% 3% 0.5%
Smack 58% 32% 10% 0.6%
Shout or yell 11% 32% 46% 10% 1%
Send out of room
14% 19% 38% 21% 8%
Take away treats 15% 19% 41% 20% 5%
Tell off 5% 10% 39% 31% 15%
Bribe 38% 26% 28% 7% 1%
SCG (%)
Discuss/explain 2% 8% 35% 55%
Ignore 51% 30% 17% 2%
Smack 62% 29% 9% 0.5%
Shout or yell 15% 38% 40% 7% 1%
Send out of room
15% 21% 38% 20% 5%
Take away treats 15% 22% 41% 18% 4%
Tell off 6% 13% 39% 29% 13%
Bribe 43% 28% 23% 5% 1%
Note: Some answer categories have been merged due to small cell sizes.
Smacking was used regularly by a tiny minority of parents. Note that the fieldwork took place in 2013, before the 2015 legislation removing the defence of ‘reasonable chastisement’ from cases involving the use of physical punishment to discipline children. Only 58% of PCGs and 62% of SCGs said they never used smacking, suggesting that around 40% of parents did smack on (rare) occasion. Over 10% of PCGs and 8% of SCGs reported shouting or yelling at the child to discipline him or her ‘regularly’ or ‘always’.
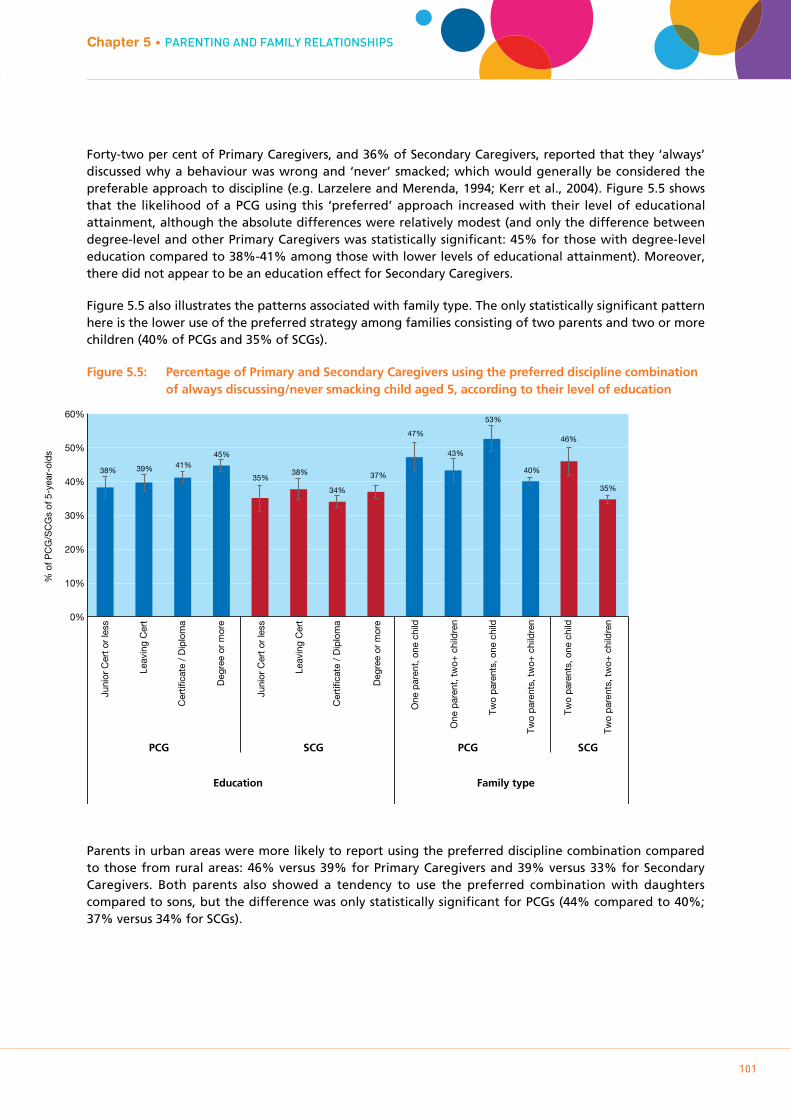
Growing Up in Ireland • THE LIVES OF 5-YEAR-OLDS
101
Forty-two per cent of Primary Caregivers, and 36% of Secondary Caregivers, reported that they ‘always’ discussed why a behaviour was wrong and ‘never’ smacked; which would generally be considered the preferable approach to discipline (e.g. Larzelere and Merenda, 1994; Kerr et al., 2004). Figure 5.5 shows that the likelihood of a PCG using this ‘preferred’ approach increased with their level of educational attainment, although the absolute differences were relatively modest (and only the difference between degree-level and other Primary Caregivers was statistically significant: 45% for those with degree-level education compared to 38%-41% among those with lower levels of educational attainment). Moreover, there did not appear to be an education effect for Secondary Caregivers.
Figure 5.5 also illustrates the patterns associated with family type. The only statistically significant pattern here is the lower use of the preferred strategy among families consisting of two parents and two or more children (40% of PCGs and 35% of SCGs).
Figure 5.5: Percentage of Primary and Secondary Caregivers using the preferred discipline combination of always discussing/never smacking child aged 5, according to their level of education
Parents in urban areas were more likely to report using the preferred discipline combination compared to those from rural areas: 46% versus 39% for Primary Caregivers and 39% versus 33% for Secondary Caregivers. Both parents also showed a tendency to use the preferred combination with daughters compared to sons, but the difference was only statistically significant for PCGs (44% compared to 40%; 37% versus 34% for SCGs).
Chapter 5 • PAREnTIng AnD FAmILY RELATIOnSHIPS%
of P
CG
/SC
Gs
of 5
-yea
r-ol
ds
One
par
ent,
one
child
One
par
ent,
two+
chi
ldre
n
Two
pare
nts,
one
chi
ld
Two
pare
nts,
two+
chi
ldre
n
Two
pare
nts,
one
chi
ld
Two
pare
nts,
two+
chi
ldre
n0%
10%
20%
30%
40%
50%
60%
38% 39% 41% 45%
35% 38%
34%
37%
47%
43%
53%
40%
46%
35%
Juni
or C
ert o
r le
ss
Leav
ing
Cer
t
Cer
tific
ate
/ D
iplo
ma
Deg
ree
or m
ore
Juni
or C
ert o
r le
ss
Leav
ing
Cer
t
Cer
tific
ate
/ D
iplo
ma
Deg
ree
or m
ore
PCG SCG PCG SCG
Education Family type

Growing Up in Ireland • THE LIVES OF 5-YEAR-OLDS
102
5.5 pARENTINg STRESS
5.5.1 pARENTAL STRESS IN pRImARY AND SECONDARY CAREgIVERSEach parent completed the parental stressors subscale from the Berry and Jones (1995) Parenting Stress Scale. This subscale includes items specifically related to the demands of parenting the Study Child (e.g. ‘takes more time and energy than I have to give’). These questions were combined to produce a total stress score that could range from 6 to 30, with higher scores indicating higher levels of stress. The mean scores for Primary and Secondary Caregivers were 11.7 and 11.4, respectively, indicating relatively low levels of stress overall.
If the range of scores on the parental stress measure is divided into deciles, there are some socio-demographic patterns for ‘high stress’ among Primary Caregivers but less so for Secondary Caregivers. Differences by family structure, however, are evident for both parents. Figure 5.6 shows that Primary Caregivers in one-parent/one-child families were most likely to feel stressed by parenting the Study Child (25% in the top decile) and those in two-parent/multi-child households the least stressed (7% in the top decile).
Figure 5.6: Percentage of Primary and Secondary Caregivers of a child aged 5 in the highest decile of parental stress according to family type and household social class
Similarly, Secondary Caregivers in one-child families experienced more parental stress than those with multiple children (15% compared to 10%).
In relation to parental stress by household social class, however (also Figure 5.6), only the differences for Primary Caregivers showed a statistically significant pattern. Those in the least advantaged households (‘never employed’) were significantly more likely to be in the highest stress decile (19%) than those in the ‘professional/managerial’ group (8%). For both parents, those in urban areas were somewhat more likely than their rural peers to be in the most-stressed decile although the absolute differences were modest (not illustrated): 12% versus 8% for Primary Caregivers and 11% versus 9% for Secondary Caregivers.
% o
f PC
G/S
CG
s of
5-y
ear-
olds
One
par
ent,
one
child
One
par
ent,
two+
chi
ldre
n
Two
pare
nts,
one
chi
ld
Two
pare
nts,
two+
chi
ldre
n
Two
pare
nts,
one
chi
ld
Two
pare
nts,
two+
chi
ldre
n
PCG SCG PCG SCG
0%
5%
10%
15%
20%
25%
30%
35%
25%
16%
14%
7%
15%
10%
8%
9%
11%
19%
10% 10%
12%
14%
Family type Social class
Pro
fess
iona
l / M
anag
eria
l
Non
- /
Ski
lled
Man
ual
Sem
i- /
Uns
kille
d
Nev
er W
orke
d
Pro
fess
iona
l / M
anag
eria
l
Non
- /
Ski
lled
Man
ual
Sem
i- /
Uns
kille
d
Nev
er W
orke
d

Growing Up in Ireland • THE LIVES OF 5-YEAR-OLDS
103
5.5.2 LONgITUDINAL TRENDS IN pARENTAL STRESSParents completed the same measure of stress at both previous waves. The correlation between parental stress experienced over the three-year and five-year interviews was moderate, at .58 for Primary Caregivers and .48 for Secondary Caregivers.
The correlation between age nine months and age five years stress measurements of parents was weaker but still statistically significant (.33 for both parents). Slightly less than 2% of Primary Caregivers were in the highest stress decile at all three waves.
Focusing on Primary Caregivers who were in the top decile for parental stress at either nine months or three years, or both previous waves, there is an increasing likelihood of being in the top decile again when the Study Child is aged five years. Figure 5.7 shows that half (51%) of those Primary Caregivers who were stressed at both nine months and three years were in the most stressed group again at age five years. This compares to just 5% of Primary Caregivers who were not in the high stress group at either of the previous waves, and intermediate levels for those who were stressed at one but not both of the earlier time-points.
Figure 5.7: Risk of the Primary Caregiver being in the highest stress decile at age 5 years based on being in the highest decile at previous waves
It is worth noting, however, that almost half of those who had been in the high-stress group at both previous waves were no longer in this category by the time the Study Child was five years old. This evidence of both persistence and change means that future studies to identify the factors associated with both could yield important insights for policy to support parents.
Chapter 5 • PAREnTIng AnD FAmILY RELATIOnSHIPS
0%
10%
20%
30%
40%
50%
60%
% in
the
high
est P
CG
str
ess
deci
le a
t 5 y
ears
5%
15%
33%
51%
Not stressed at 9 months or 3 years
Stressed at 9 months but not 3 years
Stressed at 3 years but not 9 months
Stressed at 9 months and 3 years
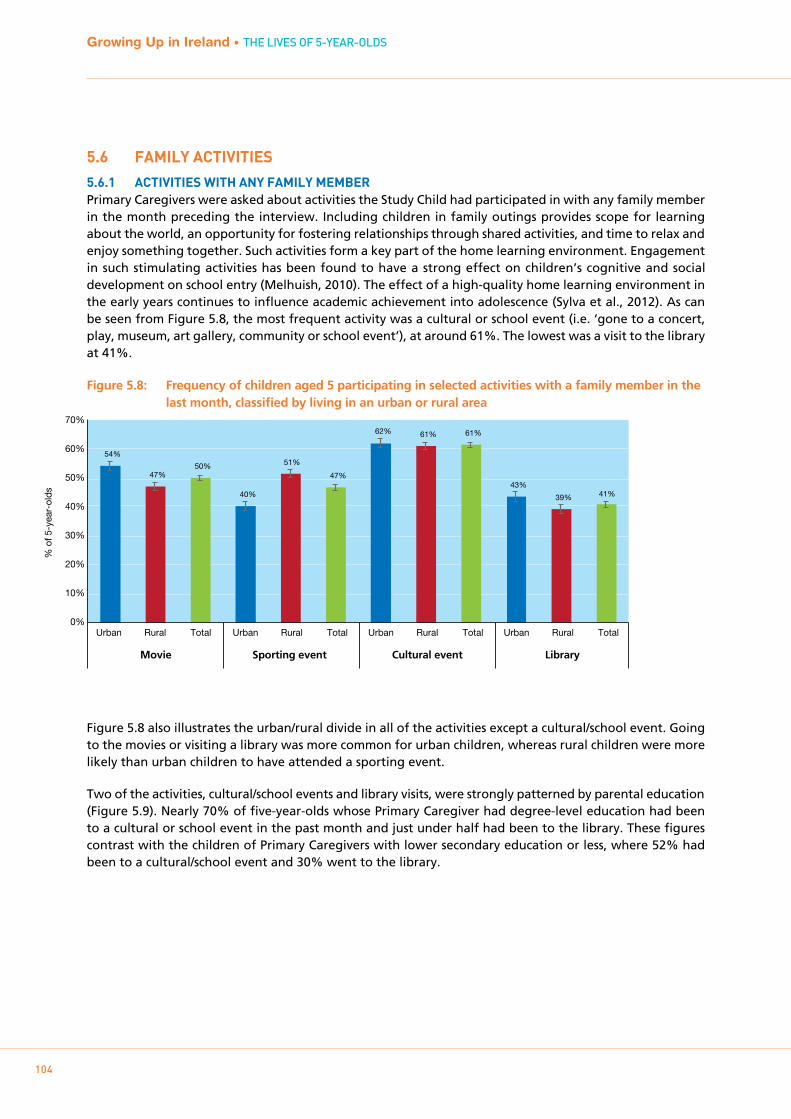
Growing Up in Ireland • THE LIVES OF 5-YEAR-OLDS
104
5.6 FAmILY ACTIVITIES
5.6.1 ACTIVITIES wITH ANY FAmILY mEmbERPrimary Caregivers were asked about activities the Study Child had participated in with any family member in the month preceding the interview. Including children in family outings provides scope for learning about the world, an opportunity for fostering relationships through shared activities, and time to relax and enjoy something together. Such activities form a key part of the home learning environment. Engagement in such stimulating activities has been found to have a strong effect on children’s cognitive and social development on school entry (Melhuish, 2010). The effect of a high-quality home learning environment in the early years continues to influence academic achievement into adolescence (Sylva et al., 2012). As can be seen from Figure 5.8, the most frequent activity was a cultural or school event (i.e. ‘gone to a concert, play, museum, art gallery, community or school event’), at around 61%. The lowest was a visit to the library at 41%.
Figure 5.8: Frequency of children aged 5 participating in selected activities with a family member in the last month, classified by living in an urban or rural area
Figure 5.8 also illustrates the urban/rural divide in all of the activities except a cultural/school event. Going to the movies or visiting a library was more common for urban children, whereas rural children were more likely than urban children to have attended a sporting event.
Two of the activities, cultural/school events and library visits, were strongly patterned by parental education (Figure 5.9). Nearly 70% of five-year-olds whose Primary Caregiver had degree-level education had been to a cultural or school event in the past month and just under half had been to the library. These figures contrast with the children of Primary Caregivers with lower secondary education or less, where 52% had been to a cultural/school event and 30% went to the library.
0%
10%
20%
30%
40%
50%
60%
70%
% o
f 5-y
ear-
olds
Urban Rural Total Urban Rural Total Urban Rural Total Urban Rural Total
54%
47% 50%
40%
51%
47%
62% 61% 61%
43%
39% 41%
Movie Sporting event Cultural event Library

Growing Up in Ireland • THE LIVES OF 5-YEAR-OLDS
105
Figure 5.9: Percentage of children aged 5 attending a cultural/school event or visiting a library with a family member in the past month, according to the Primary Caregiver’s level of education
5.6.2 ACTIVITIES wITH THE pRImARY CAREgIVERThe Primary Caregiver was also asked specifically about play activities and outings they personally conducted with the Study Child. The answers to these items were not confined to a specific period in time but instead were on a five-point frequency scale ranging from ‘never’ to ‘every day’; they are summarised in Table 5.6. This table indicates that the most frequent parent-child activities (i.e. at least once or twice a week) were play using toys, games or puzzles (76%), sports or physical activities (63%) and going shopping (63%).
Table 5.6: Frequency of play activities and outings between Primary Caregiver and Study Child
Never Hardly ever Occasionally 1-2 times a week
Every day
Play with child using toys or games/puzzles
1% 2% 21% 40% 36%
Play computer games with child
40% 18% 21% 16% 6%
Visit the library 37% 14% 37% 12% <1%
Use computer with child in educational ways
31% 17% 28% 18% 5%
Sport or physical activities 6% 7% 24% 41% 22%
Go on educational visits, such as museums, farms
7% 11% 69% 12% 1%
Go shopping 1% 5% 30% 58% 5%
Figure 5.10 shows the number of children who engaged in a particular activity with the Primary Caregiver ‘one or two times a week’ or ‘every day’, according to that person’s level of education and the Study Child’s family type. The featured activities are ‘playing with the child using toys or games/puzzles’, educational computer activities and sports/physical activities – all activities that could feasibly be done in most homes. There was a relatively high level of engagement in sports and play, with a lower level of engagement in play using toys, games or puzzles. Primary Caregivers in two-parent one-child families were the most
Chapter 5 • PAREnTIng AnD FAmILY RELATIOnSHIPS
0%
10%
20%
30%
40%
50%
60%
70%
80%
Leaving Cert Junior Certor less
Degree or more
Certificate / Diploma
Leaving Cert Junior Certor less
Degree or more
Certificate / Diploma
% o
f 5-y
ear-
olds
Cultural event Library
52% 54%
61%
69%
30% 34%
40%
49%
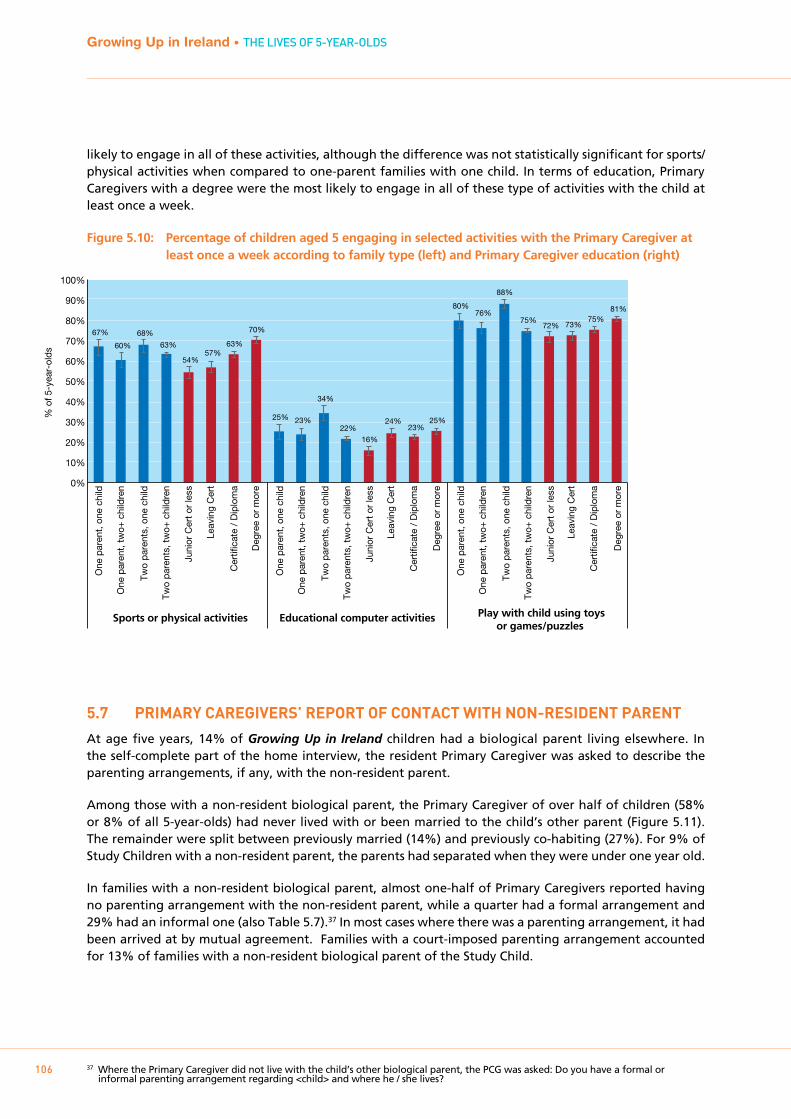
Growing Up in Ireland • THE LIVES OF 5-YEAR-OLDS
106
likely to engage in all of these activities, although the difference was not statistically significant for sports/physical activities when compared to one-parent families with one child. In terms of education, Primary Caregivers with a degree were the most likely to engage in all of these type of activities with the child at least once a week.
Figure 5.10: Percentage of children aged 5 engaging in selected activities with the Primary Caregiver at least once a week according to family type (left) and Primary Caregiver education (right)
5.7 pRImARY CAREgIVERS’ REpORT OF CONTACT wITH NON-RESIDENT pARENT
At age five years, 14% of Growing Up in Ireland children had a biological parent living elsewhere. In the self-complete part of the home interview, the resident Primary Caregiver was asked to describe the parenting arrangements, if any, with the non-resident parent.
Among those with a non-resident biological parent, the Primary Caregiver of over half of children (58% or 8% of all 5-year-olds) had never lived with or been married to the child’s other parent (Figure 5.11). The remainder were split between previously married (14%) and previously co-habiting (27%). For 9% of Study Children with a non-resident parent, the parents had separated when they were under one year old.
In families with a non-resident biological parent, almost one-half of Primary Caregivers reported having no parenting arrangement with the non-resident parent, while a quarter had a formal arrangement and 29% had an informal one (also Table 5.7).37 In most cases where there was a parenting arrangement, it had been arrived at by mutual agreement. Families with a court-imposed parenting arrangement accounted for 13% of families with a non-resident biological parent of the Study Child.
37 Where the Primary Caregiver did not live with the child’s other biological parent, the PCG was asked: Do you have a formal or informal parenting arrangement regarding <child> and where he / she lives?
% o
f 5-y
ear-
olds
One
par
ent,
one
child
One
par
ent,
two+
chi
ldre
n
Two
pare
nts,
one
chi
ld
Two
pare
nts,
two+
chi
ldre
n
Juni
or C
ert o
r le
ss
Cer
tific
ate
/ D
iplo
ma
Leav
ing
Cer
t
Deg
ree
or m
ore
One
par
ent,
one
child
One
par
ent,
two+
chi
ldre
n
Two
pare
nts,
one
chi
ld
Two
pare
nts,
two+
chi
ldre
n
Juni
or C
ert o
r le
ss
Cer
tific
ate
/ D
iplo
ma
Leav
ing
Cer
t
Deg
ree
or m
ore
One
par
ent,
one
child
One
par
ent,
two+
chi
ldre
n
Two
pare
nts,
one
chi
ld
Two
pare
nts,
two+
chi
ldre
n
Juni
or C
ert o
r le
ss
Cer
tific
ate
/ D
iplo
ma
Leav
ing
Cer
t
Deg
ree
or m
ore0%
10%
20%
30%
40%
50%
60%
70%
80%
90%
100%
67%
60%
68%
63%
54% 57%
63%
70%
25% 23%
34%
22%
16%
24% 23%
25%
80% 76%
88%
75% 72% 73%
75% 81%
Sports or physical activities Educational computer activities Play with child using toysor games/puzzles
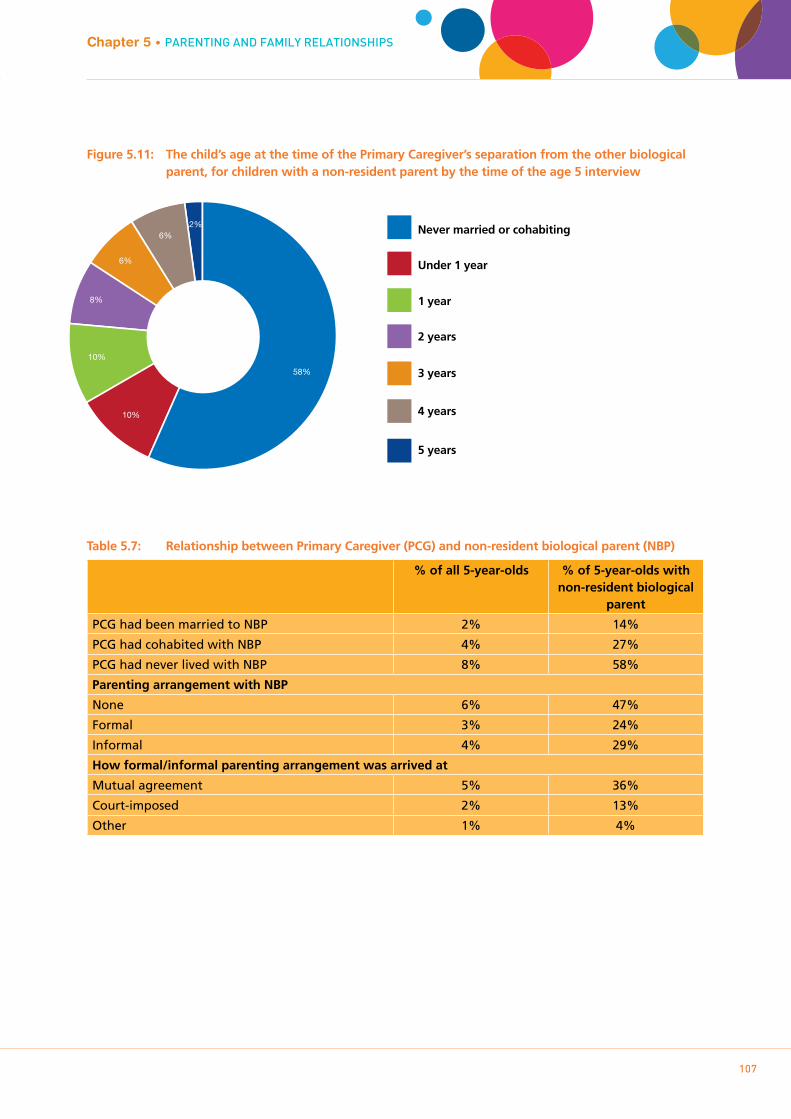
Growing Up in Ireland • THE LIVES OF 5-YEAR-OLDS
107
Figure 5.11: The child’s age at the time of the Primary Caregiver’s separation from the other biological parent, for children with a non-resident parent by the time of the age 5 interview
Table 5.7: Relationship between Primary Caregiver (PCG) and non-resident biological parent (NBP)
% of all 5-year-olds % of 5-year-olds with non-resident biological
parent
PCG had been married to NBP 2% 14%
PCG had cohabited with NBP 4% 27%
PCG had never lived with NBP 8% 58%
Parenting arrangement with NBP
None 6% 47%
Formal 3% 24%
Informal 4% 29%
How formal/informal parenting arrangement was arrived at
Mutual agreement 5% 36%
Court-imposed 2% 13%
Other 1% 4%
Chapter 5 • PAREnTIng AnD FAmILY RELATIOnSHIPS
5 years
4 years
3 years
2 years
1 year
Under 1 year
Never married or cohabiting
58%
10%
10%
6%
8%
6%2%
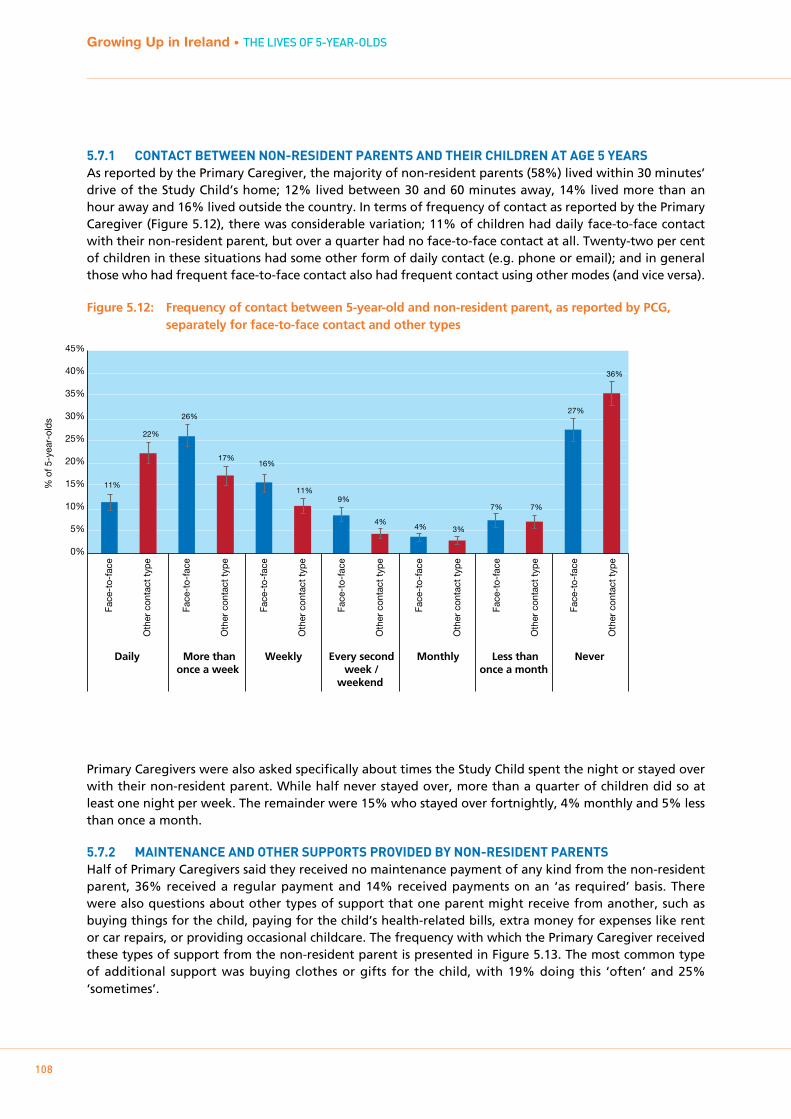
Growing Up in Ireland • THE LIVES OF 5-YEAR-OLDS
108
5.7.1 CONTACT bETwEEN NON-RESIDENT pARENTS AND THEIR CHILDREN AT AgE 5 YEARSAs reported by the Primary Caregiver, the majority of non-resident parents (58%) lived within 30 minutes’ drive of the Study Child’s home; 12% lived between 30 and 60 minutes away, 14% lived more than an hour away and 16% lived outside the country. In terms of frequency of contact as reported by the Primary Caregiver (Figure 5.12), there was considerable variation; 11% of children had daily face-to-face contact with their non-resident parent, but over a quarter had no face-to-face contact at all. Twenty-two per cent of children in these situations had some other form of daily contact (e.g. phone or email); and in general those who had frequent face-to-face contact also had frequent contact using other modes (and vice versa).
Figure 5.12: Frequency of contact between 5-year-old and non-resident parent, as reported by PCG, separately for face-to-face contact and other types
Primary Caregivers were also asked specifically about times the Study Child spent the night or stayed over with their non-resident parent. While half never stayed over, more than a quarter of children did so at least one night per week. The remainder were 15% who stayed over fortnightly, 4% monthly and 5% less than once a month.
5.7.2 mAINTENANCE AND OTHER SUppORTS pROVIDED bY NON-RESIDENT pARENTSHalf of Primary Caregivers said they received no maintenance payment of any kind from the non-resident parent, 36% received a regular payment and 14% received payments on an ‘as required’ basis. There were also questions about other types of support that one parent might receive from another, such as buying things for the child, paying for the child’s health-related bills, extra money for expenses like rent or car repairs, or providing occasional childcare. The frequency with which the Primary Caregiver received these types of support from the non-resident parent is presented in Figure 5.13. The most common type of additional support was buying clothes or gifts for the child, with 19% doing this ‘often’ and 25% ‘sometimes’.
% o
f 5-y
ear-
olds
0%
5%
10%
15%
20%
25%
30%
35%
40%
45%
11%
22%
26%
17% 16%
11% 9%
4% 4% 3%
7% 7%
27%
36%
Face
-to-
face
Oth
er c
onta
ct ty
pe
Face
-to-
face
Oth
er c
onta
ct ty
pe
Face
-to-
face
Oth
er c
onta
ct ty
pe
Face
-to-
face
Oth
er c
onta
ct ty
pe
Face
-to-
face
Oth
er c
onta
ct ty
pe
Face
-to-
face
Oth
er c
onta
ct ty
pe
Face
-to-
face
Oth
er c
onta
ct ty
pe
Daily More thanonce a week
Weekly Monthly Less thanonce a month
Never Every secondweek /
weekend
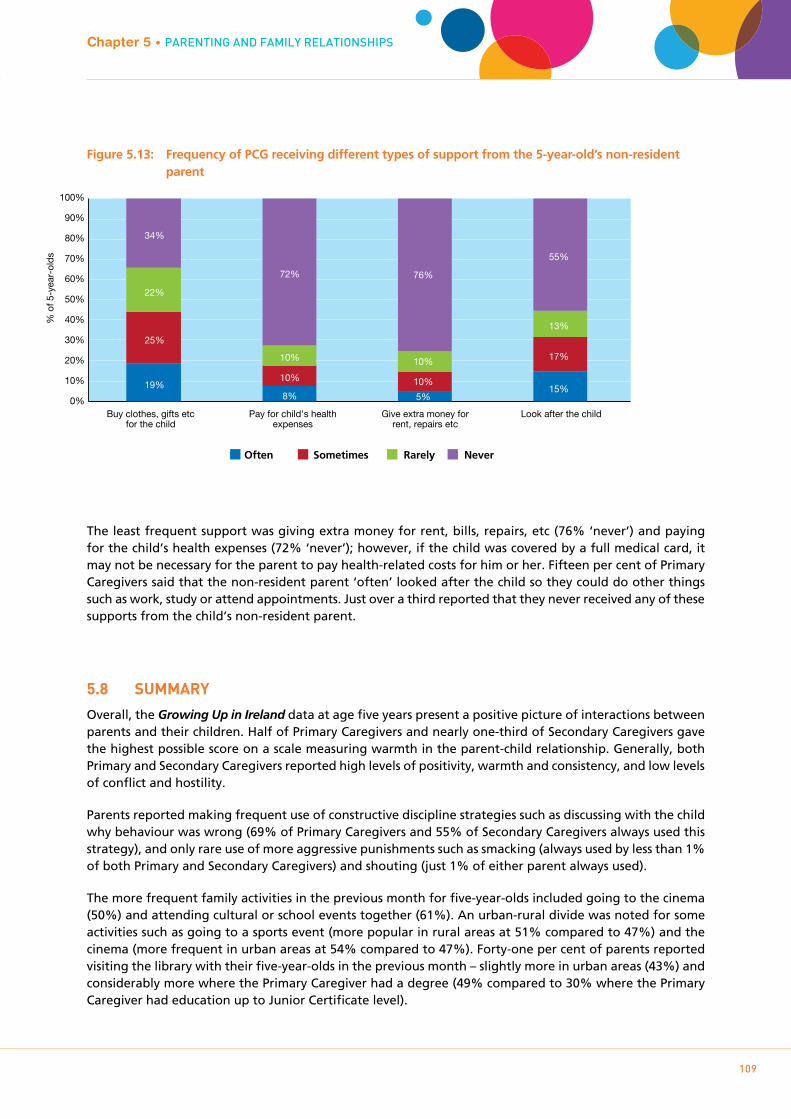
Growing Up in Ireland • THE LIVES OF 5-YEAR-OLDS
109
Figure 5.13: Frequency of PCG receiving different types of support from the 5-year-old’s non-resident parent
The least frequent support was giving extra money for rent, bills, repairs, etc (76% ‘never’) and paying for the child’s health expenses (72% ‘never’); however, if the child was covered by a full medical card, it may not be necessary for the parent to pay health-related costs for him or her. Fifteen per cent of Primary Caregivers said that the non-resident parent ‘often’ looked after the child so they could do other things such as work, study or attend appointments. Just over a third reported that they never received any of these supports from the child’s non-resident parent.
5.8 SUmmARY
Overall, the Growing Up in Ireland data at age five years present a positive picture of interactions between parents and their children. Half of Primary Caregivers and nearly one-third of Secondary Caregivers gave the highest possible score on a scale measuring warmth in the parent-child relationship. Generally, both Primary and Secondary Caregivers reported high levels of positivity, warmth and consistency, and low levels of conflict and hostility.
Parents reported making frequent use of constructive discipline strategies such as discussing with the child why behaviour was wrong (69% of Primary Caregivers and 55% of Secondary Caregivers always used this strategy), and only rare use of more aggressive punishments such as smacking (always used by less than 1% of both Primary and Secondary Caregivers) and shouting (just 1% of either parent always used).
The more frequent family activities in the previous month for five-year-olds included going to the cinema (50%) and attending cultural or school events together (61%). An urban-rural divide was noted for some activities such as going to a sports event (more popular in rural areas at 51% compared to 47%) and the cinema (more frequent in urban areas at 54% compared to 47%). Forty-one per cent of parents reported visiting the library with their five-year-olds in the previous month – slightly more in urban areas (43%) and considerably more where the Primary Caregiver had a degree (49% compared to 30% where the Primary Caregiver had education up to Junior Certificate level).
Chapter 5 • PAREnTIng AnD FAmILY RELATIOnSHIPS
Often Sometimes Rarely Never
Buy clothes, gifts etc for the child
Pay for child's health expenses
Give extra money for rent, repairs etc
Look after the child 0%
10%
20%
30%
40%
50%
60%
70%
80%
90%
100%
19% 8% 5%
15%
25%
10% 10%
17%
22%
10% 10%
13%
34%
72% 76%
55%
% o
f 5-y
ear-
olds
Growing Up in Ireland • THE LIVES OF 5-YEAR-OLDS
110
Popular activities specifically with the Primary Caregiver were playing with toys and games together (76% at least once a week), sports and physical activities (63% at least once a week), and going shopping (63%). Typically, a greater frequency of activities with parents was associated with being an only child and higher levels of parental education.
Interestingly, the comparative disadvantage of having siblings came through on a number of the parenting-related measures. Parents of only-children were more likely to report having a warmer relationship with their child, to discipline them with the preferred combination of ‘always discuss’ and ‘never smack’, and to play with them. Parental stress went in the opposite direction, however; parents of multiple children reported less stress as a result of the child. This might be because of prior parenting experience (with older siblings) or because they felt that the burdensome aspects of parenting were spread across the whole family rather than being attributed to just the Study Child.
Most aspects of parenting showed some level of continuity over time, especially between the three-year and five-year phases. In particular, Primary Caregivers who were the most stressed at both previous waves were the more likely than other PCGs to be in the highest-stress group again at age five. Similarly, 41% of Primary Caregivers whose parent-child conflict scores placed them in the highest or ‘worst’ decile when the child was age three were in the ‘worst’ decile again at age five years. However, there is evidence of change and improvement over time as well: only 2% of Primary Caregivers were in the ‘worst’ conflict decile at all three stages of the child’s development (9 months, 3 years and 5 years old).
The final section of this chapter described the arrangements between resident and non-resident parents of Study Children, as reported by the Primary Caregiver. The key feature emerging was the diversity of experiences of contact for the children; 37% of those with a non-resident parent had face-to-face contact several times a week, but 27% never had face-to-face contact.
Growing Up in Ireland • THE LIVES OF 5-YEAR-OLDS
111
Chapter 6ScHOOLIng AnD cOgnITIVE DEVELOPmEnT
112
Growing Up in Ireland • THE LIVES OF 5-YEAR-OLDS
6.1 INTRODUCTION
6.1.1 bACkgROUNDThere is increasing recognition that the extent to which an individual child is school-ready is an important variable in how well he or she makes the major transition to school, and can influence the child’s academic achievement over a longer period than those first few weeks (Duncan et al., 2007). It is also increasingly recognised that school-readiness is “a multi-dimensional construct that refers to cognitive, communicational, behavioural, and emotional skills, as well as basic knowledge that facilitates the child’s learning and adjustment at school entry” (Forget-Dubois et al, 2007, p.406). At the same time, there has been an increasing shift in the research and policy discourse from placing the onus on the child to be school-ready towards a recognition of the interplay between child, family and school factors in facilitating the transition (O’Kane, 2016). Adjusting to formal primary education requires the child to get to grips not just with new subjects and new ways of learning, but an unfamiliar physical environment where they must get to know new children and teachers. However, parents, preschool providers and primary school teachers are found to have different perspectives on the skills and competencies children should have before starting primary school (Ring et al., 2016). A more detailed study of the factors influencing the transition to primary school, based on Growing Up in Ireland data, has been published (Smyth, 2018).
An important feature of this Growing Up in Ireland Cohort ’08 is that they are among the first to have availed of a scheme introduced in 2010 aimed at giving all children the opportunity to experience one year in formal centre-based care prior to starting school (known colloquially as the ‘Free Pre-School Year’38); a primary aim of this is to improve school-readiness.39 At the time of the survey, this scheme was open to all children aged between three years, three months and four years, six months on September 1st of the relevant preschool year (September to June). It provided preschool sessions in approved centres for up to three hours per day, five days per week over 38 weeks, although parents could opt to pay for extra hours (where available). Coverage was further extended from September 2016, and from September 2018, children are able to start the scheme from two years and eight months old until the transfer to primary school. In addition, Budget 2018 announced the introduction of an Affordable Childcare Scheme with the goal to provide means-tested supports to cover provision for children up to 15 years of age. The extension of preschool provision has taken place in the context of a policy emphasis on promoting and monitoring the quality of provision and on offering an integrated curriculum framework, Aistear, which spans birth to six years of age (NCCA, 2009).
In Ireland, children can be enrolled in primary school from the age of four years, and legally must have started by the time they are six years old. Administrative data (DES, 2018) indicate that there has been an increase over time in the age at which children begin primary education, with the proportion of four-year-olds in junior infant classes declining from 47% in 1999-2000 to 27% in 2016-2017. While the increase accelerated after the rollout of the ECCE scheme, a trend towards later school start was already evident prior to this time-point. The primary school curriculum covers seven areas, some of which are further divided into subjects: language (English and Irish), mathematics, social, environmental and scientific education, arts education, physical education, social, personal and health education, and religious and ethical education (Government of Ireland, 1999). The primary curriculum is the subject of ongoing reform by the National Council for Curriculum and Assessment.40 The first two years of the eight-year primary school cycle are termed ‘Junior Infants’ and ‘Senior Infants’, respectively. The academic year runs from September to June, and a school day for this age group is usually about five hours long. As in other countries (see McGuinness et al., 2014), the primary curriculum in Ireland has a strong focus on a play-based, developmentally sensitive approach based on three core ideas: an emphasis on process rather than content, an acknowledgment that aspects of development are interdependent, and sensitivity to children’s developmental stage. “Achieving full potential in learning and development” is also a national outcome indicator in the National Policy Framework for Children and Young People, 2014-2020 (DCYA, 2014). However, the relative emphasis on
38 This is formally known as the Free Pre-School Year in Early Childhood Care and Education (ECCE) scheme.39 http://www.dcya.gov.ie/viewdoc.asp?fn=/documents/childcare/ECCE_guideforparents.ht40 The Aistear curriculum framework also spans the early years of primary education. Aistear and the primary curriculum are regarded
as complementary in terms of their key principles (NCCA, 2009). No research is available to date on the extent of implementation of Aistear in early-years primary classrooms.
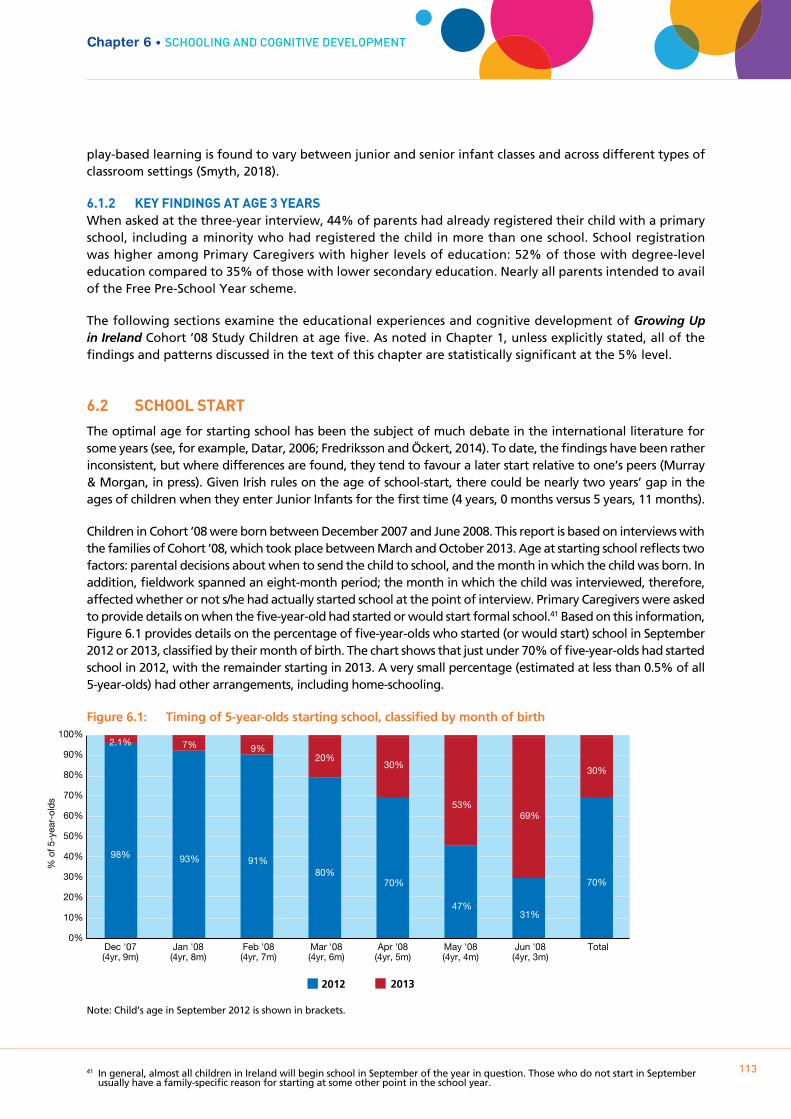
play-based learning is found to vary between junior and senior infant classes and across different types of classroom settings (Smyth, 2018).
6.1.2 kEY FINDINgS AT AgE 3 YEARSWhen asked at the three-year interview, 44% of parents had already registered their child with a primary school, including a minority who had registered the child in more than one school. School registration was higher among Primary Caregivers with higher levels of education: 52% of those with degree-level education compared to 35% of those with lower secondary education. Nearly all parents intended to avail of the Free Pre-School Year scheme.
The following sections examine the educational experiences and cognitive development of Growing Up in Ireland Cohort ’08 Study Children at age five. As noted in Chapter 1, unless explicitly stated, all of the findings and patterns discussed in the text of this chapter are statistically significant at the 5% level.
6.2 SCHOOL START
The optimal age for starting school has been the subject of much debate in the international literature for some years (see, for example, Datar, 2006; Fredriksson and Öckert, 2014). To date, the findings have been rather inconsistent, but where differences are found, they tend to favour a later start relative to one’s peers (Murray & Morgan, in press). Given Irish rules on the age of school-start, there could be nearly two years’ gap in the ages of children when they enter Junior Infants for the first time (4 years, 0 months versus 5 years, 11 months).
Children in Cohort ’08 were born between December 2007 and June 2008. This report is based on interviews with the families of Cohort ’08, which took place between March and October 2013. Age at starting school reflects two factors: parental decisions about when to send the child to school, and the month in which the child was born. In addition, fieldwork spanned an eight-month period; the month in which the child was interviewed, therefore, affected whether or not s/he had actually started school at the point of interview. Primary Caregivers were asked to provide details on when the five-year-old had started or would start formal school.41 Based on this information, Figure 6.1 provides details on the percentage of five-year-olds who started (or would start) school in September 2012 or 2013, classified by their month of birth. The chart shows that just under 70% of five-year-olds had started school in 2012, with the remainder starting in 2013. A very small percentage (estimated at less than 0.5% of all 5-year-olds) had other arrangements, including home-schooling.
Figure 6.1: Timing of 5-year-olds starting school, classified by month of birth
Note: Child’s age in September 2012 is shown in brackets.
41 In general, almost all children in Ireland will begin school in September of the year in question. Those who do not start in September usually have a family-specific reason for starting at some other point in the school year.
Chapter 6 • ScHOOLIng AnD cOgnITIVE DEVELOPmEnT
113
2012 2013
Dec '07(4yr, 9m)
Jan '08 (4yr, 8m)
Feb '08 (4yr, 7m)
Mar '08 (4yr, 6m)
Apr '08 (4yr, 5m)
May '08 (4yr, 4m)
Jun '08 (4yr, 3m)
Total 0%
10%
20%
30%
40%
50%
60%
70%
80%
90%
100%
98% 93% 91% 80%
70%
47% 31%
70%
2.1% 7% 9% 20%
30%
53% 69%
30%
% o
f 5-y
ear-
olds
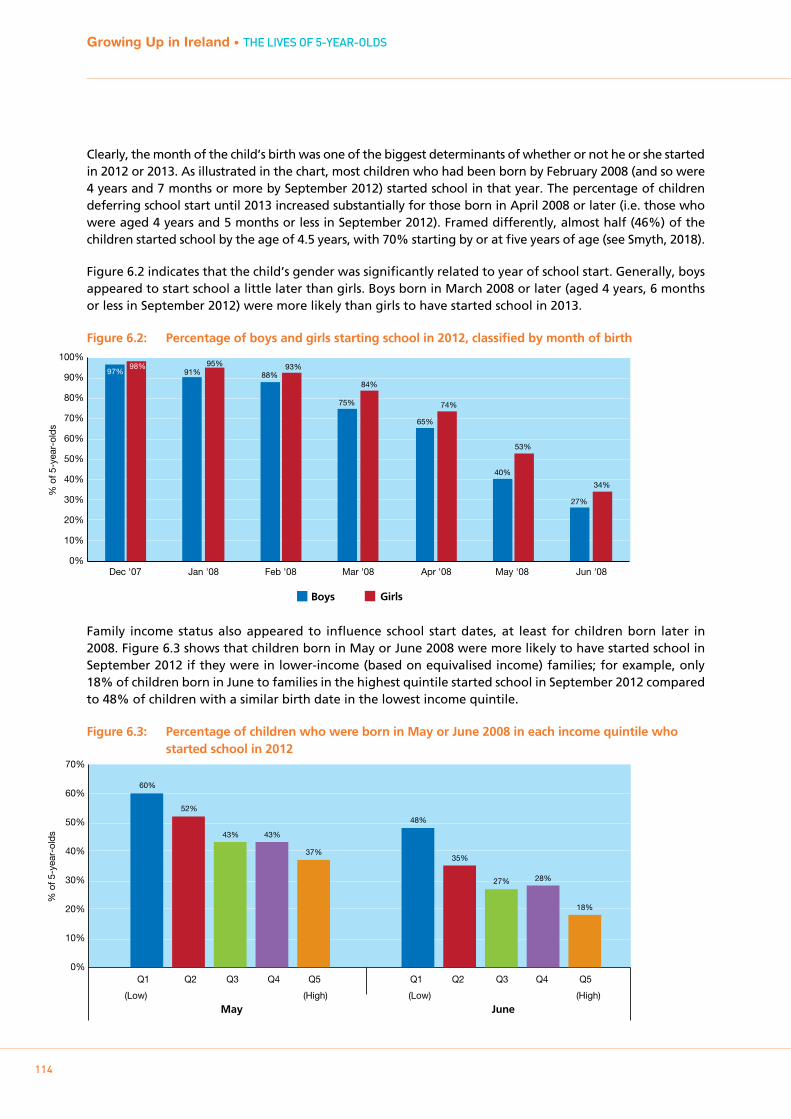
Growing Up in Ireland • THE LIVES OF 5-YEAR-OLDS
114
Clearly, the month of the child’s birth was one of the biggest determinants of whether or not he or she started in 2012 or 2013. As illustrated in the chart, most children who had been born by February 2008 (and so were 4 years and 7 months or more by September 2012) started school in that year. The percentage of children deferring school start until 2013 increased substantially for those born in April 2008 or later (i.e. those who were aged 4 years and 5 months or less in September 2012). Framed differently, almost half (46%) of the children started school by the age of 4.5 years, with 70% starting by or at five years of age (see Smyth, 2018).
Figure 6.2 indicates that the child’s gender was significantly related to year of school start. Generally, boys appeared to start school a little later than girls. Boys born in March 2008 or later (aged 4 years, 6 months or less in September 2012) were more likely than girls to have started school in 2013.
Figure 6.2: Percentage of boys and girls starting school in 2012, classified by month of birth
Family income status also appeared to influence school start dates, at least for children born later in 2008. Figure 6.3 shows that children born in May or June 2008 were more likely to have started school in September 2012 if they were in lower-income (based on equivalised income) families; for example, only 18% of children born in June to families in the highest quintile started school in September 2012 compared to 48% of children with a similar birth date in the lowest income quintile.
Figure 6.3: Percentage of children who were born in May or June 2008 in each income quintile who started school in 2012
Boys Girls
0%
10%
20%
30%
40%
50%
60%
70%
80%
90%
100%
97% 91% 88%
75%
65%
40%
27%
98% 95% 93%
84%
74%
53%
34%
Dec '07 Jan '08 Feb '08 Mar '08 Apr '08 May '08 Jun '08
% o
f 5-y
ear-
olds
0%
10%
20%
30%
40%
50%
60%
70%
60%
48%
52%
35%
43%
27%
43%
28%
37%
18%
Q1
(Low)
Q2 Q3 Q4 Q5
(High)
Q1
(Low)
Q2 Q3 Q4 Q5
(High)
May June
% o
f 5-y
ear-
olds
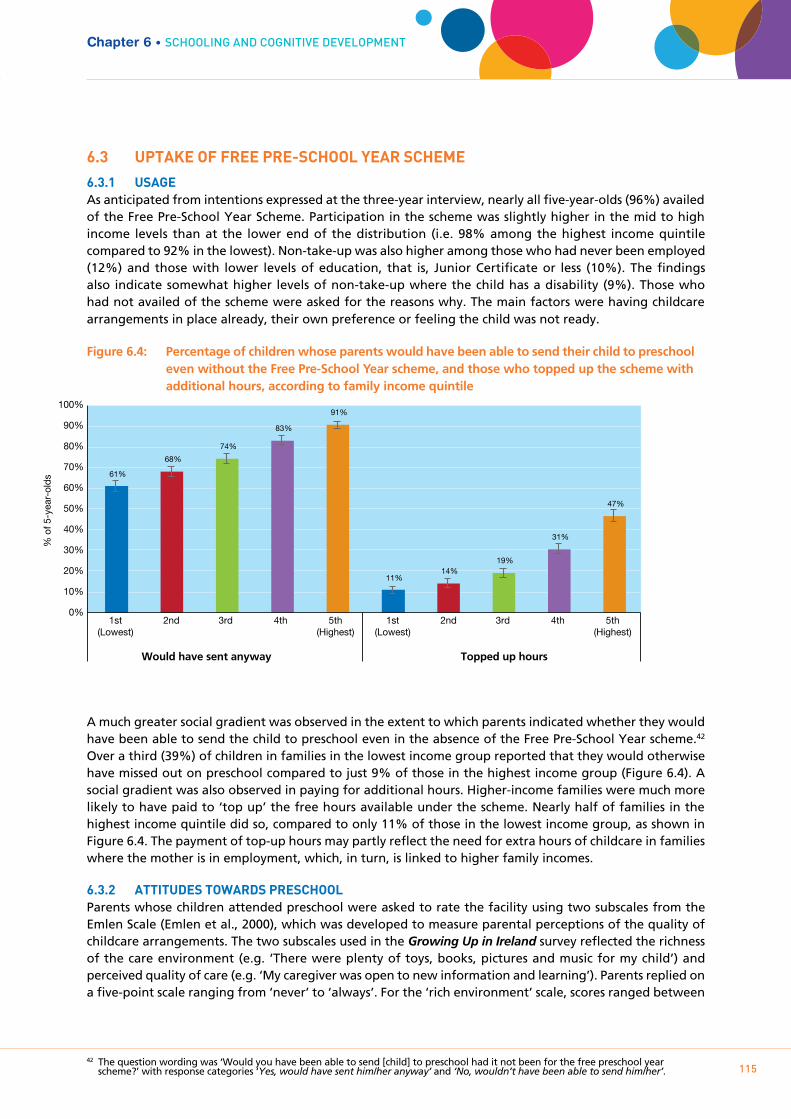
Growing Up in Ireland • THE LIVES OF 5-YEAR-OLDS
115
6.3 UpTAkE OF FREE pRE-SCHOOL YEAR SCHEmE
6.3.1 USAgEAs anticipated from intentions expressed at the three-year interview, nearly all five-year-olds (96%) availed of the Free Pre-School Year Scheme. Participation in the scheme was slightly higher in the mid to high income levels than at the lower end of the distribution (i.e. 98% among the highest income quintile compared to 92% in the lowest). Non-take-up was also higher among those who had never been employed (12%) and those with lower levels of education, that is, Junior Certificate or less (10%). The findings also indicate somewhat higher levels of non-take-up where the child has a disability (9%). Those who had not availed of the scheme were asked for the reasons why. The main factors were having childcare arrangements in place already, their own preference or feeling the child was not ready.
Figure 6.4: Percentage of children whose parents would have been able to send their child to preschool even without the Free Pre-School Year scheme, and those who topped up the scheme with additional hours, according to family income quintile
A much greater social gradient was observed in the extent to which parents indicated whether they would have been able to send the child to preschool even in the absence of the Free Pre-School Year scheme.42
Over a third (39%) of children in families in the lowest income group reported that they would otherwise have missed out on preschool compared to just 9% of those in the highest income group (Figure 6.4). A social gradient was also observed in paying for additional hours. Higher-income families were much more likely to have paid to ‘top up’ the free hours available under the scheme. Nearly half of families in the highest income quintile did so, compared to only 11% of those in the lowest income group, as shown in Figure 6.4. The payment of top-up hours may partly reflect the need for extra hours of childcare in families where the mother is in employment, which, in turn, is linked to higher family incomes.
6.3.2 ATTITUDES TOwARDS pRESCHOOLParents whose children attended preschool were asked to rate the facility using two subscales from the Emlen Scale (Emlen et al., 2000), which was developed to measure parental perceptions of the quality of childcare arrangements. The two subscales used in the Growing Up in Ireland survey reflected the richness of the care environment (e.g. ‘There were plenty of toys, books, pictures and music for my child’) and perceived quality of care (e.g. ‘My caregiver was open to new information and learning’). Parents replied on a five-point scale ranging from ‘never’ to ‘always’. For the ‘rich environment’ scale, scores ranged between
42 The question wording was ‘Would you have been able to send [child] to preschool had it not been for the free preschool year scheme?’ with response categories ‘Yes, would have sent him/her anyway’ and ‘No, wouldn’t have been able to send him/her’.
Chapter 6 • ScHOOLIng AnD cOgnITIVE DEVELOPmEnT
0%
10%
20%
30%
40%
50%
60%
70%
80%
90%
100%
1st (Lowest)
5th (Highest)
2nd 3rd 4th 1st (Lowest)
5th (Highest)
2nd 3rd 4th
% o
f 5-y
ear-
olds
Would have sent anyway Topped up hours
61%
68%
74%
83%
91%
11% 14%
19%
31%
47%
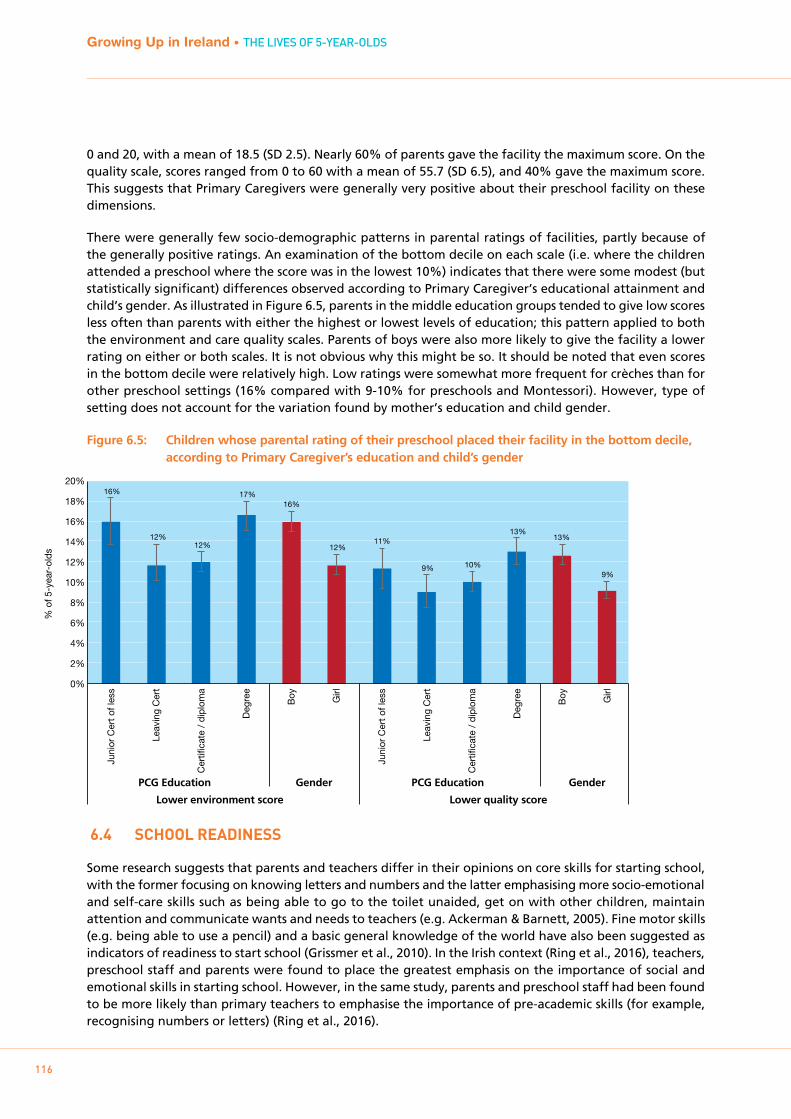
Growing Up in Ireland • THE LIVES OF 5-YEAR-OLDS
116
0 and 20, with a mean of 18.5 (SD 2.5). Nearly 60% of parents gave the facility the maximum score. On the quality scale, scores ranged from 0 to 60 with a mean of 55.7 (SD 6.5), and 40% gave the maximum score. This suggests that Primary Caregivers were generally very positive about their preschool facility on these dimensions.
There were generally few socio-demographic patterns in parental ratings of facilities, partly because of the generally positive ratings. An examination of the bottom decile on each scale (i.e. where the children attended a preschool where the score was in the lowest 10%) indicates that there were some modest (but statistically significant) differences observed according to Primary Caregiver’s educational attainment and child’s gender. As illustrated in Figure 6.5, parents in the middle education groups tended to give low scores less often than parents with either the highest or lowest levels of education; this pattern applied to both the environment and care quality scales. Parents of boys were also more likely to give the facility a lower rating on either or both scales. It is not obvious why this might be so. It should be noted that even scores in the bottom decile were relatively high. Low ratings were somewhat more frequent for crèches than for other preschool settings (16% compared with 9-10% for preschools and Montessori). However, type of setting does not account for the variation found by mother’s education and child gender.
Figure 6.5: Children whose parental rating of their preschool placed their facility in the bottom decile, according to Primary Caregiver’s education and child’s gender
6.4 SCHOOL READINESS
Some research suggests that parents and teachers differ in their opinions on core skills for starting school, with the former focusing on knowing letters and numbers and the latter emphasising more socio-emotional and self-care skills such as being able to go to the toilet unaided, get on with other children, maintain attention and communicate wants and needs to teachers (e.g. Ackerman & Barnett, 2005). Fine motor skills (e.g. being able to use a pencil) and a basic general knowledge of the world have also been suggested as indicators of readiness to start school (Grissmer et al., 2010). In the Irish context (Ring et al., 2016), teachers, preschool staff and parents were found to place the greatest emphasis on the importance of social and emotional skills in starting school. However, in the same study, parents and preschool staff had been found to be more likely than primary teachers to emphasise the importance of pre-academic skills (for example, recognising numbers or letters) (Ring et al., 2016).
% o
f 5-y
ear-
olds
0%
2%
4%
6%
8%
10%
12%
14%
16%
18%
20% 16%
12% 12%
17% 16%
12% 11%
9% 10%
13% 13%
9%
Juni
or C
ert o
f les
s
Leav
ing
Cer
t
Cer
tific
ate
/ di
plom
a
Deg
ree
Boy
Girl
Juni
or C
ert o
f les
s
Leav
ing
Cer
t
Cer
tific
ate
/ di
plom
a
Deg
ree
Boy
Girl
PCG Education Gender PCG Education Gender
Lower environment score Lower quality score
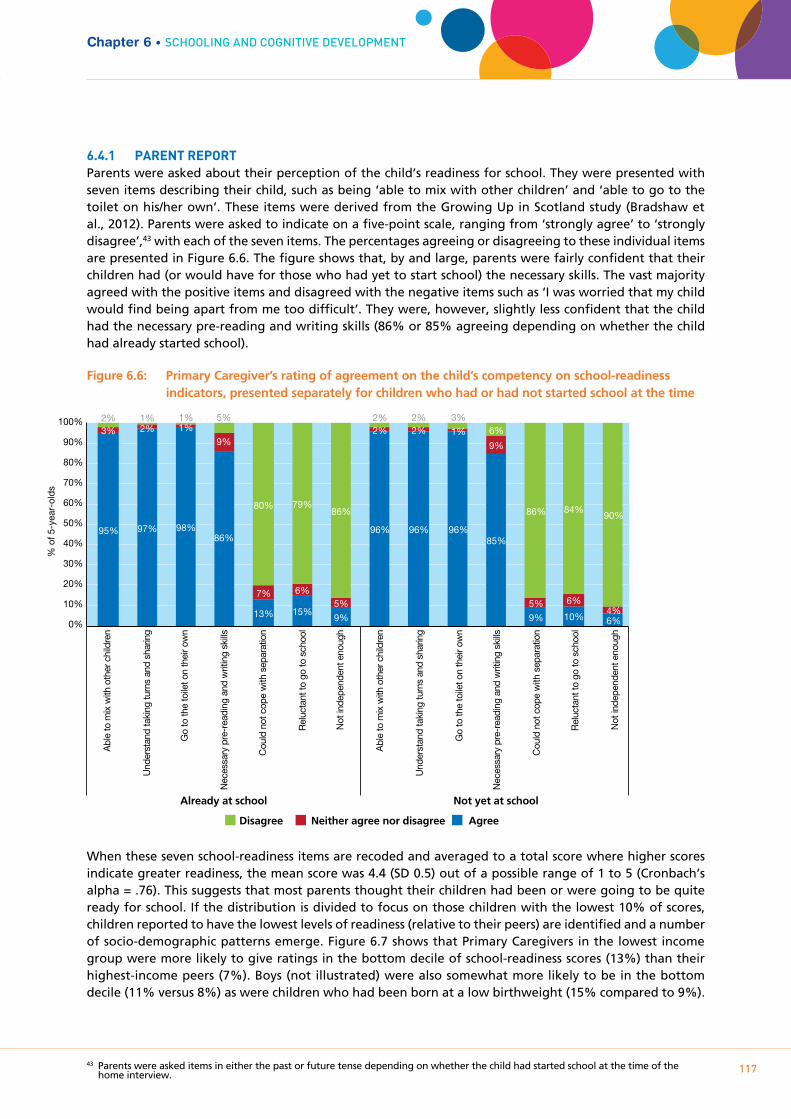
Growing Up in Ireland • THE LIVES OF 5-YEAR-OLDS
117
6.4.1 pARENT REpORTParents were asked about their perception of the child’s readiness for school. They were presented with seven items describing their child, such as being ‘able to mix with other children’ and ‘able to go to the toilet on his/her own’. These items were derived from the Growing Up in Scotland study (Bradshaw et al., 2012). Parents were asked to indicate on a five-point scale, ranging from ‘strongly agree’ to ‘strongly disagree’,43 with each of the seven items. The percentages agreeing or disagreeing to these individual items are presented in Figure 6.6. The figure shows that, by and large, parents were fairly confident that their children had (or would have for those who had yet to start school) the necessary skills. The vast majority agreed with the positive items and disagreed with the negative items such as ‘I was worried that my child would find being apart from me too difficult’. They were, however, slightly less confident that the child had the necessary pre-reading and writing skills (86% or 85% agreeing depending on whether the child had already started school).
Figure 6.6: Primary Caregiver’s rating of agreement on the child’s competency on school-readiness indicators, presented separately for children who had or had not started school at the time
When these seven school-readiness items are recoded and averaged to a total score where higher scores indicate greater readiness, the mean score was 4.4 (SD 0.5) out of a possible range of 1 to 5 (Cronbach’s alpha = .76). This suggests that most parents thought their children had been or were going to be quite ready for school. If the distribution is divided to focus on those children with the lowest 10% of scores, children reported to have the lowest levels of readiness (relative to their peers) are identified and a number of socio-demographic patterns emerge. Figure 6.7 shows that Primary Caregivers in the lowest income group were more likely to give ratings in the bottom decile of school-readiness scores (13%) than their highest-income peers (7%). Boys (not illustrated) were also somewhat more likely to be in the bottom decile (11% versus 8%) as were children who had been born at a low birthweight (15% compared to 9%).
43 Parents were asked items in either the past or future tense depending on whether the child had started school at the time of the home interview.
Chapter 6 • ScHOOLIng AnD cOgnITIVE DEVELOPmEnT
Disagree Neither agree nor disagree Agree
0%
10%
20%
30%
40%
50%
60%
70%
80%
90%
100%
95% 97% 98% 86%
13% 15% 9%
96% 96% 96% 85%
9% 10% 6%
3% 2% 1%
9%
7% 6% 5%
2% 2% 1%
9%
5% 6% 4%
2% 1% 1%
5%
80% 79% 86%
2% 2% 3% 6%
86% 84% 90%
Already at school Not yet at school
Abl
e to
mix
with
oth
er c
hild
ren
Und
erst
and
taki
ng tu
rns
and
shar
ing
Go
to th
e to
ilet o
n th
eir o
wn
Nec
essa
ry p
re-r
eadi
ng a
nd w
ritin
g sk
ills
Cou
ld n
ot c
ope
with
sep
arat
ion
Rel
ucta
nt to
go
to s
choo
l
Not
inde
pend
ent e
noug
h
Abl
e to
mix
with
oth
er c
hild
ren
Und
erst
and
taki
ng tu
rns
and
shar
ing
Go
to th
e to
ilet o
n th
eir o
wn
Nec
essa
ry p
re-r
eadi
ng a
nd w
ritin
g sk
ills
Cou
ld n
ot c
ope
with
sep
arat
ion
Rel
ucta
nt to
go
to s
choo
l
Not
inde
pend
ent e
noug
h
% o
f 5-y
ear-
olds

Growing Up in Ireland • THE LIVES OF 5-YEAR-OLDS
118
Figure 6.7: Percentage of Primary Caregivers giving their children the lowest school-readiness scores, according to family income quintile
Modest but significant differences in school-readiness scores were also observed for five-year-olds according to whether or not they had performed below average44 on the Ages and Stages (ASQ) developmental indicators at nine months old. In particular, children who had earlier been below expected thresholds for the ‘communication’ or ‘gross motor’ scales appeared at somewhat greater risk of being in the lowest decile of school-readiness scores at age five years – as shown in Figure 6.8.
Figure 6.8: Percentage of children in the lowest decile of parent-reported school-readiness scores by performance status on two indicators of development at 9 months
Among parents of children who had yet to start school by the time of the home interview in spring/summer 2013, the most common reason for delaying until September 2013 was ‘I thought child was too young’ (79% said this reason was very important), followed by ‘I didn’t think child was ready to start school’ (65% very important). There was a marked gender difference among parents on this latter reason for delaying school start; 71% of parents of relevant boys rated this as very important compared to just 57% of girls’ parents. This, of course, is consistent with the lower percentage of boys starting school in 2012, as noted in discussion of Figure 6.2 above.
44 Specifically, whether they were below the cut-off threshold score for that test.
1st (Lowest)
5th (Highest)
2nd 3rd 4th
% o
f PC
Gs
Income quintile
13%
10% 10%
8%
7%
0%
2%
4%
6%
8%
10%
12%
14%
16%
18%
Scored below threshold
Scored at or above threshold
Scored below threshold
Scored at or above threshold
% o
f 5-y
ear-
olds
0%
2%
4%
6%
8%
10%
12%
14%
16%
18% 14%
9%
13%
9%
ASQ communication ASQ gross motor

Growing Up in Ireland • THE LIVES OF 5-YEAR-OLDS
119
6.4.2 TEACHER REpORT
When fieldwork for the school phase commenced in autumn/winter 2013, the child’s current teacher was asked to complete a postal questionnaire about each Study Child; this was completed for over 92% of children. The majority of the children were in Senior Infants45 (69%) and the remaining 31% in Junior Infants. Teachers of both classes completed a number of subscales reflecting the child’s developmental and behavioural status; these subscales were hierarchically structured, with nine items reflecting increasingly advanced milestones. The first three items in each subscale are considered the core ‘stepping stones’ that form the basis for achieving later milestones (Hansen & Jones, 2008). Children who achieve the next five items are reaching appropriate learning goals for their age-group; those who achieve the final item are achieving more than is expected at this stage (Hansen & Jones, 2008). The items used are a subset of those used in the Millennium Cohort Study and are based on the Foundation Stage Profile in England46 (Hansen & Jones, 2008). In this section we examine two of those subscales: disposition/attitudes and language for communication and thinking.47
Table 6.1 provides the percentages of children who had achieved the three earliest milestones in each of these two subscales. Even though a priori expectations might have been that children in Senior Infants (i.e. second year of school) would have scored better on these items, this was not the case. There were only very small differences between Junior and Senior Infant class groups in this respect.
Table 6.1: Percentage of 5-year-olds achieving the first 3 milestones in a teacher-reported measure of ‘disposition/attitudes’ and ‘language for communication and thinking’, according to year in school
Milestone ItemJunior Infants
%Senior Infants
%
Disposition/ Attitudes
Shows an interest in classroom activities through observations or participation
96 95
Dresses, undresses, and manages own personal hygiene with adult support
80 82
Displays high levels of involvement in self-chosen activities
94 92
Per cent achieving all three milestones 72 71
Language for communication and thinking
Listens and responds 93 93
Initiates communication with others, displaying greater confidence in more informal contexts
89 90
Talks activities through, reflecting on and modifying actions
77 74
Per cent achieving all three milestones 73 70
In the remainder of the analysis in this section, scores for Junior and Senior Infants were combined, although class level and child age were controlled for in the regression models later.
There were few, if any, significant differences in relation to achieving all three stepping stones on the ‘disposition/attitudes’ scale, although previously performing poorly in the ASQ communication measure (in particular) at nine months was associated with a lower likelihood (63% compared to 72%). On the ‘language for communicating and thinking’ scale, there were clearer socio-demographic trends. Male gender, lower income, lower parental education, lower social class, urban area and low birthweight were all associated with a reduced likelihood of attaining all three milestones on this language subscale. The
45 Senior Infants is Year 2 of primary schooling. Year 1 is known as Junior Infants.46 In England, the Foundation Stage Profile is completed by teachers as part of formal assessment in the school system. In the Millennium
Cohort Survey, comparable information for children in Scotland, Wales and Northern Ireland was collected through a questionnaire sent to teachers. The wording and format of the questionnaire items was replicated in Growing Up in Ireland.
47 Information on the three other subscales is available in Section 4.5 below and in Smyth (2018).
Chapter 6 • ScHOOLIng AnD cOgnITIVE DEVELOPmEnT
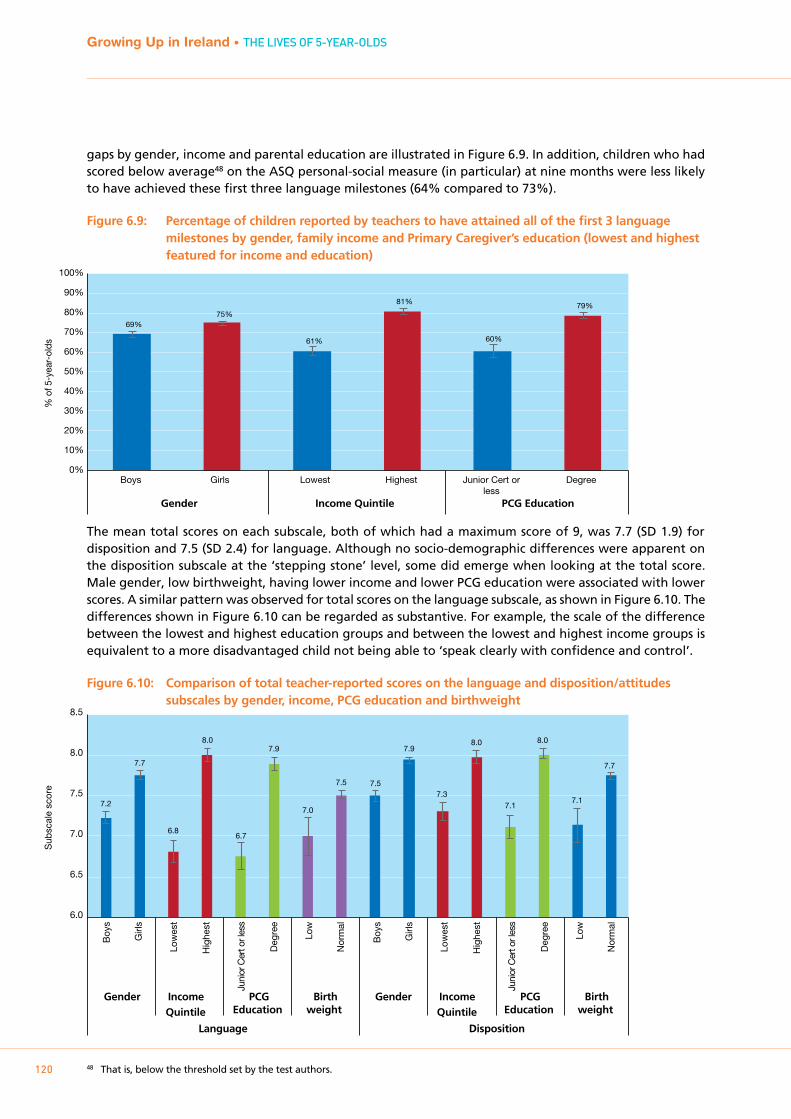
Growing Up in Ireland • THE LIVES OF 5-YEAR-OLDS
120
gaps by gender, income and parental education are illustrated in Figure 6.9. In addition, children who had scored below average48 on the ASQ personal-social measure (in particular) at nine months were less likely to have achieved these first three language milestones (64% compared to 73%).
Figure 6.9: Percentage of children reported by teachers to have attained all of the first 3 language milestones by gender, family income and Primary Caregiver’s education (lowest and highest featured for income and education)
The mean total scores on each subscale, both of which had a maximum score of 9, was 7.7 (SD 1.9) for disposition and 7.5 (SD 2.4) for language. Although no socio-demographic differences were apparent on the disposition subscale at the ‘stepping stone’ level, some did emerge when looking at the total score. Male gender, low birthweight, having lower income and lower PCG education were associated with lower scores. A similar pattern was observed for total scores on the language subscale, as shown in Figure 6.10. The differences shown in Figure 6.10 can be regarded as substantive. For example, the scale of the difference between the lowest and highest education groups and between the lowest and highest income groups is equivalent to a more disadvantaged child not being able to ‘speak clearly with confidence and control’.
Figure 6.10: Comparison of total teacher-reported scores on the language and disposition/attitudes subscales by gender, income, PCG education and birthweight
48 That is, below the threshold set by the test authors.
0%
10%
20%
30%
40%
50%
60%
70%
80%
90%
100%
% o
f 5-y
ear-
olds
Boys Girls Lowest Highest Junior Cert orless
Degree
69% 75%
61%
81%
60%
79%
Gender Income Quintile PCG Education
Sub
scal
e sc
ore
6.0
6.5
7.0
7.5
8.0
8.5
Boy
s
Girl
s
Low
est
Hig
hest
Juni
or C
ert o
r les
s
Deg
ree
Low
Nor
mal
Boy
s
Girl
s
Low
est
Hig
hest
Juni
or C
ert o
r les
s
Deg
ree
Low
Nor
mal
Gender Income Quintile
PCGEducation
Birthweight
Gender Income Quintile
PCGEducation
Birthweight
Disposition Language
7.2
7.7
6.8
8.0
6.7
7.9
7.0
7.5 7.5
7.9
7.3
8.0
7.1
8.0
7.1
7.7
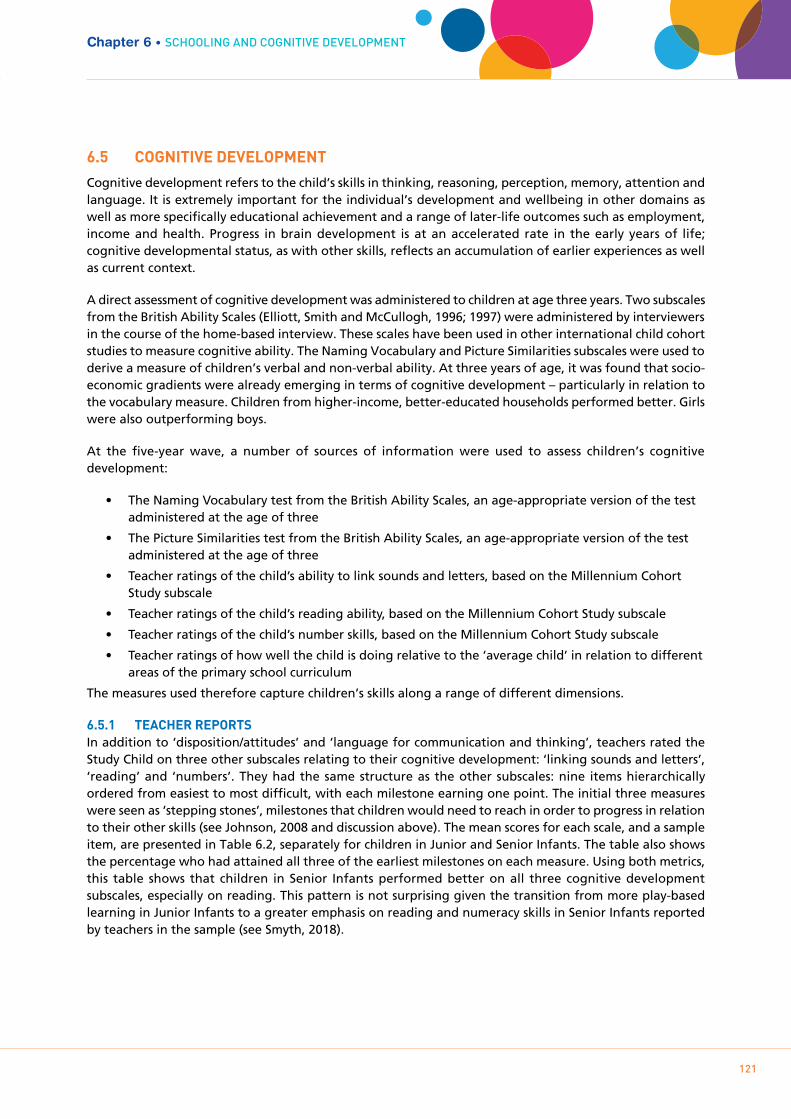
Growing Up in Ireland • THE LIVES OF 5-YEAR-OLDS
121
6.5 COgNITIVE DEVELOpmENT
Cognitive development refers to the child’s skills in thinking, reasoning, perception, memory, attention and language. It is extremely important for the individual’s development and wellbeing in other domains as well as more specifically educational achievement and a range of later-life outcomes such as employment, income and health. Progress in brain development is at an accelerated rate in the early years of life; cognitive developmental status, as with other skills, reflects an accumulation of earlier experiences as well as current context.
A direct assessment of cognitive development was administered to children at age three years. Two subscales from the British Ability Scales (Elliott, Smith and McCullogh, 1996; 1997) were administered by interviewers in the course of the home-based interview. These scales have been used in other international child cohort studies to measure cognitive ability. The Naming Vocabulary and Picture Similarities subscales were used to derive a measure of children’s verbal and non-verbal ability. At three years of age, it was found that socio-economic gradients were already emerging in terms of cognitive development – particularly in relation to the vocabulary measure. Children from higher-income, better-educated households performed better. Girls were also outperforming boys.
At the five-year wave, a number of sources of information were used to assess children’s cognitive development:
• TheNamingVocabularytestfromtheBritishAbilityScales,anage-appropriateversionofthetestadministered at the age of three
• ThePictureSimilaritiestestfromtheBritishAbilityScales,anage-appropriateversionofthetestadministered at the age of three
• Teacherratingsofthechild’sabilitytolinksoundsandletters,basedontheMillenniumCohortStudy subscale
• Teacherratingsofthechild’sreadingability,basedontheMillenniumCohortStudysubscale
• Teacherratingsofthechild’snumberskills,basedontheMillenniumCohortStudysubscale
• Teacherratingsofhowwellthechildisdoingrelativetothe‘averagechild’inrelationtodifferentareas of the primary school curriculum
The measures used therefore capture children’s skills along a range of different dimensions.
6.5.1 TEACHER REpORTSIn addition to ‘disposition/attitudes’ and ‘language for communication and thinking’, teachers rated the Study Child on three other subscales relating to their cognitive development: ‘linking sounds and letters’, ‘reading’ and ‘numbers’. They had the same structure as the other subscales: nine items hierarchically ordered from easiest to most difficult, with each milestone earning one point. The initial three measures were seen as ‘stepping stones’, milestones that children would need to reach in order to progress in relation to their other skills (see Johnson, 2008 and discussion above). The mean scores for each scale, and a sample item, are presented in Table 6.2, separately for children in Junior and Senior Infants. The table also shows the percentage who had attained all three of the earliest milestones on each measure. Using both metrics, this table shows that children in Senior Infants performed better on all three cognitive development subscales, especially on reading. This pattern is not surprising given the transition from more play-based learning in Junior Infants to a greater emphasis on reading and numeracy skills in Senior Infants reported by teachers in the sample (see Smyth, 2018).
Chapter 6 • ScHOOLIng AnD cOgnITIVE DEVELOPmEnT
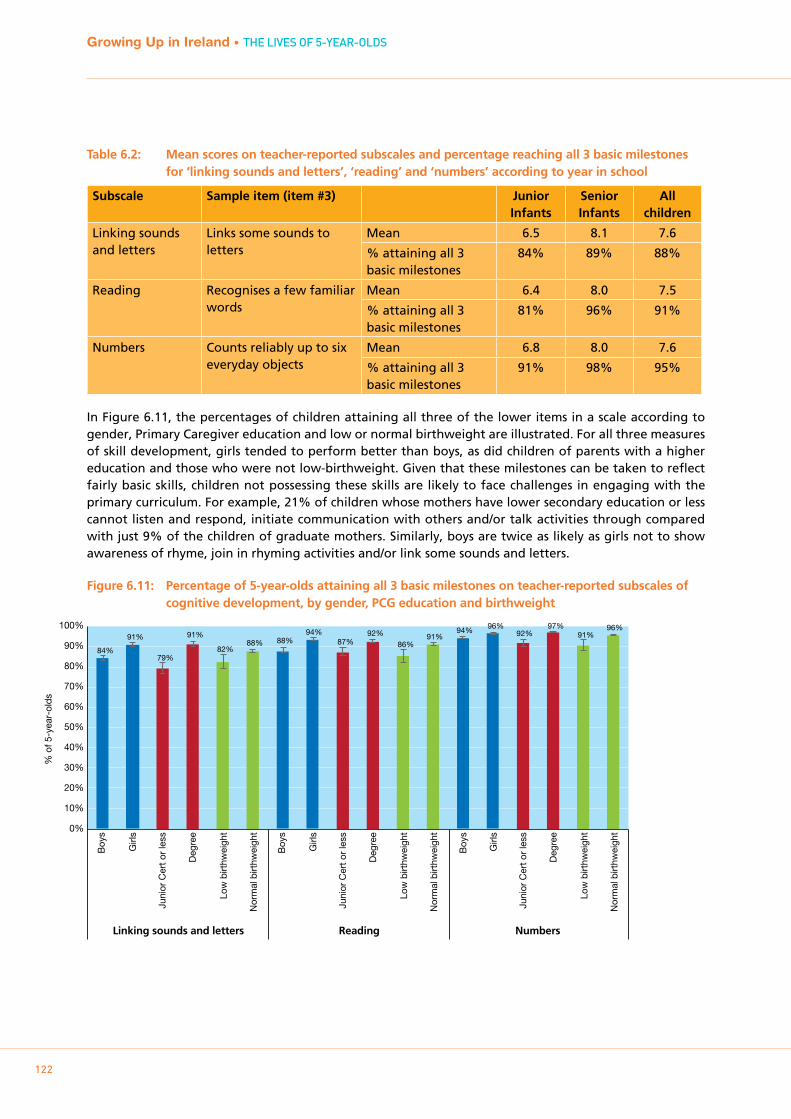
Growing Up in Ireland • THE LIVES OF 5-YEAR-OLDS
122
Table 6.2: Mean scores on teacher-reported subscales and percentage reaching all 3 basic milestones for ‘linking sounds and letters’, ‘reading’ and ‘numbers’ according to year in school
Subscale Sample item (item #3) Junior Infants
Senior Infants
All children
Linking sounds and letters
Links some sounds to letters
Mean 6.5 8.1 7.6
% attaining all 3 basic milestones
84% 89% 88%
Reading Recognises a few familiar words
Mean 6.4 8.0 7.5
% attaining all 3 basic milestones
81% 96% 91%
Numbers Counts reliably up to six everyday objects
Mean 6.8 8.0 7.6
% attaining all 3 basic milestones
91% 98% 95%
In Figure 6.11, the percentages of children attaining all three of the lower items in a scale according to gender, Primary Caregiver education and low or normal birthweight are illustrated. For all three measures of skill development, girls tended to perform better than boys, as did children of parents with a higher education and those who were not low-birthweight. Given that these milestones can be taken to reflect fairly basic skills, children not possessing these skills are likely to face challenges in engaging with the primary curriculum. For example, 21% of children whose mothers have lower secondary education or less cannot listen and respond, initiate communication with others and/or talk activities through compared with just 9% of the children of graduate mothers. Similarly, boys are twice as likely as girls not to show awareness of rhyme, join in rhyming activities and/or link some sounds and letters.
Figure 6.11: Percentage of 5-year-olds attaining all 3 basic milestones on teacher-reported subscales of cognitive development, by gender, PCG education and birthweight
0%
10%
20%
30%
40%
50%
60%
70%
80%
90%
100%
% o
f 5-y
ear-
olds
84%
91%
79%
91%
82% 88% 88%
94% 87%
92%
86% 91%
94% 96% 92%
97% 91%
96%
Boy
s
Girl
s
Juni
or C
ert o
r le
ss
Deg
ree
Low
birt
hwei
ght
Nor
mal
birt
hwei
ght
Boy
s
Girl
s
Juni
or C
ert o
r le
ss
Deg
ree
Low
birt
hwei
ght
Nor
mal
birt
hwei
ght
Boy
s
Girl
s
Juni
or C
ert o
r le
ss
Deg
ree
Low
birt
hwei
ght
Nor
mal
birt
hwei
ght
Linking sounds and letters Reading Numbers
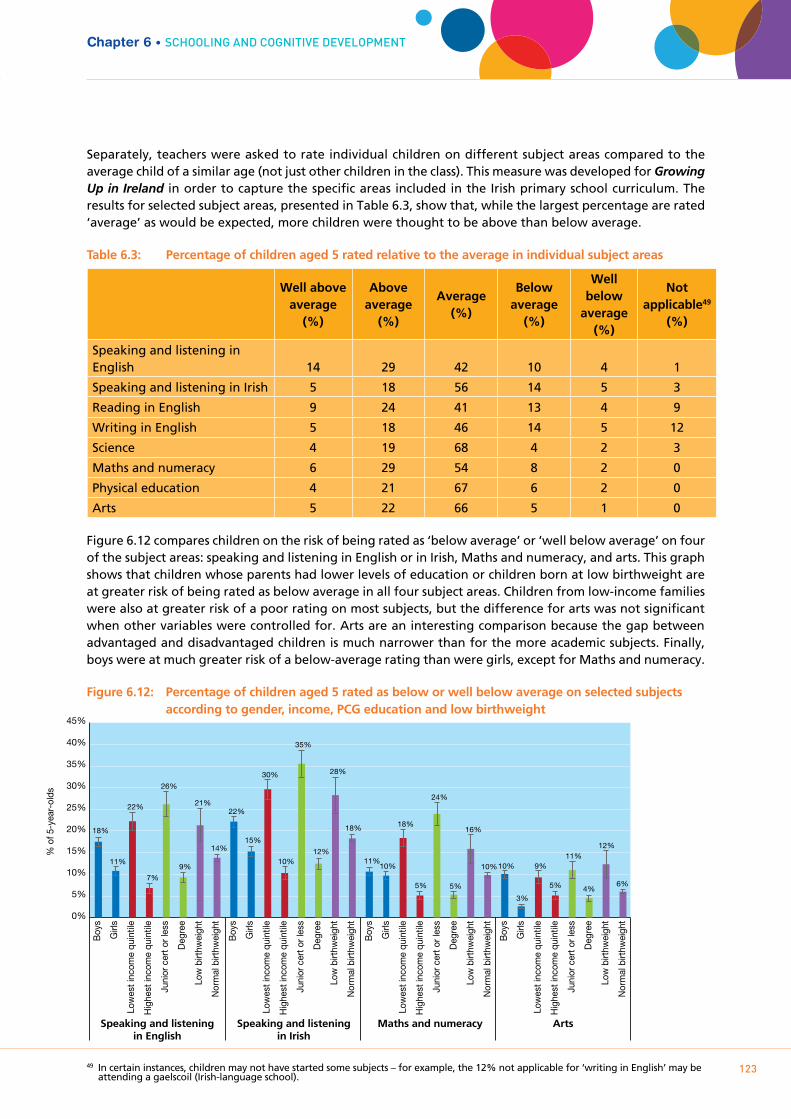
Growing Up in Ireland • THE LIVES OF 5-YEAR-OLDS
123
Separately, teachers were asked to rate individual children on different subject areas compared to the average child of a similar age (not just other children in the class). This measure was developed for Growing Up in Ireland in order to capture the specific areas included in the Irish primary school curriculum. The results for selected subject areas, presented in Table 6.3, show that, while the largest percentage are rated ‘average’ as would be expected, more children were thought to be above than below average.
Table 6.3: Percentage of children aged 5 rated relative to the average in individual subject areas49
Well above average
(%)
Above average
(%)
Average(%)
Below average
(%)
Well below
average(%)
Not applicable49
(%)
Speaking and listening in English 14 29 42 10 4 1
Speaking and listening in Irish 5 18 56 14 5 3
Reading in English 9 24 41 13 4 9
Writing in English 5 18 46 14 5 12
Science 4 19 68 4 2 3
Maths and numeracy 6 29 54 8 2 0
Physical education 4 21 67 6 2 0
Arts 5 22 66 5 1 0
Figure 6.12 compares children on the risk of being rated as ‘below average’ or ‘well below average’ on four of the subject areas: speaking and listening in English or in Irish, Maths and numeracy, and arts. This graph shows that children whose parents had lower levels of education or children born at low birthweight are at greater risk of being rated as below average in all four subject areas. Children from low-income families were also at greater risk of a poor rating on most subjects, but the difference for arts was not significant when other variables were controlled for. Arts are an interesting comparison because the gap between advantaged and disadvantaged children is much narrower than for the more academic subjects. Finally, boys were at much greater risk of a below-average rating than were girls, except for Maths and numeracy.
Figure 6.12: Percentage of children aged 5 rated as below or well below average on selected subjects according to gender, income, PCG education and low birthweight
49 In certain instances, children may not have started some subjects – for example, the 12% not applicable for ‘writing in English’ may be attending a gaelscoil (Irish-language school).
Chapter 6 • ScHOOLIng AnD cOgnITIVE DEVELOPmEnT%
of 5
-yea
r-ol
ds
0%
5%
10%
15%
20%
25%
30%
35%
40%
45%
18%
11%
22%
7%
26%
9%
21%
14%
22%
15%
30%
10%
35%
12%
28%
18%
11% 10%
18%
5%
24%
5%
16%
10% 10%
3%
9%
5%
11%
4%
12%
6%
Boy
s
Girl
s
Low
est i
ncom
e qu
intil
e
Hig
hest
inco
me
quin
tile
Juni
or c
ert o
r les
s
Deg
ree
Low
birt
hwei
ght
Nor
mal
birt
hwei
ght
Boy
s
Girl
s
Low
est i
ncom
e qu
intil
e
Hig
hest
inco
me
quin
tile
Juni
or c
ert o
r les
s
Deg
ree
Low
birt
hwei
ght
Nor
mal
birt
hwei
ght
Boy
s
Girl
s
Low
est i
ncom
e qu
intil
e
Hig
hest
inco
me
quin
tile
Juni
or c
ert o
r les
s
Deg
ree
Low
birt
hwei
ght
Nor
mal
birt
hwei
ght
Boy
s
Girl
s
Low
est i
ncom
e qu
intil
e
Hig
hest
inco
me
quin
tile
Juni
or c
ert o
r les
s
Deg
ree
Low
birt
hwei
ght
Nor
mal
birt
hwei
ght
Speaking and listeningin English
Speaking and listeningin Irish
Maths and numeracy Arts
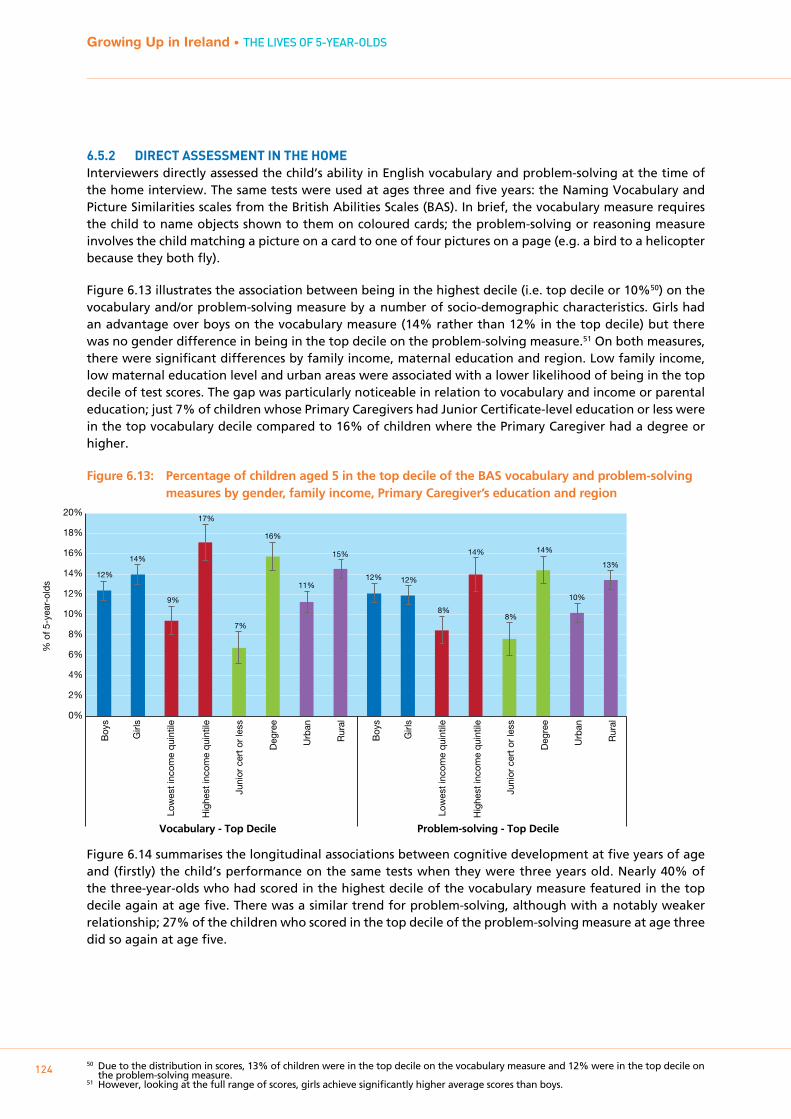
Growing Up in Ireland • THE LIVES OF 5-YEAR-OLDS
124
6.5.2 DIRECT ASSESSmENT IN THE HOmEInterviewers directly assessed the child’s ability in English vocabulary and problem-solving at the time of the home interview. The same tests were used at ages three and five years: the Naming Vocabulary and Picture Similarities scales from the British Abilities Scales (BAS). In brief, the vocabulary measure requires the child to name objects shown to them on coloured cards; the problem-solving or reasoning measure involves the child matching a picture on a card to one of four pictures on a page (e.g. a bird to a helicopter because they both fly).
Figure 6.13 illustrates the association between being in the highest decile (i.e. top decile or 10%50) on the vocabulary and/or problem-solving measure by a number of socio-demographic characteristics. Girls had an advantage over boys on the vocabulary measure (14% rather than 12% in the top decile) but there was no gender difference in being in the top decile on the problem-solving measure.51 On both measures, there were significant differences by family income, maternal education and region. Low family income, low maternal education level and urban areas were associated with a lower likelihood of being in the top decile of test scores. The gap was particularly noticeable in relation to vocabulary and income or parental education; just 7% of children whose Primary Caregivers had Junior Certificate-level education or less were in the top vocabulary decile compared to 16% of children where the Primary Caregiver had a degree or higher.
Figure 6.13: Percentage of children aged 5 in the top decile of the BAS vocabulary and problem-solving measures by gender, family income, Primary Caregiver’s education and region
Figure 6.14 summarises the longitudinal associations between cognitive development at five years of age and (firstly) the child’s performance on the same tests when they were three years old. Nearly 40% of the three-year-olds who had scored in the highest decile of the vocabulary measure featured in the top decile again at age five. There was a similar trend for problem-solving, although with a notably weaker relationship; 27% of the children who scored in the top decile of the problem-solving measure at age three did so again at age five.
50 Due to the distribution in scores, 13% of children were in the top decile on the vocabulary measure and 12% were in the top decile on the problem-solving measure.
51 However, looking at the full range of scores, girls achieve significantly higher average scores than boys.
% o
f 5-y
ear-
olds
0%
2%
4%
6%
8%
10%
12%
14%
16%
18%
20%
12%
14%
9%
17%
7%
16%
11%
15%
12% 12%
8%
14%
8%
14%
10%
13%
Boy
s
Low
est i
ncom
e qu
intil
e
Hig
hest
inco
me
quin
tile
Juni
or c
ert o
r le
ss
Girl
s
Deg
ree
Urb
an
Rur
al
Boy
s
Low
est i
ncom
e qu
intil
e
Hig
hest
inco
me
quin
tile
Juni
or c
ert o
r le
ss
Girl
s
Deg
ree
Urb
an
Rur
al
Vocabulary - Top Decile Problem-solving - Top Decile
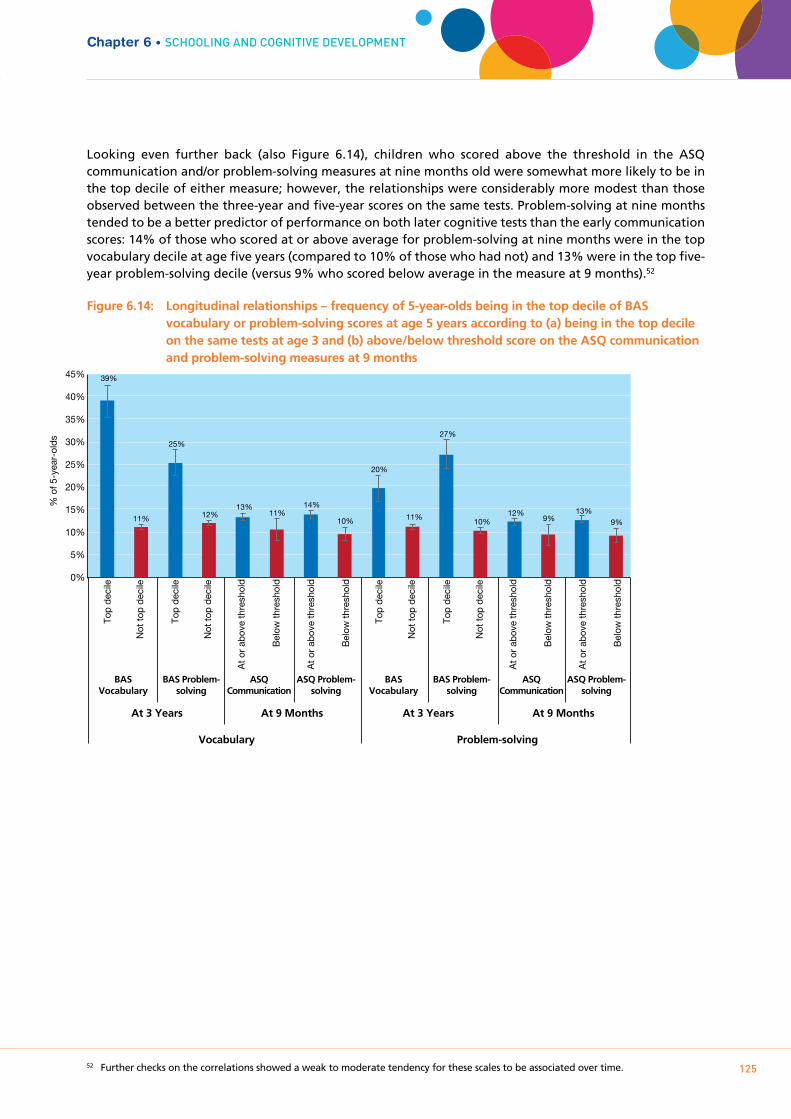
Growing Up in Ireland • THE LIVES OF 5-YEAR-OLDS
125
Looking even further back (also Figure 6.14), children who scored above the threshold in the ASQ communication and/or problem-solving measures at nine months old were somewhat more likely to be in the top decile of either measure; however, the relationships were considerably more modest than those observed between the three-year and five-year scores on the same tests. Problem-solving at nine months tended to be a better predictor of performance on both later cognitive tests than the early communication scores: 14% of those who scored at or above average for problem-solving at nine months were in the top vocabulary decile at age five years (compared to 10% of those who had not) and 13% were in the top five-year problem-solving decile (versus 9% who scored below average in the measure at 9 months).52
Figure 6.14: Longitudinal relationships – frequency of 5-year-olds being in the top decile of BAS vocabulary or problem-solving scores at age 5 years according to (a) being in the top decile on the same tests at age 3 and (b) above/below threshold score on the ASQ communication and problem-solving measures at 9 months
52 Further checks on the correlations showed a weak to moderate tendency for these scales to be associated over time.
Chapter 6 • ScHOOLIng AnD cOgnITIVE DEVELOPmEnT
Top
deci
le
Not
top
deci
le
Top
deci
le
At o
r ab
ove
thre
shol
d
Bel
ow th
resh
old
At o
r ab
ove
thre
shol
d
Bel
ow th
resh
old
Not
top
deci
le
Top
deci
le
Not
top
deci
le
Top
deci
le
At o
r ab
ove
thre
shol
d
Bel
ow th
resh
old
At o
r ab
ove
thre
shol
d
Bel
ow th
resh
old
Not
top
deci
le 0%
5%
10%
15%
20%
25%
30%
35%
40%
45% 39%
11%
25%
12% 13%
11% 14%
10%
20%
11%
27%
10% 12%
9% 13%
9%
BASVocabulary
BAS Problem-solving
ASQCommunication
ASQ Problem-solving
BASVocabulary
BAS Problem-solving
ASQCommunication
ASQ Problem-solving
At 3 Years At 9 Months At 3 Years At 9 Months
Vocabulary Problem-solving
% o
f 5-y
ear-
olds
Growing Up in Ireland • THE LIVES OF 5-YEAR-OLDS
126
6.6 SUmmARY
Over two-thirds of the children in Cohort ’08 had started school in September 2012, a few months before the age-five interview. Children born later in 2008 (and thus younger in September 2012) were more likely to wait until September 2013. There is evidence to indicate that boys and children from better-off families are generally somewhat older when they start school.
Nearly the entire cohort availed of the Free Pre-School Year (96%), although most of the higher-income parents said they would have sent the child to a preschool anyway (91%). Substantial proportions of less well-off parents said they would not have availed of preschool for their five-year-old had it not been for the scheme (39% of those in the lowest quintile). Hence, the scheme seems to have succeeded in making early childhood education more accessible to the less well-off, notwithstanding the fact that parents who could have afforded their own preschool arrangements availed of it too. Parents were generally happy with the quality of the centres attended by their children under the scheme.
The study collected a range of data on measures of children’s skills and competencies, both through direct assessment and from teacher reports. Boys had lower vocabulary test scores and received lower ratings from their teachers in relation to all skills except numeracy skills and across all subject areas except Maths. A clear socio-economic gradient in terms of both maternal education and household income is evident among five-year-olds. Children from lower-income households and who have mothers with lower levels of education have poorer vocabulary and problem-solving test scores, and are rated more negatively by their teachers in relation to dispositions to school, language, reading and numeracy skills. They are also more likely to be rated as below average across the different subject areas of the primary curriculum. Over a third (39%) of children from the lowest income quintile have not reached the three language milestones which form building blocks for their language development compared, with just 19% of those in the highest income quintile. Children without these basic communication skills are likely to encounter challenges in engaging with the primary curriculum.
In general, children who were doing well at nine months and three years had a better chance of doing well by five years of age. Early-life problem-solving skills were related to later cognitive performance, in terms of both communication and problem-solving, but were not necessarily determinants of future performance. Over one-quarter (27%) of children who had scored in the top decile on the problem-solving subscale of the British Abilities Scales at age three scored in the top decile on this scale at age five. Likewise, some children who scored poorly on measures of development as early as nine months were performing significantly worse on measures of cognitive development and school readiness more than four years later. The obverse of this is also true, with many children improving between waves. The findings suggest that monitoring of early difficulties is particularly important, with a view to putting in place appropriate interventions and supports for children. Further analysis of the Growing Up in Ireland data could inform such interventions by identifying factors associated with an improvement over time in cognitive outcomes.
Growing Up in Ireland • THE LIVES OF 5-YEAR-OLDS
127
Chapter 7SummARY AnD DIScuSSIOn
Growing Up in Ireland • THE LIVES OF 5-YEAR-OLDS
128
7.1 INTRODUCTION
This report is based on data from the third wave of interviews with Growing Up in Ireland’s Cohort ’08, when the children were five years of age. Its focus is entirely descriptive. The report sketched a picture of some of the more important aspects of the lives and circumstances of five-year-olds in Ireland today and, most importantly, considered how things have changed for them since their earlier interviews at nine months and three years of age.
The conceptual background to the report was the bioecological framework that underlies the study. This was outlined in Chapter One, along with details on the background and content of Growing Up in Ireland. Chapter 2 set the stage for the discussion of child outcomes by describing the context in which they lived: the nature, composition and changes in family structure and financial circumstances over the child’s early life. Chapters 3, 4, 5 and 6 considered aspects of the four key outcome domains in the lives of the children: their physical health and development; their socio-emotional development; their relationships with their parents, and their schooling and cognitive development.
7.2 INFORmINg pOLICYBetter Outcomes, Brighter Futures: the National Policy Framework for Children and Young People, 2014-2020 (BOBF; DCYA, 2014) sets out the government’s policy framework for children and young people.53 The vision statement in the policy framework is “... to make Ireland the best small country in the world in which to grow up and raise a family, and where the rights of all children and young people are respected, protected and fulfilled: where their voices are heard and where they are supported to realise their maximum potential now and in the future” (p.4). The policy framework has five national outcomes, each with four aims and objectives regarding children and young people:
Outcome 1: Active and healthy – physical and mental wellbeing
Outcome 2: Achieving full potential in all areas of learning and development
Outcome 3: Safe and protected from harm
Outcome 4: Economic security and opportunity
Outcome 5: Connected, respected and contributing to their world
In addition, the First 5 early-years strategy (Government of Ireland, 2018) specifies a set of goals specifically for the first five years of life:
A. Strong and supportive families and communities
B. Optimum physical and mental health
C. Positive-play-based early learning
D. An effective early childhood system
As noted in Chapter One of this report, a principal aim of Growing Up in Ireland is to provide an evidence base for policy formation and design of services for families, children and young people. The results of the current report are summarised below along the lines of the five main outcomes set out in the National Policy Framework for Children and Young People. This illustrates very clearly how the information presented in the report (and the wealth of other information available from Growing Up in Ireland) can directly inform policy in key areas of the lives of children and young people in Ireland today. Discussing the main results presented in the report within the BOBF framework illustrates the richness of the data and their relevance to policy development and monitoring. Presenting the findings in this way also highlights how further
53 For ease of reference, referred to as BOBF.

Growing Up in Ireland • THE LIVES OF 5-YEAR-OLDS
129
analysis of Growing Up in Ireland data could deepen the understanding of the processes underlying positive and negative outcomes for children.
7.2.1 OUTCOmE ONE: ACTIVE AND HEALTHY – pHYSICAL AND mENTAL wELLbEINgThe aims of this outcome are that all children and young people:
– should be physically healthy and make positive health choices
– have good mental health
– have a positive and respectful approach to relationships and sexual health
– are enjoying play, recreation, sports, arts, culture and nature
Issues discussed in this report that inform national Outcome One include: general health status, inequalities in health and healthcare use; obesity and associated environmental risk factors; socio-emotional wellbeing, and play. In the First 5 strategy, physical and mental health are also emphasised (Goal B) and there is a recognition of the importance of play to early learning (Goal C; Government of Ireland, 2018).
On average, five-year-olds were found to be in good health, with 77% described by their Primary Caregiver as ‘very healthy’. Most of the other children were described as ‘healthy but with a few minor problems’ (21%). Of concern were some of the social variations in health status of young children, with the most socially disadvantaged recorded as more likely to experience poor health. For instance, 25% of Primary Caregivers in the lowest income quintile reported that their five-year-old had at least some health problems compared to 20% of those in the highest income quintile.
By five years of age a quarter of children had required medical treatment for an injury in their lifetime. Most injuries (almost two-thirds) occurred in the child’s home. Head injuries without a loss of consciousness were the most common type (8%) followed by cuts needing stitches and fractures (each 5%).
A major public health and policy concern is the continued high levels of overweight and obesity, even among children as young as five years of age (15% overweight and 5% obese).
Gender differences were apparent in the child’s weight status, with 23% of girls and 18% of boys either overweight or obese, but the social gradients in levels (especially in obesity levels) were even more striking. Children in the lowest equivalised family income quintile had a much higher risk of obesity than those in the highest quintile (7% compared to 4%) with rates of being overweight at 16% and 12%, respectively.
Fourteen per cent of five-year-olds were persistently overweight or obese at both three and five years of age. In general, girls were more likely to be persistently overweight than boys and to become overweight between three and five years. Closely associated to weight status54 was calorie intake, which was strongly related to all measures of social disadvantage – the more disadvantaged a child the more calories s/he consumed, on average.
Healthcare use was also considered. GP consultations were found to be related to whether or not the child was covered for free medical care under the General Medical Services Scheme (covered by a medical card). Controlling for underlying health conditions, usage levels were higher for those covered by a card than for those who had to pay for their healthcare, suggesting that the cost of GP consultations may pose a financial barrier for families who are not covered for GP care (see also Nolan and Layte, 2017).
Most children had favourable scores from teachers and parents on the Strengths and Difficulties Questionnaire (SDQ), a widely used screening tool to identify children at risk of socio-emotional and behavioural difficulties.
54 Body Mass Index (BMI).
Chapter 7 • SummARY AnD DIScuSSIOn
Growing Up in Ireland • THE LIVES OF 5-YEAR-OLDS
130
Strong social gradients were nevertheless apparent, with those from more disadvantaged backgrounds more likely at five years of age to fall into the ‘at risk’ range. Growing Up in Ireland data provide the opportunity to examine these patterns in more depth and to help identify risk factors and protective factors associated with socio-emotional and behavioural wellbeing among children and young people. An important goal in this respect would be to examine the family and environmental factors (including school factors) that promote resilience in otherwise adverse circumstances.
Both parent and teacher scores on the SDQ were examined. From a longitudinal perspective, it was clear from the analysis presented that the children at risk of socio-emotional and behavioural problems at three years of age had a much higher risk of problems at five years of age, underlining the importance of early interventions. However, there was also evidence of improvement over time.
Nearly all children had some screen-time (including television, videos/DVDs, video games and computer/tablet use) on a daily basis, and 14% had three hours or more of screen-time on an average day. Children whose parents had lower levels of education were more likely to spend three hours per day or more on screen-time.
A majority used screen devices for a mixture of activities and not just television. There has been a long-standing debate on the effect on child outcomes of television and, more recently, other screen-time. Some studies have pointed to adverse effects of television viewing on children’s conduct and attention (see, for example, Christakis et al., 2004), though other studies suggest such negative effects are limited to prolonged viewing only (Parkes et al., 2013). The type of screen use also makes a difference; educational viewing is associated with enhanced cognitive development (Mares and Pan, 2013). However, the relationship between screen-time and behaviour is complex, and many studies are cross-sectional and do not take account of other child activities such as reading and physical play. There is considerable potential to use Growing Up in Ireland data to unpack the effects of screen-time and other child activities on child outcomes in order to inform policy and parental practice.
Other types of play that were popular among five-year-olds were ‘make believe’ or pretend games, arts and crafts, dance and music. In general, girls were more likely than boys to engage in these types of activities. Popular kinds of physical play were ball and chase games, and riding a bicycle or tricycle; these were more frequent among boys than girls. Data on play preferences of children by gender may be useful in designing programmes to promote physical activity. The information on participation in cultural activities such as painting/drawing and dance/music provide an important evidence base for the Creative Ireland programme which aims to enable the creative potential of every child.
7.2.2 OUTCOmE TwO: ACHIEVINg – FULL pOTENTIAL IN LEARNINgThe aims of this outcome are that all children and young people:
– are learning and developing from birth
– have social and emotional wellbeing
– are engaged in learning
– are achieving in education
The First 5 early years strategy also places an emphasis on children’s cognitive development, with a special emphasis on early learning in the home as well as in educational settings (Government of Ireland, 2018, Goal C).
Chapter 5 described the child’s early schooling, learning and cognitive development. The study identified

Growing Up in Ireland • THE LIVES OF 5-YEAR-OLDS
131
high uptake of the Free Pre-School Year, with nearly all children availing of the scheme. Although large proportions of families whose five-year-old availed of the scheme indicated that they would have been able to send their child to preschool anyway, substantial minorities of more disadvantaged families (39% of those in the lowest income quintile) indicated that their five-year-old would not have been able to attend preschool in the absence of the scheme. More advantaged parents were more likely to pay for a top-up to the free hours, partly because higher incomes are associated with mothers working and working mothers needed more childcare than is provided under the free scheme. Parental reports on the centres the children attended for the Free Pre-School Year tended to be very positive.
The study findings also highlight the importance of the home learning environment. Two-thirds of five-year-olds are read to every day, though this figure is lower for children living in families with lower levels of education. Parent-child reading patterns appear to be established early, with a strong relationship between reading frequency at three and five years of age. These findings point to the importance of encouraging parent-child reading from an early age through library-based and other local initiatives.
About two-thirds of the children (mostly born in the first-half of 2008) had started school in September 2012, with children born later in the year more likely to wait until September 2013. Of particular note were the larger proportions of children from more advantaged families and also boys who were more likely to defer school start until 2013. Controlling for age, children from disadvantaged families were more likely to send their five-year-old to school earlier than their more advantaged counterparts. Given that later school start is associated with some developmental benefits for children in the Growing Up in Ireland sample (see Smyth, 2018), these trends raise questions as to whether some children could be disadvantaged by being pressured to start school earlier than may be optimal for them as individuals. However, since the time of data collection the Government has extended the scheme to allow for a possible second year at preschool, which may result in a levelling-off in age of entry.
The child’s dispositions and skills are important in facilitating the first transition out of the immediate home environment to the much broader surrounds of the school, where they will begin to navigate a range of new relationships and interactions beyond the family. The report found that most children scored well on measures of school-readiness, as recorded by both parents and teachers. Virtually all Primary Caregivers reported that their five-year old could mix with other children and take care of their own hygiene. Teachers reported that over 70% of the children already in school had achieved the basic milestones in dispositional development (such as showing an interest in classroom activities) and language development (such as initiating communication with others), which are a prerequisite to broader cognitive development. However, many systematic differences were apparent in the levels of skills and competencies among the children. Boys, children from lower-income families and children whose parents had lower levels of education were more likely to have lower vocabulary test scores, more negative dispositions towards school and poorer language skills. Low-birthweight children were also more likely to have significantly lower school-readiness scores, illustrating the persistence of the disadvantages associated with low birthweight (controlling for other background characteristics) at least to five years later. Teacher ratings of children’s performance in relation to different areas of the primary school curriculum showed a similar social gradient, with children from families with lower levels of education and income more likely to be rated as below average.
A strong relationship was found between earlier developmental indicators measured at three years, and more modestly, at nine months of age (the Ages and Stages Questionnaire) and the five-year-old’s skills and competencies. Taken together, these findings suggest that, as has been found in other countries, children do not enter formal schooling on a level playing-field. For some developmental outcomes, one policy response might be better support for children in the preschool period – and the Government has in recent years moved to address inequalities in access to formal preschool education through the previously mentioned universal scheme. Currently the kinds of learning opportunities offered to children in the early years of primary education vary by the type of school and classroom they attend (Smyth, 2018). There is
Chapter 7 • SummARY AnD DIScuSSIOn
Growing Up in Ireland • THE LIVES OF 5-YEAR-OLDS
132
therefore considerable potential to ensure that all children have access to the kinds of play-based learning and hands-on activities that will foster their engagement in school, and are exposed to the kind of high-quality experiences of reading and numbers that will enhance their skill development. Previous research using Growing Up in Ireland data (Smyth, 2018) also highlights the importance of positive relationships with teachers in facilitating the transition to primary education and engagement within it.
7.2.3 OUTCOmE THREE: SAFE AND pROTECTED FROm HARmThe aims of this outcome are that all children and young people:
– have a secure, stable and caring home environment
– are safe from abuse, neglect and exploitation
– are protected from bullying and discrimination
– are safe from crime and anti-social behaviour
The First 5 early years strategy also emphasises safety in the context of promoting child-friendly communities (Goal A) and child safety and injury prevention (Goal B), and through programmes such as the Tusla Signs of Safety framework (Goal A, Government of Ireland, 2018).
The main aspects of this outcome that were considered in this report centre on the child’s family, since this is central to the goal of providing a secure and caring home environment. It is important for the development of service delivery and policy development to better understand the nature, composition and changes in the families in which five-year-olds are being brought up. From the analysis in the current report, it is clear that, while there is a high level of consistency in the overall percentage of one- and two-parent families from nine months to five years of age, this apparent stability masks a degree of change in family type at the level of the individual child. For example, approximately 4% of five-year-olds made the transition from one- to two-parent families or from two- to one-parent families over the four years in question (Chapter 6).
Data that are relevant to the aim of protecting children from harm relate to the perceived safety of the neighbourhood. For example, children living in urban areas were twice as likely to have been injured (outside) in their local neighbourhood as were those in rural areas (3.6% and 1.5% respectively) – although rates were low overall. The impact of perceived danger in the Study Child’s environment could be further explored using Growing Up in Ireland data. The current report also noted that some children spend long hours engaged in screen-based activities, which has potential risks in terms of exposure to inappropriate material or connecting with strangers online. Elsewhere in the Growing Up in Ireland study, although not covered in this particular report, information was collected from parents on the child’s exposure to ‘adverse events’ such as serious illness or injury, parental conflict and stays in foster care (Growing Up in Ireland Study Team, 2013).
7.2.4 OUTCOmE FOUR: ECONOmIC SECURITY AND OppORTUNITYThe aims of this outcome are that all children and young people:
– are protected from poverty and social exclusion
– are living in child/youth-friendly, sustainable communities
– have opportunities for ongoing education and training
– have pathways to economic participation and independent living

Growing Up in Ireland • THE LIVES OF 5-YEAR-OLDS
133
Chapter 7 • SummARY AnD DIScuSSIOn
The First 5 early-years strategy also recognises the importance of supporting families in order to ensure that children have the material resources they require (Government of Ireland, 2018, Goal A).
As noted in the BOBF Framework, there is a strong link between parental participation in the labour market, maternal education and children’s living conditions. Tackling disadvantage can be achieved through “... active inclusion strategies that combine supports for parents to access education, training and employment, with income support...” (p.91). In addition, these strategies should be combined with flexible labour-market policies aimed at reducing work-life imbalances for parents and their children.
These observations from BOBF were clearly reflected in the findings outlined in the report. In the period between the first and third interviews, Ireland experienced one of the worst economic recessions in its history. The recession was first felt in 2008, bottoming out in 2012, with a slow recovery thereafter. This had a negative effect on almost all families in Ireland over the period. Although the percentage of Primary Caregivers of five-year-olds who worked outside the home remained relatively constant at 53-56% between nine months and five years of age, there was a greater loss of employment among Secondary Caregivers during the recession. In addition, there was a substantial degree of movement in individual families in terms of economic status from one interview to the other. One-quarter of Primary Caregivers who described themselves as engaged in ‘Home duties/Looking after the family’ at nine months of age recorded themselves as being ‘At work’ outside the home by the time their child was five years old. Equally, 17% of Primary Caregivers who were ‘At work’ outside the home when the Study Child was nine months had changed to engaged in ‘Home duties/looking after the family’ by the time the child was five years old.
Labour-force participation was strongly related to social background, with levels of out-of-home working being substantially higher among more advantaged groups – 75% of Primary Caregivers who were graduates, compared with 23% of those who had left school at Junior Certificate level or earlier.
Despite the clear financial and other advantages of out-of-home working, one of the main disadvantages is the effect it has on work-life balance and the quantity and quality of time that parents or caregivers can spend with their children. The challenges of work-life balance are recognised in the First Five early-years strategy (Government of Ireland, 2018), which aims to increase the options for parents in this area. This challenge was clearly identified in the report; large percentages of both Primary and Secondary Caregivers who worked outside the home recorded that they felt they had missed out on family activities or their family time was less enjoyable due to out-of-home work responsibilities. Equally, relatively high percentages of caregivers in employment outside the home felt that they had had to turn down work opportunities or their work time was less enjoyable as a result of their family commitments. These trends underline the need to advance family-friendly workplace policies to facilitate parents who wish to engage in out-of-home working.
The effects of the economic downturn since 2008 were evident. Incomes fell across all types of families since their first interview in 2008. There were also substantial increases in the percentage of families who experienced financial stress over that period – 44% at the time of their first interview, increasing to 67% just four years later, by the time of their third interview when their child was five years of age. Financial hardship may have direct implications for child outcomes through, for example, poorer housing, nutrition or medical care, and also indirect implications when family functioning is compromised by the stress placed on parents. A detailed examination of the impact of persistent financial hardship went beyond the scope of the present report. In depth analysis of the impact of financial stresses on children has been conducted by Watson et al. (2014) and by Nixon, Layte and Thornton (2019), using the first two waves of the GUI study. In particular, Nixon et al. (2019) focuses specifically on Cohort ‘08 and employs a family stress model to highlight the relationship between economic disadvantage and emotional and behavioural difficulties for children. The report highlights policy related factors that may protect children from the negative consequences of economic cycles.
Growing Up in Ireland • THE LIVES OF 5-YEAR-OLDS
134
7.2.5 OUTCOmE FIVE: CONNECTED, RESpECTED AND CONTRIbUTINg TO THEIR wORLDThe aims of this outcome are that all children and young people:
– have sense of their own identity, free from discrimination
– have positive networks of friends, family and community
– are civically engaged, and are socially and environmentally conscious
– are aware of their rights, and are responsible and respectful of the law
Of the five BOBF outcomes, this is the one least addressed in this descriptive report. This is mainly because at five years old the children are still in the early stages of forging their own identities, engaging with peers and others outside the immediate family, and becoming socially engaged. Chapter 4 summarised some of the main variations in parenting and family relationships and noted their impact on children’s outcomes. Overall, information from the five-year-olds and their caregivers indicates a positive picture of parent-child interactions. High levels of closeness, warmth and consistency and low levels of hostility and conflict were indicated in the series of questions answered by both Primary and Secondary Caregivers, and which were used to construct the relevant scales. In general, only-children appeared to have a warmer relationship with their parents than others.
Levels of family activity were generally high, including going to the cinema, attending cultural and school events; playing with toys and games together, and sports and physical activities with the children. There were some urban/rural contrasts (sports activities being more common in rural areas, cinema-going more common in urban areas). Activity levels were also somewhat higher among parents with higher levels of education.
7.3 NExT STEpS IN gROwINg Up IN IRELAND’S COHORT ‘08 (INFANT COHORT)
As noted at the outset, this has been a wide-ranging, though primarily descriptive report. Nevertheless, it has pointed to many further questions concerning the lives of five-year-olds. These more complex questions can be addressed using Growing Up in Ireland data in future analyses with a more targeted and in-depth research strategy, using a range of statistical techniques. Among the questions worthy of exploration are the following:
1. Although there was evidence of some continuity in terms of the children who were doing well at age three and at age five, there was also evidence of change. What can be learned from the correlates of improvements in health, socio-emotional and cognitive development at this stage of early childhood? How important are the kinds of things that might be influenced by policy, such as supports for parents, the experience of high-quality early childhood care and education, or neighbourhood facilities?
2. To what extent has there been a change in parent-child interactions as the child has matured and moved to the early school years; and how has this influenced child socio-emotional and cognitive development?
3. Earlier analysis of Growing Up in Ireland data showed that the increased economic vulnerability experienced by families during the recession was associated with an increase in socio-emotional problems among children at age three years (Watson et al. 2015). Has this drop in socio-emotional wellbeing persisted to age five? Was an upturn in financial circumstances associated with an improvement in child outcomes and/or family functioning?
Growing Up in Ireland • THE LIVES OF 5-YEAR-OLDS
135
Chapter 7 • SummARY AnD DIScuSSIOn
4. What are the factors associated with improvements in children’s BMI between the ages of three and five years old? Is there evidence that a change in diet or the transition to school – with associated routines and opportunities for exercise – have led to change? Are changes in parental BMI mirrored by changes in the children’s BMI?
5. How do a child’s free-time activities – whether screen-based, pretend play, physical activities or activities with parents – interact with their cognitive and socio-emotional development? What could parents, and others who look after young children, learn about play activities that are both enjoyable and promote development?
Growing Up in Ireland • THE LIVES OF 5-YEAR-OLDS
136
REFERENCES
Ackerman, D. J. & Barnett, W. S. (2005). Prepared for Kindergarten: What does ‘readiness’ mean?, National Institute for Early Education Research Policy Report. Retrieved from https://www.researchgate.net/publication/255617499_Prepared_for_Kindergarten_What_Does_Readiness_Mean
Amato, P. R. (2001). Children of divorce in the 1990s: An update of the Amato and Keith (1991) meta-analysis. Journal of Family Psychology, 15, 355-370.
Asher M. I., Montefort, S., Björkstén, B., Lai, C. K., Strachan, D. P., Weiland, S. K., & Williams, H. (2006). Worldwide time trends in the prevalence of symptoms of asthma, allergic rhinoconjunctivitis, and eczema in childhood: ISAAC Phase One and Three repeat multicountry cross-sectional surveys. Lancet, 368, 733–743.
Bambra C., Gibson M., Sowden A., Wright K., Whitehead M., & Petticrew M. (2010). Tackling the wider social determinants of health and health inequalities: evidence from systematic reviews. Journal of Epidemiology and Community Health, 64, 284–291.
Bandura, A., Ross, D. & Ross, S. (1963). Imitation of film-mediated aggressive models. The Journal of Abnormal and Social Psychology, 66(1), 3–11.
Bel-Serrat S, Heinen, M. M., Murrin, C. M., Daly, L., Mehegan, J., Concannon, M.,. . .Kelleher, C. C. (2017). The Childhood Obesity Surveillance Initiative (COSI) in the Republic of Ireland: Findings from 2008, 2010, 2012 and 2015. Dublin: Health Service Executive.
Berger, L. M., Hill, J. & Waldfogel, J. (2005). Maternity leave, early maternal employment and child health and development in the US. Economic Journal, 115, F29–F47.
Berry, J. O. & Jones, W. H. (1995). The Parental Stress Scale: Initial psychometric evidence. Journal of Social and Personal Relationships, 12(3), 463-472.
Bianchi, S. M. (2000). Maternal employment and time with children: Dramatic change or surprising continuity? Demography, 37(4), 401-414.
Blanden, J., Gregg, P. & Macmillan, L. (2007). Accounting for intergenerational income persistence: non-cognitive skills, ability and education. Economic Journal, 117, C43-C60.
Bradshaw, P., Hall, J., Hill, T., Mabelis, J., & Philo, D. (2012). Growing up in Scotland: Early Experiences of Primary School. Edinburgh: Scottish Government.
Bronfenbrenner, U. (1979). The Ecology of Human Development: Experiment by Nature and Design. Cambridge: Harvard University Press.
Bronfenbrenner, U. (1993). The ecology of cognitive development. In R. H. Woznick and K. Fischer (eds.), Acting and Thinking in Specific Environments, 3-44. Hillsdale, NJ: Erlbaum.
Burke, N. J., Hellman, J. L., Scott, B. G., Weems, C. F., & Carrion, V. G. (2011). The impact of adverse childhood experiences on an urban pediatric population. Child Abuse & Neglect, 35, 408–413.
Bus, A. G., Van Ijzendoorn, M. H., & Pellegrini, A. D. (1995). Joint book reading makes for success in learning to read: A meta-analysis on intergenerational transmission of literacy. Review of Educational Research, 65(1), 1-21.
Cavanagh S. E., Crissey S., & Raley K. (2008). Family structure history and adolescent romance. Journal of Marriage and Family, 70, 698-714.
Cavanagh, S. E., & Huston, A. C. (2006). Family instability and children’s early problem behavior. Social Forces 85(1), 575–605.
Centres for Disease Control and Prevention (CDC). (2018, June 19). Important Milestones: Your Child by Five Years. Retrieved from https://www.cdc.gov/ncbddd/actearly/milestones/milestones-5yr.html
Christakis, D. A., Zimmerman, F. J., DiGiuseppe, D. L. & McCarty, C. A. (2004). Early television exposure and subsequent attentional problems in children. Pediatrics, 113, 708-713.
Cole, T. J., Bellizzi, M. C., Flegal, K. M., & Dietz, W. H. (2000). Establishing a standard definition for child overweight and obesity worldwide: international survey. BMJ, 320, 1240.
Growing Up in Ireland • THE LIVES OF 5-YEAR-OLDS
137
REFEREncES
Cooper, K., & Stewart, K. (2013). Does money affect children’s outcomes?: A systematic review. York: Joseph Rowntree Foundation.
Cooper, K., & Stewart, K. (2017). Does money affect children’s outcomes An Update. Centre for Analysis of Social Exclusion Paper 203. London: Centre for Analysis of Social Exclusion, London School of Economics.
Corsaro, W. A., & Eder, D. (1990). Children’s peer cultures. Annual Review of Sociology, 16, 197-220.
Crawford, C., Goodman, A., Greaves, E., & Joyce, R. (2011). Cohabitation, marriage, relationships stability and child outcomes: an update. IFS Commentary C120. London: Institute for Fiscal Studies.
Datar, A. (2006). Does delaying kindergarten entrance give children a head start? Economics of Education Review, 25(1), 43–62.
Davis, E., Sawyer, M. G., Lo, S. K., Priest, N., & Wake, M. (2010). Socioeconomic risk factors for mental health problems in 4-5-year-old children: Australian population study. Acad Pediatr, 10(1), 41-7.
Department of Children and Youth Affairs. (2014). Better Outcomes, Brighter Futures. The National Policy Framework for Children & Young People 2014-2020. Dublin: DCYA.
Department of Education and Skills (2018). Education Statistics Database. https://www.cso.ie/en/databases/departmentofeducation/
Department of Health. (2016). A Healthy Weight for Ireland: Obesity Policy and Action Plan for Ireland. Healthy Ireland. Dublin: Department of Health.
Devaux, M. & Sassi, F. (2013). Social inequalities in obesity and overweight in 11 OECD countries. Eur J Public Health, 23, 464-469.
Dickerson, A. & Popli, G. K. (2016). Persistent poverty and children’s cognitive development: evidence from the UK Millennium Cohort Study. Series A: Statistics in Society, 179, 2, 535-558.
Duncan, G. J., & Brooks-Gunn, J. (Eds.). (1997). Consequences of Growing Up Poor. New York: Russell Sage Foundation.
Duncan, G. J. (2010). Early-childhood poverty and adult attainment, behavior and health. Child Dev, 81(1), 306-325.
Duncan, G. J., Dowsett, C. J., Claessens, A., Magnuson, K., Huston, A. C., Klebanov, A. C., & Sexton, H. (2007). School readiness and later achievement. Developmental Psychology, 43(6), 1428-1446.
Egan, S. & Murray, A. (2014). Does time spent watching television in early childhood affect socio-emotional development? 6th Annual Growing Up in Ireland research conference, Dublin. Available from http://www.esri.ie/pubs/does_time_spent_watching_television_Egan_and_Murray.pdf
Eivers, E. & Clerkin, A. (Eds.), (2013). National Schools, International Contexts: Beyond the PIRLS and TIMSS test results. Dublin: Educational Research Centre.
Elliott, C. D., Smith, P., & McCulloch, K. (1996). British Ability Scales Second Edition (BAS II): Administration and Scoring Manual. London: NFER-Nelson.
Elliott, C. D., Smith, P., & McCulloch, K. (1997). British Ability Scales Second Edition (BAS II): Technical Manual. London: NFER-Nelson.
Emlen, A. C., Koren, P. E., & Schultze, K. H. (2000). A packet of scales for measuring quality of child care from a parent’s point of view. Portland, OR: Regional Research Institute for Human Services, Portland State University.
Erikson, E. H. (1968). Identity: Youth and Crisis. New York: Norton.
European Child Safety Alliance (2012, June). How safety conscious are European countries towards children? Retrieved from http://www.childsafetyeurope.org/publications/info/child-safety-report-cards-europe-summary-2012.pdf
Ferech, M., Coenen, S., Malhotra-Kumar, S., Dvorakova, K., Hendrickx, E., Suetens, C., . . . & ESAC Project Group (2006). European Surveillance of Antimicrobial Consumption (ESAC): outpatient antibiotic use in Europe. J Antimicrob Chemother, 58(2), 401-7.
Growing Up in Ireland • THE LIVES OF 5-YEAR-OLDS
138
Fomby, P. & Cherlin, A. J. (2007). Family instability and child well-being. American Sociological Review 72(2), 181–204.
Forget-Dubois, N., Lemelin, J. P., Boivin, M., Dionne, G., Séguin, J. R., Vitaro, F. & Tremblay, R. E., (2007). Predicting Early School Achievement With the EDI: A Longitudinal Population-Based Study, Early Education & Development, 18(3), 405–426.
Fredriksson, P. & Öckert, B. (2014). Life‐cycle effects of age at school start. The Economic Journal, 124 (579), 977–1004.
Freyne, B., Doyle, J., McNamara, R. & Nicholson, A. J. (2014). Epidemiology of high falls from windows in children. Irish Medical Journal, 107(2).
Gennetian, L. A., Hill, H. D., London, A. S. & Lopoo, L. M. (2010). Maternal employment and the health of low-income young children. Journal of Health Economics, 29(3), 353-363.
Gershoff, E. T. (2002). Corporal punishment by parents and associated child behaviours and experiences: A meta-analytic and theoretical review. Psychological Bulletin, 128, 539-579.
Girard, L. C., Pingault, J. B. Doyle, O. Falissard B., & Tremblay, R. E. (2017). Expressive language and prosocial behaviour in early childhood: Longitudinal associations in the UK Millennium Cohort Study, European Journal of Developmental Psychology, 14(4), 381–398.
Gomulka, J., (1992). Grossing-Up Revisited, in R. Hancock and H. Sutherland (Eds.), Microsimulation Models for Public Policy Analysis: New Frontiers, STICERD, Occasional Paper 17, LSE.
Gomulka, J., (1994). Grossing Up: A Note on Calculating Household Weights from Family Composition Totals. University of Cambridge, Department of Economics, Microsimulation Unit Research Note MU/RN/4, March 1994.
Goodman, R. (1997) The Strengths and Difficulties Questionnaire: A Research Note. Journal of Child Psychology and Psychiatry, 38, 581-586.
Government of Ireland (1999). Primary School Curriculum. Dublin: Stationery Office.
Government of Ireland (2018) First 5: A Whole-of-Government Strategy for Babies, Young Children and their Families 2019-2028. Dublin: Stationery Office.
Greene, S. M. (1994). Growing up Irish: development in context. The Irish Journal of Psychology, 15(2-3), 354-371.
Greene, S., Morgan, M., McCrory, C. & McNally, S. (2014). Growing Up in Ireland: Review of the Literature pertaining to the Second Wave of Data Collection with the Infant Cohort at 3 Years. Dublin: The Stationary Office.
Greene, S., Williams, J., Layte, R., Doyle, E., Harris, E., McCrory, C., . . . & Whelan, C.T. (2010). Growing Up in Ireland: Background and Conceptual Framework. Dublin: Office of the Minister for Children and Youth Affairs.
Gresham, F. M. & Elliott, S. N. (2008) Social Skills Improvement System – Rating Scales. Bloomington, MN: Pearson.
Grissmer D., Grimm K. J., Aiyer S. M., Murrah W. M., & Steele J. S. (2010). Fine motor skills and early comprehension of the world: two new school readiness indicators, Developmental Psychology, 46(5), 1008-17.
Grossman, D. C. (2000). The history of injury control and the epidemiology of child and adolescent injuries. Future Child, 10(1), 23-52.
Growing Up in Ireland Study Team. (2012). Key Findings: Infant Cohort (at 3 years). No. 4: Children’s Physical Growth from Birth to Age 3. Dublin: Office of the Minister for Children and Youth Affairs.
Growing Up in Ireland Study Team. (2013). Key Findings: Infant Cohort (at 5 years). No. 2: Socio-Emotional Well-being of 5-year-olds. Dublin: Office of the Minister for Children and Youth Affairs.
Growing Up in Ireland Study Team. (2018a). Key Findings, Cohort ’08 at years old: No 1: 9-Year-Olds and their Families. Dublin: Department of Health and Children.

Growing Up in Ireland • THE LIVES OF 5-YEAR-OLDS
139
REFEREncES
Growing Up in Ireland Study Team. (2018b). Key Findings, Cohort ’08 at years old: No 2: School and learning. Dublin: Department of Health and Children.
Growing Up in Ireland Study Team. (2018c). Key Findings, Cohort ’08 at years old: No 3: Health and Physical Development. Dublin: Department of Health and Children.
Growing Up in Ireland Study Team. (2018d). Key Findings, Cohort ’08 at years old: No 4: Relationships and Socio-Emotional Wellbeing. Dublin: Department of Health and Children.
Haas, S. A. (2007). The long-term effects of poor childhood health: An assessment and application of retrospective reports. Demography, 44(1), 113–135.
Hannan, C. & Halpin, B. (2014). The influence of family structure on child outcomes: Evidence for Ireland. The Economic and Social Review, 45(1), 1-24.
Hansen, K. & Jones, E. M. (2008). Foundation Stage Profile and devolved administration teacher survey. In Hansen, K. & Joshi, H. (eds.), Millennium Cohort Study Third Survey: A User’s Guide to Initial Findings. retrieved from www.cls.ioe.ac.uk/shared/get-file.ashx?id=312&itemtype=document
Hansen, K. & Joshi, H. (Eds.), (2008). Millennium Cohort Study Third Survey: A User’s Guide to Initial Findings. Retrieved from www.cls.ioe.ac.uk/shared/get-file.ashx?id=312&itemtype=document
Hyder, T. (2004). War, Conflict and Play. Maidenhead, UK: Open University Press.
Hyson, M., Copple, C., & Jones, J. (2006). Early childhood development and education. In K. A. Renninger & I. E. Sigel (Eds.), Handbook of child psychology (6 ed., Vol. 4, pp. 3-47). New Jersey: Wiley.
Ialongo, N. S., Vaden-Kiernan, N., & Kellam, S. (1998). Early peer rejection and aggression: Longitudinal relations with adolescent behavior. Journal of Developmental and Physical Disabilities, 10(2), 199-213. http://dx.doi.org/10.1023/B:JODD.0000036976.48023.a6
Kalb, G., & Van Ours, J. C. (2014). Reading to young children: A head-start in life?. Economics of Education Review, 40, 1-24.
Kerr, D. C. R., Lopez, N. L., Olson, S. L., & Sameroff, A. J. (2004). Parental discipline and externalising behaviour problems in early childhood: The roles of moral regulation and child gender. Journal of Abnormal Child Psychology, 32(4), 369-383.
Knafo, A., Zahn-Waxler, C., Van Hulle, C., Robinson, J. L., & Rhee, S. H. (2008). The developmental origins of a disposition toward empathy: Genetic and environmental contributions. Emotion, 8(6), 737-752.
Kohlberg, L. (1984). The Psychology of Moral Development: The Nature and Validity of Moral Stages (Vol. 2): Harper & Row.
Kramer, M. S., Séguin, L., Lydon, J., & Goulet, L. (2000). Socio-economic disparities in pregnancy outcome: why do the poor fare so poorly? Paediatr Perinat Epidemiol, 14(3), 194-210.
Larzelere, R. E. & Merenda, J. A. (1994). The effectiveness of parental discipline for toddler misbehaviour at different levels of child distress. Family Relations, 43, 480-488
Lobstein, T. & Jackson-Leach, R. (2011). Estimated burden of paediatric obesity and co-morbidities in Europe. Part 2. Number of children with indicators of obesity-related disease. Int J Pediatr Obes, 1(1), 33-41.
Luby, J., Belden, A., Botteron, K., Marrus, N., Harms, M. P., . . . & Babb, M. P. (2013). The effects of poverty on childhood brain development: the mediating effect of caregiving and stressful life events. JAMA Pediatrics, 167, 1135–42.
Mahoney, J. L., Larson, R. W., Eccles, J. S., & Lord, H. (2005). Organized activities as development contexts for children and adolescents. In Organised Activities as Contexts of Development: Extracurricular Activities, After-School and Community Programs. (Editors: J.L Mahoney, R.W. Larson & J.S. Eccles). Ch. 1, pp3-23. Mahwah, New Jersey: Laurence Erlbaum
Mares, M. L. & Pan, Z. (2013). Effects of Sesame Street: a meta-analysis of children’s learning in 15 countries. Journal of Applied Developmental Psychology, 34, 140-151.
Growing Up in Ireland • THE LIVES OF 5-YEAR-OLDS
140
Masoli, M, Fabian, D, Holt, S, & Beasley, R. (2004). Global Initiative for Asthma (GINA) Program. The global burden of asthma: Executive summary of the GINA Dissemination Committee Report. Allergy. 59, 469-478.
McGuinness, C., Sproule, L., Bojke, C., Trew, K., & Walsh, G. (2014). Impact of a play-based curriculum in the first two years of primary school: literacy and numeracy outcomes over seven years, British Educational Research Journal, 40(5), 772-795.
Medernach, R. L. & Logan, L. K. (2018). The growing threat of antibiotic resistance in children. Infect Dis Clin N Am, 32, 1-17.
Mol, S. E., & Bus, A. G. (2011). To read or not to read: a meta-analysis of print exposure from infancy to early adulthood. Psychological bulletin, 137(2), 267.
Morrill, M. S. (2011). The effects of maternal employment on the health of school-age children. Journal of Health Economics, 30(2), 240-257.
Moore, T. G., McDonald, M., Carlon, L. & O’Rourke, K. (2015). Early childhood development and the social determinants of health inequities. Health Promotion International, 30(2): ii102–ii115. https://doi.org/10.1093/heapro/dav031
Murray, A. & Morgan, M. (in press). To School and Beyond: Review of the Literature on Selected Issues Pertaining to the Infant Cohort at 5 Years. Dublin: ESRI/TCD/DCYA.
Murray, A., Williams, J., Quail, A., Neary, M. & Thornton, M. (2015). A Summary Guide to Wave 3 of the Infant Cohort (at 5 Years) of Growing Up in Ireland. Retrieved from http://www.ucd.ie/t4cms/Summary%20Guide%20%20Infant%20Cohort%20Wave%203.pdf
Nathen, A. B., Neff, M. J., Goss, C. H., Maier, R. V. & Rivara, F. P. (2000). Effect of an older sibling and birth interval on the risk of childhood injury. Injury Prevention, 6, 219-222.
NCCA. (2009). Aistear: The Early Childhood Curriculum Framework. Dublin: NCCA.
Nicolini, G., Speretto, F. & Esposito, S. (2014). Combating the rise of antibiotic resistance in children. Minerva Pediatr, 66(1), 31-9.
Nixon, E., Layte, R. and Thornton, M. (2019). The Effects of Economic Recession and Family Stress on the Adjustment of 3-Year-Olds in Ireland: Analysis of Wave 1 and Wave 2 of the ’08 (Infant) Cohort of Growing Up in Ireland. Dublin: Government of Ireland.
Nolan, A. & Layte, R. (2017). The impact of transitions in insurance coverage on GP visiting among children in Ireland. Social Science and Medicine, 180 (May), 94-100.
Ofcom (2013. Oct). Children and Parents : Media Use and Attitudes Report. Retrieved from http://stakeholders.ofcom.org.uk/binaries/research/media-literacy/october-2013/research07Oct2013.pdf on 24th February 2014
O’Kane, M. (2016). Transition from Preschool to School. Dublin: NCCA.
O’Sullivan, G. (2017). Childhood injury in Ireland and the risk factors. Department of Public Health – Midlands. Dublin: Health Service Executive. Retrieved from https://www.hse.ie/eng/health/child/childsafety/publications/inj-risk.pdf
Parkes, A., Sweeting, H., Wight, D., & Henderson, M. (2013). Do television and electronic games predict children’s psychosocial adjustment? Longitudinal research using the UK Millennium Cohort Study. Archives of disease in childhood, 91, 341-348.
Passer, M., Smith, R., Holt, N., Bremner, A., Sutherland, E., & Vleik, M. (2009). Psychology. The Science of Mind and Behaviour (European ed.). UK: Published by McGraw-Hill Education.
Piaget, J. (1936). Origins of Intelligence in the Child. London: Routledge & Kegan Paul.
Pianta, R. C. (1992). Child-parent relationship scale. Unpublished measure, University of Virginia.
Pryor, J. & Rodgers, B. (2001). Children in Changing families: Life after Parental separation. Oxford: Blackwell.
Growing Up in Ireland • THE LIVES OF 5-YEAR-OLDS
141
REFEREncES
Qvortrup, J., Corsaro, W. A., Honig, M. S., & Valentine, G. (Eds.). (2009). The Palgrave Handbook of Childhood Studies. Basingstoke: Palgrave Macmillan.
Ring, E., M. Mhic Mhathúna, M. Moloney, N. Hayes, D. Breathnach, P. Stafford, D., . . . & M. Ozonyia (2016). An Examination of Concepts of School Readiness among Parents and Educators in Ireland. Dublin: Department of Children and Youth Affairs.
Sariaslan, A., Sharp, D.J., D’Onofrio, B.M., Larsson, H. & Fazel, S. (2016) Long-Term Outcomes Associated with Traumatic Brain Injury in Childhood and Adolescence: A Nationwide Swedish Cohort Study of a Wide Range of Medical and Social Outcomes. PLOS Medicine 13(8): e1002103. https://doi.org/10.1371/journal.pmed.1002103
Smart, D., Sanson, A., Baxter, J., Edwards, B., & Hayes, A. (2008). Home-to-School Transitions for Financially Disadvantaged Children: Final Report. Sydney: The Smith Family
Smith, A. B., Gollop, M., Taylor, N. J. & Marshall, K. (2005) The Discipline and Guidance of Children:
A Summary of Research. Dunedin and Wellington, NZ: Children’s Issues Centre and Office of the Children’s Commissioner.
Smyth, E. (2016). Arts and Cultural Participation among Children and Young People. Dublin: ESRI/ Arts Council.
Smyth, E. (2018). The Transition to Primary Education: Insights from the Growing Up in Ireland study. Dublin: ESRI/ NCCA.
Sullivan, A., & Brown, M. (2015). Reading for pleasure and progress in vocabulary and mathematics. British Educational Research Journal, 41(6), 971-991.
UNICEF Office of Research (2017). Building the Future: Children and the sustainable development goals in rich countries, Innocenti Report Card 14. UNICEF Office of Research, Florence.
Vitaro, F., Brendgren, M., Larose, S., & Tremblay, R. E. (2005). Kindergarten disruptive behaviors, protective factors, and educational achievement by early adulthood. Journal of Educational Psychology, 97, 617–629.
Vygotsky, L. S. (1978). Mind in society. Cambridge MA: Harvard University Press.
Watson, D., Maitre, B., Whelan, C. T., & Williams, J. (2016). Child Economic Vulnerability Dynamics in the Recession, In J. Williams, E. Nixon, E. Smyth, D. Watson, Cherishing All the Children Equally? Children in Ireland 100 Years on from the Easter Rising, 261-284. Cork: Oak Tree Press.
Watson, D., Maitre, B., Whelan, C. T., & Williams, J. (2014). Dynamics of Child Vulnerability and Socio-Emotional Development: An Analysis of the First Two Waves of the Growing Up in Ireland Study. Dublin: ESRI/TCD/DCYA.
Watson, N. & Wooden, M. (2009). Identifying Factors Affecting Longitudinal Survey Response. In P. Lynn (Ed.), Methodology of Longitudinal Surveys. Hoboken, NJ: John Wiley & Sons, Ltd.
Williams, J., Greene, S., Harris, E., Layte, R., McCoy, S., McCrory, C. & Murray, A. (2009). Growing Up in Ireland: The Lives of 9-Year-Olds. Child Cohort Report No. 1. Dublin: The Stationery Office.
Williams, J., Greene, S., McNally, S., Murray, A. & Quail, A. (2010). Growing Up in Ireland: The Infants and their Families, Infant Cohort Report No. 1. Dublin: The Stationery Office.
Williams, J., Murray, A., McCrory, C., & McNally, S. (2013). Growing Up in Ireland: Development from Birth to Three Years, Infant Cohort Report No 5. Dublin: The Stationery Office.
World Health Organization (2008). World Report on Child Injury Prevention. Retrieved from https://www.who.int/violence_injury_prevention/child/injury/world_report/en/
Zubrick, S. R., Lucas, N., Westrupp, E. M., & Nicholson, J. M. (2014) Parenting measures in the Longitudinal Study of Australian Children: construct validity and measurement quality, Waves 1 to 4. Longitudinal Study of Australian Children (LSAC) Technical Paper No. 12, Canberra: Commonwealth of Australia https://growingupinaustralia.gov.au/sites/default/files/tp12.pdf
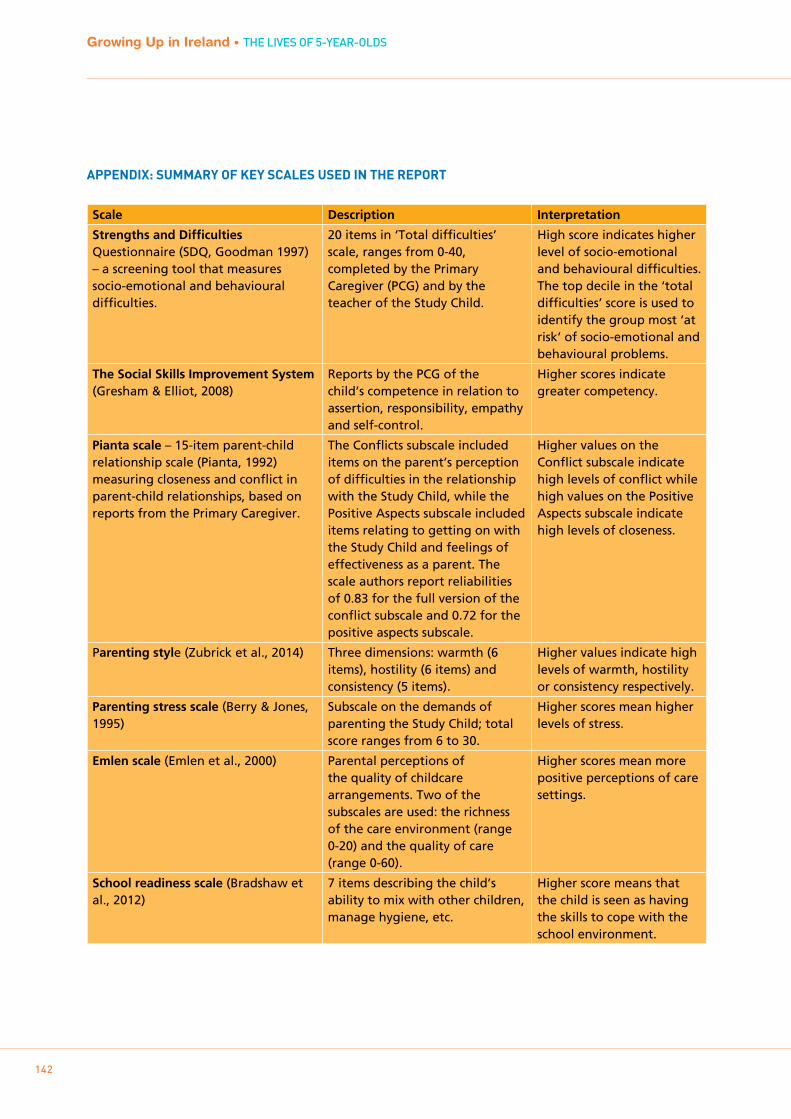
142
Growing Up in Ireland • THE LIVES OF 5-YEAR-OLDS
AppENDIx: SUmmARY OF kEY SCALES USED IN THE REpORT
Scale Description Interpretation
Strengths and Difficulties Questionnaire (SDQ, Goodman 1997) – a screening tool that measures socio-emotional and behavioural difficulties.
20 items in ‘Total difficulties’ scale, ranges from 0-40, completed by the Primary Caregiver (PCG) and by the teacher of the Study Child.
High score indicates higher level of socio-emotional and behavioural difficulties. The top decile in the ‘total difficulties’ score is used to identify the group most ‘at risk’ of socio-emotional and behavioural problems.
The Social Skills Improvement System (Gresham & Elliot, 2008)
Reports by the PCG of the child’s competence in relation to assertion, responsibility, empathy and self-control.
Higher scores indicate greater competency.
Pianta scale – 15-item parent-child relationship scale (Pianta, 1992) measuring closeness and conflict in parent-child relationships, based on reports from the Primary Caregiver.
The Conflicts subscale included items on the parent’s perception of difficulties in the relationship with the Study Child, while the Positive Aspects subscale included items relating to getting on with the Study Child and feelings of effectiveness as a parent. The scale authors report reliabilities of 0.83 for the full version of the conflict subscale and 0.72 for the positive aspects subscale.
Higher values on the Conflict subscale indicate high levels of conflict while high values on the Positive Aspects subscale indicate high levels of closeness.
Parenting style (Zubrick et al., 2014) Three dimensions: warmth (6 items), hostility (6 items) and consistency (5 items).
Higher values indicate high levels of warmth, hostility or consistency respectively.
Parenting stress scale (Berry & Jones, 1995)
Subscale on the demands of parenting the Study Child; total score ranges from 6 to 30.
Higher scores mean higher levels of stress.
Emlen scale (Emlen et al., 2000) Parental perceptions of the quality of childcare arrangements. Two of the subscales are used: the richness of the care environment (range 0-20) and the quality of care (range 0-60).
Higher scores mean more positive perceptions of care settings.
School readiness scale (Bradshaw et al., 2012)
7 items describing the child’s ability to mix with other children, manage hygiene, etc.
Higher score means that the child is seen as having the skills to cope with the school environment.

143
APPEnDIx 1
Scale Description Interpretation
Naming vocabulary and picture similarities test scores (Elliott et al., 1996, 1997)
Two subscales from the British Ability Scales designed to capture language development and non-verbal reasoning
Higher scores indicate more developed skills.
Teacher ratings of skills and competencies (Hansen & Jones, 2008)
Scales based on the Foundation Stage Profile in England adapted for use in Wales, Northern Ireland and Scotland for the Millennium Cohort Study. Five of these subscales are used: dispositions/attitudes to school, language for communication and thinking, linking sounds and letters, reading skills and number skills.
Higher scores indicate more developed skills. For each subscale, the first three items are seen as milestones, that is, as demonstrating the basic skills needed for more complex skill development.
If you would like further information aboutGrowing Up in Ireland, please visit
www.growingup.ie
e-mail [email protected]
or freephone 1800 200 434
Le ceannach díreach óFOILSEACHÁIN RIALTAIS,
52 FAICHE STIABHNA, BAILE ÁTHA CLIATH 2(Teil: 076 1106 834 nó Riomhphost: [email protected] )
nó trí aon díoltóir leabhar.
To be purchased fromGOVERNMENT PUBLICATIONS,
52 ST. STEPHEN'S GREEN, DUBLIN 2.(Tel: 076 1106 834 or Email: [email protected])
or through any bookseller