growing green business investments in asia and the pacific
TRANSCRIPT

ASIAN DEVELOPMENT BANK
ADB SUSTAINABLE DEVELOPMENT WORKING PAPER SERIES
NO. 72
December 2020
GROWING GREEN BUSINESS INVESTMENTS IN ASIA AND THE PACIFIC TRENDS AND OPPORTUNITIES
Madhu Khanna


ASIAN DEVELOPMENT BANK
ADB Sustainable Development Working Paper Series
Growing Green Business Investments in Asia and the Pacific: Trends and Opportunities
Madhu Khanna
No. 72 | December 2020
Madhu Khanna is a distinguished professor of environmental economics in the College of Agricultural, Consumer, and Environmental Sciences at the University of Illinois, Urbana-Champaign. She obtained her doctor in philosophy and master’s degrees from the University of California, Berkeley. Her research covers diverse topics, including technology adoption and agro-environmental policy analysis and voluntary approaches to environmental protection. Her work on technology adoption seeks to provide a rationale for the often-observed low rates of adoption of efficiency-enhancing technologies and shows the importance of considering heterogeneous producer characteristics, risks, uncertainty and market failures that distort prices while analyzing the incentives to adopt these technologies. She also examines the motivations for voluntary corporate environmental responsibility and the conditions under which it is effective in protecting the environment.

Creative Commons Attribution 3.0 IGO license (CC BY 3.0 IGO)
© 2020 Asian Development Bank6 ADB Avenue, Mandaluyong City, 1550 Metro Manila, PhilippinesTel +63 2 8632 4444; Fax +63 2 8636 2444www.adb.org
Some rights reserved. Published in 2020.
Publication Stock No. WPS200357-2DOI: http://dx.doi.org/10.22617/WPS200357-2
The views expressed in this publication are those of the authors and do not necessarily reflect the views and policies of the Asian Development Bank (ADB) or its Board of Governors or the governments they represent.
ADB does not guarantee the accuracy of the data included in this publication and accepts no responsibility for any consequence of their use. The mention of specific companies or products of manufacturers does not imply that they are endorsed or recommended by ADB in preference to others of a similar nature that are not mentioned.
By making any designation of or reference to a particular territory or geographic area, or by using the term “country” in this document, ADB does not intend to make any judgments as to the legal or other status of any territory or area.
This work is available under the Creative Commons Attribution 3.0 IGO license (CC BY 3.0 IGO) https://creativecommons.org/licenses/by/3.0/igo/. By using the content of this publication, you agree to be bound by the terms of this license. For attribution, translations, adaptations, and permissions, please read the provisions and terms of use at https://www.adb.org/terms-use#openaccess.
This CC license does not apply to non-ADB copyright materials in this publication. If the material is attributed to another source, contact the copyright owner or publisher of that source for permission to reproduce it. ADB cannot be held liable for any claims that arise as a result of your use of the material.
Please contact [email protected] if you have questions or comments with respect to content, or if you wish to obtainc copyright permission for your intended use that does not fall within these terms, or for permission to use the ADB logo.
The ADB Sustainable Development Working Paper Series presents data, information, and/or findings from ongoing research and studies to encourage exchange of ideas and elicit comment and feedback about development issues in Asia and the Pacific. Since papers in this series are intended for quick and easy dissemination, the content may or may not be fully edited and may later be modified for final publication.
Corrigenda to ADB publications may be found at http://www.adb.org/publications/corrigenda.
Note:In this publication, "$" refers to United States dollars.ADB recognizes “Hong Kong” as Hong Kong, China; and “China” as the People’s Republic of China.
Printed on recycled paper

CONTENTS
FIGURES vi
FOREWORD vii
ACKNOWLEDGMENTS viii
ABBREVIATIONS ix
EXECUTIVE SUMMARY x
I. INTRODUCTION 1
II. CONCEPTUAL FRAMEWORK 3
A. What is Green Business? 3B. Drivers of Green Businesses 5
III. GREEN BUSINESS TRENDS IN ASIA 9
A. Trends in Markets for Environmental Goods 9B. Trends in Greening of Businesses in Asia 16
IV. MARKET-BASED MOTIVATIONS FOR GREEN BUSINESS 18
A. Final Consumers 18B. Green Supply Chains 20C. Capital Markets 24
1. Rewarding Green Businesses through Lower Cost of Capital 242. Provision of Green Finance 25
D. Markets for Environmental Services 28
1. Ecotourism 282. Wetland Mitigation Banking 303. Markets for Biodiversity 32
V. REGULATORY PRESSURES TO INDUCE GREEN BUSINESSES 33
A. Fiscal Incentives 37B. Inducing Environmental Self-Regulation by Businesses 38
VI NON-REGULATORY PRESSURES TO INDUCE GREEN BUSINESS 39
VII. INNOVATION TO PROMOTE GREEN BUSINESS DEVELOPMENT 42
VIII. PERFORMANCE OUTCOMES OF GREENING BUSINESSES 45
A. Financial Performance 45B. Environmental Performance 46
IX. CONCLUSIONS 48
FIGURES
FIGURES
1 Types of Green Businesses 32 A Conceptual Framework for the Drivers of Green Businesses 63 Global Environmental Market (by Region) 104 Environmental Markets in the APAC-region 115 FTSE Asia Pacific Green Revenues Index 126 Low-Carbon Environmental Goods and Services Sales across Regions 137 Global New Investment in Renewable Power and Fuels in Developed, 14 Emerging and Developing Countries, 2008-2018 8 Global New Investment in Renewable Power and Fuels 179 ISO 14001 Certifications in Asia, 1999-2016 17

FOREWORD
While Asia and the Pacific has made great progress in addressing poverty, the region needs trillions of dollars to meet urgent sustainable development challenges, including climate change, biodiversity decline, and air and water pollution. With limited public sector funds and development assistance, there is a need for a much greater flow of investments from the private sector in environmentally sound practices and technologies and towards greater development of green business models and jobs.
In the midst of the coronavirus disease (COVID-19) pandemic, restoring livelihoods will undoubtedly be among the priorities of developing member countries of the Asian Development Bank (ADB) as they map out their recoveries from the crisis. There are hopeful signs that green businesses and jobs will be more resilient compared to “business-as-usual”. Environment, social, and governance funds have performed better than traditional investments through the early months of the pandemic. Growing consciousness of environmental issues has also prompted some governments to allocate stimulus support towards green recovery measures, such as investments in green technologies or setting conditions to improve companies’ environmental performance. We have an opportunity to support green business development as part of a holistic approach to recovery from the crisis. According to the World Economic Forum, investing in nature-positive models in response to the COVID-19 pandemic could add up to $10.1 trillion in annual business value and create 395 million jobs by 2030. This will require shorter- and longer-term response and recovery strategies tailored to each country’s context and capacity. The recommendations presented in this working paper range from direct investments in green supply chains and innovations to strengthening policy, regulatory, and non-regulatory frameworks and incentives for green business development. Critical support will be needed for micro-, small-, and medium-sized enterprises, which employ the most people in Asia, are the most vulnerable to shocks, and have the greatest potential for transforming the region’s business landscape.
The ADB’s Strategy 2030 supports investments that will enable the development of green businesses and jobs in Asia and the Pacific. Its operational priorities include addressing remaining poverty by supporting the creation of quality jobs (including improving the business environment for entrepreneurs and companies), as well as strengthening environmental sustainability by scaling up investments in circular economy models and green businesses, jobs, and technologies. In addition, ADB aims to expand its private sector operations to reach one-third of ADB operations in number by 2024.
There remains great potential to expand investments that address environmental sustainability. The private sector will be essential to mobilize much needed resources for sustainable development and help improve environmental, social, and governance standards. ADB is ready to work with its developing member countries to create the right enabling environments and scale up investments in green business models for a more inclusive, sustainable, resilient, and prosperous Asia and the Pacific.
Bruce DunnDirector, Safeguards Division concurrently Officer-in-Charge, Environment Thematic GroupSustainable Development and Climate Change DepartmentAsian Development Bank

ACKNOWLEDGMENTS
This paper was prepared as part of the implementation of the Asian Development Bank (ADB) regional technical assistance, TA 9093-REG: Scaling Up Private Sector Participation and Use of Market-Based Approaches for Environmental Management (closed December 2019). Madhu Khanna (former consultant, ADB) led the write up of the final paper, with overall direction from Daniele Ponzi (retired staff and former Chief, Environment Thematic Group, ADB), Herath Gunatilake (retired staff and former Director, Environment and Safeguards Division, ADB), Bruce Dunn (Director, Safeguards Division and Officer-in-Charge, Environment Thematic Group, ADB), and Isao Endo (Environment Specialist, ADB), as well as key inputs from Simon Baptist and Lucy Hurst (Economist Intelligence Unit and former consultants, ADB) and Erin Sinogba (consultant, ADB). Carlos Santamaria (consultant, ADB) edited the draft paper. Rocilyn Laccay (consultant, ADB) typeset the final publication. Lillyanne Buenaventura (Operations Analyst, ADB) and Ma. Charina M. Aguado (Associate Operations Analyst, ADB) provided valuable administrative support. The ETG greatly acknowledges all these contributions, as well as useful inputs from participants of ADB’s First Green Business Forum for Asia and the Pacific held on 22-24 November 2016.

ADB Asian Development Bank
ASEAN Association of Southeast Asian Nations
CAC command-and-control
CAGR compound annual growth rate
CDP Carbon Disclosure Project
EBI Environmental Business International, Inc.
EGS environmental goods and services
ESG environment, social, and governance
EU European Union
FTSE Financial Times Stock Exchange
GB greening of businesses
GHG greenhouse gas
GDP gross domestic product
ISO International Organization for Standardization
LCEGS low-carbon and environmental goods and services
LEED Leadership in Energy and Environmental Design
MBI market-based instruments
MNC multinational corporation
NGO non-governmental organization
PPP public-private partnerships
PRC People’s Republic of China
R&D research and development
SDG Sustainable Development Goal
SMEs small and medium-sized enterprises
UK United Kingdom
US United States of America
UN United Nations
UNEP United Nations Environment Programme
USAID United States Agency for International Development
ABBREVIATIONS

EXECUTIVE SUMMARY
I. Introduction
Developing Asia is facing serious threats to human health, environmental quality, and natural resources from the pursuit of economic growth. The region is experiencing loss and degradation of natural capital, increasing damage to ecosystems, worsening air and water quality, and the looming threat of climate change.
Governments alone cannot decouple the link between growth and resource use and pollution. The urgency of environmental degradation has led to calls for the private sector to provide the technology and capital needed to mitigate these impacts. Globally, businesses are increasingly embedding sustainability at the heart of their strategies while continuing to deliver shareholder value.
The imperative for green businesses in Asia and the Pacific is growing. In many Asian countries, governments are introducing policies, regulations, initiatives and other solutions to mainstream sustainable approaches to consumption and production. However, there are still many challenges to scale up these measures in the region.
The paper discusses the opportunities and challenges for green businesses in the region, as well as the market motivations and regulatory and non-regulatory mechanisms for promoting green businesses. It also discusses the implications of greening businesses for companies’ financial and environmental bottom lines.
II. Conceptual Framework
Green businesses can be classified into two types: (i) environmental goods and services (EGS), such as renewable energy, resource-efficient technologies, and pollution abatement technologies: and (ii) greening of businesses (GB), which involves private sector firms taking active steps to change their products and/or processes to promote environmental sustainability.
There are a number of drivers for green business growth. For EGS, consumer consciousness can drive demand for green products as well as catalyze improvement of companies’ production processes. Regulatory pressures in the form of command-and-control (CAC) regulations or market-based instruments (MBIs) can indirectly generate markets for EGS by raising demand, creating incentives, and mobilizing investments for green technologies. Beyond economic instruments, availability of green finance and private sector investments in research and development (R&D) and scale-up of green technologies are crucial for establishing and growing EGS firms, particularly those in nascent industries as they compete with mature conventional industries. For GB more generally, growth is driven by two strategies to gain competitive advantage in the marketplace. First, cost reduction can motivate businesses to implement efficiency-enhancing practices that can also prevent pollution upstream. Second, product differentiation allows firms to appeal to environmentally conscious consumers and to segment the market.
In addition, factors that can affect green business development include: (i) firms’ resources and organizational capabilities, which can determine how it can develop and sustain their competitive

Executive Summary xi
advantage as a green business; (ii) firms’ size and ability to operate in more competitive markets, which can determine costs of production, access to external financing, and ability to identify cost-effective and efficient strategies to be more environmentally responsible; (iii) firms’ ownership structure, which can determine the level of regulatory and non-regulatory pressures and access to financing to green their operations; and (iv) firms’ top leadership support, which can set directions for corporate environmental sustainability strategy.
III. Green Business Trends in Asia
The global environmental market is growing rapidly. Asia is growing faster than other regions, both in terms of actual value and as a share of global trade, and the environmental services and resources sectors dominate the market.1 The region has also seen swiftly expanding green revenues and exports and deployment of climate change mitigation technologies.2 With strong South-South trade flows in renewable energy, developing countries can access green technologies appropriate for their social and economic context.3 To add further momentum, Asian countries such as the People's Republic of China (PRC) and the Republic of Korea are setting up emissions trading systems, while Asian companies are also making commitments to internalize the price of carbon in their investment decisions.
There is also a growing trend among firms to become more environmentally responsible with the adoption of environmental management systems and approaches for pollution prevention and resource use efficiency, as well as participation in programs to reduce environmental the impact of their production processes. Many companies are seeking green certification and participating in green business networks with established codes of conduct and responsible environmental management practices.
There is significant scope for green businesses to transform Asian economies from being largely fossil fuel-based to renewable energy-based as demand for electricity increases. Robust regulatory and institutional frameworks, as well as a broad mix of CAC regulations and MBIs, are needed to stimulate R&D in environmentally friendly technologies, mobilize capital, and enable development of local industries. Reducing water pollution and proper management of wastewater are also promising opportunities for green business.
While green businesses are growing and there is potential for further growth, the private sector needs to do more to meet global sustainability targets. Furthermore, Asian participation in green initiatives is limited to large firms that are export-oriented, foreign-owned or part of multinational corporations’ (MNCs) supply chains, when domestic small and medium enterprises (SMEs) outside of MNC supply chains may make a substantial impact on environmental performance in aggregate.
IV. Market-Based Motivations for Green Business
Final consumers can encourage greening of businesses by rewarding environmentally responsible firms through market demand, preferences for green goods and services, and willingness to pay premium prices for environmentally responsible products. Likewise, firms are motivated to green their 1 Environmental Business International. 2016. Global Environmental Market Datapack by Region 1996-2020 (accessed 14 November 2016).2 FTSE Russell. 2018. FTSE Asia Pacific Green Revenues Index.; S. Fankhauser, A. Kazaglis, and S. Srivastav. 2017. Green growth opportunities
for Asia. ADB Economics Working Paper Series. No. 508. Manila: Asian Development Bank. https://www.adb.org/publications/green-growth-opportunities-asia.; and M. S. Ho and Z. Wang. 2014. Green Growth for China: A literature review. RFF Discussion Paper. 14-22. Washington, DC: Resources for the Future.
3 United Nations Environment Programme. 2014. South-South trade in renewable energy: A trade flow analysis of selected environmental goods. Geneva: United Nations Environment Programme.

xii Executive Summary
production processes and products to appeal to such consumers, gain market share, and avoid negative publicity and lobbying for more stringent regulations by environmental consumer groups. Demand for environmentally friendly products is expected to increase in the future as younger generations mature, alongside increasing market share for green businesses in the future. These transactions, however, are hampered by asymmetric information about the environmental attributes of products and the environmental impact of enterprises.
This is leading to a rise in eco-labeling and certification to provide third-party credibility to products and firms, which, in turn, can be effective in building market share for green businesses. Governments need to develop standards and national labeling programs, which are based on established environmental benefits and with robust verification schemes, transparent standard-setting processes, and scientific validation. Mandatory labeling has been shown to increase awareness about labels and their attributes more than voluntary labeling, which may influence consumer preferences in the long run.4 However, even with growing demand for certified green goods, SMEs are limited in their technical, financial, and organizational capacity to assess their suppliers and their production system, as well as to transform their products and processes into more environmentally sound ones to obtain an eco-label. Providing technical assistance and financial support for these enterprises to obtain a credible label of environmental quality for their products and grow their market size can help channel the incentives provided by green consumers to greening SMEs in developing countries.
Supply chain pressures can also drive green business development. Market demand for environmental goods, services, and technologies from downstream buyers or businesses is also expected to grow. This is leading to the rise of MNCs who self-regulate and implement strict global environmental standards instead of adopting weaker standards of the host country, therefore promoting greener business practices in developing countries while still improving profits.5 Pressure on MNCs from environmental interest groups, non-governmental organization (NGOs), and domestic regulations in their home countries, as well as from downstream consumers in developed countries, are persuading MNCs to green their supply chains. This has led many upstream businesses located in Asia to adopt environmental management systems and make process and product modifications to reduce their environmental impacts. One indicator of this is the rising share of ISO certificates issued to companies in Asia, particularly in the PRC. Demand for products that are produced in an environmentally responsible manner is also emanating from export markets and leading export-oriented firms located in Asia to seek certification and eco-labeling for their products as an international trade strategy.
However, relying on green supply chain pressures to spur green business development has its challenges, including high compliance and implementation costs (especially for domestic firms in developing countries), quality and effectiveness concerns of third-party certification programs, and dependence on whether the product is covered by an effectively enforced international environmental agreement or a free trade agreement. This suggests that much global economic activity with major environmental impacts may not be affected by green supply chain pressures, and developed country governments or consumers can apply limited pressures on upstream firms to address environmental problems. In addition, many SMEs, which predominantly contribute to economic activity in developing Asia, have shown limited response to green supply chain pressures, as they lack resources and capacity and are less likely to see its immediate benefits due to serving markets that are less concerned about environmental
4 B. E. Roe, M. F. Teisl, and C. R. Deans. 2014. The economics of voluntary versus mandatory labels. Annual Review of Resource Economics, 6(1). pp. 407-427.
5 G. Dowell, S. Hart, and B. Yeung. 2000. Do corporate global environmental standards create or destroy market value? Management science. 46(8). pp. 1059-1074.

Executive Summary xiii
issues. Governments can play an active role in encouraging green supply chain management, such as through public procurement policies that incentivize domestic SMEs to adopt greener practices.
Capital markets can spur greening of businesses through two mechanisms. First, capital markets can reward green businesses relying on traditional sources of capital through lower financing costs. By following responsible environmental management practices, green businesses are less at risk of liabilities, boycotts, and negative publicity that can hurt market value. Empirical evidence shows that capital markets do react to information disclosure about environmental performance of firms in the United States (US), and firms with poor environmental performance experience lower stocks market returns and lower market value.6 Firms that are socially responsible have higher credit ratings and are likely to raise capital with greater ease.7 Second, capital markets can develop new green financial instruments—such as green bonds, green credit, and green insurance—to encourage financial investments in projects that protect the environment and enable innovation and investment in green technologies. Long-term financing is key to set up environmental good industries that are often in their infancy, with market benefits that may take many years to materialize as these they compete with mature conventional industries. While only a small percentage of Asian financial institutions factor environmental, social, and governance factors into their lending or investment decisions, green and sustainable investments by financial institutions in the region has been growing steadily. A hindrance to green finance in the region is insufficient disclosure requirements that address environmental or long-term systemic risk factors. By establishing uniform standards for labeling bonds as “green” and developing capacity in the financial industry for environmental risk analysis, green finance can be used more effectively as an enabler of green business development.
Markets for environmental services were developed to internalize damages caused to ecosystem services, such payments for ecosystem services schemes, direct offsets, and banking mechanisms.
• Under this type, sustainable tourism is one approach to conserve natural assets while providing financial benefits for local communities. Ecotourism is one potential area for green business growth in Asia, since the region is rich in natural capital and biodiversity. Rising incomes and preferences for nature-based tourism in foreign locations are increasing the demand for ecotourism in developing countries. Ecotourism can generate funds for conservation of natural resources, economic development, foreign exchange inflows, and local employment. The experience in realizing these environmental and economic benefits of ecotourism, however, has so far been mixed. Key factors for the success of this industry include proper management of ecotourism sites, codes of conduct for tourists, finding alternative locations and sources of income for communities displaced by ecotourism, and empowering local people and businesses to benefit from ecotourism.
• Wetland mitigation banking is another innovative approach, which involves preservation, enhancement, restoration, or creation of a wetland, stream, or habitat conservation area, while offsetting or compensating for expected adverse impacts to similar nearby ecosystems. This model has seen considerable growth in the US, though there is uncertainty about its ecological and economic benefits. Its effectiveness depends on clarity of responsibility over the wetland, the readiness of remedial and contingency plans in case of a bank failure, and the setting of long-term commitments to bank establishment and protection by appropriate parties.
6 M. Khanna, W. R. H. Quimio, and D. Bojilova. 1998. Toxics release information: A policy tool for environmental protection. Journal of environmental economics and management. 36(3). pp. 243-266.; and S. Konar and M. A. Cohen. 2001. Does the market value environmental performance? Review of economics and statistics. 83(2). pp. 281-289.
7 P. Jiraporn et al. 2014. Does corporate social responsibility (CSR) improve credit ratings? Evidence from geographic identification. Financial Management. 43(3). pp. 505-531.

xiv Executive Summary
• Biodiversity markets are another mechanism for businesses to internalize biodiversity impacts through payments for biodiversity management and restoration. Three broad types of drivers of biodiversity markets are: (i) regulatory compliance, where the government sets a limit on allowable impact and lets the market determine the cost of offsetting above the limit; (ii) government mediated payments, where governments create demand for biodiversity for private sector supply or purchase biodiversity services; and (iii) voluntary provisioning, where one can engage in philanthropic or stewardship activities such as donating for biodiversity conservation or purchasing biodiversity friendly products. For biodiversity markets to be successful, it is crucial to develop best management practices, guidelines, and methodologies for assessments and in order to provide certainty about government policies. Implementing offset programs in developing countries can engage diverse stakeholders while increasing ecological knowledge and technical capacity. Businesses can also get involved in financing conservation and advocacy on improving environmental legislation.
V. Regulatory Pressures to Induce Green Business
Experience from developed countries suggests that a principal driver for greening businesses is regulations and policy incentives. Environmental laws and regulations that are enforced and implemented have demonstrated to be a major factor in regulating pollution and inducing a switch to renewables and other less polluting inputs. Policy approaches such as renewable energy standards, tax credits, and low-cost financing led to growth in renewable energy use in developed countries. Additionally, regulations have also been used as a “carrot and stick” strategy to encourage environmental self-regulation by firms. The threat of stringent regulation, and the potential to preempt them by exercising responsible environmental management, is leading firms in developed countries to go beyond compliance. By providing regulatory relief for such efforts, as well as technical assistance and public recognition, companies are increasingly adopting environmental management systems, pollution prevention techniques, and other clean technologies.
In contrast, developing countries have laws on the books that are often not enforced, so compliance rates are low. Moreover, regulatory capture also allows violators to stay in business. This also limits the potential to implement international environmental laws which are enforceable only by nations. Environmental policy tends to be separate from the economic planning process, and there is a disconnect among economic instruments implemented to achieve growth, eliminate poverty, and protect the environment. That circumstance often results in conflicting impacts across these three objectives. Regulations also tend to be of the CAC type, which limit incentives for using least-cost methods for pollution abatement and for inducing innovation in green technologies. Performance-based standards and MBIs are expected to be more effective. In the specific context of policies to promote greater private sector investment in renewable energy and reduce inefficient energy consumption in Asia, there is a need for incentives like feed-in-tariffs or enforceable mandates for increasing the share of renewable energy in total electricity consumed and for reducing distorting fossil fuel subsidies.8
VI. Non-Regulatory Pressures to Induce Green Business
Effective and independent engagement of domestic civil society has become an increasingly relevant
8 A. K. Shukla, K. Sudhakar, and P. Baredar. 2017. Renewable energy resources in South Asian countries: challenges, policy and recommendations. Resource-Efficient Technologies. 3(3). pp. 342-346.

Executive Summary xv
way to impose non-regulatory pressures on businesses. Pressures from civil society are critical for driving effective environmental governance. Environmental NGOs, which can organize and generate public pressure through information dissemination and media campaigns, in developed countries are forcing many MNCs and other firms with global supply chains to take action to improve their environmental performance. In turn, firms encourage NGOs to develop industry-wide codes of conduct for environmentally sustainable operations.
Civil pressure for environmental regulations and improved performance by businesses in Asia is emanating largely from developed countries rather than from domestic NGOs. While this external pressure is effective in inducing greater environmental and social responsibility in some areas in developing countries, particularly those of relevance to the operations of global firms, it is less effective in targeting efforts toward environmental problems that are local and less visible to consumers, policy makers, and NGOs in developed countries. Moreover, external pressures are also less likely to be effective on environmental problems caused by SMEs that are not vertically integrated with global firms or do not rely substantially on export markets. Locally focused civic pressures are crucial to induce more widespread greening, particularly by SMEs. At the same time, NGOs can provide technical assistance to SMEs to help green their operations.
In addition, pressures on companies can come from citizens and communities, who can collectively react to and influence business activities. Public disclosure programs also encourage companies to become more compliant and improve their environmental performance to avoid negative publicity.
VII. Innovation to Promote Green Business Development
Developing green businesses that can compete with conventional ones requires innovation to develop new technologies that use fewer polluting inputs, increase resource use efficiency, and lower their costs. In Asia, the shift toward cleaner and more resource-efficient technologies can take place in three ways: (i) frontier innovations, or new technologies adopted in the research phase of the development cycle; (ii) adaptive innovations that incorporate modifications to existing technologies in order to make them more useful in alternative situations; and (iii) absorptive innovations reflecting changes in the institutional environment to enable transfer and implementation of frontier and adaptive innovations.9 With the exception of the PRC as one of the top ten leading countries in green patents, there are relatively few frontier green innovations produced in developing countries. Nonetheless, there is considerable scope for catch-up green innovation through adoption and adaptation of existing green technologies and indigenous technology development for bottom-of-the-pyramid populations.
Accelerating the pace of green technology innovation and transfer requires environmental regulations that induce a demand for these technologies, such as an R&D policy incentive to innovate in the environmental sector and an environmental policy to internalize the pollution externality. Enforcing technology policies that protect intellectual property rights and reduce the risks for innovators and financiers is also critical to scale up investments in innovation. Learning from experiences in both developed and developing countries, increasing direct government funding for R&D will facilitate the development, adoption, and diffusion of green technologies relevant to developing country contexts. Innovation can also be induced by curbing policy distortions imposing restrictions on free trade in clean technologies or removing subsidies on fossil fuels and other polluting inputs and products.
9 N. Hultman et al. 2012. Green Growth Innovation: New Pathways for International Cooperation. Washington, DC and Seoul: Brookings Institution and Global Green Growth Institute.

xvi Executive Summary
VIII. Performance Outcomes of Greening Businesses
Many studies have found that, in general, the effect of corporate social performance on corporate financial performance appears to be none to mildly positive.10 However, the size of the effect is small, indicating that financial performance alone may be an unlikely rationale or justification for pursuing corporate social performance, since other investments might lead to higher returns. There is some evidence to suggest that corporate environmental performance has a significant and positive effect on return on assets in developing compared to developed countries (with better short-term corporate financial performance in Central and South Asia), where investors could expect more growth opportunities in the future.11
There is also empirical evidence indicating that stringent but flexible environmental regulations induce innovation and over time can increase competitiveness at the country level.12 Studies show that voluntary efforts at greening businesses, such as participation in certification programs, were more effective when emissions could be transparently tracked, there were credible regulatory pressures, and firms had set concrete targets for reducing emissions. Mandatory reporting and public disclosure are likely to be more effective in engaging stakeholders in monitoring progress and regulating firms’ performance, though monitoring and enforcement infrastructure is needed to enable credible disclosure.
IX. Conclusions
There is significant opportunity for green businesses in Asia, as the global environmental market expands in the coming years. With Japan and the PRC in the lead, many other Asian countries are growing production of EGS. Investments in renewable energy are expanding, while there is potential for other sectors such as nature-based tourism. The rise of MNCs with upstream suppliers in Asia, as well as regulatory and consumer pressures, are driving businesses to green their supply chains and adopt environmental management systems and certifications. There is also growing demand for goods and services produced using environmentally responsible methods.
Many challenges stand in the way of developing green businesses to their full potential. Enforcement of environmental regulations is weak, with high rates of non-compliance. There is a lack of incentives for pollution abatement and R&D and investments in green technologies. Many Asian countries still rely predominantly on fossil fuels and lack access to clean energy alternatives. Past experiences implementing nature-based business models such as ecotourism have seen mixed results.
Scaling up green business development will require: (i) strengthening policy and regulatory frameworks with the right incentives to improve firms’ environmental performance and produce green goods and services; (ii) increased public and private sector investments in green supply chains, technologies, and other innovation solutions; and (iii) maintaining non-regulatory pressures on companies to be more environmentally responsible and to disclose information on their environmental performance.
Identifying the full impact of increased production of environmental goods on specific indicators of environmental quality in Asia is challenging. The markets for many of the goods may be outside the region or diffused across different sectors. Moreover, the environmental benefits of green businesses
10 J. D. Margolis, H. A. Elfenbein, and J. P. Walsh. 2009. Does it Pay to Be Good...And Does it Matter? A Meta-Analysis of the Relationship between Corporate Social and Financial Performance. SSRN. 1 March. https://papers.ssrn.com/sol3/papers.cfm?abstract_id=1866371
11 S. Manrique and C. P. Martí-Ballester. 2017. Analyzing the effect of corporate environmental performance on corporate financial performance in developed and developing countries. Sustainability. 9(11). pp. 1-30.
12 M. A. Cohen and A. Tubb. 2018. The impact of environmental regulation on firm and country competitiveness: A meta-analysis of the porter hypothesis. Journal of the Association of Environmental and Resource Economists. 5(2). pp. 371-399.

Executive Summary xvii
may in many cases be observed with a time lag; for example, investing in renewable energy takes time to displace existing use of fossil energy and make an observable difference to air quality or carbon emissions. Additionally, firms may focus on greening different aspects of their businesses, depending on supply chain requirements or the level of visibility of a particular pollution problem, making it difficult to quantify effects. In general, information on environmental performance is typically not available publicly over a long period of time to enable tracking and comparison. Reporting of environmental compliance and performance information by all firms, green or otherwise, to the public could help assess the extent to which green businesses in Asia are improving environmental performance.

1
I. INTRODUCTION
Developing countries face growing threats to human health, environmental quality, and natural resources from growing populations, rising income levels, and the pursuit of economic growth using resource-intensive technologies. This is particularly critical in Asian countries that have experienced rapid economic growth accompanied by increasing use of fossil fuels, worsening environmental quality, and a rising contribution to global greenhouse gas (GHG) emissions.
Loss and degradation of Asia’s natural capital, or the stock of a country’s natural ecosystems and resources like forests, water and agricultural farmland, is occurring at a large scale.1 Globally, there has been a 60% decline in biodiversity in the region in the past 40 years, and it is estimated that 13% to 42% of species could be lost by 2100.2 Only less than one quarter of global land surface is free from human impacts, and transformation and degradation are causing many negative impacts on biodiversity and ecosystem functions. In particular, wetlands are among the most degraded ecosystems, with 87% of wetland area lost in the last 300 years and 54% lost since 1900. It is projected that over 90% of global land surface will be exposed to substantial human impact by 2050, and Asia is forecasted to be one of the major world regions to experience the most degradation and transformation.3 Developing Asia is also experiencing decline of its freshwater and marine resources. Data suggests that a significant amount of wastewater is discharged into waterways without undergoing treatment globally, particularly in upper middle income (62%), lower middle income (72%), and low income (92%) countries, where poor and vulnerable populations are directly exposed without proper sanitation infrastructure and services.4 Furthermore, about eight to 12 million tons of plastics enter the oceans each year. Ten rivers transport 88-95% of the global load of plastics into the sea over long distances from upper catchments into the sea, with eight of these rivers in Asia.5 Thirty-three percent of fish stocks are currently overfished; if trends continue, it is projected that there may be a global collapse of exploitable stocks for fishing by 2048.6
The region also suffers from worsening air quality. The United Nations Environment Programme (UNEP) estimates that 92% of the population in Asia and the Pacific are exposed to levels of air pollution that pose a significant risk to their health, with World Health Organization data showing that four of the five most polluted global cities are in Asia.7 The global economic burden from air pollution is estimated
1 ADB. 2017. Opportunities for Investing in Sustainable Natural Capital in Asia Pacific. Consultant’s report. Manila (TA 8564-REG). https://www.adb.org/projects/documents/reg-44141-012-tacr.
2 World Wide Fund for Nature (WWF). 2018. Living Planet Report 2018: Aiming Higher. Gland: WWF International. https://wwf.panda.org/knowledge_hub/all_publications/living_planet_report_2018/.; and Organisation for Economic Co-operation and Development (OECD). 2014. Towards green growth in Southeast Asia. Paris, France: OECD Publishing. https://doi.org/10.1787/9789264224100-en.
3 L. Montanarella, R. Scholes, and A. Brainich, eds. 2018. The IPBES Assessment Report on Land Degradation and Restoration. Bonn, Germany: Secretariat of the Intergovernmental Science-Policy Platform on Biodiversity and Ecosystem Services. https://ipbes.net/assessment-reports/ldr.
4 T. Sato et al. 2013. Global, regional, and country level need for data on wastewater generation, treatment, and use. Agricultural Water Management. 130 (2013). pp. 1-13.; and United Nations World Water Assessment Programme. 2017. The United Nations World Water Development Report 2017 - Wastewater: The Untapped Resource. Paris: United Nations Educational, Scientific, and Cultural Organization. https://unesdoc.unesco.org/ark:/48223/pf0000247153.
5 C. Schmidt, T. Krauth, and S. Wagner. 2017. Export of plastic debris by rivers into the sea. Environmental science & technology, 51(21), pp.12246-12253.
6 FAO, 2016. The State of World Fisheries and Aquaculture 2018: Meeting the Sustainable Development Goals. Food and Agriculture Organization of the United Nations, Rome, Italy.; and B. Worm et al. 2006. Impacts of Biodiversity Loss on Ocean Ecosystem Services. Science. 314 (5800). pp. 787-790.
7 United Nations Environment Programme (UNEP). 2018. Air Pollution in Asia and the Pacific: Science-Based Solutions.Nairobi: United Nations Environment Programme. http://www.ccacoalition.org/en/resources/air-pollution-asia-and-pacific-science-based-solutions.; and World Health Organization (WHO). 2018. WHO Global Ambient Air Quality Database (update 2018) (accessed 2 November 2018).

2 ADB Sustainable Development Working Paper Series No. 72
at $5 trillion in welfare losses.8 In relation, Asia’s developing countries are among those most vulnerable to the impacts of climate change, which is estimated to be most adverse in Southeast Asia, impacting up to 11% of gross domestic product (GDP).9
Decision makers in the region are recognizing that environmental sustainability cannot be compromised for economic growth. However, governments alone cannot decouple the link between growth and resource use and pollution. The threat posed by environmental degradation to economic resilience, growth, and financial stability in Asia is leading to calls for greening the financial system and business sector to mobilize the investment required to mitigate this threat. Unlike the early view that the sole responsibility of a firm was to increase profits for its shareholders, society now increasingly demands proactive environmental and socially responsible behavior from the private sector.10 The private sector is critical to achieving green growth, not only because of its large environmental footprint but also because of the technologies, resources, knowledge, and capacity it can contribute to sustainable development.
In developed countries, a strong framework of environmental laws and regulations, the threat of liabilities, and the demands of a civil society for preserving environmental quality have led companies to consider the environmental impacts of their business decisions. Many are even going beyond compliance with already stringent regulations by embedding sustainability at the heart of their business strategies. These firms are supporting environmental responsibility and stewardship while delivering shareholder value.
There is growing interest in emulating this experience of green business development in developing countries. In many Asian countries, governments are introducing policies, regulations, initiatives, and other innovative solutions and technologies to mainstream sustainable approaches to consumption and production. However, developing countries still face many challenges and have limited resources to scale up these measures.
This report addresses several key issues related to the green business development in Asia. • What is the state of green business and what factors are motivating or hindering green business
development in the region? • What is the role for governments, financial institutions, and markets in greening businesses? • Are the drivers for inducing innovation in green technologies present in Asia? • Given the large wealth of natural capital in the region, what is the potential for developing
business strategies that conserve these resources through nature-based tourism and biodiversity markets?
• How effective have green business strategies been in improving environmental and business performance?
The report is organized as follows. Section II explains the definition of green business and provides a conceptual framework for the drivers of green business. It also describes the regulatory and market-based incentives for greening businesses.
8 World Bank. 2016. The Cost of Air Pollution: Strengthening the Economic Case for Action. Washington, DC: World Bank. http://documents.worldbank.org/curated/en/781521473177013155/The-cost-of-air-pollution-strengthening-the-economic-case-for-action.
9 D. Raitzer et al. 2015. Southeast Asia and the Economics of Global Climate Stabilization. Manila: Asian Development Bank. https://www.adb.org/publications/southeast-asia-economics-global-climate-stabilization.
10 M. Friedman. 1970. The social responsibility of business is to increase its profits. The New York Times Magazine. 13 September.

Growing Green Business Investments in Asia and the Pacific 3
Section III describes some trends in green business growth in developing countries and globally, with a specific focus on Asia. Using data on market size, sales, exports, investment and patents it shows recent trends and projections for green businesses in the region and compares these to other regions. It also discusses some of the opportunities and challenges for Asian countries to develop green businesses.
Sections IV to VI describe the portfolio of demand-side drivers of green businesses, and the similarities and differences between those that stimulate development of EGS and greening of businesses. In particular, Section IV describes the market-based drivers of green businesses and the role that consumers and business-to-business supply chains can play to enable green businesses and the provision of green goods and services. It discusses the opportunities and challenges in developing markets for ecosystem services, such as eco-tourism, wetland mitigation banking, and biodiversity offsets that enable conservation of resources through payments by the users of these services. This section also looks into how financial institutions, including investors, insurers and banks, can support green business. Finally, it assesses the current availability of green finance, and the barriers that need to be overcome to make it an effective mechanism for inducing green business development. Section V tackles environmental regulations and incentives, including CAC regulations and MBIs, and the need to strengthen the regulatory framework in Asian developing countries. Section VI describes the non-regulatory pressures that motivate green businesses, which arise from environmental interest groups that establish codes of conduct and civil regulations to incentivize adoption of environmentally responsible practices. It elaborates on the mechanisms through which these non-regulatory pressures operate, and their differential impact on large global firms and on small and medium-sized enterprises (SMEs).
Section VII addresses the supply-side drivers for technological innovation and research and development (R&D) in promoting green businesses. It provides an overview of the types of green innovation and the role of policy in inducing it, including the role for technology policy and environmental regulations in promoting innovation. Section VIII discusses the profitability of green businesses and whether it “pays to be good,” as well as the effects of greening businesses on their environmental performance. It discusses the mechanisms by which green businesses can improve their financial and environmental performance, and the mixed empirical evidence to support this claim. Section IX offers conclusions and summarizes the key findings of the report.
II. CONCEPTUAL FRAMEWORK
A. What is Green Business?
Green business can be defined as “any profit-oriented activity that supports environmentally sustainable growth.”11 This includes both producing environmentally friendly products, inputs and technologies that others (consumers and businesses) can use to reduce their environmental footprint and reducing the environmental impact of production activities. In countries where environmental regulations are weak, poorly enforced and easily compromised by corruption, mere compliance can be a green business strategy. Where environmental compliance is the norm, a green business proactively
11 D. Ponzi. 2019. The Business of Greening: Policy Measures for Green Business Development in Asia. ADB Sustainable Development Working Paper Series. No. 59. Manila: Asian Development Bank. https://www.adb.org/publications/policy-measures-green-business-asia; and D. Ponzi and J. Bowyer. 2017. Making Green Business Work. Development.Asia. December. https://development.asia/explainer/making-green-business-work.

4 ADB Sustainable Development Working Paper Series No. 72
transforms its production processes and products to be environmentally responsible. Within this definition, this report offers two categories: (i) environmental goods and services (EGS); and (ii) greening of businesses (GB).
EGS are intermediate goods and services that protect the environment, and EGS firms sell environmentally friendly consumer goods directly to the final consumers. This consists of private sector activities that “produce goods and services to measure, prevent, limit, minimize, or correct environmental damage to water, air and soil, as well as problems related to waste, noise and ecosystems.” This includes technologies, products and services that reduce environmental risk, as well as minimize pollution and resource degradation.12 Examples include companies producing renewable energy technologies, abatement technologies, monitoring instruments, inputs that are less polluting, and energy- or water-efficient appliances. These firms contribute to protecting the environment through innovation and the supply of green alternatives to conventional goods; this in turn encourages environmentally friendly production and consumption behavior by other downstream producers and consumers. Growth and technological innovation in this sector can increase the available choices of green final products and technologies and make these competitive, thereby facilitating their diffusion and widespread adoption by other companies and by consumers.
GB, on the other hand, entails companies adopting production processes and products to reduce the environmental impact and risks associated with their own operations. These firms make efforts to internalize their environmental impact through modifications to products, processes, and management systems. GB can be expected to consider the life-cycle environmental impact of products when designing them and modifying processes and operations throughout their supply chain. They can also adopt environmentally friendly management practices like environmental management standards and green supply chains), purchase abatement technologies from EGS, and/or modify their production processes to prevent, recycle or reuse pollutants. GB can mean firms obtaining third-party certifications or eco-labels for the environmental friendliness of their production practices or goods and services. These enterprises may also contribute to environmental protection in their communities by investing in projects that improve health, sanitation, and environmental quality.
A firm may belong to either one or both of these categories or to neither of them, as shown in Figure 1. GB encompass the broader subset of firms that adopt green practices, but may be producing green or conventional products, whereas EGS are a subset of green businesses that produce only “green” goods. EGS are a catalyst for GB since their inputs, technologies, and products provide the means to green other businesses.
12 OECD and Statistical Office of the European Union (Eurostat). 1999. The Environmental Goods and Services Industry: Manual for Data Collection and Analysis. Paris: OECD Publishing. https://www.oecd-ilibrary.org/industry-and-services/the-environmental-goods-and-services-industry_9789264173651-en.

Growing Green Business Investments in Asia and the Pacific 5
Figure 1. Types of Green Businesses
Source: D. Ponzi. 2019. The Business of Greening: Policy Measures for Green Business Development in Asia. ADB Sustainable Development Working Paper Series. No. 59. Manila: Asian Development Bank.; and D. Ponzi and J. Bowyer. 2017. Making Green Business Work. Development.Asia. December. https://development.asia/explainer/making-green-business-work.
Business-as-usual Enterprise
Producing goods and services using business-as-usual
production practices
Green businesses can include large corporations to SMEs. To encourage green business development, governments can set policies and regulations as well as offer subsidies or tax incentives. Capital providers and financial intermediaries can also provide businesses access to financial products to catalyze green investments.13
B. Drivers of Green Businesses
What drives green business growth? Altruism, personal environmental values, moral responsibility, environmental leadership and reputation, and attitudes of managers can lead firms to become green business. However, such efforts need to be in the self-interest of firms to be adopted widely and be sustainable in the long run.14 Thus, it is reasonable to expect that the underlying motivation for greening for both EGS and GB, assuming they are rational profit-maximizing enterprises, is improving their own net benefits relative to being a business-as-usual enterprise (producing conventional goods using conventional practices). We now discuss the major factors that make it in a firm’s self-interest to become green. Some of the drivers of these net benefits are very similar for EGS and GB, like demand from green consumers and investors, but there are some underlying differences as well, as shown in Figure 2.
13 D. Ponzi, J. Bowyer, and P. Tregidgo. 2018. Green Finance, Explained. Development.Asia. April. https://development.asia/explainer/green-finance-explained.
14 D. Ervin et al. 2012. Motivations and Barriers to Corporate Environmental Management. Business Strategy and the Environment. 22. pp. 390-409.
Environmental Goods and Services
Supplying green goods, inputs and technologies using green productions and management
practices
Greening of BusinessesProducing other goods
using green production and management practices

6 ADB Sustainable Development Working Paper Series No. 72
Figure 2. A Conceptual Framework for the Drivers of Green Businesses
EGS firms supply green goods to external customers that include other businesses that purchase intermediate inputs and equipment (abatement and monitoring technologies, and consulting services) or final consumers. Demand for green intermediate products is a derived demand from other green businesses, which depends on factors that motivate other businesses to use green inputs and technologies instead of conventional ones, such as regulatory and non-regulatory pressures. Demand from final consumers will depend on consumer preferences, level of environmental consciousness, and willingness to buy green goods at a premium price.
Other stakeholders also play a role in generating demand for EGS by other greening businesses by affecting the reputation and markets for firms and inducing them to modify their production processes by using technologies and inputs produced by EGS firms. These stakeholders include environmental interest groups, which monitor and track firms’ supply chains and environmental performance and can rapidly disseminate information to millions of consumers through traditional and social media. The risk of adverse publicity can be a strong deterrent to firms, pressure them to become environmentally responsible themselves, and demand they get suppliers that are greening their businesses. Pressure from international organizations—such as the United Nations (UN) or the International Organization for Standardization (ISO)—on downstream firms can also urge them to switch to green technologies produced by EGS firms. The greening of businesses can likewise create demand for abatement technologies, monitoring equipment, resource efficient technologies, consulting services, environmental auditing and certification services. More firms greening their businesses is a catalyst for EGS development.
Although final consumers, downstream businesses, and regulatory pressures create demand for EGS, these demands may not be sufficient to induce investment in establishing and growing EGS firms for various reasons, such as the absence of economies of scale due to a small size of the market, uncertainties about demand which is often dependent on government policies, and the need for advanced technologies that are not competitive. Initial high production costs and uncertain market
Environmental Goods and
Services
Greening of Businesses
Supplying to others/greening itself
Downstream demand
Source: Asian Development Bank.
Technological Innovation
Green Finance
Final Consumer Demand
Civic pressures: NGOs, citizens
Environmental laws and regulations: fiscal policies
Market pressures consumers, supply chains
Internal characteristics: size, ownership
Technological Innovation

Growing Green Business Investments in Asia and the Pacific 7
returns can lower returns on investment and make risks higher in this sector, particularly when impacts on natural capital and the environment are not monetized.
In contrast to EGS, GB often entails producing conventional products but do so using inputs, technologies, and management practices that consider their environmental impacts and seek to manage those impacts responsibly or to prevent them. These firms may either be using the products of EGS as inputs in their production process, modifying their products using technologies produced by EGS or developing innovative processes, technologies, and management systems in-house that are tailored to their own business operations. Unlike EGS, the incentives for GB include a desire to reduce the internal costs of environmental regulations and the risks of environmental liabilities, thereby reducing the external cost of raising capital or appealing to downstream customers preferring green supply chains upstream, as shown in Figure 2. GB is driven by two generic strategies to gain a competitive advantage in the market place: cost reduction and product differentiation.15 Pollution generated by firms can be viewed as a waste by-product of the production process that reflects inefficient utilization of purchased inputs and can be costly to abate after it has been generated. Efficiency-enhancing practices can lead to input cost savings and prevent pollution upstream, thereby reducing compliance costs and pollution abatement and disposal costs. The environmental performance of a firm can also influence its cost of raising capital by making it riskier and more susceptible to liabilities, negative publicity, fines, and penalties in the eyes of investors. Product differentiation allows firms to appeal to environmentally conscious consumers and to segment the market. The extent to which these factors stimulate green business development depends on the strength of regulatory pressures, non-regulatory lobbying by environmental interest groups and non-governmental organizations (NGOs), pressures from product and capital markets as consumers and investors seek less environmentally risky products, and the threat of liabilities and negative publicity.16
Regulatory pressures in the form of command-and-control regulations (CAC) or market-based instruments (MBIs)—such as taxes and tradable permit programs—can indirectly generate markets for EGS by creating incentives for downstream firms to modify their production technologies, production processes and products, and to invest in technologies, inputs and equipment produced by EGS. While both CAC regulations and MBIs can help increase demand from regulated firms for goods and services produced by EGS, CAC regulations will raise demand for a narrow range of technology solutions, primarily for abatement at the end-of-the-pipe, that are mandated by the regulations. On the other hand, MBIs are likely to augment demand for a variety of environmentally friendly technologies that can reduce pollution both at the end-of-the-pipe as well as upstream by preventing pollution. Appropriately designed MBIs can also spur investment in R&D of green technologies to lower the cost of producing green goods and increase demand for them.17 Moreover, MBIs that level the playing field between conventional and green goods by taxing the former and subsidizing the latter also create demand for EGS.
Two primary supply-side drivers induce the establishment of green businesses: (a) availability of green finance for investment in these businesses; and (b) innovation to provide technologies for producing green goods, increasing their effectiveness and lowering their cost. Public and private investment in R&D, financing, and scaling up of green technologies is crucial to establish EGS firms,
15 M. E. Porter and C. Van der Linde. 1995. Toward a new conception of the environment-competitiveness relationship. Journal of economic perspectives. 9(4). pp. 97-118.
16 D. H. Earnhart, M. Khanna, and T. P. Lyon. 2014. Corporate environmental strategies in emerging economies. Review of Environmental Economics and Policy. 8(2). pp. 164-185.
17 R. N. Stavins. 1998. What can we learn from the grand policy experiment? Lessons from SO2 allowance trading. Journal of Economic perspectives. 12(3). pp. 69-88.

8 ADB Sustainable Development Working Paper Series No. 72
since these are often infant industries with market benefits that may take many years to materialize as they compete with mature conventional good industries.
Additionally, the resource-based view argues that a firm’s resources and organizational capabilities—such as physical capital, human capital, technology and corporate culture—affect the choices it makes and its potential to gain and sustain competitive advantage by being a green business. As more firms become green, the competitive advantage from it can dissipate while the costs of further greening increase as the initial low-hanging fruit opportunities are exhausted. Firms that generate strategies for greening that are not easily imitable by rivals are more likely to sustain their competitive advantage in the long run. Such strategies may arise due to a firm’s unique location, or the human capital skills embodied in its employees, or its organizational culture; these strategies are often not easy to link to competitive advantage and thus difficult to replicate.18
More generally, firms that are larger, operate in more competitive markets, and have top leadership support internally are more likely to pursue green strategies. Size affects cost of production by generating economies of scale, increases access to financing, and the availability of human and capital resources. Technologies to manage pollution or prevent it upstream, as well as the adoption of environmental management systems and participation in certification schemes such as ISO 14001, often involve large fixed costs. External financing is usually more easily accessible to larger firms, allowing them to take advantage of profitable opportunities to improve environmental performance. Firms employing innovative approaches and with more technical knowledge about their production processes are more likely to identify lower cost strategies to be more environmentally responsible. Greater firm size also enables efficiency through division of labor and specialization. While larger firms are more visible and hence more easily targeted by environmentalists and regulators, they can deflect negative publicity by becoming more environmentally responsible.
Furthermore, a firm’s ownership structure can also affect its environmental strategy. Foreign-owned firms and multinational corporations (MNCs) may face more regulatory pressures to improve their environmental performance compared domestic companies, depending on policymakers’ relative interest in attracting foreign direct investment versus protecting domestic businesses. Foreign firms may also have better access to external financing, state-of-the-art technologies, and cutting-edge practices that can enhance its environmental sustainability. However, MNCs face a tradeoff when operating in emerging economies. Although they have less external pressure than at their home base, they have incentives to implement a common environmental management protocol across facilities operating in different countries. They are also exposed to more scrutiny by environmental NGOs and the threat of boycotts by consumers for their environmental and social performance. State-owned enterprises face mixed incentives to be environmentally responsible. They are not driven by the goal of seeking competitive advantage and profits, and they face soft budget constraints that can encourage inefficiency and increase pollution. However, state-owned enterprises have access to low-cost capital, which facilitates investment in efficient new technologies. As a result, they may be showcased by their governments, leading to better environmental performance compared to privately owned firms. Lastly, the support of top leadership is also an important determinant of corporate environmental strategy, as it can help build a culture of shared organizational learning. This is invaluable when building new capacities in pollution prevention or product stewardship, as well as for changing environmental management practices.
18 J. Barney. 1991. Firm resources and sustained competitive advantage. Journal of management. 17(1). pp. 99-120.

Growing Green Business Investments in Asia and the Pacific 9
III. GREEN BUSINESS TRENDS IN ASIA
Several studies have estimated the trends in EGS firms and their potential for growth. These studies have used differing definitions of EGS. The Environmental Business International, Inc. (EBI) defines EGS as those provided by 14 business sectors that are grouped into three main areas (services, equipment, and resources) which are somewhat overlapping.19 The Financial Times Stock Exchange (FTSE) has created Environmental Markets and Green Revenues Classification Systems which provide frameworks for defining, measuring, and modelling the performance of global environmental markets and the industrial transition to a green economy, respectively. The Environmental Markets Classification System covers companies across seven sectors, including renewable and alternative energy, energy efficiency, water infrastructure and technologies, pollution control, waste management and technologies, environmental support services, and food, agriculture, and forestry. The Green Revenues Classification System spans eight sectors from energy generation, equipment, management, and efficiency, environmental infrastructure, environmental resources, modal shift, and operational shift.20 The United Kingdom (UK) Department for Business, Innovation and Skills has classified low-carbon and environmental goods and services (LCEGS) into three broad categories: environmental goods, renewable energy, and low-carbon goods and services.21
A. Trends in Markets for Environmental Goods
The global environmental market grew from $809.2 billion in 2006 to $1,106.9 billion in 2015, a 36.8% increase (Figure 3).22 The market is projected to grow by roughly 20.5% to $1,333.4 billion by 2020. Asia is expanding faster than other regions, both in terms of actual value and as a share of global trade. On a compound annual growth rate (CAGR) basis, the region is expected to expand at 3.7% per year from 2016 to 2020, while the rest of world will likely do so at 2.5% per year during the same period. Although markets in Europe and the United States (US) presently contribute more in monetary terms to the global environmental market, Asia has become a major contributor to that market with every passing year.
19 Environmental Business International. 2016. Global Environmental Market Datapack by Region 1996-2020. Environmental Business International.
20 FTSE Russell. 2018. FTSE Environmental Markets Classification System. https://research.ftserussell.com/products/downloads/env-mkts-class-sys.pdf.; and FTSE Russell. 2017. Green Revenues Classification System. https://research.ftserussell.com/products/downloads/FTSE_Green_Revenues_Classification_System.pdf?_ga=2.7790386.1852278791.1600013630-1294479492.1600013630.
21 UK Department for Business, Innovation, and Skills. 2013. “Low carbon and environmental goods and services: 2011 to 2012.” Gov.uk. July. Accessed October 20, 2018. https://www.gov.uk/government/publications/low-carbon-and-environmental-goods-and-services-2011-to-2012.
22 Economist Intelligence Unit. Achieving Green Growth in the Asia Pacific Region. Unpublished.

10 ADB Sustainable Development Working Paper Series No. 72
Figure 3. Global Environmental Market (by Region)
Within Asia, Japan and the People’s Republic of China (PRC) are the largest contributors to the market for environmental goods and services (Figure 4). In 2015, Japan accounted for 39.3% or $109.3 billion of the $278.5 billion Asian market, while the PRC represented 22.2% or $61.7 billion. On a CAGR basis, the PRC and the Association of Southeast Asian Nations (ASEAN) bloc of countries emerged as leaders: the PRC’s environmental market grew at 7.4% per year between 2011 and 2015 and is expected to expand at 5.9% per year between 2016 and 2020. The ASEAN countries grew at 5.3% per year between 2011 and 2015 and are expected to expand at 5.2% per year from 2016 to 2020. The other Asia-Pacific countries—including Australia, Japan, New Zealand, and the Republic of Korea—do not perform as well on a CGAR basis (footnote 19).
USA Europe Asia and the Pacific Others1,400
1,200
1,000
800
600
400
200
02006 2007 2008 2009 2010 2011 2012 2013 2014 2015 2016F 2017F 2018F 2019F 2020F
Source: Environmental Business International Inc. 2015.
CAGRs Global USA Europe Asia and the Pacific
2006–2010
2011–2015
2006–2020F
2.72%
2.78%
3.00%
2.40%
2.66%
2.71%
1.71%
1.44%
1.77%
3.43%
3.63%
3.66%
($ billion)

Growing Green Business Investments in Asia and the Pacific 11
Figure 4. Environmental Markets in the Asia and the Pacific region
Within the EBI segments described above, environmental services and resources dominate the market. In 2015, the market for environmental services was valued at $451.8 billion (40.8%) and environmental resources at $428.4 billion (38.7%), while the environmental equipment sector is relatively small at $226.6 billion (20.5%). The environmental resources sector is projected to grow faster than the other sectors and by 2020 is expected to reach $555.3 billion, followed by environmental services at $500.3 billion and equipment sector at $277.7 billion. The share of resources grew from 29% to 42% between 2006 and 2016, services declined from 49% to 38%. and equipment stayed almost unchanged, declining marginally from 22% to 21% (footnote 19).
Solid waste management and hazardous waste management now have the largest share among sectors, but it is slowly falling and expected to decline from 69% in 2006 to 66% by 2020. The share of consulting and engineering, on the other hand, is projected to increase from 13% to 16% during the same period. Within the equipment sector, the relative share of various sub-sectors does not change significantly during this period. Water equipment and chemical sector and air pollution control sector are the largest and are set to contribute 74% in 2020 up from 70% in 2015. They are followed by waste management sector, which will fall from 22% to 19%. The highest growth is in the clean energy systems and power sector, whose share is expected to grow from 20% to 49% in the environmental resources sector. In value terms it is expected to expand more than six-fold from $43.6 billion approximately to $272 billion between 2015 and 2020.
The FTSE Green Revenue Index for Asia shows that the proportion of green revenues is growing. The number of companies generating this revenue has been increasing each year and the absolute value of green revenue is also increasing; all of these indicators suggest a growing shift to a low-carbon economy. Green revenues in the region expanded by 8.7% per year from 2013 to 2017 and marginally faster than all revenues for Asia (Figure 5). This rate of growth was higher than that for all emerging economies (5.7%), but lower than that for developed countries (11.3%) over the same period.
Japan Australia and New Zealand
Southeast Asia (except Viet Nam)
People's Republic of China
Republic of Korea
Rest of the region
400
350
300
250
200
150
100
50
0
2010 2011 2012 2013 2014 2015 2016F 2017F 2018F 2019F 2020F
Source: Environmental Business International Inc. 2015.
($ billion)

12 ADB Sustainable Development Working Paper Series No. 72
Figure 5. FTSE Asia Pacific Green Revenues Index
Source: FTSE Russell. 2018. FTSE Asia Pacific Green Revenues Index.
Fankhauser et al. analyzed data on sales, exports and patents from the LCEGS dataset compiled by the UK Department for Business, Innovation and Skills, finding that Asia had the largest value of green sales in absolute terms and per unit of GDP, compared with other continents in 2011-2012 (Figure 6).23 Among Asian countries, the PRC was the largest exporter with a 20% share. Estimates indicate that investment in renewable energy globally has grown five-fold since 2005, and growth rates and level of investment in developing countries—including Brazil, India, and the PRC—have increased more rapidly than in developed countries. Asian countries also accounted for a higher share (44%) of global exports of climate change mitigation technologies and filed more high-value patents for these technologies than Europe and Latin America. Furthermore, Asian countries, especially Japan, the PRC, and the Republic of Korea, have substantial comparative advantage in the design and export of key climate change mitigation technologies like energy storage, photovoltaics, and efficient lighting. These countries are also strong innovators in areas such as biofuels and clean transport.
23 S. Fankhauser, A. Kazaglis, and S. Srivastav. 2017. Green growth opportunities for Asia. ADB Economics Working Paper Series. No. 508. Manila: Asian Development Bank. https://www.adb.org/publications/green-growth-opportunities-asia.
5-Year Performance - Total Return
160
150
140
130
120
110
100
90Feb-2013 Feb-2014 Feb-2015 Feb-2016 Feb-2017 Feb-2018
FTSE Asia Pacific Green Revenues FTSE Asia Pacific

Growing Green Business Investments in Asia and the Pacific 13
Figure 6. Low-Carbon Environmental Goods and Services Sales across Regions
Source: S. Fankhauser, A. Kazaglis, and S. Srivastav. 2017. Green growth opportunities for Asia. ADB Economics Working Paper Series. No. 508. Manila: Asian Development Bank. https://www.adb.org/publications/green-growth-opportunities-asia.
In addition to the high level of exports of climate change mitigation technologies, Asian countries have made major investments to deploy these technologies domestically. The PRC has achieved the world’s largest wind power capacity and plans to triple its solar power capacity by 2020.24 The government has committed to ensuring renewable energy accounts for 20% of the energy mix and to reducing carbon intensity by 17% by 2030.25 India has also shown significant potential for incremental innovation by adapting existing technologies like wind power and smart grids to local needs, while the Philippines exhibits a comparative advantage in efficient lighting. Figure 7 shows that new investments in renewable power and fuels has been growing faster in developing countries.26
24 M. S. Ho and Z. Wang. 2014. Green Growth for China: A literature review. RFF Discussion Paper. 14-22. Washington, DC: Resources for the Future.
25 E. Albert and B. Xu. 2016. China’s Environmental Crisis. Council on Foreign Relations. 18 January. https://www.cfr.org/backgrounder/chinas-environmental-crisis.
26 REN21. 2019. Renewables 2019 Global Status Report. Paris: REN21 Secretariat. https://www.ren21.net/reports/global-status-report/.

14 ADB Sustainable Development Working Paper Series No. 72
Figure 7. Global Investment in Renewable Power and Fuel Capacity in Developed, Emerging and Developing Countries, 2009-2019 (US$ billion)
Source: REN21. 2020. Renewables 2020 Global Status Report. Paris: REN21 Secretariat. https://www.ren21.net/gsr-2020/.; and BloombergNEF.
There is strong South-South trade flow in several renewable energy products and their components, including solar photovoltaic cells and modules, wind turbines, hydroelectric turbines, biomass feedstock, solar water heaters, and solar lighting equipment. Between 2004 to 2011, South-South trade in the renewable energy sectors grew slightly faster (29.4 %) than global trade (excluding intra-European Union trade) in the same sectors (26.7%).27 There is also growing South-South trade in water filtering and purification equipment, as well as in environmentally preferable products such as organic agricultural goods. This has enabled developing countries to access technologies appropriate for their social and economic context.
Many firms are also making commitments to improve their environmental performance. Following the passage of the Paris Agreement under the United Nations Framework Convention on Climate Change, many MNCs committed to GHG reduction targets, and began to use carbon pricing internally when making investment decisions. The total number of companies internalizing the price of carbon had almost doubled (from 54 to 105) in the PRC from 2015 to 2017. To add further momentum, the Republic of Korea established the first national Emissions Trading System in Asia, while the PRC is setting up its own carbon Emissions Trading Scheme. A growing share of global financial institutions monitor the climate and environmental risks of their transactions and account explicitly for such risks in their credit assessments. Other evidence indicates that over 1,750 investors, from over 50 countries and representing approximately $70 trillion in assets, have agreed voluntarily to incorporate six key principles
27 United Nations Environment Programme. 2014. South-South trade in renewable energy: A trade flow analysis of selected environmental goods. Geneva: United Nations Environment Programme.
1%increasefrom 2018
to 2019
People's Republic of China and India
Other developing and emerging countries
Developed countries
350
300
250
200
150
100
50
0 1735
.394
.0
2443
.614
5.1
26.7
51.4
186.
5
33.9
61.6
144.
5
26.1
66.4
119.
3
32.4
91.1 14
1.7
39.6
126.
913
3.9
29.0
116.
013
5.0
39.7
156.
311
9.2
50.7
101.9
127.5
59.5
92.7
130.
0
2009 2010 2011 2012 2013 2014 2015 2016 2017 2018 2019
World Total282
147
213
265265
300315
240
212
280 280

Growing Green Business Investments in Asia and the Pacific 15
for responsible environmental, social, and governance goals into their investment analyses and decision-making processes.28
These trends indicate that there has been considerable progress in developing green good industries globally and in Asia. However, much of the focus has been on a few sectors, such as renewable energy, energy efficiency, GHG mitigation, pollution abatement, material recycling, and natural resource conservation. A key concern is therefore whether these sectors will remain as niche green sectors in the economy, or they can catalyze a more widespread greening of businesses throughout the economy.
There is considerable scope to transform Asian countries from a fossil fuel-based economy to a renewable energy-based economy.29 Many countries in the region rely predominantly on fossil fuels; 68% of electricity in India and 72% of electricity in the PRC is from coal, which is a major source of GHG emissions as well as air and water pollution. Coal emissions in Southeast Asia are projected to triple between 2011 and 2030 with the projected increase in the demand for electricity.30 The average electrification rate in South Asia is 74%, which means that more than 400 million people lack access to electricity and only 38% of the population has access to non-solid fuel for cooking. There is also considerable need for technology and capacity to reduce fossil energy use in other end-use sectors such as transport, heating, and cooking. The use of clean, modern cooking fuels has improved only modestly in recent years and is still well below what is needed for a low-carbon economy. Asian economies are only reducing their energy intensity at 1.3% per year, lagging behind the global average rate of 1.7%. Reducing water pollution is another opportunity for green businesses, as is proper management of wastewater by using treated wastewater for irrigation, cooling, or other industrial uses. Southeast Asia’s water treatment sector is worth $20 billion, and this can grow significantly once wastewater treatment expands.31
Challenges to realizing the potential for renewable energy in Asian countries include lack of incentives for private sector involvement, absence of schemes such as feed-in-tariffs and mandates for the share of renewable energy in energy consumed, fossil fuel subsidies, weak environmental regulations, high capital costs, and low payback periods.32 Robust regulatory and institutional frameworks and a broad mix of policies, including market-based incentives and CAC policies, are needed to induce R&D in environmentally friendly technologies, attract foreign capital and technology, and enable development of the local industry. Fankhauser et al. point out that green growth requires an economy-wide transformation, rather than the expansion of the environmental goods and services sector. Industrial processes in major sectors like manufacturing and electricity generation need to become cleaner and more resource-efficient, including their supply chains (footnote 23).
In the greater Asia and the Pacific region, there are growing commitments for leapfrogging to renewable energy. As part of the Barbados Declaration on Achieving Sustainable Energy for All in Small Island Developing States, six Pacific island countries have committed to generating 100% of its electricity
28 Carbon Disclosure Project. 2017. More than eight-fold leap over four years in global companies pricing carbon into business plans. Carbon Disclosure Project. 12 October. https://www.cdp.net/en/articles/media/more-than-eight-fold-leap-over-four-years-in-global-companies-pricing-carbon-into-business-plans; N. Aktas, E. De Bodt, and J. G. Cousin. 2011. Do financial markets care about SRI? Evidence from mergers and acquisitions. Journal of Banking & Finance. 35(7). pp. 1753-1761; and E. B. Barbier. 2015. Policies to promote green economy innovation in East Asia and North America. STI Policy Review. 6(1). pp. 54-69.
29 World Bank. 2015. Asian Countries Are among Top Achievers on Sustainable Energy Progress. World Bank. 18 June. http://www.worldbank.org/en/news/press-release/2015/06/18/asian-countries-are-among-top-achievers-on-sustainable-energy-progress.
30 J. Perry. 2017. Southeast Asia air pollution deaths could triple, report says. CNN. 13 January. https://www.cnn.com/2017/01/12/asia/southeast-asia-pollution-coal-report/index.html.
31 V. Shah. 2017. Managing the water impact of Asia’s industrial boom. Eco-Business. 30 May. http://www.eco-business.com/news/managing-the-water-impact-of-asias-industrial-boom/.
32 A. K. Shukla, K. Sudhakar, and P. Baredar. 2017. Renewable energy resources in South Asian countries: challenges, policy and recommendations. Resource-Efficient Technologies. 3(3). pp. 342-346.

16 ADB Sustainable Development Working Paper Series No. 72
from renewable energy technologies, including Cook Islands, Niue, and Tuvalu by 2020 and Fiji, Solomon Islands, and Vanuatu by 2030. Even with numerous barriers, such as lack of financial resources, poor existing infrastructure, inadequate data and technical capacity, highly controlled energy sectors, and low purchasing power among consumers, governments were able to leverage donor support and regional partnerships and enact sector and economic reforms for technical assistance and investments. Using a regional approach enabled countries to meet donors’ preferences for larger projects and facilitated coordination between governments, development partners, regional institutions, and other stakeholders. Moreover, political will, multi-stakeholder engagement, adaptation to cultural values (and their link to property rights), and an emphasis on capacity development across the energy sector were crucial for building commitment and enabling this transition.33
B. Trends in Greening of Businesses in Asia
There is a growing trend among firms in general to become more environmentally responsible by adopting environmental management systems and techniques to prevent pollution. Firms are also increasingly participating in programs developed by national governments or third-party organizations to lower the environmental impact of their production activities. Many firms are seeking green certification from the ISO, Leadership in Energy and Environmental Design (LEED), and National Building Councils. Companies are also participating in green business networks—such as the World Business Council for Sustainable Development, the World Industrial Council for the Environment, Ceres, and the Global Reporting Initiative—that have established codes of conduct and responsible environmental management practices. Many firms are also voluntarily disclosing their environmental performance information to investors, businesses and policy makers through the Global Carbon Disclosure Project.34
Efforts at protecting environmental resources are going beyond mitigating climate change. The Natural Capital Protocol, launched in 2016 to price other social costs, has led to a growing number of companies putting “shadow prices” on a range of natural capital impacts to inform decisions and stay ahead of regulations.35 More firms are also seeking ISO certifications. The number of ISO 14001 certifications increased almost 25 times globally between 1999 and 2016, from 13,994 to 346,174 (Figure 8). Europe was the leader until Asian countries took over in 2004. In 2016, nearly 60% of ISO 14001 certified facilities were in Asia. The PRC is the indisputable leader in this area, but the number of companies with ISO 14001 certifications is growing in ASEAN countries and India (Figure 9). ASEAN countries and other countries in the region are also supporting green buildings, since these are a major source of carbon emissions. Buildings accounted for 32% of total global final energy use, 19% of energy-related GHG emissions (including electricity-related), and approximately 33% of black carbon emissions in 2010.36 While the US Green Business Council’s LEED certification standards are quite popular, all ASEAN countries and many other countries in Asia have established their own National Green Building Councils to set standards and rating systems for green buildings. There is a growth of green investment in construction projects in Asia, especially in Hong Kong, China. In 2014, six of the ten top countries (excluding the US) with LEED-certified buildings were in Asia.37
33 International Partnership on Mitigation and Measurement, Reporting, and Verification. 2015.100% Renewable Energy Targets in the Pacific Islands. https://www.transparency-partnership.net/system/files/migrated_document_files/2012ongoingrenewableenergy_pacificislands.pdf.
34 Carbon Disclosure Project. https://www.cdp.net/en. 35 J. Makower et al. 2018. 2017 State of Green Business. GreenBiz and Trucost. https://www.greenbiz.com/report/state-green-business-2017. 36 O. Lucon et al. 2014. Buildings. In O. Edenhofer et al, eds. Climate Change 2014: Mitigation of Climate Change. Contribution of Working Group
III to the Fifth Assessment Report of the Intergovernmental Panel on Climate Change. Cambridge, United Kingdom and New York, NY, United States of America: Cambridge University Press.
37 J. Kriss. 2014. U.S. Green Building Council Releases Ranking of Top 10 Countries for LEED Outside the U.S. United States Green Building Council. 1 May. https://www.usgbc.org/articles/us-green-building-council-releases-ranking-top-10-countries-leed-outside-us.
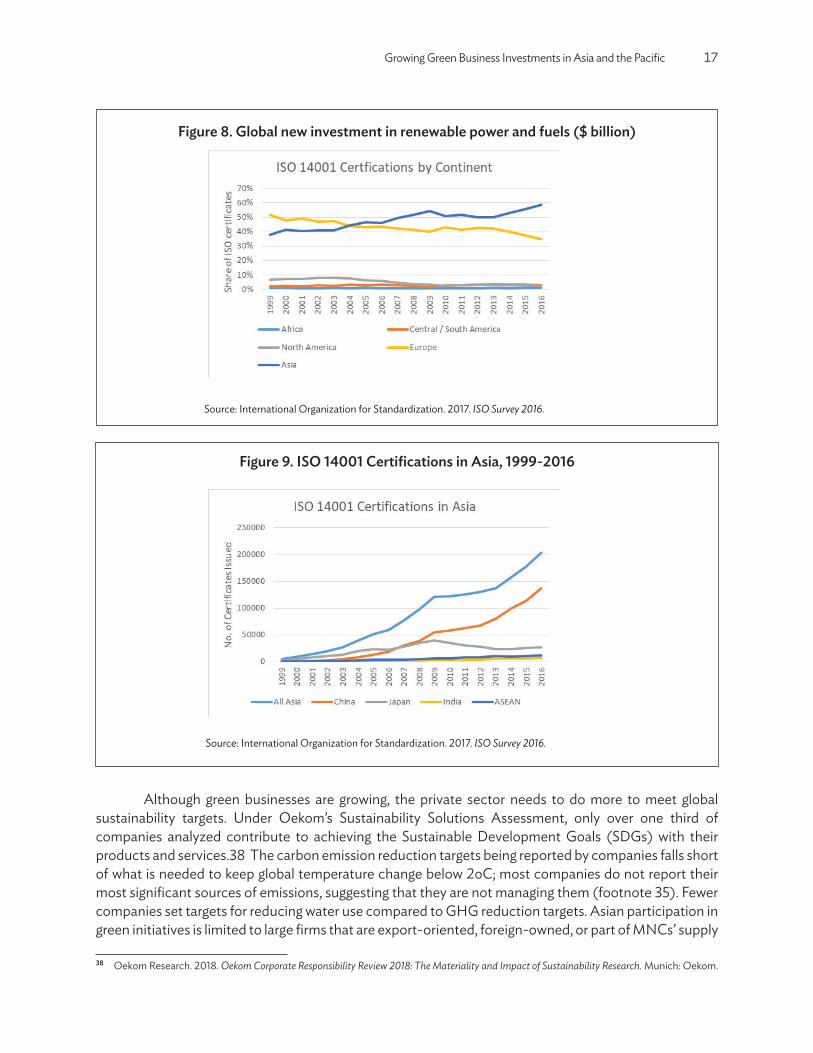
Growing Green Business Investments in Asia and the Pacific 17
Figure 8. Global new investment in renewable power and fuels ($ billion)
Source: International Organization for Standardization. 2017. ISO Survey 2016.
Figure 9. ISO 14001 Certifications in Asia, 1999-2016
Source: International Organization for Standardization. 2017. ISO Survey 2016.
Although green businesses are growing, the private sector needs to do more to meet global sustainability targets. Under Oekom’s Sustainability Solutions Assessment, only over one third of companies analyzed contribute to achieving the Sustainable Development Goals (SDGs) with their products and services.38 The carbon emission reduction targets being reported by companies falls short of what is needed to keep global temperature change below 2oC; most companies do not report their most significant sources of emissions, suggesting that they are not managing them (footnote 35). Fewer companies set targets for reducing water use compared to GHG reduction targets. Asian participation in green initiatives is limited to large firms that are export-oriented, foreign-owned, or part of MNCs’ supply
38 Oekom Research. 2018. Oekom Corporate Responsibility Review 2018: The Materiality and Impact of Sustainability Research. Munich: Oekom.

18 ADB Sustainable Development Working Paper Series No. 72
chains. For environmentally responsible approaches to conducting business to become the dominant approach in the industry, it needs to extend to smaller domestic firms that are outside the supply chain of MNCs. As the majority of the private sector and contributing significantly to regional GDP, greening SMEs may make a substantial impact on environmental performance in aggregate.39
We now discuss the evidence from developed countries on the factors that drive green businesses, examine the presence of these factors in Asia, and look into the challenges and opportunities for greening businesses in the region.
IV. MARKET-BASED MOTIVATIONS FOR GREEN BUSINESS
A. Final Consumers
Environmentally responsible purchasing decisions by final consumers are vital to create demand for EGS. The strategic decision for firms to producing environmental goods for final consumers depends on market demand for their products, and the willingness of customers to pay the price needed to make these enterprises economically sustainable. Non-EGS firms, on the other hand, can be motivated to green their production processes and products not only to appeal to green consumers but also to avoid negative publicity and boycotts by environmental consumer groups. By differentiating products based on their environmental attributes, GB can seek to gain market share, meet demands from the downstream supply chain for environmentally responsible products, and charge premium prices from environmentally conscious consumers. This may be particularly the case for companies operating in a monopolistically competitive market, where product differentiation can reduce competition and allow firms to increase market share and charge higher prices. Companies may also have incentives to self-regulate as a way to preempt consumer groups from lobbying for more stringent abatement regulations, particularly when it is easy and affordable for consumer groups to organize and influence the political process.40
Research on green purchasing behavior has sought to understand the factors that affect purchase behavior, including price and availability of the product and social influences. In addition to consumer preferences—like concerns for the environment and habit, trust in the environmental performance of the product—availability of the product and social norms among peer groups have a strong effect on consumption decisions.41 There is mixed evidence even from developed countries on the extent to which consumers are willing to pay more for green goods. According to marketing surveys in the US in 2010 and 2017, the percentage of consumers willing to pay more has increased only slightly from 53% to 56% over this time. Similarly, the percentage of consumers willing to give up convenience rose only from 46%
39 G. Wignaraja and Y. Jinjarak. 2015. Why Do SMEs Not Borrow More from Banks? Evidence from the People’s Republic of China and Southeast Asia. ADBI Working Paper Series. No. 509. Tokyo: ADBI Institute. https://www.adb.org/publications/why-do-smes-not-borrow-more-banks-evidence-peoples-republic-china-and-southeast-asia-0.; and D. Ponzi. 2019. The Business of Greening: Policy Measures for Green Business Development in Asia. ADB Sustainable Development Working Paper Series. No. 59. Manila: Asian Development Bank. https://www.adb.org/publications/policy-measures-green-business-asia.
40 J. W. Maxwell, T. P. Lyon, and S. C. Hackett. 2000. Self-regulation and social welfare: The political economy of corporate environmentalism. The Journal of Law and Economics. 43(2). pp. 583-618.
41 Y. Joshi and Z. Rahman. 2015. Factors affecting green purchase behaviour and future research directions. International Strategic Management Review. 3(1-2). pp. 128-143.

Growing Green Business Investments in Asia and the Pacific 19
in 2010 to 49% in 2017.42 A 2017 Nielsen report in provides a more optimistic trend in growing demand for sustainable goods, noting that 66% of survey respondents were willing to pay more for these goods compared to 50% in 2013.43 However, demand for environmentally friendly goods can be expected to grow in the future, since research suggests that younger consumers are willing to pay more for such goods; 73% of millennials, up from approximately half in 2014. The under-20 age group of Generation Z is also on board – up from 55% of total respondents in 2014 to 72% in 2015.
Moreover, there is evidence that green businesses can be expected to increase their market share in the future. Sales of consumer goods from brands with a demonstrated commitment to sustainability grew more than 4% globally in one year (from 2014 to 2015), while those without expanded less than 1%. Brands with a reputation for social responsibility and environmental stewardship have the largest opportunity to grow market share.44
A key constraint to the growth in markets for environmental goods is that these are often a “credence good”, since consumers cannot easily validate producers’ claims about their products’ environmental impact. This is unlike claims about “search goods” and “experience goods” that can be verified through pre- or post-purchase information. As a result, there is asymmetric information about green goods, and this can limit demand and can result in brand loyalty, making it harder for new brands and EGS firms to emerge. Eco-labels and certification can inform consumers about the attributes of these products, increase consumer awareness about them, lower their search costs, and allow firms to differentiate their products.
The demand for green goods that are trustworthy has led to exponential growth in the number of eco-labeled products in Europe and the US. More recently, environment related labels targeting consumers in Asia are also growing (such as Japan’s Eco Mark, Republic of Korea’s Eco-Labelling Program, and Singapore’s Green Label and Thailand’s Green Label). Japan, the Republic of Korea, and Thailand are also promoting carbon disclosure through labeling.
Eco-labeling can be effective in building market share for green businesses only if it generates trust in the claims of the ecolabel among consumers and is easy to understand; in many cases this trust is shown to depend on the trustworthiness of the issuer.45 The proliferation of similar labels without a robust verification scheme, a transparent standard-setting process, or scientific validation can confuse consumers, weaken the trust and credibility of the eco-label, and hinder the development of demand for green goods and services.
It is therefore important to harmonize standards for awarding an ecolabel. Governments need to develop standards and national labeling programs that are based on actual, scientifically established environmental benefits. Governments and third-party institutions must guarantee transparency in the markets and encourage the responsible production of environmental goods and services. Certification and eco-labeling can benefit from network effects, as more producers adopting a particular eco-label can increase its familiarity with consumers and reduce the negative effects from the proliferation of
42 MarketingCharts. 2017. Consumer Willingness to Pay A Premium for “Green” Products Climbs, Albeit Slowly. MarketingCharts. 24 April. https://www.marketingcharts.com/industries/cpg-and-fmcg-76738.
43 Nielsen. 2015. The Sustainability Imperative: New Insights on Consumer Expectations. The Nielsen Company. https://www.nielsen.com/content/dam/nielsenglobal/dk/docs/global-sustainability-report-oct-2015.pdf.
44 Nielsen. 2015. Consumer-Goods’ Brands that Demonstrate Commitment to Sustainability Outperform Those that Don’t. The Nielsen Group. 12 October. https://www.nielsen.com/us/en/press-room/2015/consumer-goods-brands-that-demonstrate-commitment-to-sustainability-outperform.html.
45 B. Roe and M. F. Teisl. 2007. Genetically modified food labeling: The impacts of message and messenger on consumer perceptions of labels and products. Food Policy. 32(1). pp. 49-66.

20 ADB Sustainable Development Working Paper Series No. 72
environmental claims. Mandatory labeling has been shown to increase the awareness about the labeled attributes and familiarity with the label more than voluntary labeling, and this is likely to lead to changes in consumer preferences in the long run.46
For firms, conducting an environmental impact analysis and life cycle assessment of impacts can increase production costs. Lack of expertise and financial and organizational capacity to undertake such analysis is a challenge, particularly for SMEs in developing countries. This can limit the potential for SMEs to obtain eco-labels for their products and make eco-labeling an exclusionary and anti-competitive strategy for greening small firms. To the extent that they limit entry by raising the costs of obtaining an eco-label and reduce competition, they can constrain the growth of the green business sector. Technical assistance and financial support for getting products eco-labeled can assist smaller producers in developing countries.
B. Green Supply Chains
Although it is the final consumers that ultimately influence the demand for the products of EGS and for GB, in some cases the demand may operate through circuitous supply chains that link these upstream firms to their downstream buyers that are other businesses. This is particularly the case when downstream firms are global firms or MNCs. The internet and social media have made it easier for consumers, investors, and NGOs to obtain information about a firm’s entire supple chain and raise awareness about environmental impact of corporate production decisions.47 NGOs can publicly target firms causing environmental concerns, damage corporate reputations, and lead to loss of customers and investors.
This external scrutiny, as well as internal management motivations, are leading many MNCs to choose to employ their own strict global environmental standard abroad instead of adopting the weaker national standards of the host country, thereby promoting green practices in developing countries.48 Variations in regulatory systems across countries can be costly for MNCs, leading them to prefer regulatory harmonization across countries. Studies find that many MNCs are self-regulating their environmental conduct, participating in global voluntary initiatives, and proactively adopting internal environmental standards that are more stringent than those mandated by national governments. By adopting high internal environmental standards, MNCs can improve profits by deflecting negative publicity, building employee morale, and creating incentives for the rapid diffusion of new technology throughout its international operations.
Market and regulatory pressures are inducing MNCs to seek environmentally friendly suppliers of intermediate products for their production processes. MNCs are also being urged to pay more attention to the environmental conduct of suppliers located in developing countries where domestic environmental regulations are weak. By imposing pressures on their upstream suppliers, MNCs are motivating firms in developing countries that were otherwise not convinced by domestic regulatory pressures to become environmentally responsible.49 Since they account for a large share of foreign direct investment in
46 B. E. Roe, M. F. Teisl, and C. R. Deans. 2014. The economics of voluntary versus mandatory labels. Annual Review of Resource Economics, 6(1). pp. 407-427.
47 High profile corporate incidents where the media has exposed companies like Coca Cola, whose supposedly ‘green’ bottles were actually harmful to the environment, have prompted companies to take a more active approach to sustainable practices along their supply chains.
48 G. Dowell, S. Hart, and B. Yeung. 2000. Do corporate global environmental standards create or destroy market value? Management science. 46(8). pp. 1059-1074.
49 Q. Zhu, Y. Tian, and J. Sarkis. 2012. Diffusion of selected green supply chain management practices: an assessment of Chinese enterprises. Production Planning & Control. 23(10-11). pp. 837-850.

Growing Green Business Investments in Asia and the Pacific 21
developing countries and are both horizontally and vertically linked with local firms, MNCs’ actions can lead to local greening of businesses. MNC operations in developing countries can also directly create spillovers of knowledge and advanced environmental management practices to domestic firms.
In addition to MNCs, studies show that supply chain pressures from final and intermediate good customers in export markets in developed countries are also inducing domestic firms to seek ISO certification.50 Concerns among export-oriented firms in developing countries with environmental requirements by customers in developed countries could create barriers to trade has created incentives for them to meet the environmental standards of their export markets.
Asia is central to the global supply chain as a major supplier of raw materials, intermediate products, and final products to businesses and consumers located in the US and Europe. Many Asian countries also rely heavily on export markets for their economic growth. There is evidence that adoption of ISO 14001 in the region has also been stimulated by demand from MNCs, particularly those that are larger, more visible and vulnerable to negative publicity for their environmental performance. For example, Xerox and IBM have encouraged Chinese suppliers to comply with ISO 14001, while Ford and General Motors require their Chinese suppliers to be ISO 14001-certified.51 Supply chain pressures were also found to motivate ISO adoption in Thailand among firms that produce intermediate rather than final goods.52 ISO-certified facilities in Japan were found to be 40% more likely to assess their suppliers’ environmental performance and 50% more likely to require their suppliers to undertake specific environmental practices.53
There are, however, several challenges to relying on green supply chain pressures to lead to greening of businesses. Making changes to the supply chain can be expensive and risky. It requires support from senior management, and finding suppliers that are large enough to have the technical and human resources to develop and adopt environmental management systems and comply with the requirements of certification programs. Obtaining ISO certification can incur significant implementation costs, which include training staff, collecting information on past activities and current applicable environmental regulations, and paying consultant and certification fees. These costs are often higher for domestic firms in developing countries compared to costs for MNCs, as domestic firms may have little prior experience or capacity. Studies show that firms that had adopted ISO 9000 were more likely to obtain ISO 14000 certification, since they had accumulated some experience in the certification process and thus their learning costs for certification were likely to be lower.54 Larger firms were also more likely to obtain ISO certification, possibly due to greater economies of scale and availability of human and capital resources, as well as the potential for larger gains by deflecting negative publicity and targeting by environmental groups and regulators.55
50 D. H. Earnhart, M. Khanna, and T. P. Lyon. 2014. Corporate environmental strategies in emerging economies. Review of Environmental Economics and Policy. 8(2). pp. 164-185.
51 Q. Zhu, Y. Tian, and J. Sarkis. 2012. Diffusion of selected green supply chain management practices: an assessment of Chinese enterprises. Production Planning & Control. 23(10-11): pp. 837-850.)
52 K. Tambunlertchai, A. Kontoleon, and M. Khanna. (2013). Assessing participation in voluntary environmental programmes in the developing world: the role of FDI and export orientation on ISO14001 adoption in Thailand. Applied Economics. 45(15). pp. 2039-2048.
53 T. H. Arimura, N. Darnall, & H. Katayama. 2011. Is ISO 14001 a gateway to more advanced voluntary action? The case of green supply chain management. Journal of environmental economics and management. 61(2). pp. 170-182.
54 M. Delmas and I. Montiel. 2009. Greening the supply chain: when is customer pressure effective? Journal of Economics & Management Strategy. 18(1). pp. 171-201; and K. Tambunlertchai, A. Kontoleon, and M. Khanna. 2013. Assessing participation in voluntary environmental programmes in the developing world: the role of FDI and export orientation on ISO14001 adoption in Thailand. Applied Economics. 45(15). pp. 2039-2048.
55 K. Tambunlertchai, A. Kontoleon, and M. Khanna. 2013. Assessing participation in voluntary environmental programmes in the developing world: the role of FDI and export orientation on ISO14001 adoption in Thailand. Applied Economics. 45(15). pp. 2039-2048.

22 ADB Sustainable Development Working Paper Series No. 72
Moreover, the effectiveness of these international certifiable standards for environmental governance depends on whether that certification can credibly reflect the actual implementation of the specified practices. Several studies have raised questions about the quality and independence of auditors and the effectiveness of third-party certification. Findings show that firms that do not meet ISO standards are able to obtain certification in the PRC. Thus, the quality of implementation of ISO standards differs across firms. A study by Christmann and Taylor on ISO-certified firms in the PRC shows that firms strategically selected their level of compliance according to how much their customers value compliance, if customers directly and frequently monitor compliance, and how easily customers can switch suppliers.56 This study cautions against using counts of ISO certifications in a country as a measure of the quality of ISO implementation. Government control of certification centers and the accreditation of registrars that certify and audit firms can also lead to concerns about the credibility and rigor of the certification process. This can reduce environmental certifications to a bureaucratic requirement for export-oriented firm rather than an internally-driven transformation of a firm’s environmental management system.57 Governments can play an important role by ensuring that third-party auditors are operating independently. Since auditors are typically employed by the firms they are auditing, there is a potential for conflict of interest that could lead to weakening of the standards for certification and engender distrust in the certificate program. Governments can also develop approaches to induce and verify compliance with the standards by offering regulatory relief, faster access to permits, or other benefits.
The effectiveness of relying on green supply chains to green upstream businesses in developing countries depends on: (i) national environmental standards; (ii) the existence of or aspiration to free trade agreements with the European Union (EU) and the US; and (iii) whether the product is covered by an effectively enforced international environmental agreement. This implies that a significant portion of global economic activity with major environmental impacts is not likely to be affected by the green supply chain effect. This includes products that are largely consumed domestically or exported to other developing countries with weak environmental standards. As MNCs also account for a relatively small share of production in most developing countries, few products made in developing countries and exported to developed countries have become the focus of considerable public concern. Consumer concerns in developed countries tend to be selective and focused on developing country practices that are often more symbolic—like wildlife protection—than critical, such as urban air quality. Thus, the ability of developed country governments or consumers to impose pressure on MNCs to address the significant environmental quality problems in developing countries is likely to be limited.58
Most economic activity in developing countries occurs through domestic firms that are typically SMEs. A study focusing on the PRC and Southeast Asian countries revealed that SMEs account for 97% of employment in Indonesia, 59% in Malaysia, 61% in the Philippines, 80% in the PRC, 78% in Thailand, and 77% in Viet Nam, while representing more than 50% of output in Indonesia and the PRC and between 40% to 60% in Malaysia, the Philippines, Thailand, and Viet Nam. In Hong Kong, China, 60% of the workforce was employed in SMEs in 1999.59 Since these enterprises primarily serve domestic markets where consumers are less concerned about environmental issues than in international markets,
56 P. Christmann and G. Taylor. 2006. Firm self-regulation through international certifiable standards: Determinants of symbolic versus substantive implementation. Journal of International Business Studies. 37(6). pp.863-878.
57 S. Shin. 2005. The role of the government in voluntary environmental protection schemes: The case of ISO 14001 in China. Issues & Studies. 41(4). pp. 141-173.
58 D. Vogel. 2000. Environmental regulation and economic integration. Journal of International Economic Law. 3(2). pp. 265-279.59 G. Wignaraja and Y. Jinjarak. 2015. Why Do SMEs Not Borrow More from Banks? Evidence from the People’s Republic of China and Southeast
Asia. ADBI Working Paper Series. No. 509. Tokyo: ADBI Institute. https://www.adb.org/publications/why-do-smes-not-borrow-more-banks-evidence-peoples-republic-china-and-southeast-asia-0.; and K. Y. Chan and X. D. Li. 2001. A study of the implementation of ISO 14001 environmental management systems in Hong Kong. Journal of Environmental Planning and Management. 44(5). pp. 589-601.

Growing Green Business Investments in Asia and the Pacific 23
they are less likely to obtain immediate benefits from environmental certification and product standards (footnote 58). Moreover, high costs of implementation, low environmental awareness within the organization (including top management), and lack of resources and trained staff are key barriers to SME implementation of environmentally responsible practices. Many firms operate with very low margins and in hyper-competitive industries; they are focused on surviving in the near term rather than building customers and demand in the future. As a result, many Asian SMEs have shown limited response to green supply chain pressures. In the Republic of Korea, for example, the number of co-certified products is very large and has been growing dramatically in the last two decades, but the number of companies producing such products is much smaller, indicating that it is mainly the larger firms and not the SMEs that are producing green products.60 Another study looking at the electrical manufacturing industry in Thailand noted that a lack of consumer demand for green products explained why many companies did not adopt green supply chain management methods. In addition to this lack of demand, the study also noted that there was a regulatory vacuum, where the legislation outlining best practice was essentially absent. Although different companies adopted different approaches to green supply chain management, the lack of harmonization makes it difficult for best practices to spread across the entire supply chain. As a result, larger companies chose suppliers based solely on quality, cost, and delivery, and not on their environmental impact or regulatory compliance.61
In many developing Asian countries, the government plays an active role in encouraging green supply chain management. Governments can use public procurement policies to have the same effect as MNCs at greening the supply chain, but for domestic SMEs.62 The government can encourage and reward green businesses by developing preferential programs and making the winning of public contracts conditional on environmental performance. For example, local governments in the PRC have started to provide training and to subsidize a part of the ISO certification fee. In 2001, the Japanese government enacted the Green Purchasing Law, which requires all state institutions to buy office-related products like stationery, furniture, and uniforms from companies that are designated green. By 2007, over 95% of all purchased office goods were produced by green businesses.63 The SWITCH.EU Asia Program is an example of how governments can help small firms overcome hurdles necessary for them to green their supply chain. SWITCH aims to promote sustainable processes and service and consumption patterns in Asia by improving relations between Asian suppliers and European organizations. Many of the projects promote environmentally friendly technologies and practices, often through knowledge transfers and diffusion of best practices. For example, its Automotive Sustainable Supply Chain Management program in Thailand has made a measurable impact by promoting green supply chain management practices in the sector; SWITCH helped with knowledge transfer and providing training in best practices to increase resource efficiency.64
Public-private partnerships (PPPs) can also provide training and technical assistance to develop human capital skills. These skills are useful to assess environmental impacts and risks of business operations, conduct life-cycle analysis, identify ways to prevent pollution, carry out energy audits, and build awareness and capacity for adopting environmentally friendly production practices.
60 Organisation for Economic Co-operation and Development. 2015. Environmental Policy Toolkit for Greening SMEs in EU Eastern Partnership countries. 1st ed. Paris: OECD Publishing. https://www.oecd.org/environment/outreach/Greening-SMEs-policy-manual-eng.pdf
61 J. Wallerius and M. Zakrisson. 2010. Green Supply Chain Management in Thailand: An Investigation of the Use in the Electrical and Electronics Industry. Linköping University. http://urn.kb.se/resolve?urn=urn:nbn:se:liu:diva-54382.
62 L. W. Ho, N. M. Dickinson, and G. Y.Chan. 2010. Green procurement in the Asian public sector and the Hong Kong private sector. Natural Resources Forum. 34(1). pp. 24-38.
63 Japan for Sustainability. 2007. The Law on Promoting Green Purchasing Five Years Later -- Progress and Future Tasks. June. https://www.japanfs.org/en/news/archives/news_id027830.html.
64 SWITCH-Asia. 2016. Promoting SCP to the supply chains in the Thai automotive sector. http://www.switch-asia.eu/fileadmin/user_upload/Publications/2014/Impact_sheets/Switch_Asia_Impact_Sheet_-_2016_-_Thai_Automotive.pdf.

24 ADB Sustainable Development Working Paper Series No. 72
C. Capital Markets
Investors, capital markets, and financial institutions induce firms to become more environmentally responsible by distinguishing among them based on the environmental risks they pose. Capital markets can lead to greening of businesses through two mechanisms. First, they can reward green businesses that rely on traditional methods of financing their operations by lowering their cost of capital because these businesses are likely to be less risky. By following responsible environmental management practices, green businesses are less at risk of liabilities, boycotts, and negative publicity that can hurt market value. Second, capital markets provide new financial instruments to establish green businesses by enabling innovation and investment in green technologies. Financing to establish and grow green businesses is often difficult to acquire. Initial high costs of production and uncertain market returns make returns to investment lower and risks higher, particularly when the impacts on the natural capital and the environment are not monetized. Long-term financing is needed to establish EGS firms that are often infant industries with market benefits that may take many years to materialize. We discuss each of these mechanisms through which capital markets can green businesses below.
1. Rewarding Green Businesses through Lower Cost of Capital
Investors that factor in environmental considerations in their lending decisions and view poor environmental performers as financially risky can reward GB by lowering the cost of capital or by buying stock to raise their market value. Demand for stock in green businesses, where investors have green preferences or believe environmentally friendly firms are more likely to be profitable in the future, may encourage firms to self-regulate. Such companies may have lower risks of liabilities, penalties, and high compliance costs in the future and are less likely to receive negative publicity. Investors that value environmental performance and adjust the cost of capital to account for underpriced environmental risks favor greening of business.
A growing share of global financial institutions state that they monitor climate and environmental risks of transactions and account explicitly for these risks in their credit assessments. The number of investors that have committed to divest their holdings from fossil fuels and consider environmental risks in their investment decisions more than doubled between 2010 and 2016 (footnote 35).
Capital markets can also lead to greening of businesses by reacting to information disclosure about environmental performance of firms. There is evidence from the US that stock markets respond to the public disclosure of information about toxic emissions generated by US corporations; firms with unexpectedly large releases suffered a reduction in stock market returns following the disclosure. This is turn led those companies to take action to reduce their on-site discharges.65
A few studies have examined the extent to which capital markets in developing countries responded to environmental news and the environmental rating of firms, with mixed evidence. Dasgupta et al. found that capital markets in Argentina, Chile, Mexico, and the Philippines were responsive to announcements of environmental events, such as superior environmental performance or citizens’ complaints (footnote 12). Gupta and Goldar found that in India, the release of green ratings on stock market returns had a significant negative effect in the pulp and paper industry, a significant positive effect in the automobile industry, and an insignificant effect in the chlor-alkali industry.66
65 M. Khanna, W. R. H. Quimio, and D. Bojilova. 1998. Toxics release information: A policy tool for environmental protection. Journal of environmental economics and management. 36(3). pp. 243-266.
66 S. Gupta and B. Goldar. 2005. Do stock markets penalize environment-unfriendly behaviour? Evidence from India. Ecological economics. 52(1). pp. 81-95.
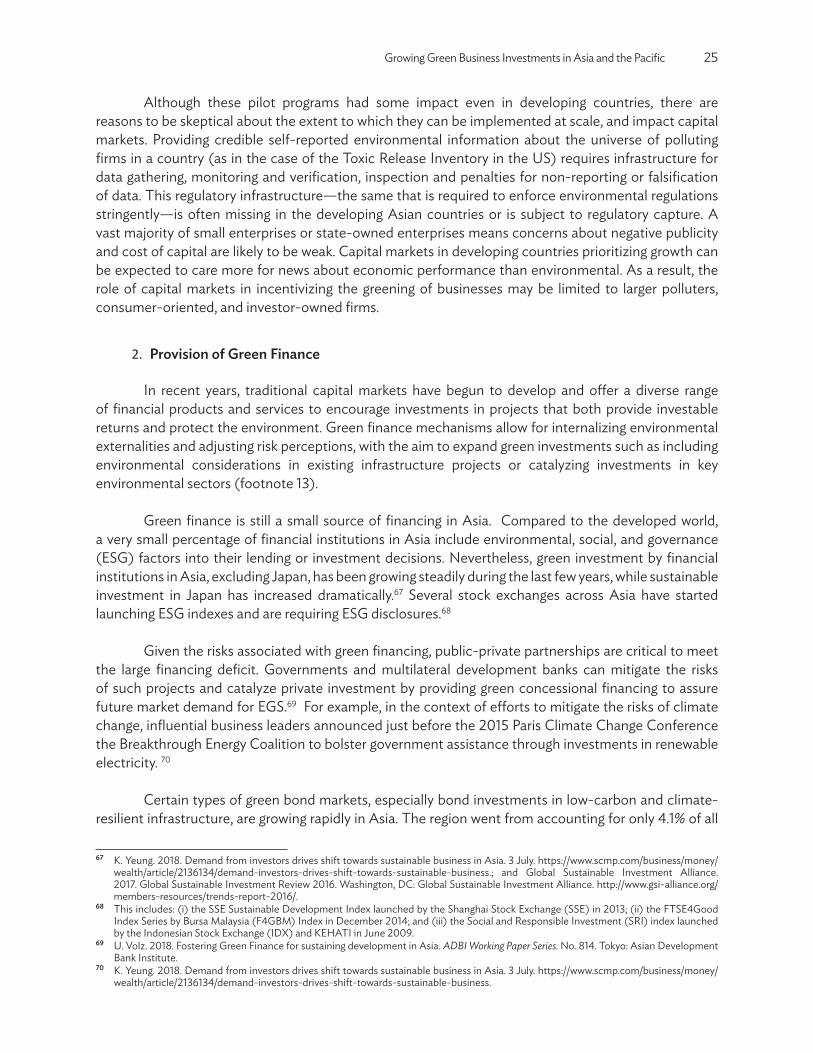
Growing Green Business Investments in Asia and the Pacific 25
Although these pilot programs had some impact even in developing countries, there are reasons to be skeptical about the extent to which they can be implemented at scale, and impact capital markets. Providing credible self-reported environmental information about the universe of polluting firms in a country (as in the case of the Toxic Release Inventory in the US) requires infrastructure for data gathering, monitoring and verification, inspection and penalties for non-reporting or falsification of data. This regulatory infrastructure—the same that is required to enforce environmental regulations stringently—is often missing in the developing Asian countries or is subject to regulatory capture. A vast majority of small enterprises or state-owned enterprises means concerns about negative publicity and cost of capital are likely to be weak. Capital markets in developing countries prioritizing growth can be expected to care more for news about economic performance than environmental. As a result, the role of capital markets in incentivizing the greening of businesses may be limited to larger polluters, consumer-oriented, and investor-owned firms.
2. Provision of Green Finance
In recent years, traditional capital markets have begun to develop and offer a diverse range of financial products and services to encourage investments in projects that both provide investable returns and protect the environment. Green finance mechanisms allow for internalizing environmental externalities and adjusting risk perceptions, with the aim to expand green investments such as including environmental considerations in existing infrastructure projects or catalyzing investments in key environmental sectors (footnote 13). Green finance is still a small source of financing in Asia. Compared to the developed world, a very small percentage of financial institutions in Asia include environmental, social, and governance (ESG) factors into their lending or investment decisions. Nevertheless, green investment by financial institutions in Asia, excluding Japan, has been growing steadily during the last few years, while sustainable investment in Japan has increased dramatically.67 Several stock exchanges across Asia have started launching ESG indexes and are requiring ESG disclosures.68
Given the risks associated with green financing, public-private partnerships are critical to meet the large financing deficit. Governments and multilateral development banks can mitigate the risks of such projects and catalyze private investment by providing green concessional financing to assure future market demand for EGS.69 For example, in the context of efforts to mitigate the risks of climate change, influential business leaders announced just before the 2015 Paris Climate Change Conference the Breakthrough Energy Coalition to bolster government assistance through investments in renewable electricity. 70
Certain types of green bond markets, especially bond investments in low-carbon and climate-resilient infrastructure, are growing rapidly in Asia. The region went from accounting for only 4.1% of all
67 K. Yeung. 2018. Demand from investors drives shift towards sustainable business in Asia. 3 July. https://www.scmp.com/business/money/wealth/article/2136134/demand-investors-drives-shift-towards-sustainable-business.; and Global Sustainable Investment Alliance. 2017. Global Sustainable Investment Review 2016. Washington, DC: Global Sustainable Investment Alliance. http://www.gsi-alliance.org/members-resources/trends-report-2016/.
68 This includes: (i) the SSE Sustainable Development Index launched by the Shanghai Stock Exchange (SSE) in 2013; (ii) the FTSE4Good Index Series by Bursa Malaysia (F4GBM) Index in December 2014; and (iii) the Social and Responsible Investment (SRI) index launched by the Indonesian Stock Exchange (IDX) and KEHATI in June 2009.
69 U. Volz. 2018. Fostering Green Finance for sustaining development in Asia. ADBI Working Paper Series. No. 814. Tokyo: Asian Development Bank Institute.
70 K. Yeung. 2018. Demand from investors drives shift towards sustainable business in Asia. 3 July. https://www.scmp.com/business/money/wealth/article/2136134/demand-investors-drives-shift-towards-sustainable-business.
26 ADB Sustainable Development Working Paper Series No. 72
global climate-aligned bonds outstanding in 2012 and to rising up to 42.2% in 2017. This growth has been driven largely by the rapid growth of the Chinese green bond market over the last two years. Asian green bonds have been mainly supported by government agencies, public development banks, and international financial institutions. Since 2014 there have also some examples of corporate green bonds starting in Taipei,China and expanding to other countries in Asia. Global green bond issuance hit a record $155 billion in 2017 and was 78% higher than in 2016; the US, the PRC, and France accounted for 56% of the total issuance in 2017.71
There is a new, rapidly growing product called catastrophe bond or “cat bond” that pays out in the event of a natural disaster used. It is used so far mainly in the US to mitigate storm-related risk. Singapore entered the cat bond market for insurance-linked securities in January 2018.72 In the insurance sector, weather and climate insurance products are available across Asian countries, but the number of uninsured households is still large. For instance, in South Asia, only 5.7% of people working in agriculture were insured against climate-related risks in 2011.73 While the Agricultural Insurance Company of India provides subsidies for agricultural insurance products, the country and the region need more innovative insurance products such as index-based insurance programs for farmers or flood risk insurance.74 Stock exchanges have started issuing guidelines for green bonds to open up bond markets to institutional investors such as pension funds and insurance companies, which have their own benchmarks for green investing. These guidelines also make it easier for corporate entities to issue green bonds.
While green bond markets are growing as a source of long-term finance, Asian financial systems are still dominated by banking. In many Asian economies, the concept of green banking is rather new, and only a few countries have introduced green lending frameworks. The majority of banks in the region have little or no experience in environmental risk analysis and no definition of what constitutes sustainable lending. Overall, green lending makes up a small share of total commercial lending and is sold at a premium compared to conventional finance.
However, an increasing number of countries in the region are developing sustainable development and green financial guidelines and regulations, which will likely lead to an increase in green lending (footnote 69). There is increasing interest by investors to incorporate environmental criteria into their decision-making process, reaching $30.7 trillion at the start of 2018.75 Institutional investors include mutual funds, insurance companies, pension funds, and sovereign wealth funds. Sustainable investment assets in Asia (except Japan) have been increasing at an annual rate of 22% since 2011, with the most commonly adopted sustainable investment strategy being ESG integration.76
Another hindrance to sustainable development in Asia is insufficient disclosure requirements addressing environmental or long-term systemic risk factors. For example, even though there is a strong business rationale for improved ESG performance of palm oil, timber, and pulp and paper companies in Indonesia, Malaysia, and Singapore, these firms provide insufficient disclosures for investors to adequately assess their management of ESG issues.77
71 N. Chestney. 2018. Global green bond issuance hit record $155.5 billion in 2017 -data. Thomson Reuters. 10 January. https://www.reuters.com/article/greenbonds-issuance/global-green-bond-issuance-hit-record-155-5-billion-in-2017-data-idUSL8N1P5335.
72 O. Ralph. 2017. Singapore seeks to muscle in on market for catastrophe bonds. Financial Times. 1 November. 73 GIZ. 2015. Climate Risk Insurance for Strengthening Climate Resilience of Poor People in Vulnerable Countries: A Background Paper on Challenges,
Ambitions and Perspectives. Bonn and Eschborn: Deutsche Gesellschaft für Internationale Zusammenarbeit.74 K. U. Schanz and S. Wang. 2015. Insuring flood risk in Asia’s high-growth markets. Zurich: The Geneva Association.75 Global Sustainable Investment Alliance. 2019. Global Sustainable Investment Review 2018. Washington, DC: Global Sustainable Investment
Alliance. http://www.gsi-alliance.org/trends-report-2018/. 76 Association for Sustainable & Responsible Investment in Asia (ASrIA). 2014. 2014 Asia Sustainable Investment Review. https://igcc.org.au/
wp-content/uploads/2017/02/2014-Asia-Sustainable-Investment-Review-Dec-2014.pdf. 77 World Wide Fund for Nature. 2015. Sustainable Finance in Singapore, Indonesia and Malaysia: A review of financiers’ ESG practices, disclosure
standards and regulations (Sustainable Finance Report 2015). Gland, Switzerland: WWF International.

Growing Green Business Investments in Asia and the Pacific 27
Other barriers to green investment include gaps in the enforcement of environmental regulation and in pricing of negative environmental externalities such as carbon emissions. Additionally, price distortions from fossil fuel subsidies limit the profitability of green investments.78 Inconsistent policies for renewable energy investments and complicated approval procedures further discourage investment in renewable energy projects. There is also a lack of awareness of the threats posed by environmental degradation and climate change to the financial sustainability of industry. Furthermore, lack of trained staff to assess environmental and climate risk at financial institutions and a shortage of bankable projects constrain green investment.
In addition to removing these barriers, several other steps can to taken to increase demand for green investment and green lending. These can range from using MBIs to interventionist policies, depending on the specific country context. A crucial step is rating and labeling green bonds, which can open up demand for green bonds. Establishing uniform labeling standards and indices for rating green bonds would make these bonds benchmark-eligible securities for institutional investors.79 Additionally, enhancing transparency through comprehensive and verifiable ESG disclosure requirements will build investor and lender trust. A fundamental cultural change in financial markets will also be required to include sustainability considerations in all financing and investment decisions. This in turn will require developing a new approach to these decisions and including all relevant stakeholders in the decision-making process.
Financial incentives to green bond investors and banks making green loans can encourage green investments which may have greater risk or longer payoff periods than regular investments. For example, ADB offers partial credit guarantees to lending banks to share the risk of payment from green projects by the borrower. Similarly, the United States Agency for International Development (USAID) Development Credit Authority has extended bond guarantees to support Asian municipalities in raising funds for building resilient urban infrastructure. Developing long-term, local currency refinancing sources for banks to extend long-term credit can help at least partially offset the traditional focus on short-term investments in Asia.
While financial incentives and new approaches to financial governance may work in some countries, experience from different countries suggests that, often, only rules and regulations motivate financial firms to act. These could include government policies such as priority sector lending programs and quotas for priority areas.
ADB has been participating in green finance through issue of green bonds and partial credit guarantees to lending banks to share the risk of payment from green projects by the borrower. ADB can play a more impactful role by addressing some of the constraints described above: (i) supporting development of uniform norms for defining green projects and standards for rating and labeling green bonds; (ii) building capacity building programs to train banks how to evaluate for environmental risk analysis and management through knowledge-building and sharing; (iii) helping the financial industry develop sustainable financing practices; and (iv) supporting innovations in lending instruments to create new instruments for financing sustainable, long-term projects.80
78 ADB. 2016. Emissions trading schemes and their linking: Challenges and opportunities in Asia and the Pacific. Manila: Asian Development Bank.; and A. Bárán and D. Grigonytė. 2015. Measuring fossil fuel subsidies. ECFIN Economic Brief. 40(40). pp. 1-13.
79 Organisation for Economic Co-operation and Development. 2017. Green Bonds – Mobilizing the debt capital markets for a low-carbon transition (Policy Perspective). Pari: OECD Publishing.
80 ADB. 2017. Catalyzing Green Finance: A concept for leveraging blended finance for Green Development. Manila: Asian Development Bank.

28 ADB Sustainable Development Working Paper Series No. 72
D. Markets for Environmental Services
Asia is rich in biodiversity and contains four of the 12 “mega-diversity” countries and about 60% of the world’s species of flora and fauna. However, intensive resource use is affecting the supply of ecosystem services, such as those providing supporting, provisioning, regulating, and cultural benefits from forests and wetlands.81 The challenges with nature conservation in many developing countries has encouraged development of market-based policies for ecosystem protection. Various MBIs are available to internalize damages caused to biodiversity, including payments for eco-tourism services, direct offsets for ecosystem service losses, banking mechanisms, and offsetting funds. Under the banking mechanism, a third party—called a bank operator—implements larger restoration projects ahead of future impacts and generates offsetting credits for developers’ future needs. Offsetting entail firms paying for the negative impact imposed on the environment by purchasing credits provided by environmental organizations (public agencies or NGOs) that carry out restoration actions or conservation projects. Banking and offset policies seek to promote a mitigation hierarchy that consists of avoiding, reducing, and offsetting residual impacts on biodiversity arising from development projects, and to achieve No Net Loss of biodiversity. We discuss the mechanisms through which these approaches provide incentives for ecosystem protection, and the challenges faced in implementing them.
1. Ecotourism
Ecotourism aims to help conserve biodiversity by providing financial benefits to local communities in and around protected areas, critical habitats, cultural heritage sites, and other environmental destinations. It has the potential to contribute to both economic development and natural resource conservation by generating revenues that can be used to improve the management of protected areas, provide local employment, and foster a sense of community. Developing ecotourism opportunities can diversify the sources of income for local communities and create demand for local and unskilled labor, thereby mitigating poverty on top of protecting the environment.
As a market, ecotourism is growing three times faster than conventional tourism. According to the Rainforest Alliance, nature-based tourism accounts for 20% of international travel and continues to grow.82 Forecasts show that ecotourism is expected to represent 5% of the global tourism market by 2024, with an increasing number of tourists demanding an environmentally friendly tourism experience. A study of temporal trends in visitors to 280 protected areas in 20 countries shows that while visit rates to protected areas in the US and Japan are declining, they are increasing elsewhere. Total visit numbers are growing in 15 out of the 20 countries, and particularly in developing ones.83 This could reflect a shift in preference from domestic destinations in developed countries to alternative nature tourism destinations in developing countries with rising wealth and those destinations become more accessible. Nature-based tourism has considerable potential to generate funds for and shape people’s attitudes toward the environment and conservation. Studies indicate that, in many locations, ecotourism meets the expectations of minimizing environmental and cultural impact, building environmental awareness, providing financial benefits and
81 ADB and United Nations Economic and Social Commission for Asia and the Pacific. 2012. Green growth, resources and resilience: Environmental sustainability in Asia and the Pacific. Bangkok: United Nations and Asian Development Bank.
82 Rainforest Alliance. 2017. Market Research on Improving Connectivity of Sustainable Tourism Operations in Ecuador and Peru to the EU Marketplace. https://www.rainforest-alliance.org/sites/default/files/2017-08/Improving-Connectivity-Tourism-Ecuador-Peru-EU.pdf.
83 C. Starmer-Smit. 2004. Eco-friendly tourism on the rise. Daily Telegraph Travel. 6 November. https://www.telegraph.co.uk/travel/731611/Eco-friendly-tourism-on-the-rise.html.

Growing Green Business Investments in Asia and the Pacific 29
empowering the local people, respecting local culture, and implicitly supporting local human rights and democratization. Income from tourism can curb illegal practices, reduce dependence on forests and other natural resources such as fishing, and increase participation in conservation. Ecotourism has also been found to address gender disparity by enabling women to go beyond traditional gender roles of cleaning, cooking, and serving others and shift to entrepreneurial activities like opening cabins, restaurants, and other small businesses.
Ecotourism also has the potential to generate multiplier effects on the local economy, as people working in an ecotourism destination spend their additional income on consumer goods and services, resulting in economic and employment-generating benefits and relative prosperity for those areas.84 At the national level, ecotourism can provide an important source of foreign exchange inflows, particularly for developing countries.
There are many examples of ecotourism being embraced by local communities due to its potential for bringing jobs, new business opportunities, and a diversified source of income. Ecotourism can lead to development of small enterprises providing tourism services such as food, lodging, transport, guides and souvenir shops. Qualitative evidence shows that ecotourism has been profitable in many locations in Asia.85
However, the impact of ecotourism is mixed. Some studies show that it has compromised the cause of biodiversity conservation and failed to fulfill its promise to local communities for various reasons, including a lack of mechanisms to fairly distribute the economic benefits of ecotourism, compulsory displacement, and land insecurity.86 Global experiences show that, if managed improperly, ecotourism can disturb wildlife behaviors such as nesting or breeding, cause damage to habitats and ecosystems, and spread disease among wildlife.87 In many cases (e.g. some national parks in India and Indonesia), employment opportunities tend to be concentrated in the hands of a few people, and most jobs are given to skilled people drawn from urban areas. Local people with resource and skill constraints are often denied access to revenue opportunities generated by tourists.
Ecotourism can also lead to physical displacement of communities in order to establish protected areas. This, together with reduced access to various resources that are now protected, can exacerbate poverty, disrupt local livelihoods, and cause homelessness and food insecurity. More tourism also results in crowding, crime and social disempowerment. Countries such as India, Mexico, Thailand, and Turkey have strong centralized public administrative systems that limit community participation (footnote 85). In some cases, ecotourism can become a business policy strategy, so revenue generation is the primary focus instead of protection of environmental assets.
84 B. Seetanah. 2011. Assessing the dynamic economic impact of tourism for island economies. Annals of Tourism Research. 38(1). pp. 291-308; and J. E. Taylor, J. Hardner and M. Stewart. 2006. Ecotourism and economic growth in the Galapagos: An island economy-wide analysis. UC Davis, Department of Agricultural and Resource Economics Working Paper. No. 11950. Davis, CA, USA: University of California, Davis, Department of Agricultural and Resource Economics.
85 M. Das and B. Chatterjee. 2015. Ecotourism and Empowerment: A Case Analysis of Bhitarkanika Wildlife Sanctuary, Odisha, India. IIM Kozhikode Society & Management Review. 4(2). pp. 136-145.
86 M. M. Cernea and K. Schmidt-Soltau. 2006. Poverty Risks and National Parks: Policy Issues in Conservation and Resettlement. World Development. 34. pp. 1808-1830.; and J. Coria and E. Calfucura. 2012. Ecotourism and the development of indigenous communities: The good, the bad, and the ugly. Ecological Economics. 73. pp. 47-55.
87 M. Hughes and J. Carlsen. 2008. Human-wildlife interaction guidelines in Western Australia. Journal of Ecotourism. 7(2/3):142-154.; A. Muellner, K. Linsenmair, and M. Wikelski. 2004. Exposure to ecotourism reduces survival and affects stress response in hoatzin chicks (Opisthocomus hoazin). Biological Conservation. 118(4):549-558.; D. Biggs. 2013. Birding, sustainability and ecotourism. In R. Ballantyne and J. Packer, eds. International Handbook on Ecotourism. Cheltenham, UK and Northampton, Massachussetts, US: Edward Elgar Publishing.; C. Rizkalla, F. Blanco-Silva, and S. Gruver. 2007. Modeling the impact of Ebola and bushmeat hunting on Western Lowland Gorillas. EcoHealth. 4(2):151-155.; and D. Newsome and M. Hughes. 2016. Understanding the impacts of ecotourism on biodiversity: a multiscale, cumulative issue influenced by perceptions and politics. In D. Geneletti, ed. Handbook on Biodiversity and Ecosystem Services in Impact Assessment. Cheltenham, UK: Edward Elgar Publishing.

30 ADB Sustainable Development Working Paper Series No. 72
Proper management of ecotourism sites is one of the major factors for their success. To protect resources and meet conservation strategies, it is important to restrict the scope of recreational use based on carrying capacity, introduce codes of conduct for tourists, and involve the local community in the implementation of conservation and tourism policies.88 Standard definitions as well as guiding principles and approaches need to be mainstreamed into the development and implementation of policies governing ecotourism and sustainable tourism more generally. Some guiding principles are codified in international agreements for environmental sustainability, such as the SDGs and the Convention for Biological Diversity Guidelines on Biodiversity and Tourism Development. Others are promoted by specialized organizations such as the World Tourism Organization and the International Ecotourism Society, which promote technical expertise in the sustainable management of tourism practices. These frameworks emphasize the importance of improving the use of environmental resources for tourism development, while respecting the sociocultural authenticity of host communities and ensuring long-term economic viability and socioeconomic benefits for all stakeholders.89 The use of these guiding principles may also help to avoid incidents of “greenwashing”, or providing misleading information about a tourist site’s environmental impact or sustainability. Regulatory frameworks and enforcement must also be strengthened to ensure proper implementation of sustainable tourism policies. Finally, empowering local communities through education and participation in decision-making and management of tourism destinations are essential to ensure the environmental and socioeconomic gains from ecotourism.90
2. Wetland Mitigation Banking
In addition to ecotourism, market forces are also being harnessed to control and abate impactson biodiversity or natural capital through compensatory mitigation, which involves offsetting impacts on biodiversity through financial compensation and land protection. Wetland mitigation banking is an innovative approach, which involves preservation, enhancement, restoration, or creation of a wetland, stream, or habitat conservation area, while offsetting or compensating for expected adverse impacts to similar nearby ecosystems. Wetland bank assets are restored or enhanced existing wetlands or newly developed wetlands in areas unlikely to be ever developed. The objective is to replace the exact function and value of specific habitats that would be adversely affected by a proposed activity or project. Developers can buy credits from wetlands mitigation banks to compensate for wetlands that will be lost due to their projects. The size and the type of wetlands available through the bank determine the quantity of credits available for sale, and the price of credits is negotiated between buyer and seller. Wetland mitigation banking allows a developer to compensate for resource losses by purchasing credits from another landowner (the wetland banker), who has created or enhanced wetland resources elsewhere.
Wetland mitigation has grown in the US, as federal agencies as well as many state and local governments require mitigation for disturbing or destroying wetland, stream, or endangered species’ habitats. Mitigation banks have been functional in the US for more than two decades. In 1995, the US Environmental Protection Agency issued final a Federal Guidance on the Establishment, Use, and Operation of Mitigation Banks (revised in 2008). By 2001, 23 US states had adopted statutes or regulations and another 8 had issued guidelines for establishing mitigation banks. The number of mitigation banks increased from 43 to 1992 to more than 1,300 by 2013.
88 S. H. Tsaur, Y. C. Lin, and J. H. Lin. 2006. Evaluating ecotourism sustainability from the integrated perspective of resource, community and tourism. Tourism Management. 27(4). pp. 640-653.
89 United Nations Environment Programme and World Tourism Organization. 2005. Making Tourism More Sustainable - A Guide for Policy Makers (English version). https://www.e-unwto.org/doi/book/10.18111/9789284408214.
90 R. Scheyvens. 1999. Ecotourism and the empowerment of local communities. Tourism Management. 20 (1999). pp. 245-249.

Growing Green Business Investments in Asia and the Pacific 31
Wetland mitigation banks make it possible to consolidate efforts and to compensate for many small wetland losses at one site. Offsite wetland mitigation simplifies development in wetland areas and it normally provides for compensation before losses actually take place. For example, many wetland mitigation banks are associated with highway construction and port development, both of which incur piecemeal loss or damage to wetland resources that are commonly infeasible to mitigate on site. In these instances, state highway departments and port authorities have been the principal sponsors of wetland mitigation banks. Banks are also involved in permanent preservation and maintenance of wetland areas.
There is, however, considerable uncertainty about the ecological and economic benefits of wetland mitigation banking. Claiming that preservation of wetlands compensates for wetland destruction is valid only when it can be shown that the wetlands in the preservation area would be otherwise lost. Loss of wetlands can be difficult to predict in many cases. While wetland restoration and enhancement are beneficial techniques for mitigation banking, the slow rate at which many wetlands are restored to an enhanced condition and amass bankable credits can be problematic. Additionally, offsite wetland mitigation may be unable to replace in-kind all of the known natural functions and human use values that the impacted wetlands possess.
A downside of off-site mitigation banking is that it facilitates moving wetland to a potentially distant location. A study of 24 wetland banks in Florida that represented 900 development projects found that many had migrated from urban to rural areas.91 Thus, the populations gaining ecosystem services and those losing them due to this policy were very different.
A review of the implementation record for wetland mitigation banks across 99 sites and 68 banks in the US shows that the implementation success rate in meeting all project objectives varied from 30% to 74%. Reasons for this include: offsets were not or only partially being implemented; offsets failed to establish or persist; and mixed outcomes, such as higher floral species richness in created sites versus increased wildlife sightings, alongside fewer invasive species at natural sites.92
The problem with effective wetland mitigation is that differences in the location of the two sites could influence the function performed by wetlands. Wetlands created at a significant distance from the impacted wetland may not be able to replicate the services that are lost. Creating a bank of wetlands in advance requires pre-establishing responsibility in the event of a bank failure. In some cases, bank credits were sold (in the case of Florida described above, credits were assigned using a method estimated by wetland function) and development impacts incurred, yet later, a wetland failed to establish, resulting in a complete loss of functions of the original natural wetland. The importance of clarifying responsibility, having remedial and contingency plans in the event of bank failure, and setting long-term commitments to bank establishment and protection by appropriate parties are all critical for the success of this approach in the long run. Some regulatory agencies are using performance bonds to guarantee wetland performance for at least five years after the last credit is sold and making the sponsor responsible for operating the bank properly and preventing risks (footnote 92).
91 J. B. Ruhl and J. E. Salzman. 2006. The Effects of Wetland Mitigation Banking on People. Florida State University College of Law, Public Law Research Paper. No. 179. Tallahassee, Florida, USA: FSU College of Law.
92 J. W. Bull et al. 2013. Biodiversity offsets in theory and practice. Oryx. 47. pp. 369-380.

32 ADB Sustainable Development Working Paper Series No. 72
3. Markets for Biodiversity
In biodiversity markets, businesses internalize the impact of their activity on biodiversity through payments for the protection, restoration, or management of biodiversity. These programs meet the dual objective of biodiversity conservation and economic development using an offset approach. The goal of biodiversity offsets is to achieve No Net Loss and preferably a net gain in biodiversity on the ground, with respect to species composition, habitat structure, ecosystem function and people’s use, and cultural values associated with biodiversity.93 They also require in-kind compensation that balances biodiversity losses. These compensation activities take place within the framework of a “mitigation hierarchy”: first, avoid any impact to biodiversity; then reduce unavoidable impacts as much as possible; and finally, consider an offset.
Legislation mandating compensatory biodiversity conservation mechanisms (including offsets) is in effect in 45 countries, and under development in another 27.94 In 2010, there were an estimated 39 biodiversity offset programs existing around the world and 25 programs in various stages of development. These programs had an annual market size of about $1.8-$2.9 billion at a minimum and were resulting in at least 86,000 hectares of land being placed in conservation management or protection each year. In the US, these programs have taken the form of wetland and species mitigation programs with three mechanisms for compensation: do it yourself, pay into a fund, or buy a third-party credit. In 2010, Asia had four programs in place and another four under development, on top of 12 biodiversity offset programs in Australia and New Zealand. Annual payments reached $390 million and about 26,000 hectares of land were being protected or restored annually. Offset programs in Asia have mainly taken the form of environmental impact assessments with laws to conduct these assessments in Australia, India, Japan, Malaysia, Mongolia, New Zealand, Pakistan, the PRC, Republic of Korea, the Russia Federation, and Thailand. The assessments require developers to present proposals for offsetting impacts on threatened species and native vegetation during the planning approval process.
There are three broad types of drivers of biodiversity markets: regulatory compliance, government mediated payments, and voluntary provisioning. Regulatory compliance occurs when the government sets a limit on the allowable impact to a species or habitat and lets the market determine the cost of offsetting impacts above the limit. The government creates demand for biodiversity that the private sector can supply by purchasing a credit from a private conservation bank that has restored, managed, or preserved habitat for the species. The government can also purchase biodiversity services by acquiring land or conservation easements or by creating payment programs for biodiversity stewardship activities. Voluntary markets are driven by ethics and philanthropy and can entail purchase of biodiversity friendly products, donations for biodiversity conservation, ecotourism, and others. Unlike the other two categories, these market activities do not necessarily invest profits in conserving or restoring the biodiversity on which they depend.
Offsets are MBIs that establish a baseline and create a market to trade biodiversity credits. This approach is controversial because it implies accepting ecological losses at one location in return for uncertain gains elsewhere. There are several conceptual problems with defining biodiversity offsets. The requirements for demonstrating No Net Loss are not well defined. Offsets require showing ecological 93 Business and Biodiversity Offsets Programme (BBOP). 2009. Business, Biodiversity Offsets and BBOP: An Overview. Washington, DC:
Business and Biodiversity Offsets Programme.94 B. Madsen, N. Carroll, and K. Moore Brands. 2010. State of Biodiversity Markets Report: Offset and Compensation Programs Worldwide.
Washington, DC: Forest Trends.

Growing Green Business Investments in Asia and the Pacific 33
equivalence between biodiversity components that may differ in type, location, and context. The outcomes of offset schemes are uncertain, and there is often a time lag between development impacts and the benefits due to the offset scheme being realized. Other practical implementation challenges are non-compliance with the mitigation hierarchy, as well as offsets not being or only partially implemented. There may be differences of opinions about ecological outcomes, or lack of monitoring and follow-up by regulators. Additionally, offsets may fail to establish or persist, development impacts may be larger than expected, and the baseline may be difficult to establish. There may also be cases where there is a revision of legislation after compensation schemes have begun, which can hinder compliance, as in the example of Brazil’s forest code that was amended and eroded over time (footnote 94). It is therefore critical to develop best management practices, guidelines and methodologies to assess biodiversity offsets and provide certainty about government policies.
The use of biodiversity offsets in Australia, Canada, and the US has been only partially successful in the percent of offsets that meet all project objectives, were fully implemented, or achieved no net loss (footnote 92). In many cases, offsets were not successful in preserving ecosystem functions or avoiding loss in ecosystem productivity. There is insufficient rigorous post-implementation data and evaluation to ascertain whether losses and gains are balanced in the long term and no net loss is ensured. A publicly available global register of the outcomes of offset projects should be established to measure and provide evidence of their long-term effectiveness.
Implementing offsets in developing countries is even more challenging, due to more intense pressures on natural resource use and weaker environmental legislation, as well as gaps in information on biodiversity indicators and threats, monitoring capability and funding, enforcement resources and infrastructure, and local technical capacity and expertise. However, pursuing offset programs in developing countries can engage diverse stakeholders in conservation, while also increasing ecological knowledge and technical capacity for implementation. It will also get businesses involved in funding conservation objectives and push to improve domestic environmental legislation (footnote 92).
V. REGULATORY PRESSURES TO INDUCE GREEN BUSINESSES
Environmental regulations play an important role in promoting the development of greenbusinesses. They create demand for abatement technologies by regulated firms, and this in turn creates derived demand for the goods and services produced by EGS companies. Firms that don’t find it in their self-interest to improve environmental performance otherwise would be induced to do so by environmental regulations and threat of penalties for non-compliance. When market pressures to become environmentally responsible are relatively weak, regulations that are enforced credibly can enable widespread dissemination of low-carbon and resource-saving technologies and the diffusion of environmentally responsible management practices throughout the economy. Environmental regulations also support infant green industries by creating demand for their products and allowing economies of scale. Environmental regulations can take the form of CAC regulations or MBIs.
CAC approaches consist of either technology-based or performance-based standards and focus on abating media-specific pollutants. Technology-based standards specify abatement technologies that firms are required to install in order to control pollution after it has been generated. Performance-based standards set quantitative limits for the level of pollution that firms can emit. Both technology-

34 ADB Sustainable Development Working Paper Series No. 72
based and performance-based standards are typically uniform across firms, irrespective of their level of pollution, costs of pollution control, or alternative options for abatement. These standards disregard heterogeneity among firms in their operations, age of assets, technology, location and other factors, and do not allow firms to choose the abatement options that are most cost-effective for them. Technology-based standards dampen incentives for innovation and efforts at finding cheaper alternative approaches for abatement. By focusing on cleaning up pollution after it has been generated, these approaches could miss opportunities to prevent waste generation in the first place by increasing the efficiency with which polluting inputs are used and reducing both costs and emissions.95
MBIs address market failures preventing efficient resource use and adequate investment in green opportunities and innovation—mainly that prices do not reflect the full costs of environmental resources and functions. MBIs approaches align economies towards environmental sustainability by “getting the prices right” so as to internalize environmental externalities.96
MBIs can be price-based or quantity-based. Price-based instruments include those that penalize firms for pollution versus those that reward them for pollution control. The regulator sets the price with the expectation of achieving the desired level of pollution; the actual level of pollution abatement achieved is determined by the response of firms to the tax. In quantity-based instruments, the regulator sets quantitative targets for pollution control and lets market forces determine the price for pollution. These targets are set at the aggregate (e.g. national or regional) level and allocated to individual firms, so that compliance at the firm level will achieve the aggregate target. A cap-and-trade policy converts the performance standards set uniformly across firms to an MBI by allowing companies to trade their excess/deficit in pollution abatement relative to the target with each other through a market for pollution permits. Buying and selling permits result in setting a price for pollution. Individual firm level abatement is determined by their relative costs of abatement and response to the price resulting from the aggregate target.
When firms are heterogeneous in their costs of abatement, MBIs can achieve the desired level of pollution control at the lowest cost to society by: (i) giving firms flexibility to choose their lowest cost method of abatement; (ii) allocating abatement among firms so that the greatest reductions in pollution are done by firms with relatively lower costs of abatement; and (iii) providing firms incentives to make continuous progress in reducing their emissions. Whereas CAC approaches would require all firms to achieve the same level of abatement or adopt the same abatement technology, MBIs equalize the incremental cost of abatement across companies and ensure that firms find the lowest cost approaches to abatement, including those that prevent pollution.97 MBIs provide the dynamic incentives needed to induce technological change by firms that could reduce the costs of abatement in the long run. They can also incentivize firms to make continuous efforts at innovating lower cost approaches to pollution control, without resetting government-mandated technology standards.98
One study examined the performance of CAC approaches and MBIs in six cases in the US and Europe that included policies to reduce sulfur dioxide, nitrous oxides, industrial water pollution, leaded gasoline, chlorinated solvents, and chlorofluorocarbons (CFCs). It found that MBIs resulted in lower
95 R. N. Stavins. 2000. Market-Based Environmental Policies. In P. R. Portney and R. N. Stavins, eds. Public Policies for Environmental Protection. 2nd ed. Washington, D.C. Resources for the Future.
96 S. Hallegatte, M. Fay, and A. Vogt-Schilb. 2013. Green Industrial Policies: When and How. Policy Research Working Paper. WPS 6677. Washington, DC: World Bank. http://documents.worldbank.org/curated/en/994641468156896733/Green-industrial-policies-when-and-how.; and P. King, A. Olhoff, and K. Urama. 2014. Policy Design and Implementation. In Green Growth in Practice: Lessons from Country Experiences. Green Growth Best Practices Initiative. http://www.greengrowthknowledge.org/affiliated-program/green-growth-best-practices-initiative.
97 R. N. Stavins. 1998. What can we learn from the grand policy experiment? Lessons from SO2 allowance trading. Journal of Economic perspectives. 12(3). pp. 69-88.
98 S. R. Milliman and R. Prince. 1989. Firm incentives to promote technological change in pollution control. Journal of Environmental Economics and Management. 17(3). pp. 247-265.

Growing Green Business Investments in Asia and the Pacific 35
unit costs of abatement for firms as compared to CAC approaches, and that MBIs provided a continual incentive for firms to reduce emissions. The results also showed that a CAC approach promoted cost-reducing innovations, but MBIs encouraged both cost-reducing and emissions-reducing innovations.99
In some, cases when there are pre-existing distortions in the economy due to sales taxes or labor income taxes that are levied by the government to generate revenue, MBIs such as pollution taxes can generate revenue that can be recycled in a revenue-neutral manner to reduce the distortionary sales/labor taxes. Theoretical studies show that this can lead to a “double dividend” with lower economic costs of pollution control (as some or all of these costs are offset by reduced distortions in the labor market), increased employment, and more environmental benefits.100
Several studies have examined the performance of market-based approaches in the EU and the US. For example, tradable permit programs have been implemented in the US to reduce sulfur-dioxide emissions from power plants, leaded fuel use for transportation, and CFCs, as well as for reducing carbon-dioxide emissions in the EU and in some regions in the US. Emissions taxes have been more commonly used in Europe; examples include taxes on nitrous oxides from utility boilers in France and Sweden, effluent taxes and landfill taxes in Netherlands, and carbon taxes in France and Sweden. In many cases, the same pollutant has been regulated using different approaches, thus providing an opportunity to compare the effectiveness of these approaches relative to each other.101 Several EU countries have also undertaken tax reforms since the 1990s that shifted taxation from labor to energy in Denmark, Finland, Germany, the Netherlands, Sweden, and the UK. The observed experiences of these countries provide some evidence of the effectiveness of such reforms in improving environmental performance, and their economic implications.102
Despite the appeal of MBIs from a social efficiency perspective, there are many technical and political challenges to their implementation, so most environmental policies even in the EU and the US continue to be of the CAC type. MBIs are often complicated to design, information-intensive to implement, and dependent on strong legal and institutional frameworks for enforcement. The task of establishing such instruments efficiently could be costly, administratively difficult, subject to legislative delays, and possibly beyond the budgets of regulatory agencies to monitor and enforce.
In Asia, numerous environmental laws at the national, state and local levels have been enacted since the 1970s, and priorities for protecting natural resources and the environment have been identified in national plans. However, environmental policy tends to be separate from the economic planning process. A disconnect between economic instruments implemented to achieve growth, eliminate poverty and protect the environment often results in conflicting impacts across these three goals. Most Asian countries have established CAC regulations for pollution control. Although environmental taxes were levied in the PRC and to a more limited extent in India, and MBIs were included in Thailand’s national plans, their implementation in Asia has been limited. Tax rates were either too low to provide effective incentives or were wrongly designed (for example, levied in proportion to the volume of the effluent and not to the concentration of pollutant). Although there is a large bureaucracy to implement these laws, institutional capacity to monitor firms for compliance, enforce laws, and sanction violators remains weak. There is often a separation between the bodies that pass the laws and those that implement them
99 W. Harrington and R. D. Morgenstern. 2004. Economic Incentives Versus Command and Control: What’s the Best Approach for Solving Environmental Problems? Resources for the Future. Fall/Winter.
100 L. H. Goulder. 1995. Environmental taxation and the double dividend: A reader’s guide. International Tax and Public Finance. 2(2). pp. 157-183.
101 W. Harrington and R. D. Morgenstern. 2007. Economic Incentives Versus Command and Control: What’s the Best Approach for Solving Environmental Problems? In G. R. Visgilio and D. M. Whitelaw, eds. Acid in the Environment. Boston, MA: Springer.
102 International Institute for Labour Studies. 2011. The double dividend and environmental tax reforms in Europe. EC-IILS Joint Discussion Paper Series. No. 13. Geneva: International Labour Organization.

36 ADB Sustainable Development Working Paper Series No. 72
with, limited channels of communication among policy makers, enterprises, the public and the media. The central government is still the most important actor in environmental governance, constraining the power of local governments, the media, and the public. As a result, regulations are often poorly enforced, and social pressures on companies to comply and be responsible are weak.103
Regulatory agencies are also subject to capture by industry lobbies, and rent seeking is more widespread in developing countries than in developed countries. There is anecdotal evidence that lobbying has stalled the drafting of environmental legislation and prevented effective implementation of existing pollution control laws.104 Environmental regulations are therefore typically ineffective, and the prevailing levels of environmental compliance are low.105 Compliance with environmental regulations is not the norm.106 The infrastructure and political will for enforcement is lacking.107 While expenditures on environmental protection in the PRC account for approximately 1.3% of GDP, a significant portion are not actually directed toward environmental protection. Large sums of these funds are lost either due to local rent-seeking behavior or reallocated to projects not related to the environment due to the higher priority given to economic growth.108 Likewise, corruption may prevent the growth of green businesses and markets, where government officials or agencies may be incentivized by bribes to ignore firms’ violations of environmental regulations or to expedite processing necessary permits or approvals. In developing countries where governance may be weak and where transactions may involve more middlemen, there is a higher risk for corrupt activities to take place.109
Strengthening the regulatory framework in Asia is critical to grow EGS firms and greening of businesses. This requires increasing the role of local governments, the media, and the public in monitoring, reporting and enforcing laws. Until enforcement of environmental laws improves, efforts to protect the local environment—such as pollution reduction targets, launching campaigns for reforestation, cleaning up water bodies, and investing in renewable energy and green technologies—will not have the desired effect of protecting the local environment. India and the PRC are now developing emissions trading programs. To be effective, these programs need coordination among different government agencies in the country to ensure consistency in target setting, accounting rules, and implementation mechanisms. It is likewise crucial to streamline regulatory frameworks, which often have multiple overlapping regulations such as energy tax credits, mandates, and standards.110
International environmental treaties and laws are another mechanism for strengthening environmental standards across the globe. The Convention on International Trade in Endangered Species (CITES), agreements to promote international fisheries management, the International Tropical Timber Agreement, the Convention on Migratory Species, the Convention on Biological Diversity, the SDGs, and the Paris Agreement on climate change can impose pressure on firms, even in developing countries, to become greener. Various government and non-government organizations
103 Y. Harashima. 2000. Effects of Economic Growth on Environmental Policies in Northeast Asia. Environment Science and Policy for Sustainable Development. 42(6). pp. 28-40.
104 R. Lopez and S. Mitra. 2000. Corruption, Pollution, and the Kuznets Environment Curve. Journal of Environmental Economics and Management. 40(2). pp. 137-150.
105 M. Khanna and Y. Liao. 2014. Globalization and Voluntary Environmental Management in Developing Countries. Frontiers of Economics in China. 9(1). pp. 138-163.
106 K. Ahmed. 2012. Getting to Green: A Sourcebook of Pollution Management Policy Tools for Growth and Competitiveness (English). Washington, DC: World Bank.
107 A. Blackman. 2010. Alternative Pollution Control Policies in Developing Countries. Review of Environmental Economics and Policy. 4(2). pp. 234-253.
108 E. C. Economy. 2013. China’s environmental future: The power of the people. McKinsey & Company. June. https://www.mckinsey.com/featured-insights/asia-pacific/chinas-environmental-future-the-power-of-the-people.
109 M. Volkov. 2012. Going Green: Corruption and the Environment. Corruption, Crime and Compliance. 5 May. https://blog.volkovlaw.com/2012/05/going-green-corruption-and-the-environment/.; S. R. Velamuri, W. S. Harvey, and S. Venkataraman. 2017. Being an Ethical Business in a Corrupt Environment. Harvard Business Review. 23 March. https://hbr.org/2017/03/being-an-ethical-business-in-a-corrupt-environment.; and D. Bannerman and D. Roberts. 2012. Why eliminating corruption is crucial to sustainability. The Guardian. 17 January. https://www.theguardian.com/sustainable-business/blog/eliminating-corruption-crucial-sustainablity.
110 ADB. 2016. Emissions trading schemes and their linking: Challenges and opportunities in Asia and the Pacific. Manila: Asian Development Bank;
Growing Green Business Investments in Asia and the Pacific 37
are involved in environmental governance, including United Nations Environment Programme, International Law Association, and the International Union for Conservation of Nature and Natural Resources, but lack enforcement authority. Effective domestic laws that translate these international agreements into national legislation are needed to enforce these agreements. Use of technologies can also aide and enhance monitoring and enforcement efforts. For example, the Electronic CITES (eCITES) Implementation Framework provides guidance for managing CITES processes, including automating issuances of and facilitating electronic information exchanges about CITES permits, as well as generating reports and statistics to monitor the legality and sustainability of trade. Digital platforms such as the ASYCUDA eCITES BaseSolution can provide cloud-based electronic permitting solutions to implement the eCITES Implementation Framework.111
A. Fiscal Incentives
Government policies can either encourage or discourage green businesses by governing how these businesses operate. For example, a major disincentive for renewable energy businesses is subsidies for fossil fuels that result in fossil fuels being underpriced. These subsidies take a variety of forms, including exploration subsidies, annual production subsidies, tax breaks, and failure to account for environmental costs. Governments can combine the carrot of targeted subsidies (with credible sunset clauses) with the stick of effective regulations that are frequently but pragmatically reviewed and updated. For example, the growth of wind power in the European Union (EU) was the result of incentives for developing wind power technologies (such as feed-in tariffs in France and Germany) along with regulations and targets for emissions reductions.112 Subsidies can help launch EGS by lowering the price of these goods and creating a consumer base necessary for businesses to go green. Properly structured subsidies help firms make long-term investments by overcoming the upfront funding gap that often exists when they need to make changes to become green. Fiscal incentives can also lead companies to internalize the cost of pollution among smaller firms that do not face the same media scrutiny or have as large a capital buffer to make expensive changes as larger firms.
The largest subsidies are in the PRC and the US, amounting to $502 billion and $257 billion, respectively, in 2011.113 These subsidies make it more difficult for renewable energy to compete with fossil fuels. To encourage renewable energy, both developed and developing countries can establish other distortionary policies such as mandates and subsidies for renewable energy. Although intended to promote infant green industries, these subsidies are typically difficult to eliminate. In an effort to alleviate some of the disincentives for conserving natural resources and reducing pollution, the PRC government has begun to levy resource taxes and quota pricing for resources like water to control pollution. The National Development and Reform Commission, the Ministry of Finance, and the Ministry of Ecology and Environment have abolished tax incentives, restricted exports, and raised fees for energy-intensive and polluting industries like steel, cement, and minerals extraction.114
111 Convention on International Trade in Endangered Species of Wild Fauna and Flora. eCITES. https://cites.org/eng/prog/eCITES. 112 P. Enevoldsen et al. 2019. How much wind power potential does Europe have? Examining European wind power potential with an enhanced
socio-technical atlas. Energy Policy. 132 (2019):1092-1100.; and Wind Europe. History of Europe’s Wind Industry. https://windeurope.org/about-wind/history/.
113 E. B. Barbier. 2015. Nature and Wealth: Overcoming Environmental Scarcity and Inequality. New York, NY: Palgrave Macmillan.114 J. Ma et al. 2010. Greening Supply Chains in China: Practical Lessons from China-based Suppliers in Achieving Environmental Performance.
WRI Working Paper. Washington, DC: World Resources Institute.

38 ADB Sustainable Development Working Paper Series No. 72
B. Inducing Environmental Self-Regulation by Businesses
Governments can also encourage firms to voluntarily become more environmentally responsible by establishing voluntary programs for pollution reduction. Devolving partial responsibility for environmental protection is a response to the limitations of a small number of enforcers to regulate large numbers of polluters. Informational business-oriented models focus on transparency and involve partnering with industry associations and third-party organizations to encourage corporate environmental self-regulation through holistic and multimedia strategies to pollution control and information provision.115
Regulatory agencies in the EU and the US, as well as many developing countries, industry associations, and third-party organizations, have developed voluntary programs and certification schemes to supplement the adversarial government approach with a more “business-led” scheme under which companies have incentives to self-regulate their environmental performance. Many EU governments have indirectly promoted voluntary adoption of socially and environmentally responsible practices by requiring companies that trade on their stock exchanges to issue annual and establishing procurement policies that favor privately certified products.116 The European Parliament recently announced plans to implement new resolutions for certification of imported palm oil to enforce bans on forest and peatland clearance by their suppliers.117 Experience in developed countries shows that governments can encourage participation in voluntary programs by providing firms with technical assistance and public recognition for participation (footnote 105).
Regulators also rely on disclosing environmental information about firms and products to the public for firms to self-regulate. Public disclosure programs allow investors, consumers, and interest groups to evaluate and compare firms based on their environmental performance. These groups can signal their preferences through product and capital markets or through boycotts and negative publicity, and put market-driven pressure on firms that have poor environmental performance to self-regulate themselves.118 Several studies have examined the effect of information disclosure on capital markets and stock market returns of firms, as well as its effect on environmental performance of firms; the findings vary across countries (footnote 105). Many studies argue that public disclosure programs have reduced the percentage of firms that are non-compliant. In many cases, the improvement occurred in response to the prospect or threat of public disclosure, even before such programs were implemented.
Developing countries have tried establishing such programs in the informal sectors of the leather tanneries and brick making in Mexico due to weak capacity to regulate the hundreds of small, dispersed, polluting firms. Other voluntary programs are the Sustainable Tourism Certification Program in Costa Rica and the Clean Industry Program in Mexico.119 India recently enacted legislation requiring large companies to spend 2% of their profits on socially and environmentally responsible projects that benefit communities and workers.120
Many firms operating in developing countries are voluntarily adopting environmental management systems, seeking certification for their environmental practices from third-party organizations like ISO, and participating in green business networks. The latter include the Business Council for Sustainable Development, the World Industrial Council for the Environment, and Ceres, which have established codes of conduct and responsible environmental management practices. The PRC and several Southeast
115 M. Khanna. 2002. Non-Mandatory Approaches to Environmental Protection. Journal of Economic Surveys. 15 (3): pp. 291-324.116 D. Vogel. 2010. The Private Regulation of Global Corporate Conduct: Achievements and Limitations. Business & Society. 49(1). pp. 68-87.117 L. Gore-Langton. 2017. European Parliament votes in favour of strict new palm oil measures. Food Navigator. 3 April. https://www.
foodnavigator.com/Article/2017/04/04/European-Parliament-votes-in-favour-of-strict-new-palm-oil-measures. 118 M. Khanna. 2001. Non‐Mandatory Approaches to Environmental Protection. Journal of Economic Surveys. 15(3). pp. 291-324.119 J. Rivera. 2002. Assessing a voluntary environmental initiative in the developing world: The Costa Rican Certification for Sustainable
Tourism. Policy Sciences. 35(4). pp. 333-360.; and A. Blackman et al. 2010. Voluntary environmental regulation in developing countries: Mexico’s Clean Industry Program. Journal of Environmental Economics and Management. 60(3). pp. 182-192.
120 S. Bansal, M. V. Lopez-Perez, and L. Rodríguez-Ariza. 2018. Board Independence and Corporate Social Responsibility Disclosure: The Mediating Role of the Presence of Family Ownership. Administrative Sciences. 8(3). pp. 1-21.

Growing Green Business Investments in Asia and the Pacific 39
Asian countries are leading in the number of ISO-certified firms in the world. The Singapore Exchange mandates all listed companies to report their environmental, social, and governance practices since 2018, and provides new indices for measuring sustainability that can be used by investors.121
India passed in 2013 the Companies Act, which requires large firms to spend a share of their profits on socially responsible projects and to report this information in their annual reports. Although there are no sanctions for non-compliance, companies have to provide a reason for doing so. Thus, government regulations can enable investors and the public with information to signal their preferences for greening of businesses, and thereby reward or penalize firms through the marketplace. Another example of the government using business mechanisms to enforce environmental regulations on firms is the Environmental Label, introduced by the PRC in 1993 as a signaling mechanism for firms that wanted to win public procurement contracts. In 2006, the Ministry of Finance and the Ministry of Ecology and Environment announced that products with the Environmental Label would be given preferential treatment for procurement by government agencies.122
Voluntary adoption of environmental management standards and eco-labeling is being largely driven by pressures for green MNC supply chains and by export markets in the US and the EU. A key challenge is enabling SMEs in developing countries to adopt environmentally friendly production practices. Weak external pressures, low environmental awareness within the organization, high costs of implementation, and lack of resources and trained staff are other key barriers. However, voluntary programs can be effective in inducing greening of SMEs—even in a developing country context—when they have clear and transparent targets and timetables, individual commitments for participating facilities and a monitoring mechanism, as in Chile. They can be ineffective when they are not designed to be in the long-term self-interest of the firms, as in Mexico (footnote 105). In developing countries, firms facing more regulatory scrutiny and threat of fines and sanctions, or with the potential to obtain regulatory relief and immunity from sanctions, were more likely to seek ISO certification.123
VI. NON-REGULATORY PRESSURES TO INDUCE GREEN BUSINESS
Civil regulations—voluntary, private, non-state and cross-industry codes—are becoming more relevant to encourage responsible social and environmental practices, particularly by global firms. Regulations established by environmental NGOs in developed countries are imposing pressure on MNCs and corporations with global supply chains that are vulnerable to negative publicity to internalize their negative social and environmental externalities. Although these civil regulations are not legally enforceable, NGOs scrutinize corporate social and environmental behavior and can impose social or market-based penalties on violators. Environmental NGO activity has intensified following the 1992 United Nations Conference on Environment and Development, which led to intense capacity building efforts by NGOs. Environmental NGOs are now helping frame environmental policy, mobilizing public support for environmental conservation, and generating public pressure against global corporations that are not being environmentally and socially responsible. The groups participating in imposing civil regulations are unions, environmental organizations, human rights and labor activists, religious groups, student organizations and consumer groups, as well as social or ethical mutual funds and socially oriented institutional investors (footnote 114).
121 TODAY. 2016. Sustainability reporting for all listed companies mandatory from FY2017. 21 June. https://www.todayonline.com/business/sustainability-reporting-all-listed-companies-mandatory-fy2017.
122 Q. Zhu, Y. Tian, and J. Sarkis. 2012. Diffusion of selected green supply chain management practices: an assessment of Chinese enterprises. Production Planning & Control. 23(10-11). pp. 837-850.
123 K. Tambunlertchai, A. Kontoleon, and M. Khanna. (2013). Assessing participation in voluntary environmental programmes in the developing world: the role of FDI and export orientation on ISO14001 adoption in Thailand. Applied Economics. 45(15). pp. 2039-2048.; and A. Blackman and S. Guerrero. 2012. What drives voluntary eco-certification in Mexico? Journal of Comparative Economics. 40(2). pp. 256-268.

40 ADB Sustainable Development Working Paper Series No. 72
Civil regulations leverage the market by targeting particular products that are produced in environmentally harmful ways and organizing boycotts of those products or imposing pressure on MNCs in developed countries and their subcontractors in developing countries. These civil regulations are attempting to transmit more stringent standards from developed countries to firms, industries, and markets in developing countries by targeting global brands. The expansion of social media and ease of international communications has enabled activists to acquire information about global business practice and disseminate it rapidly in developing countries. These groups have established over 300 industry or product codes for responsible business practices for major global industries and internationally traded commodities, such as forestry, fisheries, electronics, coffee, cocoa, palm oil, tourism, and others. Thousands of global firms now regularly issue reports on social and environmental practices and have adopted the codes laid out by NGOs, and many global financial institutions have signed the United Nations Principles for Responsible Investment.
Firms are adopting the codes established by NGOs to deflect public criticism that can adversely affect their brands. Even global corporations that do not market directly to consumers value public approval and dislike negative media attention. Firms encourage NGOs to develop industry-wide codes of conduct, because they enjoy greater legitimacy and credibility than a code of conduct adopted by a single firm and impose pressures on all firms in an industry to improve environmental standards. As a result, higher environmental standards raise the costs of all firms and discourage them from competing by adopting weaker standards for labor and environmental practices. Companies frequently adopt practices similar to those of other firms in their industry.124 Civil regulations increase the ability of firms to learn from one another and formulate best practices that can respond effectively to NGO concerns and improve their performance. Civil regulations and business-NGO partnerships are effective when there is mutual advantage; with clear expectations, each party can deliver on its promises, there is openness and transparency, and both sides have a long-term commitment to adapt and improve.
Civil regulations thus incentivize the adoption of environmentally responsible practices by global firms with brand reputations to protect. These incentives are weaker for SMEs because it is difficult for NGOs or customers to assign specific negative environmental impacts compared to targeting large branded enterprises. NGOs can, however, provide technical assistance to such enterprises, advice through audits of different aspects of their environmental management, and carry out demonstration projects. They can offer capacity building and support for enterprises via methodological materials, case studies, and training programs. Governments and NGOs can partner, combining the resources of the former with the expertise of the latter, to audit environmental practices adopted by SMEs, and to deter practices that cause environmental degradation.
The influence of civil society actors in environmental policy decisions is growing in Asian developing countries. But most domestic environmental NGOs in the region are new, small, underfunded, and dependent on government grants, even in Japan. Asian NGOs often lack the autonomy and independence to represent local problems. These resource constraints and dependence on the government limit their capacity to operate as effective pressure groups that can leverage policy reforms. NGOs in the PRC and Viet Nam operate with government assistance and are not bottom-up, grassroots associations representing the public interest. As a result, much of the civil pressure for environmental regulations and greening of businesses in Asia comes from the West rather than from local NGOs or concerns about local environmental problems.125 While this external pressure helps focus attention on environmental issues in developing countries, it is less effective at raising awareness about environmental
124 D. Vogel. 2010. The Private Regulation of Global Corporate Conduct: Achievements and Limitations. Business & Society. 49(1). pp. 68-87.; and D. Vogel. 2000. Environmental regulation and economic integration. Journal of International Economic Law. 3(2). pp. 265-279.
125 Y. Komori. 2010. Evaluating Regional Environmental Governance in Northeast Asia. Asian Affairs: An American Review. 37(1). pp. 1-25.; and K. Fürst. 2016. Regulating through leverage: Civil regulation in China. http://hdl.handle.net/11245/1.541960.

Growing Green Business Investments in Asia and the Pacific 41
problems that are less visible in developed countries. The major environmental problems in developing countries are local problems, like air pollution or poor-quality drinking water that are largely ignored by environmentalists and policy makers in developed countries (footnote 58).
SMEs typically do not experience external pressure to behave in a more environmentally friendly manner. Consumers and NGOs find it easier to target larger enterprises than to denounce specific negative environmental consequences in SMEs. Governments also tend to avoid imposing external pressure on SMEs by environmental legislation. A study in the EU found that more than half of SMEs do not wish to go beyond compliance with applicable regulatory requirements.126 SMEs generally focus on achieving compliance, and rarely go beyond it. Improved local image, increased number of customers, and other factors that motivate large enterprises do not appeal to SMEs because they believe that compliance with environmental requirements will not affect unaware customers. For these SMEs, investing in environmental and social responsibility is a non-priority expense.
SMEs that dominate the business sector in developing countries are likely to be major contributors to local environmental problems. For example, SMEs produce 45% of the manufactured output in India, and their contribution to employment is the second highest in the country. The total contribution of SMEs to pollution is likely to be higher than that of larger enterprises, although there are no definitive estimates of this.127
In addition to NGOs, citizens also apply civil pressure. Citizen complaints are growing, even in countries like the PRC that do not have a history of activism. Large-scale protests broke out in 2012 against local officials who had approved factories and other projects believed to be harmful to public health. Through social media, Chinese citizens gained access to critical information for organizing effective demonstrations and forced the local government to halt its plans.128
Civic pressure can also be generated by public disclosure of environmental information about firms. Many countries have piloted public disclosure programs developed by the World Bank and NGOs (footnote 107). These include the Green Watch Program in China, Eco Watch in Philippines, the Green Ratings Program in India, and PROPER in Indonesia.129 There is some evidence that these programs encourage companies to become more compliant and improve their environmental performance to avoid negative publicity (footnote 99). International initiatives include the Economics of Ecosystems and Biodiversity for Business Coalition in East Asia, and the Global Reporting Initiative. More firms are participating in climate and sustainability reporting. Governments can provide better guidance and regulations on such measures to ensure that all firms follow the same methods and standards. As environmental reporting becomes a key policy tool for differentiating GB, verification of the information provided will be critical to ensure the public trust and dispel concerns about green-washing.
126 Organisation for Economic Co-operation and Development. 2018. Improving the business environment for SMEs through effective regulation. Policy note for the 2018 SME Ministerial Conference. Mexico City. 22-23 February.
127 G. Nulkar. 2014. SMEs and Environmental Performance – A Framework for Green Business Strategies. Procedia - Social and Behavioral Sciences. 133. pp. 130-140.
128 E. Tyson. 2017. Citizen Science Is Making it Harder for China’s Biggest Polluters to Hide. New Security Beat. 21 June. https://www.newsecuritybeat.org/2017/06/citizen-science-making-harder-chinas-biggest-polluters-hide/.; and E. C. Economy. 2013. China’s environmental future: The power of the people. McKinsey & Company. June. https://www.mckinsey.com/featured-insights/asia-pacific/chinas-environmental-future-the-power-of-the-people.
129 H. Wang et al. 2002. Environmental Performance Rating and Disclosure: China’s Green-Watch Program. World Bank Policy Research Working Paper. No. 2889. Washington, DC: World Bank.; R. A. A. Lambino. 2013. The Transfer and Adoption of an Environmental Information Disclosure Program in the Philippines. Public Policy and Administration Research. 3(12). pp. 153-168.; V. Anbumozhi, Q. Chotichanathawewong, and T. Murugesh. 2011. Information Disclosure Strategies for Green Industries. ADBI Working Paper Series. No. 305. Tokyo: Asian Development Bank Institute.; S. Gupta and B. Goldar. 2005. Do stock markets penalize environment-unfriendly behaviour? Evidence from India. Ecological economics. 52(1). pp. 81-95.; N. Powers et al. 2011. Does Disclosure Reduce Pollution? Evidence from India’s Green Rating Project. Environmental and Resource Economics. 50(1). pp. 131-155.; and J. H. García, T. Sterner, and S. Afsah. 2007. Public disclosure of industrial pollution: the PROPER approach for Indonesia? Environment and Development Economics. 12. pp. 733-738.

42 ADB Sustainable Development Working Paper Series No. 72
VII. INNOVATION TO PROMOTE GREEN BUSINESS DEVELOPMENT
Green innovations comprise a vast range of fundamentally different technologies and approaches that achieve more resource-efficient, clean, and resilient growth.130 These include technologies that improve resource efficiency and reduce pollution, climate change mitigation and adaptation, and sustainable product and production technologies such as natural cosmetics, pharmaceutical products, and ecotourism. Other innovations can also involve applying traditional practices or developing frontier approaches to green production, such as agroforestry systems that enable product diversification (beyond monocultural crops) and increased job and business opportunities, while providing valuable ecosystem services and other benefits to farmers.131
Developing green businesses requires innovation to increase production using fewer polluting inputs and decouples output from natural capital depletion and environmental pollution. Technological innovation must be a continuous process of idea generation and R&D, accompanied by opportunities for commercialization and financial reward. The shift toward resource-efficient and cleaner technologies in Asia could occur via three main pathways: (i) frontier innovations that are novel technologies adopted in the research phase of the technology development cycle; (ii) adaptive innovations that represent modifications to existing technologies to make them more useful in alternative situations; and (iii) absorptive innovations that refer to changes in institutional environment to enable transfer and implementation of frontier and adaptive innovations.132 Adaptive innovations can reduce production costs and increase enterprise competitiveness, while being less risky than frontier innovations. These innovations could occur in products and services as well as in processes, business models and organizational practices.
One measure of innovative activity is the number of green patents issued in a country. While there has been a significant increase globally in frontier green innovation since the end of the 1990s, most of this has occurred in high-income countries. Germany, Japan, and the US accounted for 60% of total green innovations worldwide between 2000 and 2005, based on key GHG mitigation technologies. With the exception of the PRC among the top ten countries leading in green patents, there are relatively few frontier green inventions produced in the developing world. Asia registered 79 green patents in 2010, compared to 1,500 in high income-countries (footnote 129). Other measures of innovative activity, like the share of US green patent grants issued, show the capacity for green innovation. Nine emerging economies (Argentina, Brazil, Hungary, India, Malaysia, Mexico, the PRC, the Russian Federation, and South Africa) accounted for nearly 80% of all US green patent grants issued to developing countries between 2006 and 2010. Moreover, there was a sharp upward trend in US green patenting, with grants more than doubling between 2000-2005 and 2006-2010. Major sectors for green innovation patents in both high income and developing countries are wind, solar, lighting, and fuel injection. Although the patent data suggest that there has been limited frontier green innovation in most developing countries, there is considerable capacity for catch-up green innovation through adoption and adaptation of existing green technologies and indigenous development of technology for the bottom-
130 M. A. Dutz and S. Sharma. 2012. Green growth, technology and innovation (English). World Bank Policy Research Working Paper. No. 5932. Washington, DC: World Bank. http://documents.worldbank.org/curated/en/897251468156871535/Green-growth-technology-and-innovation.
131 A. Hillbrand et al. 2017. Agroforestry for landscape restoration: Exploring the potential of agroforestry to enhance the sustainability and resilience of degraded landscapes. Rome: Food and Agriculture Organization of the United Nations. http://www.fao.org/3/b-i7374e.pdf.
132 N. Hultman et al. 2012. Green Growth Innovation: New Pathways for International Cooperation. Washington, DC and Seoul: Brookings Institution and Global Green Growth Institute.

Growing Green Business Investments in Asia and the Pacific 43
of-the-pyramid population group. An indicator for this is the production and trade in green goods and across. To the extent that some of these green goods are used as inputs, this also indicates “greening” of the input mix, which may reflect adoption and adaptation of existing technologies by local firms. Imports of green goods represented almost the same share of total imports for developing countries as they did for developed countries between 2000-2010. Similarly, exports of green and close to green goods as a share of all exports were similar in developing and developed countries in 2010, and relatively high in East Asia and the Pacific (footnote 127).
Policies to foster frontier and adaptive green innovations and develop absorptive capacity contend with two sources of market failure. The first affects all types of innovations, and arises due to the gap between the private and the social returns to innovation, which reflects the potential for knowledge spillovers that limit full rewards to the innovators of a technology, because a major benefit of green technologies is less un-priced environmental externalities. Other factors that limit innovation are information asymmetries between the innovator and the financiers, size of the market for the innovation, path dependency, and risk. This suggests the need for an R&D policy incentive to innovate in the environmental sector, and an environmental policy to internalize the pollution externality. These policies should provide both supply side/technology push elements that reduce the cost of innovation and increase adoption, and demand-side/market pull elements that provide net gains to innovators, producers, and consumers of green goods.
In developed and advanced developing countries, efforts at promoting frontier innovations has been largely accomplished by direct government funding for R&D. This funding can be directed toward government labs, universities, and private firms for early-stage pre-commercial technology development, and through PPPs between corporations, universities and government labs. Additionally, enforcing intellectual property rights through patents and availability of venture capital are critical to protect innovative ideas and advance them to commercial scale. Since the benefits from many green innovations are global in nature, to overcome market failures, public spending on R&D should be increased and used to facilitate the development, adoption, and diffusion of green technologies relevant to developing country contexts.
Promoting the adoption of catch-up technologies requires policies that remove existing distortions that discourage adoption and adaptation in developing countries. Green innovation can be stimulated by implementing environmental policies that price externalities such as pollution taxes, tradable pollution permit, environmentally friendly public procurement, renewable fuel standards, and feed-in tariffs. The Porter Hypothesis discusses the potential for environmental regulations to induce innovation, based on the underlying premise that: (i) firms are maximizing profits in the absence of the regulations and have already internalized the profitable/least cost opportunities for pollution reduction; (ii) companies are passive responders to environmental regulations; and (iii) firms are price-takers in input, output, and capital markets. The Porter Hypothesis argues that companies do not always make optimal choices and operate in a world with changing technological opportunities, incomplete information, organizational inertia, and limited attention. Environmental regulations push firms to measure their discharges, understand the sources and costs of pollution, and assess how to reduce it, which is often making the production process more input-efficient. By increasing corporate awareness of a pollution problem and reducing uncertainty about the value of investments in pollution control, these regulations can drive innovation. Stringent regulations that offer flexibility to find least cost pollution control approaches urge companies to search for more fundamental solutions that involve reconfiguring

44 ADB Sustainable Development Working Paper Series No. 72
products and processes.133 Other studies show that environmental regulations can overcome incentives to under-invest in cleaner technologies due to imperfect competition or because firms cannot fully capture all the returns on R&D investment, which are partly captured by its competitors.134 By forcing all firms to adopt a technology or minimum standards for environmental product quality, regulations can spur higher investment in R&D to benefit all firms.
There has been considerable research to test the Porter Hypothesis empirically.135 These studies differ in their findings, but overall, these support the positive link between environmental regulation and innovation. There is a significant disagreement, however, over the strength of this signal and the nature of the resulting innovation. Cross-country studies also show that an increase in regulatory pressure does have a statistically significant effect in inducing innovation as measured by patent activity. Using patent application data for 79 countries, Lim and Prakash demonstrate that voluntary efforts at self-regulation through adoption of ISO standards encourage innovation.136
Finally, policy distortions in developing countries can also discourage environmental innovation. Many Asian countries have distortions in their trade policies, and in their investment and technology licensing regimes. They also provide subsidies for fossil fuels and other polluting inputs like fertilizers. Khanna and Zilberman show that tariffs on clean energy and subsidies for fossil fuels and electricity deterred Indian companies from adopting efficiency-enhancing technologies in electricity generation sector.137 Reducing domestic barriers to firm entry and exit, improving access to finance, strengthening skills and capacity development, and implementing more demand-side policies (such as public procurement, regulations, and standards) create demand side incentives to adopt green technologies. Another study indicated that eliminating tariff and non-tariff barriers in the top 18 developing countries ranked by their GHG emissions would increase imports by 63% for energy-efficient lighting, 23% for wind power generation, 14% for solar power generation, and 4.6% for clean coal technology.138 A study of electric power plants in India found that removing import barriers to high-quality coal would increase the adoption of more energy-efficient technology, and potentially decrease carbon emissions.139
Dechezleprêtre et al. highlight the importance of local capacity building as a means to accelerate technology diffusion; local governments can play a vital role in strengthening technological capabilities by facilitating the import of foreign technology and the local diffusion of domestic technologies.140
133 M. E. Porter and C. Van der Linde. 1995. Toward a new conception of the environment-competitiveness relationship. Journal of economic perspectives. 9(4). pp. 97-118.
134 R. Mohr and S. Saha. 2008. Distribution of Environmental Costs and Benefits, Additional Distortions, and the Porter Hypothesis. Land Economics. 84(4). pp. 689-700.
135 S. Ambec et al. 2013. The Porter Hypothesis at 20: Can Environmental Regulation Enhance Innovation and Competitiveness? Review of Environmental Economics and Policy. 0(0). pp. 1-22.
136 S. Lim and A. Prakash. 2014. Voluntary Regulations and Innovation: The Case of ISO 14001. Public Administration Review. 74(2). pp. 233-244.
137 M. Khanna and D. Zilberman. 1999. Free markets and the abatement of carbon emissions: The electricity-generating sector in India. Resource and Energy Economics. 21(2). pp. 125-152.; and M. Khanna and D. Zilberman. 2001. Adoption of energy efficient technologies and carbon abatement: the electricity generating sector in India. Energy Economics. 23(6). pp. 637-658.
138 M. Mani et al. 2007. International trade and climate change: economic, legal, and institutional perspectives (English). Washington, DC: World Bank.
139 M. Khanna and D. Zilberman. 2001. Adoption of energy efficient technologies and carbon abatement: the electricity generating sector in India. Energy Economics. 23(6). pp. 637-658.
140 A. Dechezleprêtre, M. Glachant, and Y. Ménière. 2008. The Clean Development Mechanism and the international diffusion of technologies: An empirical study. Energy Policy. 36(4). pp. 1273-1283.

Growing Green Business Investments in Asia and the Pacific 45
VIII. PERFORMANCE OUTCOMES OF GREENING BUSINESSES
A. Financial Performance
Numerous studies have investigated the effect of corporate social performance on corporate financial performance. A key challenge in this research is what is corporate social performance, which can be defined as a company’s efforts at fulfilling multiple responsibilities (economic, legal, and ethical) in addition to social responsibility. Environmental responsibility is only one of these responsibilities. Additionally the mechanisms through which corporate social performance affects financial performance also differ. Some studies suggest it raises a firm’s benefits and reduces its costs, while others argue it is the appearance of doing good—independent of the actual effects of efforts to do good—that generate value for a company. A meta-analysis by Margolis et al. found that although the effect of investments in social performance on financial performance varied across studies, financial performance barely suffers; only 2% of studies found a significant negative effect.141 However, the size of the effect was small, indicating that financial performance alone may be an unlikely rationale to pursue corporate social performance, since other investments might lead to higher returns. Despite this, large and wealthy companies may recognize the importance of engaging in improved social performance as a “license to operate” to avoid public opposition to their operations.
Manrique and Marti-Ballester use a sample of large firms in several developed and developing countries to examine the relationship between an index of corporate environmental performance and corporate financial performance in developing countries, and compare it to that in developed countries.142 Although improvements in environmental performance impose costs on firms, they can also increase the value of the company by integrating environmental strategies into the business strategy of the firm, developing unique and valuable organizational resources and capabilities that create a competitive advantage. Additionally, by improving efficiency and productivity, reducing waste disposal and environmental compliance costs, differentiating products and gaining market share and revenue, it may pay to be green. However, some of these conditions may not be present in developing economies where weak environmental regulations, absence of severe environmental penalties and civic pressures, and lack of environmentally aware consumers make rewards for firms that are environmentally responsible less likely. Nevertheless, the study found that corporate environmental performance had a significant and positive effect on return on assets in both developed and developing countries, and this effect was stronger for firms in developing countries. While a one-unit increase in corporate environmental performance of firms increases the growth rate of their return on assets by 1% in developed countries, it does so by 3% in developing countries. It increases the Tobin’s Q (defined as the ratio of market value to book value) by 0.2% in developing countries but has a statistically insignificant effect in developed countries. The study also found that firms in Central and South Asia achieved significantly better short-term corporate financial performance. This could be because these regions are growing fast and investors could expect more growth opportunities in the future, which in turn could lead to better long-term financial performance.
One possible explanation for this is that firms located in developing countries are in an early phase of environmental improvements and have low-hanging fruit opportunities to make improvements. They may be able to improve their environmental performance with relatively little financial investment, and
141 J. D. Margolis, H. A. Elfenbein, and J. P. Walsh. 2009. Does it Pay to Be Good...And Does it Matter? A Meta-Analysis of the Relationship between Corporate Social and Financial Performance. SSRN. 1 March. https://papers.ssrn.com/sol3/papers.cfm?abstract_id=1866371
142 S. Manrique and C. P. Martí-Ballester. 2017. Analyzing the effect of corporate environmental performance on corporate financial performance in developed and developing countries. Sustainability. 9(11). pp. 1-30.

46 ADB Sustainable Development Working Paper Series No. 72
thus have a higher return on assets and stronger financial performance in the long run, as well and thus a stronger effect on their Tobin’s Q. Companies in developed countries are at a more advanced stage of environmental practice implementation requiring changes to production processes by incorporating new production technology, which involves raising capital and investing in technology and therefore results in lower net benefits. Another reason could be that commitments by firms to be socially and environmentally responsible are becoming the norm, since all major global firms issue an annual social responsibility report, subscribe to codes of conduct, develop partnerships with NGOs, and monitor their supply chains. Thus, greening of firms may not lead to a sustainable competitive advantage, especially when it is easy to imitate.
Developing countries worry that stringent environmental regulations could dampen productivity and impose costs on businesses that would adversely affect their financial performance. Early studies in the 1980s and 1990s for the US show that environmental regulations had a negative impact on firm productivity, possibly due to CAC nature of those regulations.143 Research since then has produced more mixed results. Several studies find that under certain circumstances, environmental regulation can have a positive effect on productivity.144 One study shows that the effect of environmental regulation on a firm’s financial performance depends on the type of regulatory approach (MBI or CAC), the firm’s sector and market conditions, the environmental problem being addressed, the firm’s governance and management approach, and the research methodology.145 Existing studies have typically not examined the long-term effects of environmental regulations.
A strong version of the Porter Hypothesis states that properly designed environmental regulations can induce innovation to improve business performance and make firms more productive and profitable (footnote 15). Other economists have questioned this view, arguing that environmental regulations are costly and less profitable (footnote 142). Cohen and Tubb suggest that there may be a positive effect of environmental regulation being more likely at the state, region, or country level, compared to facility, firm, or industry level. In general, their findings indicate that stringent but flexible environmental regulations induce innovation and can increase country-level competitiveness over time.146
B. Environmental Performance
The production of environmental goods by EGS firms and the pursuit of environmentally responsible practices by greening of businesses in Asia do not necessarily guarantee a better environmental quality for the region. The markets for many of the final consumer goods and intermediate goods may be outside Asia or diffused across different sectors. Hence, identifying the impact of increased production of environmental goods on environmental quality is challenging. On the other hand, a number of studies have sought to examine the environmental effects of specific practices adopted by greening of businesses on the environment, such as ISO standards and participation in voluntary programs for toxic release reduction and carbon emission reduction in the US and the EU.147 These studies show mixed results. Voluntary efforts at greening businesses were found to be more effective when emissions could
143 K. Palmer, W. E. Oates, and P. R. Portney. 1995. Tightening Environmental Standards: The Benefit-Cost or the No-Cost Paradigm? Journal of Economics Perspectives. 9(4). pp. 119-132.
144 E. Berman and L. Bui. 2001. Environmental Regulation And Productivity: Evidence From Oil Refineries. The Review of Economics and Statistics. 83(3). pp. 498-510.; and P. Lanoie, M. Patry, and R. Lajeunesse. 2008. Environmental Regulation and Productivity: Testing the Porter Hypothesis. Journal of Productivity Analysis. 30(2). pp. 121-128.
145 S. Ambec et al. 2013. The Porter Hypothesis at 20: Can Environmental Regulation Enhance Innovation and Competitiveness? Review of Environmental Economics and Policy. 0(0). pp. 1-22.
146 M. A. Cohen and A. Tubb. 2018. The Impact of Environmental Regulation on Firm and Country Competitiveness: A Meta-analysis of the Porter Hypothesis. Journal of the Association of Environmental and Resource Economists. 5(2). pp. 371-399.
147 M. Khanna and D. T. Ramirez. 2004. Effectiveness of voluntary approaches: implications for climate change mitigation. In A. Baranzini and P. Thalmann, eds. Voluntary Approaches in Climate Policy. Edward Elgar Publishing.

Growing Green Business Investments in Asia and the Pacific 47
be transparently tracked, there was a credible threat of regulation, and firms had to set concrete targets for reducing emissions. If firms can benefit from appearing to be GB without making actual efforts at improving environmental performance, incentives to actually reduce pollution will be limited.
In general, the literature shows that some public voluntary programs in the US and adoption of environmental management systems do improve environmental performance. Private certification programs like ISO 9000 and ISO 14001 were also found to improve environmental performance across a number of different dimensions. While ISO 9000 is not directly focused on environmental processes, its emphasis on lean production methods may have impacted environmental performance through several avenues. These practices may have inadvertently reduced pollution or led firms to recognize the benefits of reducing waste generation. ISO 9000-certified companies were found to generate less waste at the source and have lower emissions than non-certified ones, suggesting the potential for “lean and green” businesses. ISO 14001 certification has also been found to improve firms’ compliance with mandatory regulations and lead to a reduction in the levels of toxic chemical emissions. These positive effects may be due to the program’s requirement for third-party audits, which potentially reduced willful violations of environmental regulations and limited shirking behavior by firms, and to the adoption of environmental management standards, which may have reduced waste generation at source. Other studies find that ISO 14001 improved environmental performance by reducing natural resource use, waste generation, wastewater effluents, and environmental accidents. On the other hand, other public voluntary programs, particularly those targeted to reduce GHG emissions in the US, did not have significant long-term effects on emissions, while those in Europe had modest impacts. Similarly, industry association programs like the chemical industry’s Responsible Care program did not have a significant impact on environmental performance.148
What explains the differences in the performance of voluntary approaches in developed countries? There are several reasons why programs focused on toxic release reduction were more likely to be effective than those related to energy or energy-related GHG emissions. First, the threat of regulation of toxic releases is more imminent and credible. Second, public concerns are likely to be much greater for toxic releases, because they have a direct and immediate effect on human health, and thus, market-based pressures are likely to create incentives for reducing toxic releases. Third, toxic releases are disclosed to the public, so the performance of firms participating in voluntary programs can be tracked and monitored. In contrast, GHG emissions don’t have to be reported, hence the performance of participants could not be compared over time. Furthermore, reductions in energy-related GHG emissions generally require reductions in energy use or substitutes for energy; opportunities for this may have been more costly compared to replacing hundreds of toxic chemicals. The observed effectiveness of ISO 14001 could be due to its requirements for third-party audits, and because certified firms sought to preserve the reputation of the certificate. In general, the findings from the empirical literature in the US suggest that lack of enforceability of voluntary approaches, the weak legislative threats that accompany them, and the difficulties in public scrutiny of environmental outcomes achieved by participants and non-participants can limit the effectiveness of these approaches in improving environmental performance (footnote 148). Experience from developed countries suggests that GB are more likely to actually improve firms’ environmental performance if they face a threat of stringent regulations and if their environmental performance can be tracked and monitored by regulators, consumers, investors, and NGOs, as in the case of the Toxic Release Inventory in the US (footnote 147).
In the absence of a credible regulatory framework, there is variability in the extent to which businesses adopt green practices, the type of environmental problems they chose to address, and the progress they make toward addressing them. The effectiveness of supply chain pressures and regulatory
148 M. Khanna and K. Brouhle. 2009. The effectiveness of voluntary environmental initiatives. In M. A. Delmas and O. R. Young, eds. Governance for the Environment: New Perspectives. Cambridge: Cambridge University Press.

48 ADB Sustainable Development Working Paper Series No. 72
and market pressures in export markets of Asian greening businesses will depend on the stringency of those pressures. Another factor will be whether downstream customers are actually monitoring the performance of environmental management practices and systems.
A recent report by the Carbon Disclosure Project (CDP) shows that although an increasing number of companies are participating in the CDP, many are not disclosing their emissions levels or setting ambitious targets with a 2030 time horizon.149 Moreover, the targets set by companies would achieve only 25% of the emissions reduction required to keep global temperature rise below 2°C. Current commitments for carbon reduction made by firms reporting to CDP would leave the world on a trajectory toward a 3.4°C scenario. While many companies are utilizing internal carbon pricing to manage climate risks and make investment decisions, relatively few have targets for increasing renewable energy generation or consumption. The 2016 CDP supply chain program data indicates that 68% of the respondents identify inherent physical, regulatory, and/or other climate change-related opportunities to change business operations, revenue or expenses.150 However, a much smaller percentage recognized opportunities to increase water use efficiency or reduce water use and the potential to reduce energy use by increasing water use efficiency.
Mandatory reporting of carbon emissions and public disclosure are likely to be more effective in engaging investors, consumers, and the public in monitoring progress and regulating performance of firms through market-based reactions. It would also be a first step toward developing baseline emissions levels and for tracking the performance of greening of businesses over time. As noted above, monitoring and enforcement infrastructure is needed to collect, verify, and disclose this information in a trustworthy manner via a strong regulatory framework.
IX. CONCLUSIONS
There is significant opportunity for green businesses in Asia as the global environmental market expands in the coming years. While Japan and the PRC are the dominant producers of environmental goods and services, other Asian countries are growing their share of the market. Investment in renewable energy in particular is soaring and has overtaken that in developed countries, while Asia now leads sales of low-carbon goods and services as a share of GDP. Ecotourism is another potential area of growth for a region rich in natural capital and biodiversity. Rising incomes and preferences for nature-based tourism in foreign locations is increasing the demand for ecotourism in developing countries, and Asia can take advantage of that trend.
A strong driver for greening businesses is the rise of global companies and MNCs with upstream suppliers located in Asia. Pressure on these global firms from NGOs, domestic regulations in the countries where their headquarters are located, and downstream consumers in developed countries are causing them to green their supply chains. There is also growing demand for products produced is an environmentally responsible manner from export markets, leading export-oriented firms located in Asia to produce green goods that are often eco-labeled for credibility. This has also led many upstream businesses located in the region to adopt environmental management systems and make process and product modifications to reduce their environmental impacts.
149 P. Simpson. 2017. Picking up the pace: tracking corporate climate action on the road from Paris. CDP. 26 October. https://www.cdp.net/en/articles/climate/picking-up-the-pace-tracking-corporate-climate-action-on-the-road-from-paris.
150 The Carbon Trust and BSR. 2017. Missing link: Harnessing the power of purchasing for a sustainable future (CDP Supply Chain Report 2016-2017). London: CDP. https://www.cdp.net/en/research/global-reports/global-supply-chain-report-2017.

Growing Green Business Investments in Asia and the Pacific 49
However, many Asian countries continue to rely predominantly on fossil fuels, and large segments of the population lack access to electricity and non-solid fuels for cooking. Growing water pollution is another concern. While ecotourism can generate funds to conserve natural resources, promote economic development, increase foreign exchange inflows and increase local employment, the experience in realizing these benefits has been mixed. Enforcement of environmental regulations is weak, and rates of non-compliance are high. This limits incentives for pollution abatement and innovation in green technologies to the levels needed to achieve environmental quality levels similar to developed countries.
Efforts to promote green businesses require a robust regulatory framework, proactive engagement of domestic civil society, and pressure from markets for consumer goods, capital and ecosystem services to impose regulatory and non-regulatory pressures on businesses to be more environmentally responsible in developing countries. In the absence of these pressures, much of the civil and green supply chain pressure for greening of businesses in Asia is currently emanating from environmental regimes and consumers in the Western world rather than domestically. While this external pressure is focusing attention on some environmental issues in developing countries, particularly those caused by global firms, it is less effective in targeting attention toward environmental problems caused by SMEs serving domestic markets. To make greening of businesses more widespread in Asian countries, we must look at other factors. Regulatory pressures, in particular, and green finance can encourage technological innovation and develop it to commercial scale deployment.
Assessments of the relationship between corporate social performance and corporate financial performance show that sign and significance vary a great deal across studies. The evidence suggests none to a small positive association between corporate social performance and corporate financial performance, suggesting that factors other than financial benefits alone are driving green business development. A comparison of this effect across developed and developing countries indicates that adoption of environmental practices is more likely to have a significant positive impact on corporate financial performance in developing countries.
Green businesses have the potential to weaken the links between growth and environmental impacts by increasing resource use efficiency and output produced per unit use of fossil fuels and other polluting inputs. The extent to which EGS and GB improve environmental quality will depend on the scale at which they are able to induce a shift from fossil fuels and use of other polluting inputs. It will also be contingent on the types of environmental impacts they reduce, and the extent to which increased growth and scale of production does not offset the benefits of increased resource use efficiency. Assessing the impact of green businesses on environmental quality in Asia is constrained by lack of publicly available data on environmental performance by all firms. Information on environmental performance of both green and non-green companies is typically not available publicly over a long period of time to track and compare. In the absence of that data, the environmental benefits of the current of greening businesses in the region remain to be seen.

Growing Green Business Investments in Asia and the PacificTrends and Opportunities
The imperative for green businesses in Asia and the Pacific is growing. In many Asian countries, governments are introducing policies, regulations, initiatives and other solutions to mainstream sustainable approaches to consumption and production. However, there are still many challenges to scale up these measures in the region. The paper discusses the opportunities and challenges for green businesses in the region, as well as the market motivations and regulatory and non-regulatory mechanisms for promoting green businesses. It also discusses the implications of greening businesses for companies’ financial and environmental bottom lines.
About the Asian Development Bank
ADB is committed to achieving a prosperous, inclusive, resilient, and sustainable Asia and the Pacific, while sustaining its efforts to eradicate extreme poverty. Established in 1966, it is owned by 68 members—49 from the region. Its main instruments for helping its developing member countries are policy dialogue, loans, equity investments, guarantees, grants, and technical assistance.
ASIAN DEVELOPMENT BANK6 ADB Avenue, Mandaluyong City1550 Metro Manila, Philippineswww.adb.org