growing demand on agriculture and rising prices of …€¦ · · 2008-04-25growing demand on...
TRANSCRIPT
UNITED NATIONS
DEPARTMENT OF ECONOMIC AND SOCIAL AFFAIRS
Commission on Sustainable Development Sixteenth Session 5 - 16 May 2008 New York
Growing demand on agriculture and rising prices of
commodities: An opportunity for smallholders in low-income, agriculture-based countries?
Discussion Paper and Proceedings Report of the Governing Council
Round Table held in Conjunction with the Thirty-first session of IFAD’s Governing Council, February 2008
Submitted by: International Fund for Agricultural Development (IFAD)
BACKGROUND PAPER NO. 11
DESA/DSD/2008/11

The views and opinions expressed do not necessarily represent those of the United Nations Department of Economic and Social Affairs; the designations and terminology used do not imply the expression of any opinion whatever on the part of the United Nations Department of Economic and Social Affairs.
2

Climate change, biofuel expansion and rising food prices are growing challenges for poor rural people. But these trends also present opportunities. IFAD held three round table discussions on these new challenges and opportunities for smallholder agriculture at the 31st session of its Governing Council on 14 February 2008.
Round Table 1 focused on the topic of “Climate change and the future of smallholder agriculture: How can the rural poor people be part of the solution to climate change?”
Round Table 2 – Biofuel expansion: Challenges, risks and opportunities for rural poor people Round Table 3 – Growing demand on agriculture and rising prices of commodities: An opportunity for smallholders in low-income, agriculture-based countries? The section that follows describes the proceedings of Round Table 3 – Growing demand on agriculture and rising prices of commodities: An opportunity for smallholders in low-income, agriculture-based countries?
Table of Contents I. Round Table on Growing demand on agriculture and rising prices of commodities: An opportunity for smallholders in low-income, agriculture-based countries? 4 1. Opening remarks
2. Panellist presentations 3. Plenary discussions
II. Summary of the round table discussions and recommendations presented to the Governing Council 9 III. Discussion Paper for the Round Table 11
3

I. Growing demand on agriculture and rising prices of commodities: An opportunity for smallholders in low-income, agriculture-based countries?
What are the policy conditions for a rapid and successful smallholder response to this evolution, particularly in food-deficit countries?
How are recent trends in world prices of food and agricultural commodities transmitted to local rural markets and farm gates in low income agricultural-based countries?
Questions to guide the round table discussion:
Chairperson: H.E. Suleiman J. Al-Herbish, OFID Facilitator: Gunilla Olsson, IFAD Panellists:
1. Hafez Ghanem, FAO 2. Bruno Losch, World Bank/CIRAD 3. Ibrahim Assne Mayaki, West Africa HUB 4. Olgerio Carillo Meza, National Union of Farmers’ Regional Autonomous
Organizations of Mexico 1. Opening remarks
This round table was opened by Mr. Suleman J. al-Herbish, Director-General of the OPEC Fund for International Development. He began by stating the OFID has been a strategic partner of IFAD’s for 30 years and then briefly described OFID, highlighting that it is run by ministers of finance and not oil, and is therefore independent. He stated that energy and food are competing for arable land, and that small farmers are benefitting little from increases in agricultural prices, since they are at the lower end of the agricultural chain and suffer from unfair trade practices, such as subsidies. He concluded by saying that this competition was one of the major issues contributing to rural poverty.
2. Panellist presentations
The first presentation was given by Mr. Hafez Ghanem, Assistant Director-General, FAO, who opened his presentation by providing statistics on food increases: the FAO Food Price Index rose 36 per cent between December 2006 and December 2007, with the most significant increases in dairy products, oils and grains. He explained that increases are not uncommon but that this episode is different for a variety of reasons, most importantly because the increase is across so many commodities
4

rather than just one or two. He added that higher price volatility was another difference. He attributed the price increases to a number of a number of supply and demand issues. On the supply side there is the decline in production from 2004 to 2006, in terms of aggregate world output and more importantly with respect to the eight major exporting countries. Another supply issue is the very low level of stocks in the world. Since mid 90s countries have been reducing stocks of food commodities for a variety of reasons, but the reduction has been much more significant in the last ten years. (For example, in 2000 world stock level of cereals was 630 million tons; today it is about 400 million tons.) With this low level of stock, it is difficult to deal with productions shortages, which are translated and magnified into price increases. Another supply issue is the increase in fuel prices, which results in a significant cost push effect on agricultural commodity prices because of fertilizer, energy and transport costs. High fuel prices also have an effect on demand for agricultural commodities, with many countries pursuing policies that encourage greater biofuel production, thus diverting commodities into biofuel. Another reason for price increases is the higher demand for food, especially cereals, and particularly in developing countries that are experiencing income growth.
Mr. Ghanem went on to speak about the future, and what we can expect. He explained that prices will not fall back to their original levels, since much of what we are seeing is not only due to shocks, but to structural changes in the market. One immediate impact will be on developing countries and the cost of imports and the balance of payments. He estimated that cost of imports had risen by 20 percent in the last year and said that projections for next year are 37 percent. Some countries respond by reducing imports, which translates into fewer commodities for consumption. Another impact is on households in developing countries, in both urban and rural areas. Net consumers of food who are poor will be more vulnerable to poverty and hardship. Mr. Ghanem concluded by stating that policies have to address this situation and provide safety nets for the most vulnerable groups. He also stated that farmers must be helped to seize the opportunities created by higher food prices.
The next presentation was given by Mr. Bruno Losch, Senior Economist, The World Bank/CIRAD, who opened his remarks by saying that we are dealing with an old question – the question of managing food supply, which has always been a main concern of societies and governments, since the management of food is a key to stability and civil peace. He reminded that the organization of trade today is the result of changes that have occurred since the launch of the Uruguay Round in 1986, especially with respect to the organization of international markets. He mentioned that before the Uruguay Round and its outcome – the Marrakech Agreement - food markets were managed outside the paradigm of liberalized markets and that food and food security were at the centre of public policies. Under the exceptions granted to agriculture by the GATT, food and food security were managed through public policies such as supply management, input subsidies, price controls and marketing boards. Now times have changed and public policy options are clearly limited to tariffs (with many international constraints related to the WTO framework) and exchange rates. Consequently price transmission is more direct. Parallel to trade reform, Mr. Losch also insisted on the structural dimensions of the
5
globalization process and its consequences on the agro-food system, with deeper integration at both levels of value chains and distribution of food (better known as the supermarket revolution). Progressive concentration occurs with new oligopolies – the root cause of Tortilla Crisis in Mexico – which are now increasingly dominating the food chain with a deeper connection between domestic and international levels. This large integration facilitates more demand driven markets, resulting in higher requirements, with new standards and norms. This major change represents important opportunities for access to new and farer markets, but also many constraints for those who cannot deal with the new rules of the game.
Then, Mr. Losch went on to talk about the current market situation. He reiterated that changes in world prices present opportunities for producers, provided they can adapt to a more competitive environment. He stated that the pillars of competitiveness are the well-known cost of production, and also the quality of products and the volume of production itself. In this regard there is a huge asymmetry among farmers, since only a limited number of them can enter competitively in the market in terms of cost, quality and quantity. Additionally, transaction costs and poor infrastructure are hampering access to markets and only those producers who are in a better position from a capital and technical point of view will be able to benefit. Today, the challenge is to give access to these market opportunities to the greatest number of farmers possible – which means inclusive public policies providing public good and technical support.
Mr. Losch concluded by stating the world agriculture is primarily family farming, with 1.3 billion people working in agriculture and providing livelihood to 45 per cent of the world’s population. These are the people who need targeted public-sector support in terms of special programs, credit, extension services, farm insurance, and risk management. And this is the condition to help and smooth the transition towards a more diversified economy.
The next presentation was given by Mr. Ibrahim Assane Mayake, Director of West Africa HUB, who focused on public policy in western Africa. He mentioned that the causes of price increases can be classified in three categories – demand, supply and transportation – but that in western Africa an analysis grid is needed that that takes into account other points, given the context of increased uncertainty and the need for strong impact analyses. He then asked whether price increases be a factor for reform in agricultural policies and, if so, under what conditions, since the phenomenon is illustrative of what is happening in our public policies, and the way we react to it will reveal our institutional capacities. He also stated that traditional reactions and measures for managing such phenomena do not favour poor rural households, which are the most adversely affected. Rather, they define short term actions that are not exhaustive or comprehensive and do little to help poor households. Mr. Mayake spoke about aid systems, and the way they normally operate, asking whether it is possible for aid systems to have more finely tuned instruments to face this problem. He explained that aid systems have to be placed in the right position with respect to upstream and downstream effects, and that the idea of direct aid to smallholder farmers needs to be explored a new paradigm of agricultural policies, as well as social protection for the poorest segments society.
6

He also mentioned the building up of regional markets in western Africa following CAP, and how there is a need for it to advance further in order to help public reaction to price rises. Mr. Mayake concluded his presentation by reiterating that the impact of price increases and the way we handle them is extremely revelatory of our public policy, and shines a glaring light on our policies and their shortcoming and inadequacies.
The final presentation was given by Mr. Olegario Carrillo Meza, National Executive Director, National Union of Farmers’ Regional Autonomous Organizations of Mexico. Mr. Meza stated his conviction that poverty, inequality and the exclusion of millions of farmers and small producers are the result of the design and application of public policies that have been decided by governments. He then described the situation in Mexico, the maize-growing centre where there is enormous concern about the appropriation of all the sources of energy, water and land that are taking place. He explained that in recent months there has been a new movement on the rise to protest the total commercial opening of Mexico that started in January 2008. In 1994, the Mexican government signed an agreement with the US and Canada which should not have included the agricultural sector, and protests were held before the agreement against the corruption taking place to benefit large companies. He added that between 1994 and 2006, the prices for producers of maize increased 27 per cent, and incomes increased as well. But production has increased 450 per cent, and the price for the tortilla has increased 750 per cent. He also explained that the credits to the farming sector have decreased enormously. Commercial banks have invested only 1.6 per cent in agriculture, and the so-called development banks only 0.3 per cent. This has an enormous impact on small producers, as to the higher interest rates. He went on to explain that migration from farms has increased enormously – in 1994 30,000 farmers migrated to the US, whereas today there are 500,000 farmers trying to migrate. In addition, purchasing power is much less. All of these impacts are the result of the so-called free trade agreement.
Mr. Meza stated that the free trade agreement and the price of fuel are the main contributors to the social and economic crisis in Mexico, and stated that biofuel will have an additional negative effect on the poorest families. He concluded by saying that this imbalance is not acceptable and that policies are needed that address it, with perhaps a new economic model that upholds food sovereignty and helps people regain purchasing power.
3. Plenary discussions
Approximately 165 people participated in this round table. The main issues that emerged during the plenary discussions after the presentations are summarized below.
Increasing smallholder production and competitiveness. High prices could serve as an incentive for small farmers to produce more. At the same time, an increase in production could lower prices. Production potential of small farmers is very significant, but they must be assured that high prices will trickle down to them.
7

One means of achieving higher producing is through producers’ organizations. If we actually want the smallholder to benefit from increased commodity prices, there is need for us to examine how we can enable them to be included in input markets, to increase their power at the marketplace. Again, this revolves around getting them organized. Do we see organizations of smallholders as an important infrastructure? This is what governments and international institutions need to focus on and invest in.
Investments at farm level. To increase production farmers need better access to land, water, low-cost technology, markets and microcredit in order to move from subsistence agriculture to a market economy to diversify the production to include high-value crops. Issues of quality also come into play, as well as the entire realm of infrastructure, including roads and market outlets. Clearly quite a bit financial and technical investment will be required, along with an enabling policy framework.
Enabling policies. Setting up public policy is not based on one rationale. It has many rationales, some of them good and some of them bad. It is fundamental look back to look at the role of all actors in setting up public policy. We must work with all the actors, and in this regard strengthening producers, organizations are critical. It is a terrible shame that so many countries are dogged by public policies designed by international agencies and not by the countries themselves. The producers are not taken into account and do not participate in policy design.
Impact of higher prices on food security. Many smallholders are net buyers who sell during harvest, but are forced to buy during the lean season, when prices are higher. Many poor people spend up to 70 per cent of their income on food, and clearly high food prices will have a negative effect on their food security and nutrition. The cost of food and fuel has increased by over 70 per cent over last five years.
Price stability boards vs. social safety nets. Price stability boards have worked fairly well, and these could be in option for the future, rather than social safety nets, which are very costly and oriented toward the short term. The CAP has been working toward this, and MERCOSUR and ECOWAS, and if they were better managed, these could be a more viable option. Are there any other policy options? For example, is urban agriculture an option or is it simply “pie in the sky”?
Capacity building of public authorities. In addition to strengthening the capacity of farmers and their organizations, capacity building is also necessary for public authorities. They need support from the UN and other agencies to formulate policies, to form vertical partnerships, and to develop effective policy analysis instruments.
Short- vs. long-term orientation. The substantial, the fundamental, can only be solved in the long term. There is a need for short-term solutions when there is a crisis, and on a pragmatic level this means a reallocation of resources. Money will have to be taken from somewhere – from health or education. The choice in the short-term is never a choice that guarantees there will be a consistent long-term policy to follow.
8

II. Summary of the round table discussion and recommendations presented to the Governing Council Based on the round table discussion, a summary statement and recommendations was prepared and presented to the Governing Council. The summary is provided below. Round table 3 – Growing demand on agriculture and rising prices of commodities: An opportunity for smallholders in low-income, agriculture-based countries? • Commodity prices will remain high for at least a decade owing to structural
changes in supply and demand. Therefore responses must address the short-, medium- and long term challenges and opportunities. Negative impacts will be felt strongly among poor producers, the majority of whom are net buyers and not net sellers.
• Historically, smallholder producers have shown resilience in commodity price increases, and their potential to increase production is significant. The key is to ensure that price increases are transmitted to the level of smallholder producers.
• Policy options for increasing opportunities for smallholders include reducing transaction costs (e.g. through infrastructure), creating safety nets, and boosting productivity through public research, extensions services, and credit schemes.
• At the policy level, it is fundamental that organizations of poor rural people are active participants in the shaping of these public policies.
• Organizations of poor rural people need to be strengthened in order for them to increase their volumes going to the markets and to increase their bargaining power in the value chain.
9

10
III. Discussion Paper for Round Table
Growing demand on agriculture and rising prices of commodities An opportunity for smallholders in low-income, agricultural-based countries?
Paper prepared for the Round Table organized during the Thirty-first session of IFAD's Governing Council, 14 February 2008
Prepared by: the Trade and Markets and Agricultural Development Economics Divisions of the Food and Agricultural Organization of the United Nations The opinions expressed in this paper are those of the authors and do not necessarily reflect official views or policies of the International Fund for Agricultural Development, except as explicitly stated.

INTRODUCTION The recent rapid increases in the international prices of many basic food commodities have raised many questions from policy-makers, the media, the public, and the farmers who have the opportunity to benefit from the situation. Those who have the most reason to be concerned are the vulnerable people who have to adjust to the consequences of their decreased purchasing power, which in some cases, affect their ability to buy enough food to feed their families. The most frequently asked questions have been:
• Why are food prices rising? • What role has increased demand for biofuels played in the increases? • What kind of influence do “emerging economies” exert on the global food
markets? • Has climate change played a significant role in influencing those
developments? • Are the prices likely to continue rising in the future? • What is the impact of high world food prices - who benefits (e.g. producers)
and who loses (e.g. consumers)? • How are the policy-makers responding in order to cope with negative
consequences of those developments? This paper, prepared as background to the Round Table discussions at IFAD’s 31st Governing Council, provides a framework for focusing the discussions around the challenges identified and the policy options available to address those challenges. The sections have been order as follows: a brief description of the developments; a qualitative assessment of the various factors that may have underpinned those developments; a brief look into the likely future developments highlighting the uncertainties surrounding such an exercise; the nature of possible impacts at the country and household levels; and finally, some policy options that may instigate and guide the discussions at the Round Table. A BRIEF ASSESSMENT OF RECENT DEVELOPMENTS IN GLOBAL FOOD MARKETS:
1. THE FACTS Agricultural commodity prices rose sharply in 2006 and continued to rise even more sharply in 2007. While the FAO food price index rose on average 9 percent in 2006 compared with the previous year, in 2007 it increased by 23 percent compared to 2006. In fact, comparing December 2006 to December 2007, the increase in the value of the index was 37 percent. The surge in prices has been led by dairy, which on average increased by nearly 80 percent, then by oils with nearly 50 percent and grains with 42 percent. The only exception was the price of sugar, which declined by 32 percent, after having increased by over 20 percent over the 2005-2006 period. High price events, like low price events, are not rare occurrences in agricultural markets, although often, high prices tend to be short lived compared with low prices,
11

which persist for longer periods.1 What distinguishes the current state of agricultural markets is the concurrence of the hike in world prices of not just a selected few, but as noted above, of nearly all major food and feed commodities (Figure 1) and the possibility that the prices may continue to remain high after the effects of short-term shocks dissipate. The price boom has also been accompanied by much higher price volatility than in the past, especially in the cereals and oilseeds sectors, highlighting the prevalence of greater uncertainty in the market. Yet the current situation differs from the past in that the price volatility has lasted longer, a feature that is as much a result of supply tightness as it is a reflection of ever-stronger relationships between agricultural commodity markets and other markets. Figure 1: Monthly FAO price indices for basic food commodity groups (1998-
2000=100)
0
50
100
150
200
250
300
350
1990
1991
1992
1993
1994
1995
1996
1997
1998
1999
2000
2001
2002
2003
2004
2005
2006
2007
Inde
x 19
98-2
000=
100
MEATDAIRYCEREALSOILSSUGAR
These differences compared to the previous periods of agricultural price hikes suggest that the observed long-term decline in real prices could come to halt, signalling a structural change in agricultural commodity markets. Deflating the FAO price index with the index of unit value of global exports of manufactured goods indicates that there has been a gradual recovery of real food prices beginning in 2000 and increasing sharply from 2006: the average growth rate over the 2000-2005 period of 1.3 percent per year jumped to 10 percent over the past two years. However, it is too early to determine whether the observed change is permanent or temporary. Perhaps a qualitative assessment can be made by analyzing the changes in the fundamentals underpinning the developments observed over the past two seasons. However, it must be stressed at the outset that there is no single factor that can be identified as being the main one responsible. Nor is it possible to make a
1 The last significant price boom for agricultural commodities began in early-1995 affecting mainly cereals, peaked in 1996 and dissipated quickly afterwards, bottoming out at the beginning of 2000.
12
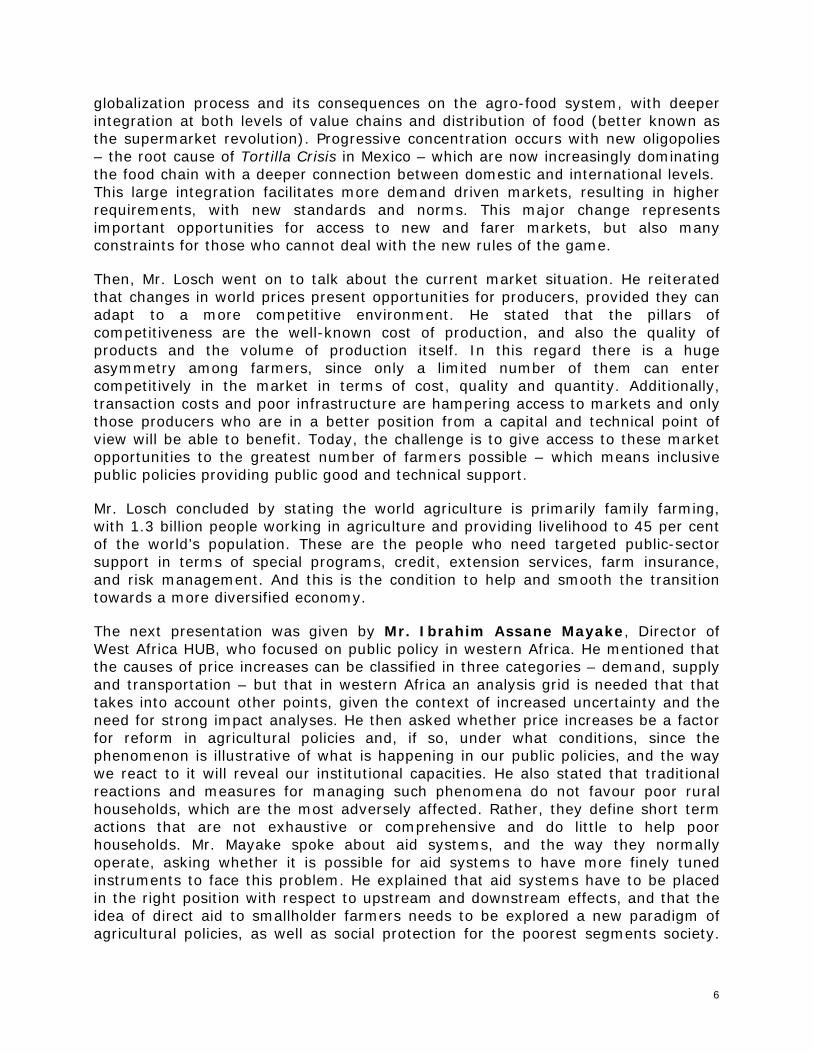
quantitative assessment of the contributions of the factors that have been influential over the past two seasons. Figure 2: Annual FAO Food Price Index 1998-2000=100
50
80
110
140
170
200
1990
1991
1992
1993
1994
1995
1996
1997
1998
1999
2000
2001
2002
2003
2004
2005
2006
2007
Year
Inde
x 19
98-2
000=
100
Nominal Real
2. FACTORS UNDERLYING THE CURRENT STATE OF THE MARKETS Nevertheless, it is possible to identify the important contributors. It appears that a confluence of different forces has created the unique developments that have been observed over the past two seasons. These can be summarized as follows: On the supply side Weather-related production shortfalls. Although global cereal output reached record levels in 2004, it declined by 1 and 2 percent respectively in 2005 and 2006. But more importantly, from the perspective of the international markets, the output in eight major exporting countries, which constitute nearly half of global production, dropped by 4 and 7 percent during the same period. However, there was a significant increase in cereal output in 2007, responding to the higher prices. The production of major exporters of all the other major food commodity groups, on the other hand, was not affected in a similar way during the same period. The quick supply response for cereals in 2007 came at the expense of reducing productive resources to, and hence output of, oilseeds, especially soybeans.
13

Table 1: Production in major exporters of basic food commodities
2004 2005 2006 2007 '000 tonnes 1,038,325 1,001,221 932,527 1,041,992 % change -3.6 -6.9 11.7 '000 tonnes 281,589 293,097 306,387 288,762 % change 4.1 4.5 -5.8 '000 tonnes 196,050 203,317 208,057 209,601 % change 3.7 2.3 0.7 '000 tonnes 370,986 378,730 383,840 394,459 % change 2.1 1.3 2.8 '000 tonnes 76,882 93,451 103,101 102,139 % change 21.6 10.3 -0.9
Cereals 1
Oilseeds 2
Meat 3
3 Includes Argentina, Australia, Canada, China, EU, India, New Zealand, Uruguay and USA. 4 Includes Argentina, Australia, Canada, EU, India, New Zealand, Ukraine, and USA. The production is expressed in milk equivalents.5 Includes Australia, Brazil, Colombia, Cuba, EU, Guatemala, India, South Africa, Thailand
Dairy 4
Sugar5
2 Includes Argentina, Australia, Bangladesh, Canada, China, EU, India, Pakistan, Russian Federation, South Africa, Turkey and USA. The total includes only soybeans, rape seed and suflow er seed production.
1 Includes Argentina, Australia, Canada, EU, India, Pakistan, Thailand and USA. Rice is in milled equivalents.
Stock levels2. Another factor on the supply side that has had a significant impact on the markets recently is the gradual reduction in the level of stocks, mainly of cereals, since the mid-1990s. Indeed, since the previous high-price event in 1995, global stock levels have on average declined by 3.4 percent per year (Annex Figure A1). There have been a number of changes in the policy environment after the Uruguay Round Agreements that have been instrumental in reducing stock levels in major exporting countries: the size of reserves held by public institutions; the high cost of storing perishable products; the development of other less costly instruments of risk management; increases in the number of countries able to export; and improvements in information and transportation technologies.. When production shortages occur in consecutive years in major exporting countries under such circumstances, as happened in 2005 and 2006 for cereals (Figure 3), international markets tend to become tighter and price volatility and the magnitude of price changes become magnified when unexpected events occur. This is one of the important reasons why the international prices of cereal prices spiked so sharply in 2005. And it is expected to continue to remain at these high levels, at least until next season. By the close of the seasons ending in 2008, world cereal stocks are expected decline a further 5 percent from their already reduced level at the start of the season, reaching the lowest level since 1982, when the level of utilization was much less than it is today. The stock situation for oils/fats and meals/cakes began to deteriorate after the spillover effects from developments in the cereals markets, especially of wheat and coarse grains, which started in late 2006.
2 The summary in this section for cereals comes from FAO (2008) and FAO (2007).
14

Figure 3: Cereals stocks and ratios of major exporters
-
50
100
150
200
250
300
350
1981
1982
1983
1984
1985
1986
1987
1988
1989
1990
1991
1992
1993
1994
1995
1996
1997
1998
1999
2000
2001
2002
2003
2004
2005
2006
2007
2008M
illio
n to
nnes
0
10
20
30
40
50
60
Perc
enta
ge
Closing Stocks Stocks-to-disappearance Increasing fuel costs. The increases in fuel prices have also raised the costs not only of producing agricultural commodities, but also of transporting them. The increase in energy prices have been very rapid and steep, with the Reuters-CRB energy price index more than doubling over a period of three years since the middle of 2004. Freight rates have also doubled, mainly within a one-year period beginning February 2006.3 On the demand side Changing structure of demand4. It is widely accepted that economic development and income growth in important emerging countries have been gradually changing the structure of demand for food commodities (especially in China and India). Diversifying diets are moving away from starchy foods towards more meat and dairy products, which is intensifying demand for feed grains and strengthening the linkages between different food commodities.5 It takes seven to nearly eight-and-a-half kilos of grain to produce one kilogramme of beef, and five to seven kilogrammes of grain to produce one kilogramme of pork. In China, for example, per capita meat consumption has increased from 20 kg in 1980 to 50 kg now. However, these changes are taking place gradually and are not likely to the cause of the sudden spike that began 2005. Indeed, looking at China and India, since 1980, the imports of cereals have been trending down, on average by 4 percent per year, from an
3 For both IGC Grain Freight and Baltic Dry indices see International Grains Council, as quoted in FAO (2007, ibid. p. 45). 4 Not only change in structure of demand but also the continuing increase in population, and the process of urbanization, especially in developing countries, play an important role in intensifying demand for food over the long term. For example, global population has been increasing by 78.5 million annually (mostly in developing countries). 5 FAO (2004).
15

average of 14.4 million tonnes in the early 1980s to 6.3 million tonnes over the past three years. This means that the growth in feed demand in these two countries, at least up to now, has been met from domestic sources.6 This is not to downplay the importance of the impact of changing consumption patterns on the global cereal markets over the longer term: the growth rate of cereal production during the 1980-2007 periods increased on average 2 percent per year, while the increase for feed use, without any structural breaks, has averaged over 3.5 percent per year. Biofuels and agricultural commodities. The emerging biofuels market is a new and significant source of demand for some agricultural commodities such as sugar, maize, cassava, oilseeds and palm oil. These commodities, which have predominantly been used as food, are now being grown as feedstock for producing biofuels. Significant increases in the price of crude oil allow them to become viable substitutes in certain important countries that have the capacity to use them. This possibility is increasingly leading to the implementation of public policies to support the biofuels sector, which further encourages the demand for these feedstocks. Analyses of the links between weekly prices of gasoline, ethanol, maize and sugar, and between diesel and important vegetable oil such as palm, soybean and rapeseed, suggest that there are statistically significant inter-linkages between the relevant markets. The schematic below summarizes those relationships and contains information about the empirical paths of influence revealed by the analysis. It is obvious that fossil fuel markets appear to exert direct influence on the feedstock markets in all cases.7 Price discovery in bio-fuel markets* *Solid line refers to significance at the 5 percent level, dashed refers to significance at the 10 percent level. The arrow signifies the direction of causality. Operations on financial markets. Market-oriented policies are gradually making agricultural markets more transparent. Derivatives markets based agricultural markets offer an expanding range of financial instruments to increase portfolio
6 The important emerging countries on the supply side have been Brazil and the Russian Federation, both of which have seen their exports of cereals booming, with a yearly average growth rate of nearly 21 percent since 1991 (rising on average from 1.4 million tonnes in the early 1990s to 18.9 million tonnes over the past three years). 7 In the case of maize based ethanol, there is no empirical relationship between the biofuel and its feedstock discovered, most likely because of the heavy policy interventions in the relevant sectors (i.e. border protection, taxation, investment and mandatory blending policies) being applied during the period of analysis, as well as a general lack of development in the systems of distribution and use of the ethanol as substitute for gasoline in most countries. In the case of sugar based ethanol, there is strong two way relationship between the biofuel and its feedstock, as Brazil, the biggest producer and user of sugar-based ethanol, has not been providing strong support to the biofuel related sectors recently and there are well developed and operational systems for distribution and flexible use of the biofuel. Because of lack of consistent price series for biodiesel, the statistical analysis was conducted using those of the fossil fuel and the feedstocks. The discovered relationships also indicate to the closeness of the substitution between different vegetable oils.
Sugar
Ethanol Oil
Maize
Ethanol Oil
Soybean Oil
Palm Oil Rapeseed Oil Diesel
16

diversification and reduce risk exposures. The abundance of liquidity in certain parts of the world that reflect favourable economic performances - notably among emerging economies, matched with low interest rates and high petroleum prices - make such derivatives markets a magnet for speculators for spreading their risk and pursuing of more lucrative returns. This influx of liquidity is likely to influence the underlying spot markets to the extent that they affect the decisions of farmers, traders, and processors of agricultural commodities. It seems more likely, though, that speculators contribute more to raising spot price volatility rather contributing to price levels.8
Box 1: Effects of the increases in commodity prices on stocks, exports and imports of cereals and input costs in Africa Generally, production in most major cereal producing countries in Africa has not been adversely affected. However, since most countries in Africa are not food self-sufficient and must rely on imports, the increase in the price of food imports following the steep rise in world agricultural commodity prices will certainly increase their food import bills in the current season. So far the evidence on how countries in Africa are coping with high prices remains unclear. Despite occasional news about street riots and food inflation, it seems that generally imports are not interrupted by high world prices and that in most instances the governments have found the means to secure imports. Notwithstanding this situation, the real impact of importing food at current high prices is likely to be felt mainly on the balance of payment positions of the importing countries, the negative repercussion of which may not surface for still many more months to come.
WHAT CAN BE EXPECTED NEXT? The market developments observed over the past two seasons, and described above, seem to have been the result of short-term imbalances in some of the markets, spilling over to those that have close linkages, as well as of some factors that may continue to influence the markets for longer periods. The fact that the markets can adjust rather rapidly has already been demonstrated by the supply response observed in the maize and sugar markets, where increases in production at the global level led to temporizing the price increases in the former and to decreasing the prices in the latter in 2007. With many agricultural commodity markets continuing to be tight, and with stock levels low, the possibility of further sharp price hikes and continued volatility as a result of unforeseen events seems to be likely for the next few seasons. As opposed to other instances of sharp increases in agricultural commodity prices that have rapidly dissipated, however, we could be facing higher prices for some time. Of significance in this respect is the possibility of the persistence of demand for biofuels. This would depend on a number of factors, which at this moment cannot be assessed with any certainty: Since the initial increase in this source of demand has been triggered by the rise in the crude oil prices, sustenance of demand from this source will depend on future developments in energy markets. It will also depend on the rate of increase of both crude oil and feedstock prices. Since 70-80 percent of the cost of biofuels is constituted by the cost of the feedstock itself, if the feedstock prices begin increasing faster than the price of crude oil, 8 This conclusion is confirmed when comparing the changes in ‘implied’ volatilities of agricultural commodities calculated using the prices of financial instruments (i.e. options) that are based on them with the historical volatilities calculated using their spot prices. Using the derivates markets for wheat, maize and soybeans at Chicago Board of Trade, it has been observed that both types of volatility measures for these commodities have increased recently (FAO 2007, p. 54).
17
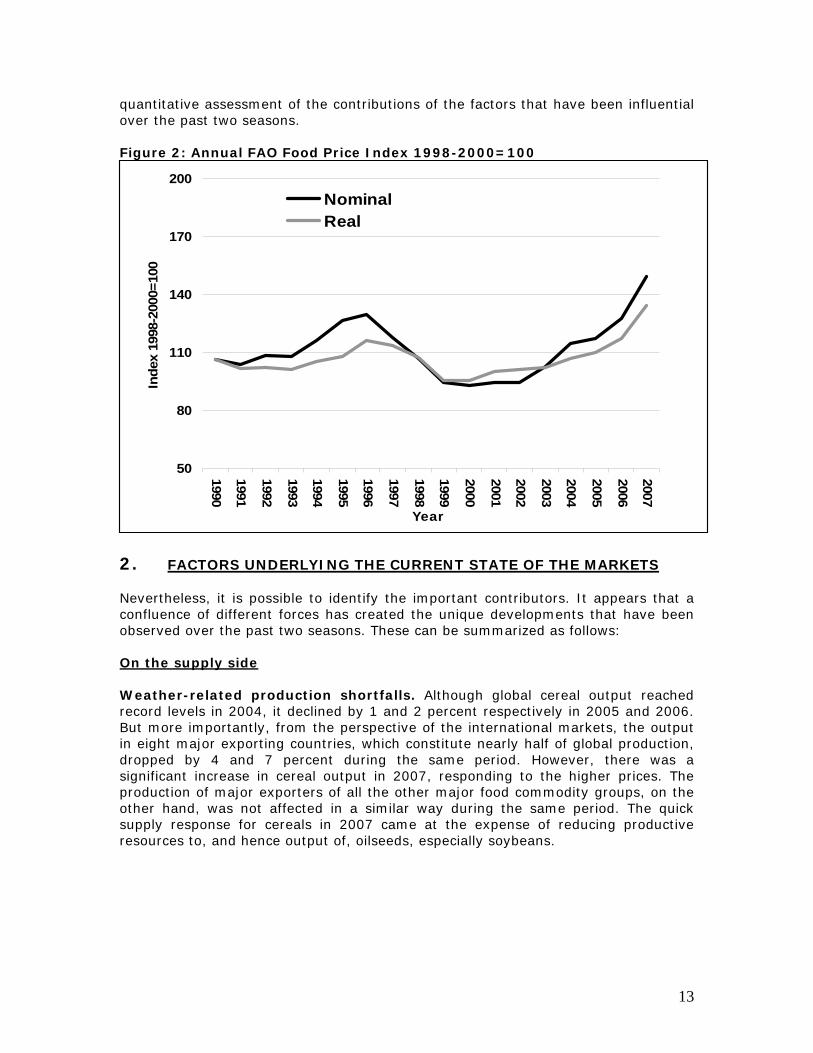
biofuels may cease to be competitive with fossil fuels. Thus, there would effectively be a ceiling above which agricultural feedstock prices cannot rise. But, as long as fuel prices increase at a rate above those of agricultural feedstocks, biofuel use will compete with food and other uses of these feedstocks and maintain the upward pressure on their prices.9 A great deal of effort is being expanded to develop and commercialize second generation (lignocellulosic) feedstocks that do not compete with agricultural products for land resources. These can be grown on marginal land – for example, switch grass in the USA, sweet sorghum in many developing countries such as India and China. However, many of the technological developments underway have a long way to go before they can be commercialized and used widely to relieve the pressure on demand for agricultural feedstocks.10 Other important factors that can be influential over the longer term: land and water resource constraints; the availability of technological developments to increase agricultural yields; the impact of climate change on agricultural yields in different parts of the globe,11 and population increase and urbanization. The historic long-term decline in real prices has continued so far because technological changes in agricultural production have always kept up with increases in demand for agricultural products. This is more true in the agriculture sector than in many other sectors of the economy. But those who benefited most from these technological changes have always been the early adopters of new or improved technologies. Others eventually merely caught up with the innovators. OECD and FAO are in the process of finalizing their annual exercise of deriving baseline medium-term projections using their AGLINK/COSIMO modelling framework. The framework has been expanded recently to incorporate modules for the sugar and biofuel sectors, enabling it to assess the impact of various policies that are being implemented in the biofuels sector. The projection exercise has not yet been completed, but initial estimates indicate that over the next ten years, prices of wheat is expected to increase by 2 percent; maize by 27 percent; rice by 9 percent; oilseeds by 23 percent; and skimmed-milk powder by 6 percent. Sugar is expected to decrease by -2.7 percent, mainly as a result of a record high price in 2005.12 This means, in effect, that most nominal prices are not expected to dissipate quickly, but to remain at similar levels to today’s prices. These are very similar to those obtained by IFPRI from its IMPACT model, using a scenario that reflects ‘assumptions based on actual biofuel production plans and projections in relevant countries and regions’.13
9 Schimdhuber (2006). 10 Flavell (2007). 11 There are already some estimates available for the impact suggesting that developing countries in general will see their cereal production decline by 3.3 to 7.2 percent between 1990 and 2080. The impact, however, is not expected to be uniform across different developing regions: with South Asia being the biggest loser losing 18.2 to 22.1 percent of its cereal output and Southeast Asia and sub-Saharan Africa losing roughly 3 to 7.5 percent. The only winner seems to be Latin America, with foreseen increase of 5.2 to 12.5 percent (von Braun 2007). 12 These estimates are those reflecting the baseline assumptions of the model and compare the projected prices to the average prices for the 2005-07 period. In real terms the changes are as follows: wheat, -6%; rice, +1%; maize, +18%; oilseeds, 14%; SMP, -2%; and sugar, -11%. 13 von Braun (2007, ibid. p. 8).
18
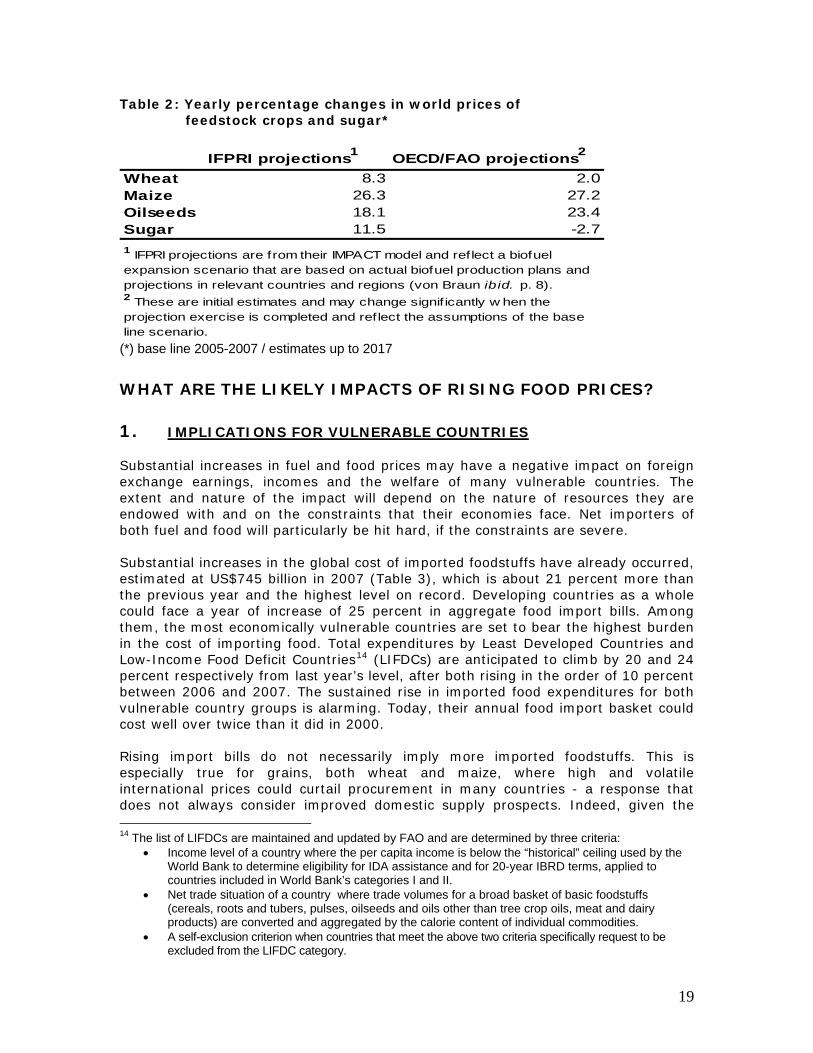
Table 2: Yearly percentage changes in world prices of feedstock crops and sugar*
IFPRI projections1 OECD/FAO projections2
Wheat 8.3 2.0Maize 26.3 27.2Oilseeds 18.1 23.4Sugar 11.5 -2.71 IFPRI projections are from their IMPACT model and reflect a biofuel expansion scenario that are based on actual biofuel production plans and projections in relevant countries and regions (von Braun ibid. p. 8).2 These are initial estimates and may change signif icantly w hen the projection exercise is completed and reflect the assumptions of the base line scenario.
(*) base line 2005-2007 / estimates up to 2017 WHAT ARE THE LIKELY IMPACTS OF RISING FOOD PRICES?
1. IMPLICATIONS FOR VULNERABLE COUNTRIES Substantial increases in fuel and food prices may have a negative impact on foreign exchange earnings, incomes and the welfare of many vulnerable countries. The extent and nature of the impact will depend on the nature of resources they are endowed with and on the constraints that their economies face. Net importers of both fuel and food will particularly be hit hard, if the constraints are severe. Substantial increases in the global cost of imported foodstuffs have already occurred, estimated at US$745 billion in 2007 (Table 3), which is about 21 percent more than the previous year and the highest level on record. Developing countries as a whole could face a year of increase of 25 percent in aggregate food import bills. Among them, the most economically vulnerable countries are set to bear the highest burden in the cost of importing food. Total expenditures by Least Developed Countries and Low-Income Food Deficit Countries14 (LIFDCs) are anticipated to climb by 20 and 24 percent respectively from last year’s level, after both rising in the order of 10 percent between 2006 and 2007. The sustained rise in imported food expenditures for both vulnerable country groups is alarming. Today, their annual food import basket could cost well over twice than it did in 2000. Rising import bills do not necessarily imply more imported foodstuffs. This is especially true for grains, both wheat and maize, where high and volatile international prices could curtail procurement in many countries - a response that does not always consider improved domestic supply prospects. Indeed, given the 14 The list of LIFDCs are maintained and updated by FAO and are determined by three criteria:
• Income level of a country where the per capita income is below the “historical” ceiling used by the World Bank to determine eligibility for IDA assistance and for 20-year IBRD terms, applied to countries included in World Bank’s categories I and II.
• Net trade situation of a country where trade volumes for a broad basket of basic foodstuffs (cereals, roots and tubers, pulses, oilseeds and oils other than tree crop oils, meat and dairy products) are converted and aggregated by the calorie content of individual commodities.
• A self-exclusion criterion when countries that meet the above two criteria specifically request to be excluded from the LIFDC category.
19

firmness of food prices in the international markets, the situation could deteriorate further in the coming months, leading to reduced imports and consumption in many LIFDCs, especially in those countries where food inventories are already very low. Table 3: Forecast import bills of total food and major food commodities (US$
million)
2006 2007 2006 2007 2006 2007 2006 2007Total Food 614 887 744 777 185 529 232 814 13 362 15 937 86 473 107 236Cereals 174 399 240 784 69 410 93 603 5 683 7 185 29 450 38 258Vegetable Oils 70 956 96 100 35 050 47 236 1 945 2 659 22 884 32 107Dairy 43 666 71 916 12 930 21 278 801 1 302 4 924 8 115Meat 77 865 82 447 16 806 19 034 810 915 6 013 7 317Sugar 32 975 21 755 13 871 11 263 1 753 1 249 7 587 4 5251 Least developed countries2 Low-income food deficit countries
World Developing LDC1 LIFDC2
Since international food price increases were partly caused by (and were partly incidental to) increases in crude oil prices, it may be illustrative to identify countries that are not only net food importers but also net fuel importers. These countries are essentially in a lose-lose situation that can put severe constraints on their ability to import not only these essential products, which are necessary for the welfare of their populations, but also other goods and services required for future economic development. Another criterion was added by FAO for the selection of the countries to assess their vulnerability to food insecurity: those countries where the proportion of their population who are considered to be undernourished is greater than 30 percent. Table 3 indicates that there are more than 20 important developing countries, most of them located in Africa, which have large undernourished population groups and face significantly high fuel and food costs.
20
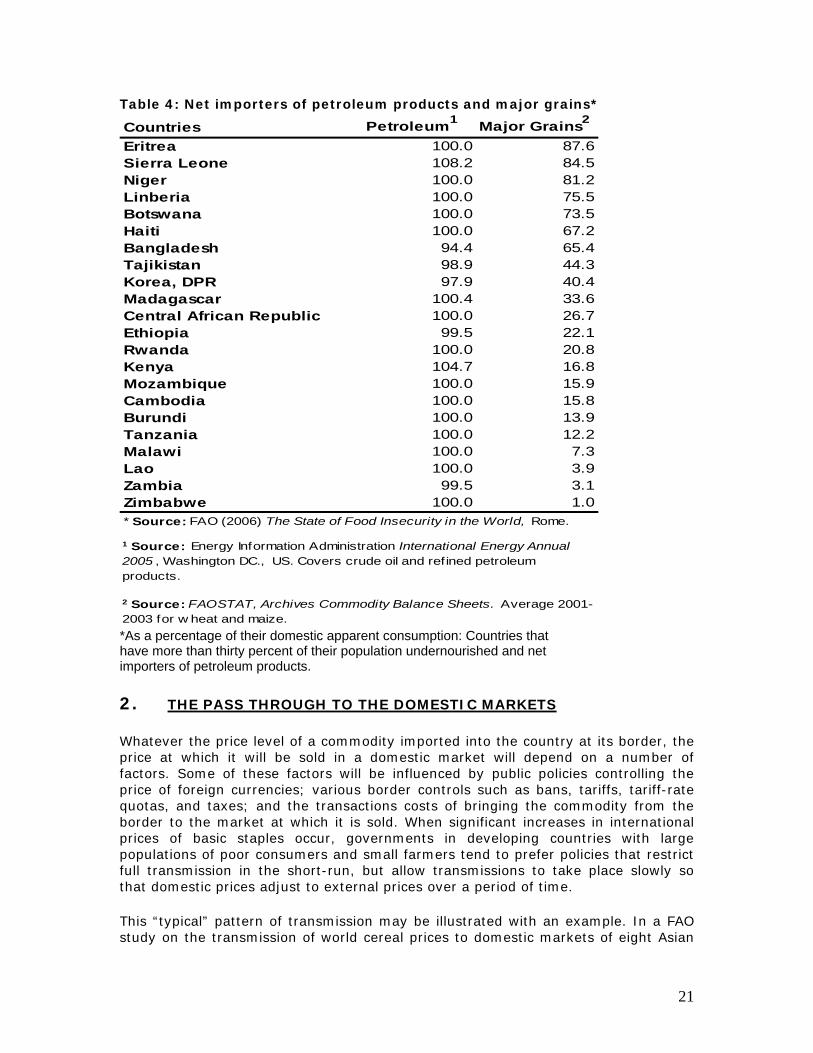
Table 4: Net importers of petroleum products and major grains*
Countries Petroleum1 Major Grains2
Eritrea 100.0 87.6Sierra Leone 108.2 84.5Niger 100.0 81.2Linberia 100.0 75.5Botswana 100.0 73.5Haiti 100.0 67.2Bangladesh 94.4 65.4Tajikistan 98.9 44.3Korea, DPR 97.9 40.4Madagascar 100.4 33.6Central African Republic 100.0 26.7Ethiopia 99.5 22.1Rwanda 100.0 20.8Kenya 104.7 16.8Mozambique 100.0 15.9Cambodia 100.0 15.8Burundi 100.0 13.9Tanzania 100.0 12.2Malawi 100.0 7.3Lao 100.0 3.9Zambia 99.5 3.1Zimbabwe 100.0 1.0
1 Source: Energy Information Administration International Energy Annual 2005 , Washington DC., US. Covers crude oil and refined petroleum products.
2 Source: FAOSTAT, Archives Commodity Balance Sheets. Average 2001-2003 for w heat and maize.
* Source: FAO (2006) The State of Food Insecurity in the World, Rome.
*As a percentage of their domestic apparent consumption: Countries that have more than thirty percent of their population undernourished and net importers of petroleum products. 2. THE PASS THROUGH TO THE DOMESTIC MARKETS Whatever the price level of a commodity imported into the country at its border, the price at which it will be sold in a domestic market will depend on a number of factors. Some of these factors will be influenced by public policies controlling the price of foreign currencies; various border controls such as bans, tariffs, tariff-rate quotas, and taxes; and the transactions costs of bringing the commodity from the border to the market at which it is sold. When significant increases in international prices of basic staples occur, governments in developing countries with large populations of poor consumers and small farmers tend to prefer policies that restrict full transmission in the short-run, but allow transmissions to take place slowly so that domestic prices adjust to external prices over a period of time. This “typical” pattern of transmission may be illustrated with an example. In a FAO study on the transmission of world cereal prices to domestic markets of eight Asian
21
countries during 1990s, which also included another episode of international price spikes for wheat, maize and rice during the 1995-96 period, it was found that price transmission was strongest for maize, followed by wheat, and least for rice.15 Moreover, short-run transmissions were very slow but there was a tendency for transmissions to be stronger in the longer run.16 This result was explained on the basis of cereal policies followed by the eight countries studied. In all Asian countries, rice is a special product for food security, and therefore governments resorted to a range of policies to insulate domestic prices from external shocks, high or low, and as a result estimated short-run elasticities were very low and statistically not significant. However, this was not the case for maize, which is a feed-grain in Asia. The case of wheat was in between – policy interventions were not as usual as was for rice. Indeed, looking at the period during the occurrence of the spikes and observing the nature of the policy responses,17 it is clear that they were designed to impede the process of transmission itself, through border policies, and, at the same time, took measures to offset the effects of the higher prices in the domestic markets. This has been recorded in an FAO survey conducted then to assess the situation. The policy responses in the current situation are similar, as illustrated by the examples cited in Table 5. For example, the data on domestic prices of some staples that are available for some countries in Africa similarly suggest that the pattern of price developments in the domestic markets of those countries do not exactly follow those observed in the international markets.18 If a full statistical study could be undertaken using more recent data also covering the current episode, it may well be discovered that the transmission is relatively stronger and faster now when compared to the earlier period.19 First, the natural protection that countries had due to high transaction costs must have fallen considerably since 1995 or 1996. Second, economies are more open now than they were then, for example, as measured by import to consumption ratios. Food import dependency in many developing countries has increased over time. Third, import regimes are now much more liberal than 12 years ago. At the same time, applied tariffs are much lower now than 12 years ago, and economies are more open due to regional trade agreements. Regardless of the type of policies implemented, it must be stressed that if the prices of most of these food commodities remain high, as is suggested might happen, it will be very difficult to sustain some of the policies to protect consumers. This is because the costs associated with maintaining them may be too high, especially for poorer countries, which may in itself improve the transmission of international prices to the domestic markets.
15 Sharma (2002). 16 Similar conclusions are noted in Conforti (2004) and an earlier study on price transmission for over 70 countries by Quiroz and Soto (1996). 17 Sharma (1996). 18 See USAID (2008). 19 Some support to this conjecture is contained in Rapsomanikis et al (2003).
22
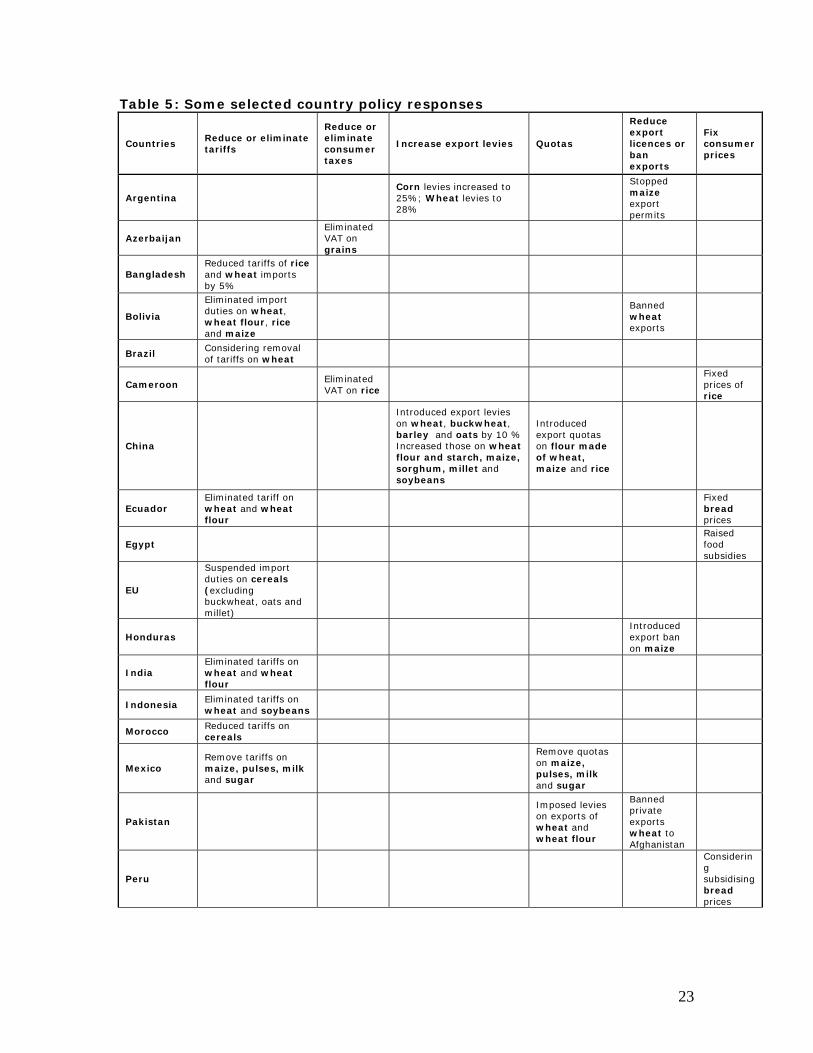
Table 5: Some selected country policy responses
Countries Reduce or eliminate tariffs
Reduce or eliminate consumer taxes
Increase export levies Quotas
Reduce export licences or ban exports
Fix consumer prices
Argentina Corn levies increased to 25%; Wheat levies to 28%
Stopped maize export permits
Azerbaijan Eliminated VAT on grains
Bangladesh Reduced tariffs of rice and wheat imports by 5%
Bolivia
Eliminated import duties on wheat, wheat flour, rice and maize
Banned wheat exports
Brazil Considering removal of tariffs on wheat
Cameroon Eliminated VAT on rice
Fixed prices of rice
China
Introduced export levies on wheat, buckwheat, barley and oats by 10 % Increased those on wheat flour and starch, maize, sorghum, millet and soybeans
Introduced export quotas on flour made of wheat, maize and rice
Ecuador Eliminated tariff on wheat and wheat flour
Fixed bread prices
Egypt Raised food subsidies
EU
Suspended import duties on cereals (excluding buckwheat, oats and millet)
Honduras Introduced export ban on maize
India Eliminated tariffs on wheat and wheat flour
Indonesia Eliminated tariffs on wheat and soybeans
Morocco Reduced tariffs on cereals
Mexico Remove tariffs on maize, pulses, milk and sugar
Remove quotas on maize, pulses, milk and sugar
Pakistan
Imposed levies on exports of wheat and wheat flour
Banned private exports wheat to Afghanistan
Peru
Considering subsidising bread prices
23

Republic of Korea
Reducing tariffs on wheat and maize; eliminating those on soybeans and feed maize
Turkey
Reduced tariffs on wheat and maize; eliminated that on barley
3. INCREASED FOOD PRICES: THREATS AND OPPORTUNITIES FOR
HOUSEHOLDS Country-level impacts tend to mask important differences among socioeconomic groups and typologies of households within countries. Higher food prices can substantially hurt poor net food consumers because food accounts for a very large share of their expenditures. Indeed, in many countries, food can account for 70 percent to 80 percent of expenditures by the poorest quarter of the population. In such circumstances, food price increases can have a large negative impact on their purchasing power20. Urban poorer households, - wage earners and net buyers of food - are likely to be negatively affected by the higher costs of their food consumption. The transmission of price changes is expected to take effect earlier in urban areas, as most of them are close to ports or are well connected to the rest of the world. While nearly all urban dwellers are net food consumers, not all rural dwellers are net food producers. In fact, farmers with very small holdings and agricultural labourers are often net consumers of food, as they do not own enough land to produce sufficient food for their families. There are many such people in rural areas throughout the world. Farmers who are net food producers are likely to benefit from higher prices assuming that food price increases “trickle down” to the farm-gate. Since farming is the major source of income for a large part of the rural population in most developing countries, higher prices could help to alleviate rural poverty, provided that producers are integrated into the market, with the benefits being related to the size of farms and the access to other agricultural resources (seeds, fertilizer, machinery, etc.) that will allow farmers to respond to higher prices. In areas where agriculture is key to overall rural growth, increases in food production and productivity will be translated into secondary multiplier effects to rural non-farm activities and employment in sectors linked to agricultural production. The size of this multiplier effect will depend on the share of the increased agricultural rents that is ultimately invested and spent in rural areas. This benefit will likely be offset by the reduced investment from net food consumers in those same rural areas. The net outcome on employment will depend on the nature of shifts in relative prices for different types of food and the relative labour intensity of the different production systems.
20Higher staple food prices cause families to buy fewer more nutritious foods such as eggs, vegetables, meat and milk in a struggle to maintain their caloric intake. This can have potentially detrimental effects on nutrition and health. The adverse effects on children may persist into adulthood, permanently affecting the productive capacity of these people and their countries.
24

Unless agriculture is a major component of the total GDP of agriculture-based countries, it is unlikely that the beneficial economy-wide effects of increased food production will offset in a major way the negative direct effects of increased prices on the urban poor. In the face of a sustained rise in food prices and in the absence of countervailing measures, the short- to medium-term effects on urban poverty and food security will be negative. Thus the effects of increased prices on rural and urban poverty and food insecurity should be distinguished from those of a productivity-led growth in the sector that results from improved technologies, especially those geared towards small farmers. The latter having more unequivocal positive effects on poverty and food security directly and through linkages between agriculture and other sectors. It is thus necessary to make sure that price incentives are translated into increased productivity in order to have widespread positive effects. In order to analyze the implications of increased food prices for the poor, it is necessary to account for the basic livelihood characteristics, since they are expected to drive any welfare outcomes. The effects of soaring prices on household welfare can change in the medium- and long-term. The immediate impact on consumption is expected to be negative and this outcome hurts mainly the poorer households that allocate most of their consumption expenditures to food. The degree of the welfare impact will depend on how the prices of various items change: if they all change in the same direction and magnitude, the effect on welfare will be unequivocally negative, but if they do not, the substitution in consumption between different food items will mitigate some of the loss in welfare. It is not possible a priori to determine the net effect without having complete information about the quantities purchased, and the possibilities to move to other consumption items.21 It is also difficult to balance the changes in the production mix of farmers with the effects in their consumption attitudes as a result of price increases. Finally, the effect on nutrition is not easy to capture. In particular, increases in prices of specific food items may divert households to cheaper and perhaps less nutritious items. Detailed data on shares of food items produced and consumed and their nutrient equivalence, are necessary to identify effects on the nutritional dimension of food security. Food production in developing countries is usually labor intensive, utilizing mainly unskilled labor. As long as food prices are effectively transmitted at the farm gate then the expanding sector is expected to increase its demand for labor and subsequently wage earners in agriculture are also expected to gain if increases in wages outpace the net decline in real purchasing power. This outcome is particularly important given that poverty assessment analysis frequently recognizes the poorest as the landless, irregular wage earners in agriculture. In regions where land constraints are binding, such as rice production in Asia, increases in the price of the fixed factor should also be considered. The spatial transmission of changes in prices in the domestic markets in developing countries, although similar in nature to the transmission from the border to the domestic markets, still exhibits certain differences. High costs due to poor internal transportation infrastructure may significantly delay and hinder all the changes in prices to arrive at the farm gate. If districts or communities are sufficiently market- 21 An attempt to measure these different effects is implemented by Son and Kakwani, (2006).
25

oriented in order to sell food crops, but if the food market is highly concentrated (monopsony), then producers will appropriate only a small part of the price increases, allowing only minor welfare improvements. The underlying risk and the variance of income and consumption that price increases generate in rural areas are also important, as they are not only quite extensive but usually remain uninsured, making consumption smoothing difficult. This makes many households vulnerable to food insecurity, even if they are not food insecure under normal circumstances, which also leads to adopting less risky but low-return strategies that hamper innovation. Measuring the quantitative impact of price increases on welfare, food security and poverty, especially for vulnerable groups, is a task that can not be done with utmost precision. This is due to the complexity of the factors that need to be considered; the shortage of relevant data, especially in developing countries where information is already scarce; and the difficulty of developing a consistent framework within which all the different interrelationships can be assessed. Keeping that in mind, the Rural Income Generating Activities (RIGA) database22 has been employed in this section to at least identify likely affected groups. The RIGA database includes Living Standard Measurement Survey (LSMS) data that are representative at country level, for more than 15 developing countries. From among them, Bangladesh and Malawi have been employed to serve as illustrative examples for the purposes of this analysis. A simple methodology is employed below to provide some preliminary evidence regarding the short-term effects of price increases. The methodology accounts for the net market position of the households (seller or buyer of the basic staple), in order to identify the impact on household welfare, and is further described in the appendix. Quantifying the short-term impact of price changes on welfare Bangladesh: The short-term impact of a 10 percent increase in the price of rice on the net income of households by expenditure quintile seems to suggest that both urban and rural households face welfare losses. The losses are higher in the lower quintiles. The estimate of -3.19 percent in the lowest per capita expenditure quintile in Table 6, for example, indicates the extent of the decline in the purchasing power of households in that quintile after taking into account the impact of both the increase in the revenue on the production side and the increase in the expenditure on the consumption side of an increase in the price of rice. It is also observed that a rural household exhibits higher welfare losses than an urban household from the increase in rice prices. In particular, the households in the poorest rural quintile in Bangladesh earn on average 63 percent of their income from on- and off-farm wages. Furthermore the vast majority of them are net food buyers; only 12 percent are net food sellers. These characteristics identify households that are highly vulnerable to increases in food prices, and as expected, experience high welfare losses when confronted with increases in rice prices. The loss for the urban poorest quintile is somewhat lower and this can be justified by the fact that less than
22 Further information on the database can be found in http://www.fao.org/es/ESA/riga/index_en.htm
26
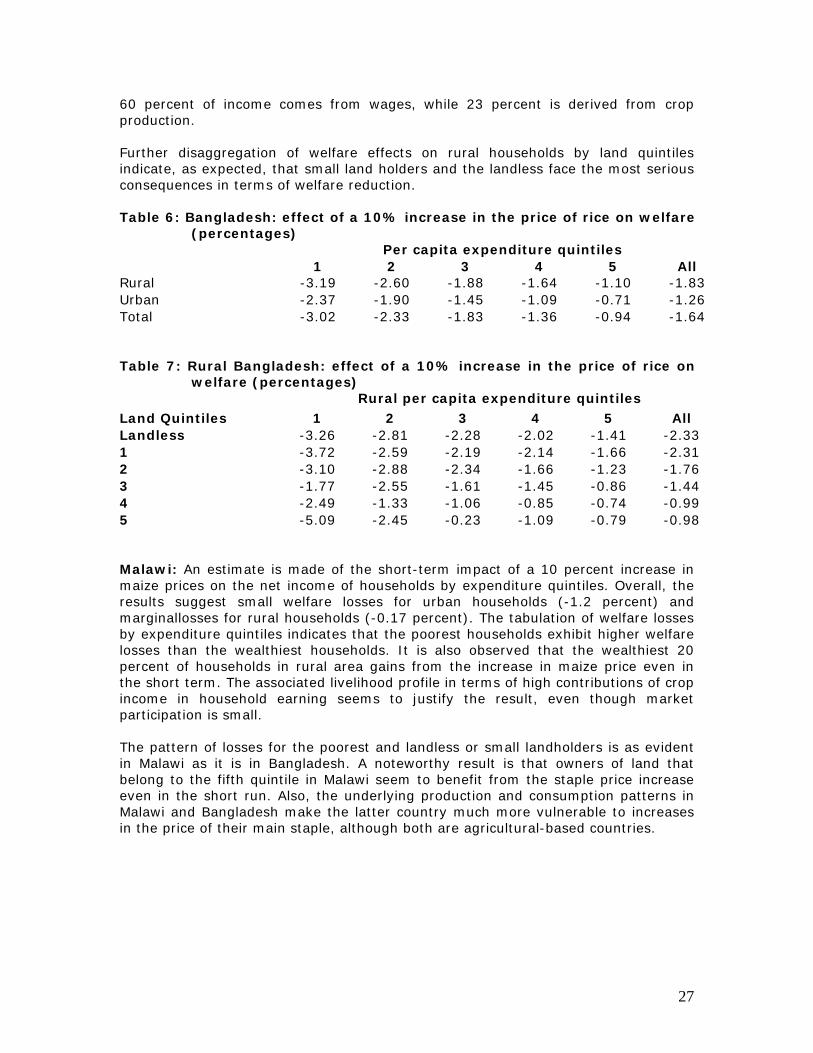
60 percent of income comes from wages, while 23 percent is derived from crop production. Further disaggregation of welfare effects on rural households by land quintiles indicate, as expected, that small land holders and the landless face the most serious consequences in terms of welfare reduction. Table 6: Bangladesh: effect of a 10% increase in the price of rice on welfare
(percentages) Per capita expenditure quintiles 1 2 3 4 5 All Rural -3.19 -2.60 -1.88 -1.64 -1.10 -1.83 Urban -2.37 -1.90 -1.45 -1.09 -0.71 -1.26 Total -3.02 -2.33 -1.83 -1.36 -0.94 -1.64 Table 7: Rural Bangladesh: effect of a 10% increase in the price of rice on
welfare (percentages) Rural per capita expenditure quintiles Land Quintiles 1 2 3 4 5 All Landless -3.26 -2.81 -2.28 -2.02 -1.41 -2.33 1 -3.72 -2.59 -2.19 -2.14 -1.66 -2.31 2 -3.10 -2.88 -2.34 -1.66 -1.23 -1.76 3 -1.77 -2.55 -1.61 -1.45 -0.86 -1.44 4 -2.49 -1.33 -1.06 -0.85 -0.74 -0.99 5 -5.09 -2.45 -0.23 -1.09 -0.79 -0.98 Malawi: An estimate is made of the short-term impact of a 10 percent increase in maize prices on the net income of households by expenditure quintiles. Overall, the results suggest small welfare losses for urban households (-1.2 percent) and marginallosses for rural households (-0.17 percent). The tabulation of welfare losses by expenditure quintiles indicates that the poorest households exhibit higher welfare losses than the wealthiest households. It is also observed that the wealthiest 20 percent of households in rural area gains from the increase in maize price even in the short term. The associated livelihood profile in terms of high contributions of crop income in household earning seems to justify the result, even though market participation is small. The pattern of losses for the poorest and landless or small landholders is as evident in Malawi as it is in Bangladesh. A noteworthy result is that owners of land that belong to the fifth quintile in Malawi seem to benefit from the staple price increase even in the short run. Also, the underlying production and consumption patterns in Malawi and Bangladesh make the latter country much more vulnerable to increases in the price of their main staple, although both are agricultural-based countries.
27

Table 8: Malawi: effect of a 10% increase in the price of maize on welfare (percentages)
Per capita expenditure quintiles 1 2 3 4 5 All Rural -1.23 -0.57 -0.23 -0.02 0.53 -0.17 Urban -2.56 -1.95 -1.38 -1.19 -0.22 -1.12 Total -1.26 -0.64 -0.37 -0.23 -0.13 -0.35 Remarks on welfare impacts at the household level The findings for Malawi and Bangladesh constitute a preliminary test of robustness regarding the effects of soaring prices on poverty. The results suggest that potential short-term losses and gains in household welfare are country specific. Closer attention needs to be paid to the household characteristics as consumers and producers of any given staple food. Net buying positions in the food markets associated with low market participation that characterizes not only the case studies in this paper but the majority of the developing economies could explain the welfare losses in rural and urban areas. Household access to resources and household income composition matters significantly in explaining these findings. Moreover, unless strong substitution effects towards cheaper food items are present, in the short-term, the majority of the households will see their welfare deteriorating. The net food seller position characterizes only a small proportion of relatively wealthier (non poor) and market-oriented rural households of the developing world. Thus poverty rates are expected to increase initially. However, when the production structure adapts to the price changes, welfare gains for some specific household categories could be significant. The households that earn their livelihood from production of crops, such as self-employed farmers and pastoralists, will be able to appropriate wider marketing margins. The efforts to increase production could create general equilibrium effects, which may diffuse benefits to household groups that are owners of other production factors necessary to increase production (casual wage labourers in agriculture). Nevertheless, soaring prices may generate overall economic growth, especially in agriculture-based countries, if there exist sufficiently developed market infrastructure that could allow wider marketing margins to be reaped by small-holder farmers. In view of the expanding opportunities for increased profitability, if the agricultural sector can exploit its comparative advantage, then its expansion linked to other sectors of the economy may contribute to overall growth. Increasing market participation. The net market position of the household, (seller or buyer of food), appears to be critical in determining the impact of soaring prices on consumption and welfare. Increasing market participation may assist in appropriating benefits and, on the other hand, minimizing losses, especially when farmers or casual agricultural wage earners are considered. The reasons behind low rates of market participation and implications for policy are discussed presently. Standard explanations in economic literature attribute the issue of small market participation to inadequate levels of investment in the necessary institutions to build free markets and the appropriate infrastructure (market places). Increased transaction costs of this kind are acting as a barrier to entry, reducing market
28
participation. At the household level, evidence suggests that market participation increases with the level of wealth, the use of modern production technologies, access to credit and collective power that may be the outcome of associations of producers. Reducing volatility may be another reason behind low market participation rates. In particular, it may be that households want to reduce the underlying price volatility that characterizes the commodities they produce. In other words households try to be self-sufficient, since producing for the market may turn out to be harmful if they are not insured against undesired price changes. Investment in institutions and physical infrastructure in order to develop adequately functioning competitive markets allows the price increases to arrive to the farm gate. Meeting this precondition allows greater market participation. Given the increases in food prices, it also assists in providing to the farmers the incentives to expand their production and increase their productivity. Furthermore interventions that facilitate producers’ organizations to increase collective power, and reduce transactions costs could be beneficial to increase the benefit from prices’ increases for smallholder farmers.23 If access to assets for the poor is promoted, increasing market participation can be achieved. The benefits from increased market participation refer not only to wider marketing margins (in contrast with self-consumption), but may also motivate further expansion in the scale of production.24 FACING THE CHALLENGE: POLICY AND PROGRAMME OPTIONS The mixed effects of soaring food prices on household welfare and food security points to a set of options for policies, programmes and investments to be undertaken by the global community, national governments and other stakeholders. Short-term measures should aim at reducing prices in domestic markets, mitigating their negative effects and boosting supply response to higher prices. At the same time, higher prices provide an opportunity for re-launching agriculture in developing countries through long-term public investments and programmes which will, in turn, catalyze private sector investments in response to higher profitability. Over the long term, the best way to reduce food prices is to increase agricultural productivity through public investment in agricultural research, rural education, and rural infrastructure to create efficient markets. The design of innovative risk management instruments such as weather insurance can also increase productivity. While these investments will not reduce food prices in the short term, it is important to keep these longer-term measures in mind or else sustainable food security will not be achieved. Thus, whenever possible, short-term measures should be designed to complement long-term investment needs, e.g. targeting food distribution by linking it to education (school meals) or the construction of irrigation or rural roads. Higher prices increase the value of agricultural assets held by the poor and facilitate their access to credit. However, an increase in the value of agricultural assets (such
23 Barrett C., (2008),. 24 Empirical research estimated the welfare loss resulting from production of subsistent goods, to reduce income by above 30 percent while the transport cost from local market to the nearest city is greater than 15 percent on average.
29
as land) makes them less accessible to the poor and increases the incentives exclusion of the economically and socially weak. Securing access to land and strengthening the rights of the poor to agricultural assets and resources (land, water) should be high on the agenda of all stakeholders, both government and civil society organizations. In the medium term, to avoid monopsonistic behaviours over the value chain, and to raise the share of price increase for producers, it is important to strengthen the institutions and organizations of smallholder farmers. Empowering smallholders’ organizations in the market and in value chain would not be limited to vertical integration by smallholder producer organizations, and to “shortening the chain” for higher added-value to producers. It is also about increasing the control that farmers’ organizations have over chain governance to reduce vulnerability vis-à-vis cost/price squeezes, evolving competition and changing consumer preferences. Distribution of food vouchers or administration of targeted subsidies to the urban poor and to rural non-food (or deficit) producers reduces the negative effects on their diets and nutrition. Use of vouchers may reduce the administrative burden on governments relative to distribution of subsidized food. Such measures presuppose that necessary food supplies are present (for example, through de-stocking or imports) in order to prevent further price increases that will hurt the poor who do not receive vouchers or subsidies. However, such programmes are not always simple to administer and can suffer from leakages and insufficient targeting. Policies and programmes to increase supply response to higher prices by smallholders (especially net consumers) may have important effects on their production and income and hence their ability to access food. They could also have beneficial impacts on prices in local markets that are not well connected to larger or international markets. Many small farmers, for reasons of risk, lack of properly functioning markets or poverty, use inputs such as seed and fertilizer in suboptimal amounts. One option might be an ‘inputs for work’ programme, which has a higher probability of being self-targeted. Input vouchers are another option, provided inputs are available in large quantities, or vouchers will simply create inflation in local input prices. It will be essential to consult with the private sector, both for short-term effectiveness and medium-term catalysis: the private sector offers the only realistic hope of being able to scale up successful approaches quickly.
30

Bibliography
Barrett C. (2008), “Smallholder Market Participation: Concepts and Evidence from Eastern and Southern Africa”, Food Policy, forthcoming. Conforti, P. (2004) Price Transmission in Selected Agricultural Markets, FAO Commodity And Trade Policy Research Working Paper No. 7, Rome, Italy. and an earlier study on price transmission for over 70 countries (see J. Quiroz and R. Soto (1996), International Price Signals in Agricultural Markets: Do Governments Care? Unpublished mimeo FAO (2004) Cereals and other starch-based staples: Are consumption patterns changing?, Document CCP:GR-RI/04/4, Rome, Italy. FAO (2007) Food Outlook, No. 2, Rome, Italy. FAO (2008) Crop Prospects and Food Situation, No. 1, Rome, Italy, to be published. Flavell, R., Biotechnology Options for Bioenergy Crops, paper presented at the “USDA Global Conference on Agricultural Biofuels: Research and Economics, Minnesota, 20-22 August, 2007. GERENS and ILADES (Georgetown University). Rapsomanikis, G., Hallam, D., & Conforti, P., (2003). Market integration and price transmission in selected food and cash crop markets of developing countries: review and applications. In FAO, Commodity Market Review, FAO Commodities and Trade Division, Rome. Sharma, R. (1996) Review of Cereal Price Situation in Selected Developing Countries in 1995-96 and Policy Measures to Offset the Price Rise, occasional paper Number 1, 1996, Commodities and Trade Division, FAO, Rome. Sharma, R. (2002) The transmission of world price signals: concepts, issues and some evidence from Asian cereal markets, paper presented at the OECD Global Forum on Agriculture, May 2002, Rome. USAID (2008), WEST AFRICA Food Security Alert and CILSS (2007), Bulletin regional du marché des produits agricoles. Son, H. and Kakwani, N., (2006), Measuring the impact of price changes on poverty, INDP Poverty Center, Working Paper no. 33. Schimdhuber, J. (2006) Impact of an increased biomass use on agricultural markets, prices and food security: A longer-term perspective, paper presented at the “International Symposium of Notre Europe”, Paris, 27-29 November, 2006. von Braun, J. (2007) The World Food Situation: New Driving Forces and Required Actions, IFPRI, Washington DC).
31
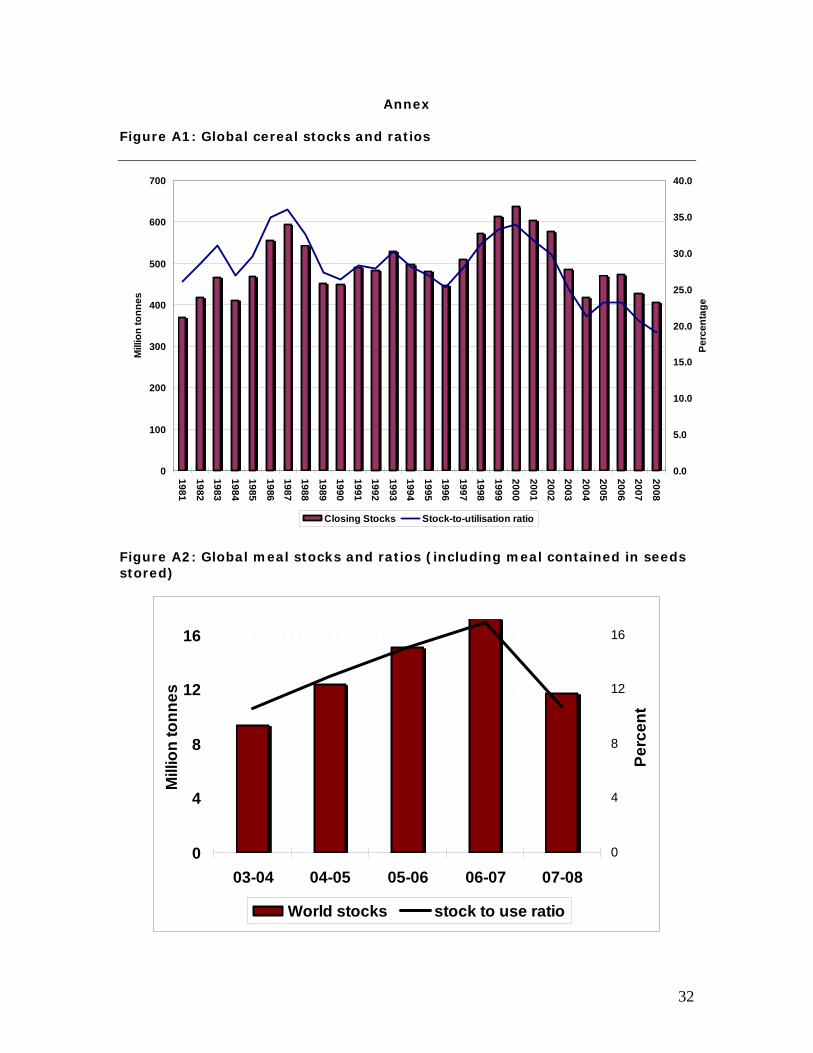
Annex
Figure A1: Global cereal stocks and ratios
0
100
200
300
400
500
600
700
1981
1982
1983
1984
1985
1986
1987
1988
1989
1990
1991
1992
1993
1994
1995
1996
1997
1998
1999
2000
2001
2002
2003
2004
2005
2006
2007
2008
Mill
ion
tonn
es
0.0
5.0
10.0
15.0
20.0
25.0
30.0
35.0
40.0
Perc
enta
ge
Closing Stocks Stock-to-utilisation ratio
Figure A2: Global meal stocks and ratios (including meal contained in seeds stored)
0
4
8
12
16
03-04 04-05 05-06 06-07 07-08
Mill
ion
tonn
es
0
4
8
12
16Pe
rcen
t
World stocks stock to use ratio
32

Figure A3: Global oil stocks and ratios (including oil contained in seeds stored)
0
4
8
12
16
20
03-04 04-05 05-06 06-07 07-08
Mill
ion
tonn
es
0
4
8
12
16
Perc
ent
World stocks stock to use ratio`
33
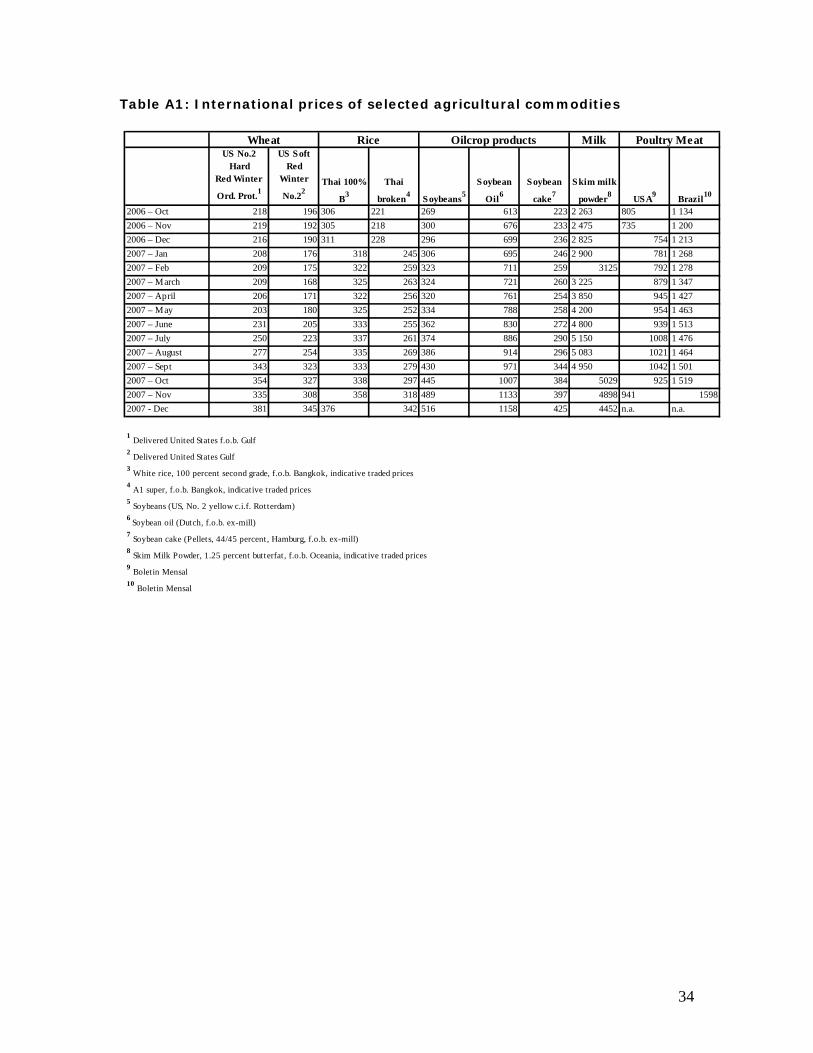
Table A1: International prices of selected agricultural commodities
MilkUS No.2
HardUS Soft
RedRed Winter
Ord. Prot.1Winter
No.22
2006 – Oct 218 196 306 221 269 613 223 2 263 805 1 1342006 – Nov 219 192 305 218 300 676 233 2 475 735 1 2002006 – Dec 216 190 311 228 296 699 236 2 825 754 1 2132007 – Jan 208 176 318 245 306 695 246 2 900 781 1 2682007 – Feb 209 175 322 259 323 711 259 3125 792 1 2782007 – March 209 168 325 263 324 721 260 3 225 879 1 3472007 – April 206 171 322 256 320 761 254 3 850 945 1 4272007 – May 203 180 325 252 334 788 258 4 200 954 1 4632007 – June 231 205 333 255 362 830 272 4 800 939 1 5132007 – July 250 223 337 261 374 886 290 5 150 1008 1 4762007 – August 277 254 335 269 386 914 296 5 083 1021 1 4642007 – Sept 343 323 333 279 430 971 344 4 950 1042 1 5012007 – Oct 354 327 338 297 445 1007 384 5029 925 1 5192007 – Nov 335 308 358 318 489 1133 397 4898 941 15982007 - Dec 381 345 376 342 516 1158 425 4452 n.a. n.a.
1 Delivered United States f.o.b. Gulf2 Delivered United States Gulf3 White rice, 100 percent second grade, f.o.b. Bangkok, indicative traded prices4 A1 super, f.o.b. Bangkok, indicative traded prices5 Soybeans (US, No. 2 yellow c.i.f. Rotterdam)6 Soybean oil (Dutch, f.o.b. ex-mill)7 Soybean cake (Pellets, 44/45 percent , Hamburg, f.o.b. ex-mill)8 Skim Milk Powder, 1.25 percent butterfat, f.o.b. Oceania, indicative traded prices9 Boletin Mensal10 Boletin Mensal
Brazil10Soybean
Oil6Soybean
cake7 Skim milk
powder8 USA9Thai 100%
B3Thai
broken4 Soybeans5
Wheat Rice Oilcrop products Poultry Meat
34