group annual results - · pdf file2 fy 15 highlights achievements group annual results for...
TRANSCRIPT

TELKOM SA SOC LIMITED Group Annual Results for the year ended 31 March 2015
I
For the year ended31 March 2015
Group Annual Results

ii
GROUP ANNUAL RESULTS PRESENTATION
01 Overview 1
O2 Business Performance 4
O3 Financial Overview 11
O4 Prospects 18
05 Questions 20
Telkom SA SOC Limited (Registration number 1991/005476/30)JSE share code: TKG ISIN: ZAE000044897
Group Company SecretaryXoliswa Mpongoshe
Transfer secretariesComputershare Investor Services (Proprietary) LimitedPO Box 61051, Marshalltown, 2107
SponsorThe Standard Bank of South Africa LimitedStandard Bank Centre5 Simmonds Street, Johannesburg, 2001
DirectorsJA Mabuza (Chairman), SN Maseko (Group Chief Executive Officer), DJ Fredericks (Chief Financial Officer), I Kgaboesela, K Mzondeki, T Dingaan, G Dempster, S Botha, R Tomlinson, N Ntshingila, K Kweyama, F Petersen, N Kapila*India, LL Von Zeuner
Contents
The information contained in this document is also available on Telkom’s investor relations website www.telkom.co.za/ir
Our purpose
Seamlessly connectSouth Africans to a better life

Group Annual Results for the year ended 31 March 2015 1Group Annual Results for the year ended 31 March 2015 1
Integrated Report
For the year ended 31 March 2015������
Group Annual Results�For the year ended
31 March 2015
Overview�Sipho Maseko: Group Chief Executive Officer�
Group Annual Results for the year ended 31 March 2015� 2�

2
FY 15 Highlights�
Achievements�
Group Annual Results for the year ended 31 March 2015� 3�
*Excluding retrenchment expenses, VSPs/VERPs, PRML curtailment and related tax�
Total dividend of
245cps�Net revenue up
3,1% to R26 billion�
Group net debt decreased
92,8%�to R151 million�
Free cash ow generated, increased
signicantly to R3,9 billion�
Operating costs decreased 5,2%
in real terms�
EBITDA, excluding one-off items,
improved
15,1% to R9 billion
�
Margin of 28,3%�
FY 15 Highlights�
Challenges�
Group Annual Results for the year ended 31 March 2015� 4�
*Excluding retrenchment expenses, VSPs/VERPs, PRML curtailment and related tax�
Fixed-line voice and interconnection
revenue decreased 11,9% to R8,3 billion�
Fixed voice usage revenue
declined by 13,5%� Leased lines
revenue declined by
22,0%�
Increased Competition�
Group Annual Results for the year ended 31 March 2015 3
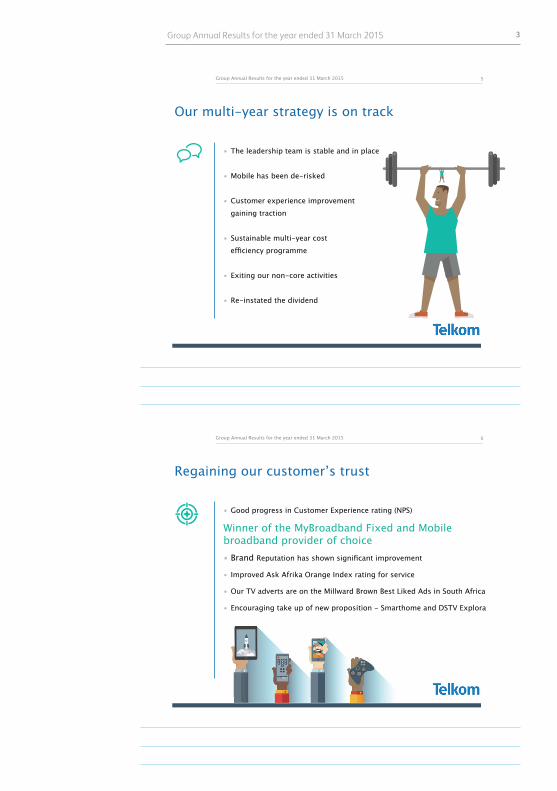
Our multi-year strategy is on track�
• The leadership team is stable and in place�
• Mobile has been de-risked�
• Customer experience improvement gaining traction�
• Sustainable multi-year cost efficiency programme�
• Exiting our non-core activities �
• Re-instated the dividend�
Group Annual Results for the year ended 31 March 2015� 5�
Regaining our customer’s trust
Group Annual Results for the year ended 31 March 2015 6
• Good progress in Customer Experience rating (NPS)
Winner of the MyBroadband Fixed and Mobile broadband provider of choice • Brand Reputation has shown signicant improvement
• Improved Ask Afrika Orange Index rating for service
• Our TV adverts are on the Millward Brown Best Liked Ads in South Africa
• Encouraging take up of new proposition - Smarthome and DSTV Explora

4
Business Performance�
Sipho Maseko: Group Chief Executive Officer�
Group Annual Results for the year ended 31 March 2015� 7�
Consumer

Group Annual Results for the year ended 31 March 2015 5
We have de-risked Mobile�
All metrics in Mobile continue to show robust improvements�
• Mobile EBITDA improved by 48,7%�• Mobile data revenue increased 50,6% to R988 million�
• Active Mobile subscribers increased 21,2% to over 2 million – blended ARPU R75,05�
• Minutes of use increased 79%�• Data usage grew 70% �
�
Group Annual Results for the year ended 31 March 2015� 9�
Fixed Consumer gaining traction �
Enhanced value propositions bring about improvements in xed business�
• Residential DSL subscribers increased 7,4%�• Growth in xed line data revenues �
• Net revenue increased by 12%�• Internet subscribers grew by 9%�• Smarthome converged offers to drive data usage
i.e. smart devices, mobility and video (DStv Explora)�
Group Annual Results for the year ended 31 March 2015� 10�

6
Group Annual Results for the year ended 31 March 2015� 11�
Well positioned for new customer trends�
Group Annual Results for the year ended 31 March 2015� 11�
Mobile voice and data traffic orders�
- �
50 �
100 �
150 �
200 �
250 �
300 �
350 �
Apr�Jun�Aug�O
ct�D
ec�Feb�Apr�Jun�Aug�O
ct�D
ec�Feb�
Voice� Data�
• More than 21% of Prepaid mobile customers prefer integrated data products�
• Customers moving from 3G to LTE use on average 36% more data�
• Customers with both mobile and xed services increased 101% over the year�
Relevance of true convergence�
Convergence inevitable to provide competitive service offering �
• Mitigates voice usage deterioration�
• Offers bundled and bespoke solutions�
• Leverage off shared resources �– Call centre �– Direct stores�– End-to-end solutions on one network�
• One seamless retail offering for our customers�
Group Annual Results for the year ended 31 March 2015� 12�

Group Annual Results for the year ended 31 March 2015 7
Business
Business revenue slowdown�
Slowdown in data connectivity revenues, with a marked decline in voice usage �
• Data connectivity revenues R81 million lower �
• Metro-ethernet revenues increased 39,8%�• Managed data network services revenue increased 13,8%
to R1 046 million�
• Business IT services revenue increased 82,4% to R633 million�
• Converged Solution revenues increased by 650% off a low base�
Group Annual Results for the year ended 31 March 2015� 14�

8
Group Annual Results for the year ended 31 March 2015 15
Business convergence KPIs
Group Annual Results for the year ended 31 March 2015 15
0
2
4
6
8
10
12
14
16
Thousands
Cumulative performance 2014 vs 2015
Actual Total Sales Total Customers Total Services
Strengthening the core�
Awaiting the outcome of the Competition Tribunal on the BCX transaction�• The deal with BCX will support growth by expanding our business into ICT services�
• Once approved by Competition Tribunal, integration will be swift�
• Maintain BCX as a separate operational entity within Telkom�
• Signicant opportunity to leverage off the respective client base�
• BCX skills and certications are aligned to Telkom’s strategy for future growth�
Group Annual Results for the year ended 31 March 2015� 16�

Group Annual Results for the year ended 31 March 2015 9
Wholesale and Networks
Wholesale and Networks�
Continued self-provisioning putleased line revenues under pressure�• Revenue from leased line facilities declined 22,0%�• Increased competition in bre products and offerings�
• Good traction with FTTH�• Wholesale unit price reductions of up to 63% across our product range:�– Including Wholesale Fibre Broadband Access, IP Connect, Resell DSL,
Metro Ethernet and SAIX dedicated access offerings�
• 1 005 286 connected broadband customers: Group ADSL subscribers increased 7,9% �
Group Annual Results for the year ended 31 March 2015� 18�

10
Group Annual Results for the year ended 31 March 2015 19
Increased broadband penetration
Group Annual Results for the year ended 31 March 2015 19
• 20Mbps, 40Mbps and 100Mbps Wholesale bre broadband access in selected areas
• First to market in terms of LTE-A roll out
• Ports activated via MSAN access grew
103%• Contributed to the upgrade of the
SAT-3/WASC/SAFE submarine cable system
1 030 519homes passed1�
1 As at 31 March 2015�
964 196active ports1�
1 317 LTE sites
integrated1�
6 100�WiFi �
hotspots1�
PRETORIA�
CAPE TOWN�
DURBAN�
JOHANNESBURG�
Driving higher utilisation of the network�
Building a more efficient network�
• Competitive pricing to stimulate demand�
• Build portfolio of value-added services�
• Optimise the network�
• Increase speeds and capability �
Group Annual Results for the year ended 31 March 2015� 20�

Group Annual Results for the year ended 31 March 2015 11
Financial Overview�
Deon Fredericks: Chief Financial Officer�
Group Annual Results for the year ended 31 March 2015� 21�
Normalised earnings
F2015 F2014
Prot for the year 2 889 3 590
Prot on PRML - (2 169)
VERP/VSP and retrenchment 591 -
Tax on VERP/VSP and retrenchment expenses (165) -
Tax benet on PRML (546) (246)
Normalised Prot 2 769 1 175
Normalised HEPS 532,5 332,9
Group Annual Results for the year ended 31 March 2015 22

12
Financial highlights�
Revenues have continued to stabilise in a tough operating environment�
• EBITDA increased 15,1% - Margin of 28,3%�
• Operating costs decreased 1,2% in nominal terms�− Staff efficiency program�− Benets of PRML�− Effective marketing spend�− Lower business transformation cost�
• Resolved tax matters resulting in lower effective rate�
• Strong cash ows�
Group Annual Results for the year ended 31 March 2015� 23�
Group Annual Results for the year ended 31 March 2015 24
FY15 Results
Group Annual Results for the year ended 31 March 2015 24
MarchRm
2015 2014 %
Operating revenue 31 675 31 288 1,2
Net revenue 25 958 25 167 3,1
Operating expenses 17 679 17 900 1,2
EBITDA 8 978 7 798 15,1
Depreciation and impairments 5 478 5 891 7,0
Capital investments 5 164 6 413 19,5
Free cash ow 3 898 1 145 240,4
Normalised headline earnings per share (cps) 532,5 332,9 60,0

Group Annual Results for the year ended 31 March 2015 13
Group Annual Results for the year ended 31 March 2015 25
Quality of earnings
Group Annual Results for the year ended 31 March 2015 25
MarchRm
2015 2014 %Prot for the year 2 889 3 590 19,5Net FTR/MTR impact after tax (522) (244) 113,9
Gain on sale of assets (257) (77) 233,8
Severance package costs 591 - -
Asset impairment - 392 -
Prot of the sinking fund (221) (344) 35,8
Curtailment gain on PRML - (2 169) -
Tax benet of PRML payment to insurer (546) (246) 122,0
Reversal of provision for legal dispute (121) - -
Tax on retrenchment cost (165) - -
Deferred tax asset (250) - -
Reversal of prior year tax provisions (337) 224 250,4
Adjusted prot for the year 1 061 1 126 5,8
Group Annual Results for the year ended 31 March 2015 26
De-risking the Business: Growth in Mobile and Data, stabilisation of voice rentals
Group Annual Results for the year ended 31 March 2015 2626
26%�
25%�11%�
3%�
33%�
2%�Voice usage and Interconnection
CPE
Data
Other
MobileSubscriptions
Contribution to group revenue (%)
Revenue at risk declined
Contributes 26%
(2014: 30%) of Group revenue�

14
Group Annual Results for the year ended 31 March 2015 27
Fixed voice usage continued to decline
Group Annual Results for the year ended 31 March 2015 27
17 745
7 934 7 812
491 1 508
17 082
6 867 8 005
717 1 493
Total voice and interconnection
Fixed Voice usage Fixed voice subscriptions
Mobile voice and subscriptions
Interconnection
Rmillion
20142015
3,7%
13,5% 2,5%
46,0% 1,0%
27
Group Annual Results for the year ended 31 March 2015� 28�
Data volumes improved�
Group Annual Results for the year ended 31 March 2015� 28�28�
873 395 931 858 1 005 286
2013*� 2014*� 2015*�
ADSL�
1 005
919
1 046
2013� 2014� 2015�
Managed data network sites�(revenue R million)�
10 080 16 389
24 850 32 804
2012� 2013� 2014� 2015�
Traffic volumes in TBytes�
Subs
crib
ers
7,9%
13,8%32,0%
* Restated to include internal lines�
Rmillion�
Group Annual Results for the year ended 31 March 2015 15
Group Annual Results for the year ended 31 March 2015 29
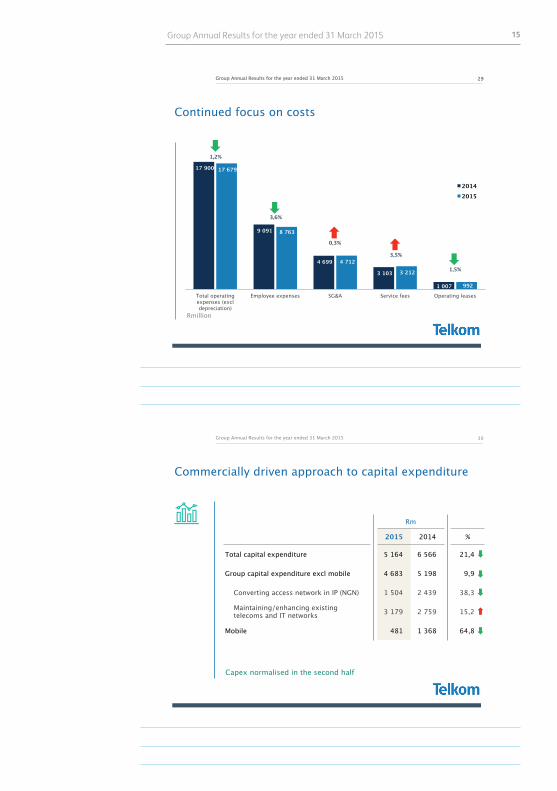
Continued focus on costs
Group Annual Results for the year ended 31 March 2015 29
17 900
9 091
4 699
3 103
1 007
17 679
8 763
4 712
3 212
992 Total operating expenses (excl depreciation)
Employee expenses SG&A Service fees Operating leases
Rmillion
20142015
29
1,2%
3,6%
1,5%
3,5%
0,3%
Capex normalised in the second half
Commercially driven approach to capital expenditure
Rm
2015 2014 %
Total capital expenditure 5 164 6 566 21,4
Group capital expenditure excl mobile 4 683 5 198 9,9
Converting access network in IP (NGN) 1 504 2 439 38,3
Maintaining/enhancing existing telecoms and IT networks 3 179 2 759 15,2
Mobile 481 1 368 64,8
Group Annual Results for the year ended 31 March 2015 30

16
Normalised cash ow from operations
Rm
2015 2014 %Cash ow from operating activities 6 347 6 490 2,2Competition Commission payments 291 291 -Package cost paid 325 710 54,2Payment to insurer of PRML 1 950 878 122,1Tax refund received - (854) -Normalised cash ow from operations 8 913 7 515 18,6Normalised free cash ow 3 898 1 145 240,4Cash at end of period 3 615 1 841 96,4Discretionary investments 3 502 3 016 16,1
Group Annual Results for the year ended 31 March 2015 31
We remain lowly geared with a net debt to EBITDA of 0,02x
Performance against guidance�
Guided Achieved�
Net revenue Stabiliseto grow� +3,1%�
EBITDA margin 26%-27%� 26,5%*�
Capex to revenue 14%-17%� 16,3%�
Net debt to EBITDA ≤ 1� 0,02�
Group Annual Results for the year ended 31 March 2015� 32�
*Including VSPs/VERPs and retrenchment cost of R591 million

Group Annual Results for the year ended 31 March 2015 17
FY2016 Guidance
F2015 A F2016
Net revenue +3,1% Stabilise
EBITDA margin 26,5%* 26%-27%
Capex to revenue 16,3% 15%-18%
Net Debt to EBITDA 0,02 1
Mobile EBITDA (R684m) Break-even
Group Annual Results for the year ended 31 March 2015 33
*Including VSPs/VERPs and retrenchment cost of R591 million The above have not been reviewed or reported on by the external auditors of the Company
The guidance excludes the impact of the conclusion of the MTN and BCX transactions
Reinstating the dividend�
Our dividend policy:�
• Dividends are considered on an annual basis based on the nancial performance of the Group, operating environment, growth opportunities, as well as debt and cash ow levels.�
• The total dividend for the year is 245cps��
Group Annual Results for the year ended 31 March 2015� 34�

18
Financial health for strategic exibility�
Our strong and healthy nancial position provides us with exibility and choice�• Mobile has been de-risked�
• Embedded a culture of efficiently deploying capital�
• Continued the strengthening of our balance sheet�
• Generated healthy cash ows�
• Low gearing�
Group Annual Results for the year ended 31 March 2015� 35�
Prospects�Sipho Maseko: Group Chief Executive Officer�
Group Annual Results for the year ended 31 March 2015� 36�

Group Annual Results for the year ended 31 March 2015 19
First phase of turnaround successful, more still to be achieved�
• Stabilised revenues�
• Dividend re-instated�
• De-risked mobile�
• Improved efficiencies�
• Disciplined capital allocation�
• Customer experience a priority�
• Specialised leadership team�
Group Annual Results for the year ended 31 March 2015� 37�
• Strengthen customer value proposition�
• Review operational business model�
• Ensure sustainable regulatory framework�
• Instill a high performance culture�
• Sustainable nancial performance�
What we have accomplished� Going forward�
Group Annual Results for the year ended 31 March 2015� 38�
Operating model optimisation�
Group Annual Results for the year ended 31 March 2015� 38�
Three stand-alone business units:�• A Consumer business focussing
on leading in home connectivity and services for our customers�
• An Enterprise business focusing on selling connectivity solutions to business customers�
• An Infrastructure wholesale business to run the network and associated IT, eld services and operations to service OLO’s�
Benets of separating the business:�• Removes complexity, simpler strategies
leading to better efficiencies�
• Greater accountability and encouraging the right business behaviours�
• Clear decision-making, allowing for faster solution delivery �
• Better leverage of infrastructure and
alignment of incentives to business unit goals�
• Greater value for shareholders�

20
www.telkom.co.za/ir
Questions
Group Annual Results for the year ended 31 March 2015 21
For the year ended31 March 2015
Group Annual Results

22
Special note regarding forward-looking statements 23
Group salient features 24
Key indicators 25
Overview 26
Operational data 29
Financial performance 30
Telkom SA SOC Limited (Registration number 1991/005476/30)JSE share code: TKG ISIN: ZAE000044897
Group Company SecretaryXoliswa Mpongoshe
Transfer secretariesComputershare Investor Services (Proprietary) LimitedPO Box 61051, Marshalltown, 2107
SponsorThe Standard Bank of South Africa LimitedStandard Bank Centre5 Simmonds Street, Johannesburg, 2001
DirectorsJA Mabuza (Chairman), SN Maseko (Group Chief Executive Officer), DJ Fredericks (Chief Financial Officer), I Kgaboesela, K Mzondeki, T Dingaan, G Dempster, S Botha, R Tomlinson, N Ntshingila, K Kweyama, F Petersen, N Kapila*India, LL Von Zeuner
Contents
The information contained in this document is also available on Telkom’s investor relations website www.telkom.co.za/ir
Our purpose
Seamlessly connectSouth Africans to a better life
Group Annual Results for the year ended 31 March 2015 23Group Annual Results for the year ended 31 March 2015 23
Special note regarding forward-looking statements
Many of the statements included in this document, as well as verbal statements that may be made by us or by officers, directors or employees acting on our behalf, constitute or are based on forward-looking statements.
All statements, other than statements of historical facts, including, among others, statements regarding our convergence and other strategies, future financial position and plans, objectives, capital expenditures, projected costs and anticipated cost savings and financing plans, as well as projected levels of growth in the communications market, are forward-looking statements. Forward-looking statements can generally be identified by the use of terminology such as ‘may’, ‘will’, ‘should’, ‘expect’, ‘envisage’, ‘intend’, ‘plan’, ‘project’, ‘estimate’, ‘anticipate’, ‘believe’, ‘hope’, ‘can’, ‘is designed to’ or similar phrases, although the absence of such words does not necessarily mean that a statement is not forward looking. These forward-looking statements involve a number of known and unknown risks, uncertainties and other factors that could cause our actual results and outcomes to be materially different from historical results or from any future results expressed or implied by such forward-looking statements. Factors that could cause our actual results or outcomes to differ materially from our expectations, include, but are not limited to those risks identified in Telkom’s most recent annual report, which is available on Telkom’s website at www.telkom.co.za/ir.
We caution you not to place undue reliance on these forward-looking statements. All written and verbal forward-looking statements attributable to us, or persons acting on our behalf, are qualified in their entirety by these cautionary statements. Moreover, unless we are required by law to update these statements, we will not necessarily update any of these statements after the date of this document, so that they conform either to the actual results or to changes in our expectations.
The information contained in this document is also available on Telkom’s investor relations website www.telkom.co.za/ir.
Telkom SA SOC Limited is listed on the JSE Limited. Information may be accessed on Reuters under the symbols TKGJ.J and on Bloomberg under the symbol TKG.SJ. Information contained on Reuters and Bloomberg is provided by a third party and is not incorporated by reference herein. Telkom has not approved or verified such information and does not accept any liability for the accuracy of such information.
Integrated Report
For the year ended31 March 2015

24
Group salient features
ACHIEVEMENTS • Net revenue up 3,1% to R26,0 billion• Group net debt decreased 92,8% to R151 million• Free cash flow generated increased 240,4% to R3,9 billion• Mobile net revenue increased 174,1% to R954 million• Mobile data revenue increased 50,6% to R988 million • Active mobile subscribers increased 21,2% to 2 186 774
with a blended ARPU of R75,05• EBITDA, excluding the one-off items, improved 15,1% to
R9,0 billion• Headline earnings per share, excluding the one-off items,
increased 60,0% to 532,5 cents• Operating expenses, excluding depreciation, decreased
1,2% to R17,7 billion
CHALLENGES• Fixed-line voice usage revenue decreased 13,5% to
R6,9 billion• 22,0% decrease in leased line revenue
IMPROVEMENTS• Fixed-line data revenue increased 1,5% to R10,4 billion • ADSL subscribers increased 7,9% to 1 005 286• Managed data network sites increased 1,0% to 47 599• Mobile sites integrated increased 3,4% to 2 510• Mobile LTE sites integrated increased 11,3% to 1 317
HEPS at 532,5cps, up
+60%BEPS at 542,3cps, up
+135,7%Group revenue
R31,7bnTotal dividends
Free cash flow generated, strong at
R3,9bnEBITDA excluding once-off items increased 15,1% to
R9,0bn
245cps
For the year ended31 March 2015
All commentary, messaging and indicators in this report exclude retrenchment, voluntary early retirement and severance package costs of R591 million, the related tax impact of R165 million and the tax benefit on the post-retirement medical aid payment of R546 million for the year ended 31 March 2015. The comparative numbers exclude the R2 169 million net curtailment gain on the post-retirement medical aid liability and the related tax benefit of R246 million.

Group Annual Results for the year ended 31 March 2015 25
Key indicators
0
2
4
6
8
10
12
Return on invested capital
March 2014
4,6
11,3
March 2015
0
500
1 000
1 500
2 000
2 500
3 000
3 500
4 000
Free cash flow
March 2014
1 145
3 898
March 2015
0
200
400
600
800
1 000
1 200
ADSL subscribers
March 2014
9321 005
March 2015
0
200
400
600
800
1 000
Mobile net revenue
March 2014
348
954
March 2015
0
300
600
900
1 200
1 500
Mobile EBITDA loss
March 2014
1 334
684
March 2015
0
500
1 000
1 500
2 000
2 500
Mobile subscribers
March 2014
1 804
2 187
March 2015
174,1%
48,7%
21,2%
7,9%
240,4%6,7%
R million R million Thousand
Percentage R million Thousand
31 288 31 675
7 7988 978
0
5 000
10 000
15 000
20 000
25 000
30 000
35 000
EBITDAOperating revenue�
1,2%
15,1%
R million
March 2014 March 2015
230,1
542,3 532,5
332,9
0
100
200
300
400
500
600
HEPSBEPS
135,7% 60,0%
Cents per share
March 2014 March 2015

26
Overview
Johannesburg, South Africa – 8 June 2015, Telkom SA SOC Limited (JSE: TKG) today announced Group annual results for the year ended 31 March 2015.
Message from Telkom Group CEO Sipho MasekoWe are pleased to announce our results for the year ended 31 March 2015. On a like-for-like basis, i.e. excluding items that do not form part of the results from normal business operations, net revenue increased 3,1 percent to R26,0 billion; while Group operating costs, excluding depreciation, were down 1,2 percent to R17,7 billion. Our normalised EBITDA rose by 15,1 percent to R9,0 billion.
Our Retail Consumer segment performed well with excellent results from our mobile business, which increased its net revenues by 174,1 percent to R954 million. Fixed-line data revenue increased 1,5 percent to R10,4 billion and mobile data revenue increased 50,6 percent to R988 million. We continued to see pressure on voice usage, particularly in our Enterprise business, resulting in an 11,9 percent decrease in fixed-line voice and interconnection revenue to R8,3 billion. Despite the high churn rates in our Consumer business, we grew our ADSL subscribers by 7,9 percent to 1 005 286. Revenue from leased line facilities remained under pressure and declined 22,0 percent to R1 395 million.
We set out to achieve further stability in the business and largely attained it under challenging conditions. We are nearing the completion of the stability phase of our turnaround, which included:• A continued strengthening of our balance sheet with
the settlement of the post-retirement medical aid liability for certain pensioners and addressing our fixed asset base
• Continue our cost interventions to ensure a sustainable and variable cost base going forward
• Maintaining good cash management with free cash flow of R3,9 billion
• Maintaining a low gearing ratio with very low net debt to enable us to be nimble as we move ahead with plans to grow our revenues organically and inorganically
• Continue to focus on the execution of our strategy as we await the South African Competition Tribunal (Competition Tribunal) decision on the Business Connexion Group Ltd (BCX) transaction following its recommendation for approval by the South African Competition Commission (Competition Commission), and our agreement with MTN still being reviewed by the Competition Commission.
We previously indicated that we have improved capital expenditure efficiency. Through our disciplined approach to where we deploy capital we have achieved a capex to revenue ratio of 16,3 percent. In order to drive our
convergence strategy we continue to invest in an all-IP network. We also invested in improving parts of our mobile network, where necessary.
Our net debt was reduced by 92,8 percent to R151 million and our free cash flow increased to R3,9 billion. Our healthy financial position will not only allow us to take advantage of any promising opportunities that could come our way, it has also made it possible for us to pay a dividend this year.
Declaration of ordinary and special dividendOrdinary final dividend number 17 of 215 cents per share (March 2014: 0 cents) and a special dividend of 30 cents per share in respect of the year ended 31 March 2015 has been declared payable on Monday, 20 July 2015 to shareholders recorded in the register of the company at close of business on Friday, 17 July 2015. Our strong financial position and healthy cash balances warrant a special dividend of 30 cents as we reintroduce dividend payments for the first time since 2011. The total dividend approved by the board is therefore 245 cents per share. The dividend will be subject to a local dividend withholding tax rate of 15 percent which will result in a net final dividend of 182,75 cents per ordinary share and net special dividend of 25,5 cents per ordinary share to those shareholders not exempt from paying dividend withholding tax. The ordinary and special dividends will be paid out of cash balances.
The ordinary dividend has been calculated with reference to Telkom’s current and future debt and cash flow levels. The level of dividend payments going forward will be based on a number of factors, including the consideration of the financial performance, capital and operating expenditure requirements, the Group’s debt level, interest coverage, internal cash flows, prospects and available growth opportunities.
The number of ordinary shares in issue at date of this declaration is 522 969 350, which includes the issuing of 2 185 452 ordinary shares on 4 June 2015 to be allotted in terms of the Telkom employee share plan. Telkom SA SOC Limited’s tax reference number is 9414001710.
Salient dates with regard to the ordinary and special dividend 2015
Declaration date Friday, 5 June 2015Last date to trade cum dividend Friday, 10 July 2015Shares trade ex dividend Monday, 13 July 2015Record date Friday, 17 July 2015Payment date Monday, 20 July 2015
Share certificates may not be dematerialised or rematerialised between Monday, 13 July 2015 and Friday, 17 July 2015, both days inclusive.

Group Annual Results for the year ended 31 March 2015 27
On Monday, 20 July 2015, dividends due to holders of certificated securities on the South African register will either be transferred electronically to shareholders’ bank accounts or, in the absence of suitable mandates, dividend cheques will be posted to such shareholders.
Dividends in respect of dematerialised shareholders will be credited to shareholders’ accounts with their relevant CSDP or broker.
Prospects We expect the challenging operating environment of the year under review to prevail in the year ahead, compounded by increasing competitive pressures and regulatory interventions. Our response will be to maintain good cost discipline and a careful and considered approach to capex, and to make good use of our strong balance sheet by taking advantage of any new opportunities for growth.
The next phase of Telkom’s turnaround strategy continues as we reposition the business for commercial sustainability, which will allow us to realise our ambition of connecting South Africans. Our actions have thus far delivered results, but we need to become more efficient. We are reviewing our current operating model. A major part of this review is looking at a deep functional separation between our wholesale and retail businesses. We foresee an infrastructure business unit, which will be accountable for network deployment and network efficiency. For this operating model to succeed, we must have an efficient and high-performing network. We will update the market regarding our plans during the third quarter of the calendar year.
We must also have a highly efficient and cost effective workforce. Within our workforce there are significant opportunities to create a highly-skilled and productive team by ensuring that employees have the right skills and capabilities to support the changing business. Much like most telecoms operators globally, we must move towards a leaner and more productive workforce. As previously indicated, our aim is to achieve a staff cost to revenue ratio of 25% over the next four years. The 2016 financial year will see an acceleration of our efforts in pursuit of this objective. To this end, we will continue to engage with our major labour unions.
We are pleased that the Competition Commission has recommended to the Competition Tribunal that the BCX transaction should be approved with conditions.
The Competition Commission’s recommendation is a significant and positive development as it allows for the commencement of the next phase in the approval process, which is for the Competition Tribunal to set the matter down for hearing.
Financial guidance The guidance provided below excludes the impact of the successful conclusion of the MTN and BCX transactions discussed above.
2016
Net revenue Stabilise EBITDA margin 26% – 27% Capex to revenue 15% – 18% Net debt to EBITDA ≤1 Mobile EBITDA Break-even
The financial guidance above has not been reviewed or reported on by our auditors.
Report structureIn line with the Group’s convergence strategy, key performance indicators are measured and evaluated on a Group-wide basis. The Group therefore consists of one operating segment.
However, this report provides further details of the fixed-line business which offers fixed-line access and data communication services through Telkom South Africa, and the mobile business, which offers mobile voice services, data services and handset sales through Telkom Mobile. The contribution of the subsidiary, Swiftnet, is also shown separately. The Telkom category represents Telkom Company’s contribution to the Group, including consolidation entries.
The comparative information for March 2014 has been restated as a result of the reclassification of Trudon as a discontinued operation. Refer to note 2.3 in the condensed consolidated provisional annual financial statements.
In addition, the following item in the comparative reporting period has been reclassified to provide more relevant disclosure:• Income relating to undersea cables activities that are
not in the ordinary course of business of R83 million has been reclassified from operating revenue to other income.
Results from continuing operationsThe Group recorded a profit after tax of R2,9 billion (March 2014: R3,6 billion). This is 19,5 percent lower than the previous year and was driven by a one-off R2 169 million net gain recognised on the curtailment of the post-retirement medical aid liability included in the comparative reporting period as well as retrenchment, voluntary early retirement and severance package costs of R591 million for 1 205 employees in the current year.

28
Overview (continued)
Results from operations (continued)The one-off items above are not part of the results from normal operations for the year under review and have therefore also been excluded from the discussion below. The Group recorded a normalised profit after tax of R2 769 million (March 2014: R1 175 million) and EBITDA of R8 978 million (March 2014: R7 798 million), resulting in a 60,0 percent increase in headline earnings per share. The increase was driven by the benefit from lower payments to mobile operators and lower employee expenses due to the curtailment of the post-retirement medical aid liability as well as higher investment income. This was partly offset by lower gains on foreign exchange and fair value movements as a result of the implementation of hedge accounting and lower gains recognised on the underlying assets held by the cell captive.
We managed to reduce the EBITDA loss of our Mobile business by 48,7 percent by increasing service and subscriptions revenue (excluding equipment sales) by 48,0 percent. We also recorded promising growth of 50,6 percent in mobile data revenue and 82,4 percent in IT Business Services revenue. Data revenue now constitutes approximately 35,9 percent of group revenue, which increased 4,5 percent from the prior year. However, we still face significant challenges in our fixed-line voice revenue as fixed-to-mobile substitution continues. Fixed-line data revenue continues to be impacted by lower pricing driven by competition.
We managed to reduce operating costs by 1,2 percent. This reduction was largely driven by lower employee, effective marketing and security costs and a decrease in vehicle leases. Increased bad debts and property management costs partly offset these savings.
The Group generated strong cash flows as we took a measured approach when considering capital investment as well as focusing on managing our balance sheet more efficiently. This resulted in a healthy capital structure with net debt decreasing by 92,8 percent to R151 million at 31 March 2015.

Group Annual Results for the year ended 31 March 2015 29
March 2015 March 2014 %
ADSL subscribers1 1 005 286 931 858 7,9 Closer subscribers 833 363 845 742 (1,5)Internet all access subscribers2 574 761 534 441 7,5 Fixed access lines (’000)3 3 439 3 618 (4,9)
Post-paid 2 325 2 363 (1,6)Post-paid – ISDN channels 697 737 (5,4)Pre-paid 372 439 (15,3)Payphones 45 79 (43,0)
Ports activated via MSAN access 964 196 475 144 102,9 Fixed-line penetration rate (%)4 6,6 7,0 (0,4)Revenue per fixed access line (ZAR) 4 639 4 630 0,2 Total fixed-line traffic (millions of minutes) 16 315 18 045 (9,6)Managed data network sites 47 599 47 125 1,0 Telkom Company employees5 18 333 19 197 (4,5)Swiftnet employees 108 116 (6,9)Fixed access lines per employee5 188 188 – Active mobile subscribers6 2 186 774 1 803 675 21,2
Pre-paid 1 607 649 1 423 193 13,0 Post-paid 579 125 380 482 52,2
Mobile base stations constructed 2 601 2 592 0,3 Mobile sites integrated 2 510 2 428 3,4 LTE sites integrated 1 317 1 183 11,3 ARPU (Rand) 75,05 62,79 19,5
Pre-paid 39,68 31,92 24,3 Post-paid 196,89 173,28 13,6
Churn % – pre-paid 51,0 43,8 (7,2)
1.Includes 8 238 (March 2014: 4 914) internal lines. ADSL subscribers includes business, consumer, corporate, government and wholesale customers.2.Includes Telkom Internet ADSL, ISDN and WiMAX subscribers. 3.Excludes Telkom internal lines.4.Penetration rate is based on the 2011 Census population statistics. 5.Based on number of Telkom Company employees, excluding subsidiaries. 6.Based on a subscriber who has participated in a revenue-generating activity within the last 90 days.
Operational data

30
Financial performance
Group operating revenue
In ZAR millions March 2015 March 2014 %
Voice and subscriptions 15 589 16 237 (4,0)Fixed-line usage 6 867 7 934 (13,5)Fixed-line subscriptions 8 005 7 812 2,5 Mobile voice and subscriptions 717 491 46,0
Interconnection 1 493 1 508 (1,0)Fixed-line domestic 452 458 (1,3)Fixed-line international 931 971 (4,1)Mobile interconnection 110 79 39,2
Data 11 383 10 898 4,5 Data connectivity1 5 441 5 461 (0,4)Leased line facilities 1 395 1 789 (22,0)Internet access and related services 1 832 1 676 9,3 Managed data network services 1 046 919 13,8 Multi-media services 48 50 (4,0)Mobile data 988 656 50,6 IT Business Services revenue 633 347 82,4
Customer premises equipment sales and rentals 2 704 2 186 23,7 Sales 247 307 (19,5)Rentals 865 758 14,1 Mobile handset and equipment sales 1 592 1 121 42,0
Other 415 367 13,1 Swiftnet 91 92 (1,1)
Total 31 675 31 288 1,2
Reclassification of comparative information1.Income relating to the undersea cables activities that are not in the ordinary course of business of R83 million has been reclassified from data connectivity revenue to other income.
Group operating revenue increased 1,2 percent to R31 675 million (March 2014: R31 288 million), driven by higher mobile voice and data revenue, higher IT Business Services revenue and higher equipment sales. This was partly offset by the continuous decline in fixed-line voice revenue and lower data leased line revenue resulting from self-provisioning by other licensed operators.
Fixed-line voice usage revenue continued its downward trend, decreasing 13,5 percent to R6 867 million (March 2014: R7 934 million). This can be attributed to a 9,6 percent decline in voice minutes, resulting from fixed-to-mobile substitution and a 4,9 percent decline in the number of lines. The decrease was in business as well as residential lines. Business lines decreased due to the consolidation of business activities and cost-saving initiatives.
Fixed-line subscriptions revenue grew 2,5 percent to R8 005 million (March 2014: R7 812 million) as a result of average line rental tariff increases of around 6 percent.
Mobile voice and subscriber revenue increased 46,0 percent to R717 million (March 2014: R491 million). This can be attributed to a 21,2 percent increase in the number of active mobile subscribers and a 19,5 percent increase in blended ARPU.
Interconnection revenue remained relatively flat. The decrease in international interconnection revenue was due to lower international outgoing traffic volumes.
Revenue from data connectivity services decreased 0,4 percent to R5 441 million (March 2014: R5 461 million), caused by a decline in Diginet and IPLC revenue, due to increased competition and migration to Metro Ethernet services. This was partially offset by an increase in ADSL revenue and Metro Ethernet services. ADSL revenue increased as a result of a 7,9 percent increase in ADSL subscribers to 1 005 286 (March 2014: 931 858).
With continued self-provisioning by other licensed operators, revenue from leased line facilities remained under pressure and declined 22,0 percent to R1 395 million (March 2014: R1 789 million).

Group Annual Results for the year ended 31 March 2015 31
Higher growth of 9,3 percent increase in Internet access and related services revenue was supported by a 7,5 percent increase in Internet subscribers.
Managed data network services revenue increased 13,8 percent to R1 046 million (March 2014: R919 million) due to an increase in the number of VPN Supreme and satellite services customers.
In line with our strategy to focus on data, we offered attractive data deals and promotional products which led to an increase in data subscribers, and a 50,6 percent increase in mobile data revenue to R988 million (March 2014: R656 million).
We won some key strategic deals in the IT market, which boosted our IT Business Services data revenue by 82,4 percent to R633 million (March 2014: R347 million).
The strategic decision that was made to discontinue sales of PC and gaming equipment saw a 19,5 percent decline in customer premises equipment sales to R247 million (March 2014: R307 million). Despite this, our rentals increased 14,1 percent to R865 million (March 2014: R758 million) due to increased uptake in next generation equipment rentals and higher tariffs.
Mobile handset and equipment sales revenue increased 42,0 percent, driven by higher bulk sales to dealers and a sharp increase in smartphone and tablet sales.
Group other income
In ZAR millions March 2015 March 2014 %
Telkom1 697 529 31,8 Swiftnet 2 2 –
Total 699 531 31,6
Reclassification of comparative information1.Income relating to undersea cable activities that are not in the ordinary course of business of R83 million has been reclassified from operating revenue to other income.
Other income includes profit on the disposal of investments, property, plant and equipment as well as interest received from debtors and sundry income.
Other income increased 31,6 percent to R699 million (March 2014: R531 million) as a result of higher profit on sale of properties.
Group direct expenses
In ZAR millions March 2015 March 2014 %
Payments to other operators 2 930 3 944 25,7 Direct cost 615 560 (9,8)Cost of sales 2 172 1 617 (34,3)
Total 5 717 6 121 6,6
Telkom direct expenses
In ZAR millions March 2015 March 2014 %
Payments to other operators 2 902 3 920 26,0 Mobile network operators 1 450 2 308 37,2 International network operators 887 946 6,2 Fixed-line network operators 254 338 24,9 Data commitments 311 328 5,2
Direct cost 615 560 (9,8)Cost of sales 2 172 1 616 (34,4)
Total 5 689 6 096 6,7

32
Financial performance (continued)
Payments to mobile operators decreased 37,2 percent as a result of a reduction in mobile termination rates. The 34,4 percent increase in cost of sales is largely attributed to the increase in the cost of mobile device sales.
Group operating expenses
In ZAR millions March 2015 March 2014 %
Employee expenses 8 763 9 091 3,6 Selling, general and administrative expenses 4 712 4 699 (0,3)Service fees 3 212 3 103 (3,5)Operating leases 992 1 007 1,5
Operating expenses excluding depreciation, amortisation, impairments and write-offs 17 679 17 900 1,2 Depreciation, amortisation, impairments and write-offs 5 478 5 891 7,0
Total 23 157 23 791 2,7
Group operating expenses including depreciation, amortisation, impairments and write-offs decreased by 2,7 percent to R23 157 million (March 2014: R23 791 million) in the year ended 31 March 2015, primarily due to asset impairments and accelerated depreciation on new connections installed to customer premises included in the prior year as well as lower employee expenses as a result of the curtailment of the post-retirement medical aid liability in the prior year.
Telkom operating expenditure
In ZAR millions March 2015 March 2014 %
Employee expenses 8 703 9 037 3,7 Salaries and wages 7 172 7 103 (1,0)Benefits 2 017 2 315 12,9 Workforce reduction expenses – 75 100,0 Employee related expenses capitalised (486) (456) (6,6)
Selling, general and administrative expenses 4 702 4 695 (0,2)Materials and maintenance1 2 908 2 886 (0,8)Marketing 714 799 10,6 Bad debts 319 170 (87,7)Other1 761 840 9,4
Service fees 3 209 3 096 (3,7)Property management 1 934 1 741 (11,1)Consultants, security and other 1 275 1 355 5,9
Operating leases 987 1 004 1,7 Buildings 455 455 –Equipment 48 35 (37,1)Vehicles 484 514 5,8
Depreciation, amortisation, impairments and write-offs 5 459 5 872 7,0 Depreciation 4 481 4 588 2,3 Amortisation 757 652 (16,1)Impairment and write-offs 221 632 65,0
Total 23 060 23 704 2,7
Reclassification of comparative information1.Copper theft losses of R134 million has been reclassified from materials and maintenance to the other category for more relevant disclosure.

Group Annual Results for the year ended 31 March 2015 33
Employee expenses were 3,7 percent lower due to the curtailment of the post-retirement medical aid liability for in-service members and pensioners, a 4,5% reduction in full-time employee headcount and lower part-time staff headcount. This was offset by a 6,2 percent average salary increase for bargaining unit employees and a 6,0 percent average salary increase for management employees.
Selling, general and administrative expenses remained relatively flat. More focused marketing expenses resulted in a decrease of 10,6 percent to R714 million (March 2014: R799 million). This was partially offset by increased bad debts as we made provision based on the adverse economic conditions affecting payment patterns. The other category decreased 9,4 percent to R761 million (March 2015: R840 million) as we settled certain pending litigation, partially offset by higher inventory write-offs and licence fees.
Space optimisation projects and higher electricity tariffs led to an 11,1 percent increase in property management expenses. Consultants, security and other service fees decreased 5,9 percent, driven by lower consulting costs incurred relating to the Company’s transformation programme.
The 5,8% decrease in vehicle leases was mainly attributed to fewer kilometres travelled, a lower average cost of fuel and benefits from contract renegotiations.
Depreciation decreased 2,3 percent to R4 481 million (March 2014: R4 588 million) due to higher accelerated depreciation on new connections installed to customer premises included in the prior year. Impairments and write-offs declined 65,0 percent to R221 million (March 2014: R632 million). This decline is largely attributable to the impairment of certain legacy and technologically aged items in the prior year.
Mobile operating expenditure Details of Telkom Mobile operating expenditure are provided below.
In ZAR millions March 2015 March 2014 %
Payments to other operators 505 482 (4,8)Direct cost 512 461 (11,1)Cost of sales 1 436 1 056 (36,0)Employee expenses 368 359 (2,5)Selling, general and administrative expenses 920 988 6,9 Service fees 100 144 30,6 Operating leases 260 220 (18,2)Depreciation, amortisation, impairments and write-offs 720 598 (20,4)
Total 4 821 4 308 (11,9)
Investment incomeInvestment income consists of interest received on short-term investments and bank accounts. Investment income increased by 73,6 percent to R283 million (March 2014: R163 million) as a result of higher cash balances held by the Group.
Finance charges and fair value movementsFinance charges include interest paid on local and foreign borrowings, amortised discounts on bonds and commercial paper bills, fair value gains and losses on financial instruments and the cell captive as well as foreign exchange gains and losses on foreign currency denominated transactions and balances.
Foreign exchange and fair value gains decreased 74,1 percent to R89 million (March 2014: R344 million). This decrease was caused by lower fair value gains on derivatives due to the implementation of hedge accounting effective 1 October 2013, which results in certain foreign exchange gains and losses not being recognised in earnings in the current period. Lower fair value gains realised on the underlying assets held by the cell captive also contributed to the decrease. The interest expense decreased 11,9 percent to R560 million (March 2014: R636 million) as a result of lower debt levels.
34
Financial performance (continued)
TaxationThe normalised consolidated tax expense excludes the R546 million (March 2014: R246 million) benefit from the payment to an insurer for our post-retirement medical aid liability to in service members and pensioners and the R165 million tax benefit on the voluntary severance and retrenchment expenses. The normalised consolidated tax expense decreased by 10,0 percent to R543 million (March 2014: R603 million) mainly as a result of favourable prior year adjustments of R337 million (March 2014: R224 million unfavourable) and the recognition of a deferred tax asset of R250 million (March 2014: Nil).
Consolidated statement of financial positionThe Group’s capital structure remains strong. Net debt, including financial assets and liabilities, decreased 92,8 percent to R151 million from R2 092 million as at 31 March 2014, resulting in a net debt to EBITDA ratio of 0,02 times. On 31 March 2015, the Group had cash balances, including other financial assets and liabilities, of R4 677 million (31 March 2014: R1 930 million). The higher cash balances emanate from a measured approach to capital investment with a focus on returns as well as cash received from a R1 billion loan secured to extend our debt maturity profile.
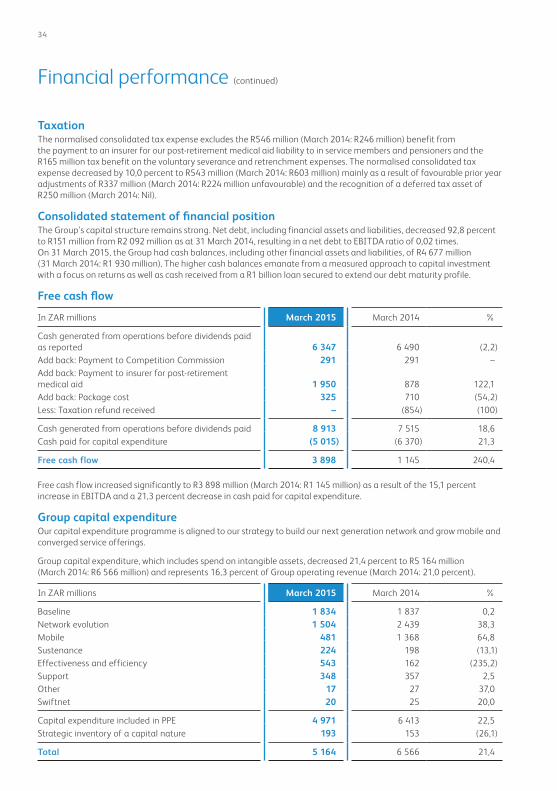
Free cash flow
In ZAR millions March 2015 March 2014 %
Cash generated from operations before dividends paid as reported 6 347 6 490 (2,2)Add back: Payment to Competition Commission 291 291 –Add back: Payment to insurer for post-retirement medical aid 1 950 878 122,1 Add back: Package cost 325 710 (54,2)Less: Taxation refund received – (854) (100)
Cash generated from operations before dividends paid 8 913 7 515 18,6 Cash paid for capital expenditure (5 015) (6 370) 21,3
Free cash flow 3 898 1 145 240,4
Free cash flow increased significantly to R3 898 million (March 2014: R1 145 million) as a result of the 15,1 percent increase in EBITDA and a 21,3 percent decrease in cash paid for capital expenditure.
Group capital expenditureOur capital expenditure programme is aligned to our strategy to build our next generation network and grow mobile and converged service offerings.
Group capital expenditure, which includes spend on intangible assets, decreased 21,4 percent to R5 164 million (March 2014: R6 566 million) and represents 16,3 percent of Group operating revenue (March 2014: 21,0 percent).
In ZAR millions March 2015 March 2014 %
Baseline 1 834 1 837 0,2 Network evolution 1 504 2 439 38,3 Mobile 481 1 368 64,8 Sustenance 224 198 (13,1)Effectiveness and efficiency 543 162 (235,2)Support 348 357 2,5 Other 17 27 37,0 Swiftnet 20 25 20,0
Capital expenditure included in PPE 4 971 6 413 22,5 Strategic inventory of a capital nature 193 153 (26,1)
Total 5 164 6 566 21,4

Group Annual Results for the year ended 31 March 2015 35
Baseline capital expenditure of R1 834 million (March 2014: R1 837 million) consists largely of the deployment of technologies to support the growing data services business, Internet capacity growth, links to the mobile cellular operators and access line deployment in selected high-growth commercial and business areas.
Network evolution expenditure of R1 504 million (March 2014: R2 439 million) is related to the continued rollout of the next generation network programme which aims to modernise the legacy voice network, provide high-speed broadband in selected areas and to address the associated operational and business support systems. The lower expenditure is largely due to a more rigorous focus on project selection, in accordance with the Group’s focus on efficient execution of its strategy. Our roll out was also impacted by civil work required to install fibre to the home and business.
Mobile capital expenditure decreased 64,8 percent to R481 million (March 2014: R1 368 million), due to the shift to a more concentrated rollout in major metropolitan areas. The current focus on the radio access network (RAN) is to complete existing projects and to provide capacity to relieve congestion in identified growth areas.
The sustenance category expenditure of R224 million (March 2014: R198 million) was largely linked to the replacement of obsolete power systems as well as the replacement and modernisation of the access and core network. The increase is due to a focus on access network rehabilitation, mainly to improve the customer experience for voice and ADSL services.
The increase in the effectiveness and efficiency category to R543 million (March 2014: R162 million) resulted from a number of projects, including the relocation of Telkom head office staff to Centurion, a contact centre consolidation initiative and the replacement of electric lighting with lower energy LED lights.
The support capital expenditure of R348 million (March 2014: R357 million) is primarily related to the provision of new buildings and building extensions in support of network growth, building compliance upgrades, the replacement of obsolete personal computers and the purchase of test equipment for technical staff.
36
For the year ended31 March 2015
Group Annual Financial Statements

Group Annual Results for the year ended 31 March 2015 37
Condensed consolidated provisional statement of profit or loss and other comprehensive income 38
Condensed consolidated provisional statement of financial position 39
Condensed consolidated provisional statement of changes in equity 40
Condensed consolidated provisional statement of cash flows 41
Notes to the condensed consolidated provisional annual financial statements 42
AUDITORSThis summarised report is extracted from audited information, but is not itself audited. The annual financial statements were audited by Ernst & Young Inc. who expressed an unmodified opinion thereon. The audited annual financial statements and the auditor’s report thereon are available for inspection at the Company’s registered office. The directors take full responsibility for the preparation of the preliminary, provisional or abridged report and the financial information has been correctly extracted from the underlying annual financial statements.
BOARD APPROVALThe condensed consolidated provisional annual financial statements were authorised for issue by the Board of Directors of Telkom (Board) on 5 June 2015.
PREPARER AND SUPERVISOR OF CONDENSED CONSOLIDATED PROVISIONAL ANNUAL FINANCIAL STATEMENTS These condensed consolidated provisional annual financial statements were prepared by Mrs Gladys Machinjike (Executive Financial Accounting and Reporting) and supervised by Mr Robin Coode (Group Executive Accounting).
Our purpose
Seamlessly connectSouth Africans to a better life
Contents

38
Condensed consolidated provisional statement of profit or loss and other comprehensive incomefor the year ended 31 March 2015
Notes2015
Rm
Restated*2014
Rm
Continuing operationsTotal revenue 4 32 400 31 905
Operating revenue 4 31 675 31 288Payments to other operators 5.1 2 930 3 944Cost of sales 5.2 2 787 2 177
Net operating revenue 25 958 25 167Other income 699 531Operating expenses 23 748 21 622
Employee expenses 5.3 9 354 6 922Selling, general and administrative expenses 5.4 4 712 4 699Service fees 5.5 3 212 3 103Operating leases 992 1 007Depreciation, amortisation, impairment, write-offs and losses 5.6 5 478 5 891
Operating profit 2 909 4 076Investment income 4 283 163Finance charges and fair value movements 471 292
Finance charges 560 636Foreign exchange and fair value movements (89) (344)
Profit before taxation 2 721 3 947Taxation (income)/expense 6 (168) 357
Profit from continuing operations 2 889 3 590Profit from discontinued operations 7 367 353
Profit for the year 3 256 3 943
Other comprehensive incomeItems that may be reclassified subsequently to profit and lossExchange gains on translating foreign operations – 4Recycling of foreign currency translation reserve – 122Items that will not be reclassified to profit and lossDefined benefit plan actuarial (losses)/gains (944) 2 277 Defined benefit plan asset ceiling limitation 448 (1 106)Income tax relating to components of other comprehensive income 8 139 (157)
Other comprehensive (loss)/income for the year, net of taxation (357) 1 140
Total comprehensive income for the year 2 899 5 083
Profit attributable to:Owners of Telkom 3 151 3 822Non-controlling interest 105 121
Profit for the year 3 256 3 943
Total comprehensive income attributable to:Owners of Telkom 2 794 4 962Non-controlling interest 105 121
Total comprehensive income for the year 2 899 5 083
Total operations*Basic earnings per share (cents) 9 617,1 748,5Diluted earnings per share (cents) 9 604,5 744,8Continuing operationsBasic earnings per share (cents) 9 565,8 703,1Diluted earnings per share (cents) 9 554,2 699,6
*Refer to note 2.3 and note 9.

Group Annual Results for the year ended 31 March 2015 39
Condensed consolidated provisional statement of financial positionat 31 March 2015
Notes2015
Rm2014
Rm
AssetsNon-current assets 30 554 31 039
Property, plant and equipment 10 24 387 25 123 Intangible assets 10 2 793 2 833 Other investments 2 231 2 759 Employee benefits 11 452 35 Other financial assets 12 28 74 Finance lease receivables 413 202 Deferred taxation 250 13
Current assets 10 511 8 366
Inventories 10 552 646 Income tax receivable 1 8 Current portion of finance lease receivables 200 118 Trade and other receivables 4 895 5 565 Current portion of other financial assets 12 1 247 187 Cash and cash equivalents 13 3 616 1 842
Assets of disposal group classified as held for sale 7.2 917 –
Total assets 41 982 39 405
Equity and liabilitiesEquity attributable to owners of the parent 25 676 22 771
Share capital 5 208 5 208 Treasury shares 15 – (771)Share-based compensation reserve 126 11 Non-distributable reserves 15 1 507 2 580 Retained earnings 18 835 15 743
Non-controlling interest 363 377
Total equity 26 039 23 148 Non-current liabilities 4 421 6 156
Interest-bearing debt 16 3 244 3 775 Employee related provisions 17 437 1 388 Non-employee related provisions 17 39 108 Deferred revenue 687 869 Deferred taxation 14 16
Current liabilities 11 403 10 101
Trade and other payables 18 5 571 5 119 Shareholders for dividend 19 21 Current portion of interest-bearing debt 16 1 612 321 Current portion of employee related provisions 17 1 867 1 597 Current portion of non-employee related provisions 17 302 731 Current portion of deferred revenue 1 502 1 431 Income tax payable 344 782 Current portion of other financial liabilities 185 98 Credit facilities utilised 13 1 1
Liabilities of disposal group classified as held for sale 7.2 119 –
Total liabilities 15 943 16 257
Total equity and liabilities 41 982 39 405

40
Condensed consolidated provisional statement of changes in equityfor the year ended 31 March 2015
2015Rm
2014Rm
Balance at 1 April 23 148 18 177
Attributable to owners of Telkom 22 771 17 798 Non-controlling interests 377 379
Total comprehensive income for the year 2 899 5 083
Profit for the year 3 256 3 943 Other comprehensive income (357) 1 140
Exchange gains on translating foreign operations – 4 Recycling of foreign currency translation reserve – 122 Net defined benefit plan remeasurements (357) 1 014
Dividend declared* (119) (123)Adjustment to shares held in Escrow (4) –Increase in share-compensation reserve 115 11
Balance at 31 March 26 039 23 148
Attributable to owners of Telkom 25 676 22 771 Non-controlling interests 363 377
*Dividend declared to the non-controlling interests of the Trudon Group.

Group Annual Results for the year ended 31 March 2015 41
Condensed consolidated provisional statement of cash flowsfor the year ended 31 March 2015
Notes2015
Rm2014
Rm
Cash flows from operating activities 6 226 6 366
Cash receipts from customers 31 852 32 455 Cash paid to suppliers and employees (25 210) (26 143)
Cash generated from operations 6 642 6 312 Interest received 470 358 Finance charges paid (491) (585)Taxation refund – 854 Taxation paid (274) (449)
Cash generated from operations before dividend paid 6 347 6 490 Dividend paid (121) (124)
Cash flows from investing activities (5 113) (4 333)
Proceeds on disposal of property, plant and equipment and intangible assets 253 67 Proceeds on disposal of investment 750 – Additions to assets for capital expansion 10 (5 015) (6 370)(Increase)/decrease in repurchase agreements (1 101) 1 970
Cash flows from financing activities 685 (2 583)
Loans raised 1 000 300 Loans repaid (310) (3 036)Finance lease repaid (170) (156)Settlement of derivatives 165 309
Net increase/(decrease) in cash and cash equivalents 1 798 (550)Net cash and cash equivalents at beginning of year* 1 841 2 381 Trudon cash and cash equivalents classified as held for sale (27) –Effect of foreign exchange rate gains on cash and cash equivalents 3 10
Net cash and cash equivalents at end of year* 13 3 615 1 841
* Refer to note 7 for cash flow activities on discontinued operations of the iWayAfrica Group, over which control was relinquished on disposal in the prior financial year and of the Trudon Group, which has been reclassified as a discontinued operation in the current financial year.

42
Notes to the condensed consolidated provisional annual financial statementsfor the year ended 31 March 2015
1. Corporate information Telkom SA SOC Limited (Telkom) is a company incorporated and domiciled in the Republic of South Africa
(South Africa) whose shares are publicly traded. The main objective of Telkom, its subsidiaries and associate (the Group) is to supply telecommunication, multimedia, technology, information and other related information technology services to Telkom’s customers, as well as mobile communication services, in South Africa.
2. Basis of preparation and accounting policiesBasis of preparation
The condensed consolidated provisional annual financial statements have been prepared in accordance with IAS 34 Interim Financial Reporting and in compliance with the Listings Requirements of the JSE Limited and the South African Companies Act, 2008.
The condensed consolidated provisional annual financial statements are presented in South African Rand, which is the Group’s functional currency. All financial information presented in Rand has been rounded off to the nearest million.
The condensed consolidated provisional annual financial statements are prepared on the historical cost basis, with the exception of certain financial instruments initially (and sometimes subsequently) measured at fair value. Details of the Group’s significant accounting policies are set out below and are consistent with those applied in the previous financial year.
Significant accounting judgements, estimates and assumptions In preparing these condensed consolidated provisional annual financial statements, the significant judgements
made by management in applying the Group’s accounting policies and the key sources of estimation uncertainty were consistent with those applied to the consolidated financial statements for the year ended 31 March 2014.
Significant accounting policies The condensed consolidated provisional annual financial statements have been prepared in accordance with the
accounting policies adopted in the Group’s last annual financial statements for the year ended 31 March 2014, except for the adoption of the amendments, new standards described below.
2.1. The following new standards, amendments to standards and interpretations that have been adopted and do not have a material impact on the Group.
Standard(s), amendment(s) Salient feature of the changes Effective date
IFRS 3 Business Combinations Amendment to scope exception of joint ventures in paragraph 2(a).
1 July 2014
IFRS 8 Operating Segments Amendment relating to aggregation of segments and reconciliation of the total reportable segments’ assets to the entity’s assets if segment assets are reported regularly.
1 July 2014
IFRS 11 Joint Arrangements Amendment to IFRS 11 requirements for accounting for an acquired interest in a joint operation that constitutes a business and additional disclosure requirements in terms of IFRS 3 Business Combinations and other IFRS for business combinations.
1 January 2016
IFRS 13 Fair Value Measurement
Amendment of scope exclusion in IFRS 13.52 to include all contracts accounted for within the scope of IAS 39 and IFRS 9, regardless of whether they meet the definition of financial asset or financial liability as defined in IAS 32.
1 July 2014
IAS 16 Property, Plant and Equipment
Amendment to the revaluation method: Proportionate restatement of accumulated depreciation of an item of property, plant and equipment.
1 July 2014

Group Annual Results for the year ended 31 March 2015 43
Standard(s), Amendment(s) Salient feature of the changes Effective date
IAS 16 Property, Plant and Equipment and IAS 41 Agriculture
Amendment to IAS 16 and IAS 41 to define bearer plants and include within the scope of IAS 16 Property, Plant and Equipment those bearer plants that are expected to bear produce for more than one period and have a remote likelihood of being sold as agricultural produce. These were previously in the scope of IAS 41.
1 January 2016
IAS 16 Property, Plant and Equipment
Amendment providing clarification on acceptable methods of depreciation and amortisation.
1 January 2016
IAS 19 Employee Benefits Amendment providing the clarification of the requirements that relate to how contributions from employees or third parties that are linked to service should be attributed to periods of service.
1 July 2014
IAS 24 Related Party Disclosures
Amendment requires disclosure of key management personnel services, provided to the reporting entity or to the parent of the reporting entity, as a related party in the reporting entity.
1 July 2014
IAS 27 Separate Financial Statements
Amendment to IAS 27 to enable an entity to account for investments in subsidiaries, joint ventures and associates using the equity method when preparing separate financial statements.
1 January 2016
Investment Entities (Amendments to IFRS 10 Consolidated Financial Statements, IFRS 12 Disclosure of Interests in Other Entities and IAS 27 Separate Financial Statements)
Amendment exempting ‘investment entities’ (as defined) from the consolidation of particular subsidiaries. Such investment entity should measure the investment in each eligible subsidiary at fair value through profit or loss.
1 January 2014
IAS 32 Financial Instruments: Presentation
Amendment to application guidance on the offsetting of financial assets and financial liabilities and the related net credit exposure.
1 January 2014
IAS 38 Intangible Assets Amendment providing guide on the revaluation method: proportionate restatement of accumulated amortisation of an intangible asset.
1 July 2014
IAS 38 Intangible Assets Amendment providing clarification of acceptable methods of depreciation and amortisation.
1 January 2016
IAS 39 Financial instruments: Recognition and Measurement
Amendment for novation of derivatives and the continuation of hedge accounting.
1 January 2014
IAS 40 Investment Property Amendment providing the interrelationship between IFRS 3 and IAS 40 when classifying property as investment property or owner-occupied property.
1 July 2014
IFRIC 21 Levies Interpretation on the accounting for levies imposed by governments.
1 January 2014

44
2. Basis of preparation and accounting policies (continued)2.2. Standards and interpretations in issue not yet adopted and not yet effective
The new standards, amendments to standards and interpretations in issue have not yet been adopted and are not yet effective. All standards are effective for annual periods beginning on or after the stated effective date. The impact of these new standards, amendments to standards and interpretations are being assessed.
Pronouncement Title Effective date
IFRS 1 First-time Adoption of International Financial Reporting Standards
Consequential amendment to IFRS 7 Financial Instruments Disclosures: Servicing contracts disclosures and offsetting of financial assets and liabilities disclosures in condensed interim financial statements.
1 January 2016
IFRS 5 Non-current Assets Held for Sale and Discontinued Operations
Amendment to the accounting treatment of changes to a plan of sale or to a plan of distribution to owners where an entity reclassifies an asset or disposal group from held for sale to held for distribution or vice versa.
1 January 2016
IFRS 7 Financial Instruments Disclosures
Amendment requiring disclosures about the initial application of IFRS 9.
1 January 2018*
IFRS 7 Financial Instruments Disclosures
Additional hedge accounting disclosures resulting from the introduction of a hedge accounting chapter in IFRS 9.
1 January 2018*
IFRS 7 Financial Instruments Disclosures
Servicing contracts disclosures: Application guidance to clarify whether a servicing contract gives rise to continuing involvement in a transferred asset for the purposes determining the transfer disclosure requirements.
1 January 2016
IFRS 9 Financial Instruments Classification and measurement of financial assets and financial liabilities and derecognition requirements.
1 January 2018*
IFRS 10 Consolidated Financial Statements
Amendment of the accounting for a split of gains or losses on the loss of control between:(i) the recognition of gains or losses in profit or loss of a
parent company and(ii) the elimination against the carrying amounts of
investments in the existing associate/joint venture and former subsidiary when control over the subsidiary is lost.
1 January 2016
IFRS 14 Regulatory Deferral Accounts
The new standard describes the financial reporting requirements for ‘regulatory deferral account balances’ that arise when an entity provides goods or services to customers at a price or rate that is subject to rate regulation. This standard is applicable to first time adopters of IFRS.
1 January 2016
IFRS 15 Revenue from contracts with customers
This new standard provides principles that an entity will apply to determine the measurement of revenue and timing of when it is recognised. The underlying principle is that an entity will recognise revenue to depict the transfer of goods or services to customers at an amount that the entity expects to be entitled to in exchange for those goods or services.
1 January 2017
Notes to the condensed consolidated provisional annual financial statements (continued)for the year ended 31 March 2015

Group Annual Results for the year ended 31 March 2015 45
Pronouncement Title Effective date
IAS 1 Presentation of Financial Statements
Amendment aiming to ensure that an entity does not reduce the understandability of its financial statements by obscuring material information with immaterial information or by aggregating material items that have different natures or functions.
1 January 2016
IAS 19 Employee Benefits Discount rate: requirement to use the market yields on government bonds denominated in the currency of high quality corporate bonds in cases where there is no deep market for such bonds for the purpose of discounting post-employment benefit obligations.
1 January 2016
IAS 28 Investment in Associates or Joint Ventures
See IFRS 10 Consolidated Financial Statements 1 January 2016
IAS 34 Interim Financial Reporting
Certain disclosures are to be given either in the interim financial statements or incorporated by a cross-reference from the interim financial statements to some other statement. These disclosures must also be available to users on the same terms and at the same time as the interim financial statements for the interim financial report to be complete.
1 January 2016
IAS 39 Financial Instruments: Recognition and Measurement
Amendment to permit an entity to elect to continue to apply the hedge accounting requirements in IAS 39 for a fair value hedge of the interest rate exposure of a portion of a portfolio of financial assets or financial liabilities when IFRS 9 is applied, and to extend the fair value option to certain contracts that meet the ‘own use’ scope exception.
1 January 2018*
IFRS 10, IFRS 12 and IAS 28, Investment Entities: Applying the Consolidation Exception
Amendment granting exemption from preparation of consolidated Financial Statements for an intermediate parent entity that is subsidiary of an investment entity even if that parent entity measures all of its subsidiaries at fair value. Consequential amendments have also been made to IAS 28 exemption from applying the equity method for entities that are subsidiaries and hold interest in associate and joint venture.
1 January 2016
*The standards apply when IFRS 9 is applied.

46
2 Basis of preparation and accounting policies (continued) 2.3 Adjustments to the consolidated statement of profit or loss and other comprehensive
incomefor the year ended 31 March 2014
As previouslyreported
Rm
Undersea cable revenue*
Rm
Discontinuedoperation**
RmRestated
Rm
Continuing operationsTotal revenue 33 061 (1 156) 31 905
Operating revenue 32 483 (83) (1 112) 31 288Payments to other operators 3 944 – 3 944Cost of sales 2 498 (321) 2 177
Net operating revenue 26 041 (83) (791) 25 167Other income 479 83 (31) 531Operating expenses 21 918 (296) 21 622
Employee expenses 7 137 (215) 6 922Selling, general and administrative expenses 4 682 17 4 699Service fees 3 110 (7) 3 103Operating leases 1 052 (45) 1 007Depreciation, amortisation, impairment, write-offs and losses 5 937 (46) 5 891
Operating profit 4 602 – (526) 4 076Investment income 176 (13) 163Finance charges and fair value movements 292 – 292
Finance charges 636 – 636Foreign exchange gains and fair value movements (344) – (344)
Profit before taxation 4 486 – (539) 3 947Taxation 494 (137) 357
Profit from continuing operations 3 992 – (402) 3 590Profit from discontinuing operations (49) – 402 353
Profit for the year 3 943 – – 3 943
* This is income relating to undersea cables activities that are not in the ordinary course of business, therefore it was reclassified from operating revenue to other income.
**The restatement is due to the classification of the Trudon Group as a discontinued operation.
Notes to the condensed consolidated provisional annual financial statements (continued)for the year ended 31 March 2015

Group Annual Results for the year ended 31 March 2015 47
3. Segment informationThe Executive Committee (Chief operating decision maker) manages the business on a combined basis. This reflects the financial information reviewed by the Executive Committee when making decisions about performance and resource allocation and is consistent with the manner in which the Telkom network generates revenue, ie on a combined basis. As a result, Telkom has a single operating and reporting segment. No Group geographical information is provided as the majority of the Group’s operations are carried out in South Africa.
The Telkom segment provides fixed-line access, fixed-line usage, data communications services, mobile voice and data services and customer premises equipment sales.
2015Rm
Restated2014
Rm
4. Total revenue 32 400 31 905
Operating revenue 31 675 31 288Other income (excluding profit on disposal of property, plant and equipment, intangible assets and investments) 442 454Investment income 283 163
Operating revenue increased due to higher mobile voice and data revenue, higher IT business services revenue and higher equipment sales. This was partly offset by the continuous decline in fixed-line voice revenue and lower data leased line revenue resulting from self-provisioning by other licensed operators.
Investment income increased as a result of higher cash balances held by the Group.
Change in estimateIn the current financial year the Group reassessed its voice customer relationship period (CRP) that is used for the deferral of installation fee revenue. The CRP was changed from 9 years to 6.5 years. This is more reflective of the modern day customer behaviour within the industry. The change in estimate resulted in revenue increasing by R111 million in the current year.
Change in comparativeThe comparative in other income has increased by R83 million due to a reclassification from operating revenue relating to income from undersea cables to more appropriately reflect its nature.

48
Notes to the condensed consolidated provisional annual financial statements (continued)for the year ended 31 March 2015
2015Rm
Restated2014
Rm
5. Operating expenses 5.1 Payments to other operators 2 930 3 944
Payments to other network operators (interconnection fees) has decreased due to the reduction in the mobile termination rates.
5.2 Cost of sales 2 787 2 177 The increase in the cost of sales is largely attributable to the increase in the mobile device sales.
5.3 Employee expenses 9 354 6 922 The increase in employee expenses is mainly due to a net curtailment gain of R2.2 billion that related to the curtailment and settlement of the post-retirement medical aid benefit which occurred in the prior financial year. The average salary increase as well as the retrenchment packages, voluntary early retirement packages and voluntary severance packages gave rise to the increase in employee expenses offset by a settlement gain that related to the post-retirement medical aid benefit.
5.4 Selling, general and administrative expenses 4 712 4 699 Selling, general and administrative increased marginally. More focused marketing activities resulted in a decrease in selling, general and administrative expenses in the current financial year. The decrease was partially offset by an increase in bad debt provision. The adverse economic conditions gave rise to higher impairments.
5.5 Service fees 3 212 3 103 The increase in service fees is driven by costs relating to higher utilities and maintenance costs on Telkom properties.
5.6 Depreciation, amortisation, impairment and write-offs 5 478 5 891
Depreciation of property, plant and equipment 4 500 4 605 Amortisation of intangible assets 758 654 Impairment of property, plant and equipment and intangible assets – 392 Write-offs of property, plant and equipment and intangible assets 220 240
The decrease in depreciation is due to accelerated depreciation on new connections installed to customer premises in the prior financial year that was not incurred to the same extent in the current financial year together with the impairment of certain legacy and technologically aged items that did not occur in the current financial year.
6. Taxation (income)/expense (168) 357
South African normal company taxation (56) 484 Deferred taxation (112) (127)
The reduction in the tax expense in the current financial year was mainly as a result of the reversal of tax provisions raised and refunds in respect of prior years that related to matters that were resolved with SARS during the current financial year.
In the current financial year the Group raised a deferred tax asset of R250 million of which a net amount of R112 million was processed through profit or loss.

Group Annual Results for the year ended 31 March 2015 49
2015Rm
2014Rm
7. Discontinued operations7.1 Pan African business, iWayAfrica and Africa Online Mauritius
On the 20th of December 2013, Telkom sold the Pan African business, iWayAfrica and Africa Online Mauritius, through a private sale to Gondwana International Networks.iWayAfrica was formed as the result of the amalgamation of MWEB Africa and Africa Online in 2007 when MWEB Africa was purchased by Telkom. The iWayAfrica business operated in eight countries on the continent offering terrestrial wireless and VSAT services to business and residential markets, as well as via its channel partners in many other countries on the continent.Telkom’s investment in iWayAfrica was already fully impaired at 31 March 2012. Gondwana took over the assets and liabilities (including amounts owed by Telkom) for a nominal consideration.Analysis of the results of the discontinued operations:Revenue* – 240 Expenses* – (289)
Loss before taxation of the discontinued operations – (49)Taxation – –
Loss after taxation of the discontinued operations – (49)
* Revenue is comprised of operating revenue, other income and investment income. Expenses is comprised of operating expenses and finance charges.
The net cash flows attributable to the operating, investing and financing activities of discontinued operations:Operating cash flows – (38)
Total cash outflows* – (38)
* Cash flows included for 2014 are up to 20 December 2013. At 20 December 2013, on the date of disposal, iWayAfrica had R48 million cash on hand.
7.2 The Trudon GroupOn 27 November 2014, the Telkom Board approved the disposal of Telkom’s 64,9% shareholding in Trudon to Trumancon. This is part of Telkom’s strategic imperative to focus on its fixed-line and internet based business.Trudon provides advertising and marketing options to the small, medium and micro enterprises and corporate market. They also deliver local commercial search options.The conclusion of the transaction is subject to the fulfilment of certain material conditions precedent.Analysis of the results of the discontinued operations:Revenue* 1 127 1 156 Expenses* (638) (617)
Profit before taxation of the discontinued operations 489 539 Taxation (122) (137)
Profit after taxation of the discontinued operations** 367 402
*Revenue is comprised of operating revenue, other income and investment income. Expenses is comprised of operating expenses.**As the carrying amount of Trudon is less than the fair value less costs to sell, no re-measurment is required.

50
Notes to the condensed consolidated provisional annual financial statements (continued)for the year ended 31 March 2015
2015Rm
2014Rm
7. Discontinued operations (continued)7.2 The Trudon Group (continued)
The major classes of assets and liabilities of the business classified as a disposal group:Assets 917
Property, plant and equipment and intangible assets 281 Inventories 86 Trade and other receivables 493 Cash and cash equivalents 27 Other current and non current assets 30
Liabilities 119
Trade and other payables 64 Other current and non current liabilities 55
The net cash flows attributable to the operating, investing and financing activities of discontinued operations:Operating cash flows (9)Investing cash flows (54)
Total cash inflows (63)
The capital gains tax consequences on the sale of Trudon, if any, will be offset against the cumulative capital losses in Telkom company.
8. Income taxation effects of other comprehensive incomeExchange gains on translating foreign operations – 4 Recycling of foreign currency translation reserve – 122
Net foreign currency translation gains for foreign operations – 126
Defined benefit plan actuarial (losses)/gains (944) 2 277 Tax effect of defined benefit plan actuarial (losses)/gains 264 (306)
Net defined benefit plan actuarial (losses)/gains (680) 1 971
Defined benefit plan asset ceiling limitation 448 (1 106) Tax effect of defined benefit plan asset ceiling limitation (125) 149
Net defined benefit plan asset ceiling limitation 323 (957)
Other comprehensive (loss)/income for the year before taxation (496) 1 297 Tax effect of other comprehensive (loss)/income for the year 139 (157)
Other comprehensive (loss)/income for the year, net of taxation (357) 1 140

Group Annual Results for the year ended 31 March 2015 51
2015Rm
Restated2014
Rm
9. Earnings per shareTotal operationsBasic earnings per share (cents) 617,1 748,5 Diluted earnings per share (cents) 604,5 744,8 Headline earnings per share (cents)* 607,3 851,4 Diluted headline earnings per share (cents)* 594,9 847,1 Continuing operationsBasic earnings per share (cents) 565,8 703,1
Diluted earnings per share (cents) 554,2 699,6 Headline earnings per share (cents)* 556,0 806,0 Diluted headline earnings per share (cents)* 544,6 801,9 Discontinued operationsBasic earnings per share (cents) 51,3 45,4 Diluted earnings per share (cents) 50,3 45,2 Headline earnings per share (cents)* 51,3 45,4 Diluted headline earnings per share (cents)* 50,3 45,2
Reconciliation of weighted average number of ordinary shares:Number
of sharesNumber
of sharesOrdinary shares in issue 520 783 900 520 783 900 Weighted average number of shares held by subsidiaries and in Escrow (10 190 084) (10 190 084)
Weighted average number of shares outstanding 510 593 816 510 593 816
Reconciliation of diluted weighted average number of ordinary sharesWeighted average number of shares outstanding 510 593 816 510 593 816 Expected future vesting of shares 10 654 715 2 587 629
Diluted weighted average number of shares outstanding 521 248 531 513 181 445
*The disclosure of headline earnings is a requirement of the JSE Limited and is not a recognised measure under IFRS. It has been calculated in accordance with the South African Institute of Chartered Accountants’ circular 2/2013 issued in this regard.
Total operations
Reconciliation between earnings and headline earnings:*** Rm Rm
Profit for the year 3 256 3 943 Non-controlling interests (105) (121)
Profit attributable to Owners of Telkom 3 151 3 822 Profit on disposal of property, plant and equipment and intangible assets (257) (77)Loss on disposal of subsidiary – 23 Impairment loss on property, plant and equipment and intangible assets** – 392 Write-offs of property, plant and equipment and intangible assets 220 240 Taxation effects (13) (53)
Headline earnings 3 101 4 347
**The impairment resulted in deferred taxation consequences that were not recognised in the Statement of Financial Position in the prior financial year.***The amounts have been restated due to the reclassification of the Trudon Group as a discontinued operation.

52
Notes to the condensed consolidated provisional annual financial statements (continued)for the year ended 31 March 2015
2015Rm
Restated2014
Rm
9. Earnings per share (continued)Continuing operationsReconciliation between earnings and headline earnings:***Profit from continuing operations 2 889 3 590
Profit attributable to Owners of Telkom 2 889 3 590
Profit on disposal of property, plant and equipment and intangible assets (257) (77)Loss on disposal of subsidiary – 23 Impairment loss on property, plant and equipment and intangible assets** – 392 Write-offs of property, plant and equipment and intangible assets 220 240 Taxation effects (13) (53)
Headline earnings 2 839 4 115
Discontinued operationsReconciliation between earnings and headline earnings:***Profit from discontinued operation 367 353 Non-controlling interests (105) (121)
Profit attributable to Owners of Telkom 262 232
Headline earnings 262 232
**The impairment resulted in deferred taxation consequences that were not recognised in the Statement of Financial Position in the prior financial year.***The amounts have been restated due to the reclassification of the Trudon Group as a discontinued operation.
2015Rm
2014Rm
10. Capital additions and disposalsProperty, plant and equipment
Additions 4 038 5 695Disposals (16) (17)
Intangible assets Additions 933 763 Disposals – –
The capital expenditure is due to the deployment of the Next Generation Network, mobile cellular services and baseline technologies. The lower expenditure is largely due to a more rigorous focus on project selection in accordance with the Group’s focus on efficient execution of its strategy.

Group Annual Results for the year ended 31 March 2015 53
Mobile capital expenditure decreased due to the shift to a more concentrated rollout in major metropolitan areas. The current focus for the radio access network (RAN) is to complete current projects and to provide capacity to relieve congestion in identified growth areas.
An estimated amount of R193 million (2014: R153 million) included in inventories will be used for Telkom’s network expansion in the 2016 financial year of which R137 million was purchased in the current financial year.
Finance charges of R93 million (2014: R93 million) were capitalised to property, plant and equipment and intangible assets in the current financial year.
Intangible assets additions mainly relate to software.
2015Rm
2014Rm
11. Employee benefits 452 35
Telkom Pension Fund asset 28 35 Post-retirement medical aid net plan asset 424 –
The increase is due to the recognition of the net post-retirement medical aid plan asset arising from the annuity policy.
12. Other financial assets Non-current other financial assets consist of: 28 74
– Derivative instruments 28 74
Cross currency swaps 28 74
Current other financial assets consist of: 1 247 187
– Repurchase agreements 1 101 –– Derivative instruments 146 187
Forward exchange contracts 70 139 Firm commitments 5 4
Cross currency swaps 71 44
The increase is due to the repurchase agreement held at reporting date.
13. Net cash and cash equivalents 3 615 1 841
Cash shown as current assets 3 616 1 842
Cash and bank balances 135 193 Short-term deposits 3 481 1 649
Credit facilities utilised (1) (1)
The increase in cash and cash equivalents is mainly due to the inflow of a loan of R1 billion (refer to note 16). The balance includes R2 663 million ring-fenced for the acquisition of Business Connexion (BCX) subject to regulatory approval.

54
Notes to the condensed consolidated provisional annual financial statements (continued)for the year ended 31 March 2015
14. Financial risk managementExposure to continuously changing market conditions has made management of financial risk critical for the Group. Treasury policies, risk limits and control procedures are continuously monitored by the Board of Directors through its Audit Committee and Risk Committee.
The condensed consolidated provisional annual financial statements do not include all financial risk management information and disclosures required in the annual financial statements and should be read in conjunction with the Group’s annual financial statements as at 31 March 2015. The Group uses derivatives as hedging instruments.
14.1 Liquidity riskLiquidity risk is the risk that the Group will not be able to meet its financial obligations as they fall due. The Group is exposed to liquidity risk as a result of uncertain cash flows as well as capital commitments of the Group.
Liquidity risk is managed by the Group’s Treasury department in accordance with policies and guidelines formulated by the Group’s Executive Committee. In terms of its borrowing requirements the Group ensures that sufficient facilities exist to meet its immediate obligations.
Compared to the 2014 financial year end, there was no material change in the contractual undiscounted cash out flows for financial liabilities.
14.2 Fair value of financial instrumentsThe carrying amount of financial instruments approximate fair value, with the exception of interest-bearing debt (at amortised cost) which has a fair value of R5 312 million (2014: R4 752 million) and a carrying amount of R4 856 million (2014: R4 096 million) (refer to note 16).
Valuation techniques and assumptions applied for the purposes of measuring fair value
Type of financial instrument
Fair value at 31 March 2015
Rm Valuation technique Significant inputs
Receivables, bank balances, repurchase agreements, other liquid funds, payables and accruals, credit facilities utilised and shareholders for dividends
6 631 Undiscounted future estimated cash flows due to short term maturities of these instruments
Probability of default
Derivatives (11) Discounted cash flows Yield curvesMarket interest rateMarket foreign currency rate
Borrowings 5 312 Discounted cash flows and quoted bond prices
Market interest rateMarket foreign currency rate
The estimated net fair values as at the reporting date have been determined using available market information and appropriate valuation methodologies as outlined below. This value is not necessarily indicative of the amounts that the Group could realise in the normal course of business. The fair value of the financial assets and financial liabilities are sensitive to exchange rate and interest rate movements.
Derivatives are recognised at fair value. The fair values of derivatives are determined using quoted prices or, where such prices are not available, a discounted cash flow analysis is used. These amounts reflect the approximate values of the net derivative position at the reporting date. The fair values of listed investments are based on quoted market prices.
The fair values of the borrowings disclosed above are based on quoted prices or, where such prices are not available, the expected future payments discounted at market interest rates. As a result they differ from carrying values.

Group Annual Results for the year ended 31 March 2015 55
The fair value of receivables, bank balances, repurchase agreements and other liquid funds, payables and accruals, approximate their carrying amount due to the short-term maturities of these instruments.
14.3 Fair value hierarchyThe table below analyses financial instruments carried at fair value and amortised cost, by valuation method.
The different levels have been defined as follows:a) Quoted prices in active markets for identical assets or liabilities (level 1).b) Inputs other than quoted prices, that are observable for the asset or liability (level 2).c) Inputs for the asset or liability that are not based on observable market data (level 3).
The following table presents the Group’s assets and liabilities that are measured at fair value and amortised cost:
Hierarchy levels 2015
Rm2014
Rm
Assets measured at fair valueInvestment in Cell Captive Preference Shares Level 1 2 227 2 755 Forward exchange contracts Level 2 70 139 Firm commitments Level 2 5 4 Cross currency swaps Level 2 99 118
Liabilities measured at fair valueInterest rate swaps Level 2 (1) –Firm commitments Level 2 (170) (37)Forward exchange contracts Level 2 (14) (61)
Liabilities measured at amortised costInterest-bearing debt consisting of: (5 312) (4 752)
Quoted debt securities Level 1 (3 355) (3 445)Unquoted debt securities Level 2 (1 957) (1 307)
15. Non-distributable reserves 1 507 2 580
Cell Captive reserve 2 282 2 580Shares held by subsidiaries and in Escrow (775) –
The Group has a Cell Captive preference share investment to fund Telkom’s post-retirement medical aid liability.
The fair value gains from the Cell Captive are recognised in profit or loss and then transferred to non-distributable reserves.
The reserve also represents Telkom shares held by subsidiaries and in Escrow, to be utilised in terms of the Telkom Employee Share Plan. Telkom previously disclosed the reserve as treasury shares.

56
Notes to the condensed consolidated provisional annual financial statements (continued)for the year ended 31 March 2015
2015Rm
2014Rm
16. Interest-bearing debtNon-current interest-bearing debt 3 244 3 775
Local debt 2 605 2 815 Foreign debt 101 307 Finance leases 538 653
Current portion of interest-bearing debt 1 612 321
Local debt 1 260 –Foreign debt 239 236 Finance leases 113 85
The Group obtained long-term funding of R1 billion during the current financial year to diversify its debt maturity profile and to finance its activities.
The repayment of the current portion of interest-bearing debt of R1 612 million (nominal as at 31 March 2015) is expected to be repaid from cash balances, available operational cash flow and/or the issue of new debt instruments.
Management believes that sufficient funding facilities will be available at the dates of repayment.
17. ProvisionsNon-current portion of provisions 476 1 496
Employee related 437 1 388Non-employee related 39 108
Current portion of provisions 2 169 2 328
Employee related 1 867 1 597Non-employee related 302 731
The decrease in non-current employee related provisions is mainly due to the effect of the settlement recognised on a portion of the post-retirement medical aid benefit. The settlement is as a result of an offer to pensioners who retired after 1994, but before 30 April 2013 to transfer the post-retirement medical aid liability obligation to an insurer.
The increase in the current portion of employee related provisions is mainly due to the voluntary severance, voluntary early retirement and retrenchment process.
The decrease in non-employee related provisions is due to the reclassification at 30 September 2014 of an amount of R304 million to trade and other receivables to more accurately reflect the substance of a transaction with a third party. The partial settlement of the fine imposed by the Competition Commission has also contributed to the decrease in the non-employee related provision.

Group Annual Results for the year ended 31 March 2015 57
2015Rm
2014Rm
18. Trade and other payables 5 571 5 119
Trade payables 2 795 2 632 Finance cost accrued 108 74 Accruals and other payables 2 668 2 413
The increase is mainly due to orders placed for Telkom campaigns that occurred in the current financial year. Included in the current year balance is the prior financial year refund from SARS of R854 million. Refer to note 20.
19. CommitmentsCapital commitments authorised 5 500 5 055
Commitments against authorised capital expenditure 1 057 1 132 Authorised capital expenditure not yet contracted 4 443 3 923
Capital commitments are largely attributable to purchases of property, plant and equipment and software.
Management expects these commitments to be financed from internally generated cash and other borrowings.
20. ContingenciesContingent liabilitiesMatters before ICASAPhutuma Networks Proprietary Ltd (Phutuma)Phutuma filed a complaint against Telkom at ICASA’s Complaints and Compliance Committee (the CCC) in February 2010. On 16 February 2015, after the matter having been heard by the CCC, Telkom received the CCC’s final ruling dated 27 November 2014. The CCC ruled that the complaint had been withdrawn and that as a result thereof, it is not able to make any recommendations to the ICASA council. Telkom thus regards the matter as finalised on that basis.
End-User and Service Charter Regulations Allegations have been made at the CCC regarding Telkom’s alleged non-compliance with the requirements of the End-User and Service Charter Regulations relating to the clearance of reported faults. The CCC heard the matter and has ruled that Telkom is not in breach of the Regulations and recommend that ICASA review the regulations. Telkom has initiated administrative review proceedings seeking to set-aside the applicability of the Regulations since the CCC ruling is not binding on ICASA. The review has not been finalised as yet.
High courtTelkom/ICASA, Neotel and CCCNeotel requested Telkom to provide access to Telkom’s local loop in November 2010. Telkom declined the request and Neotel submitted a formal complaint to the CCC which made an order directing Telkom to provide Neotel access to Telkom’s local loop. Telkom launched an interim relief application for an order that the CCC order not be implemented pending a review application in the High Court to review and set aside the CCC order. The parties have since agreed to a court order in terms of which Telkom withdrew its application for interim relief and ICASA in turn undertook not to implement the CCC order pending the outcome of Telkom’s application for review. No date has been set down as yet for the hearing of the review application.
Radio Surveillance Security Services Proprietary Ltd (RSSS)RSSS sued Telkom for R215 million (including VAT). Telkom is defending the claim and has filed a plea and counterclaim for R22 million. An application will be made for a special court to be allocated due to the duration of the proposed trial. The parties are exploring a possible settlement.

58
Notes to the condensed consolidated provisional annual financial statements (continued)for the year ended 31 March 2015
20. Contingencies (continued)Contingent liabilities (continued)High court (continued)Phutuma Networks Proprietary Ltd (Phutuma)In August 2009, Phutuma issued a summons against Telkom, arising from a tender published by Telkom in November 2007, claiming damages in the amount of R5,5 billion. The High Court granted absolution from the instance, in Telkom’s favour. The Supreme Court of Appeal (SCA) had initially dismissed Phutuma’s application for leave to appeal in October 2014. In November 2014, the SCA rescinded its previous order and in February 2015, the SCA granted Phutuma leave to appeal.
African Pre-paid Services Nigeria Limited (APSN) v Multi-Links (MLT): Arbitration matterIn December 2014, APSN withdrew its claim, in arbitration proceedings, against MLT (a previous subsidiary of Telkom, in Nigeria), and MLT also withdrew its counterclaim against APSN, as part of a settlement agreement concluded between Telkom and MLT on the one hand and Blue Label and others on the other hand, in respect of an action instituted by both Telkom and MLT against Blue Label, African Pre-paid Services, APSN and 3 others. The settlement was on a walk away basis.
OtherHIP Oils Topco Ltd (HIP Oils)With the sale of Telkom’s shares in MLT to HIP Oils, Telkom provided a taxation indemnity and a creditors indemnity to HIP Oils and MLT where such liability was incurred prior to 3 October 2011 and to the extent that such liability exceeded the amounts set out in the creditors list to the Sale and Purchase Agreement. Telkom also undertook to indemnify HIP Oils of any contingent liabilities and obligations owed or owing to creditors of MLT where such liability or obligation was incurred and not disclosed to HIP Oils prior to October 2011. In December 2014, Telkom and HIP Oils concluded a settlement agreement in terms of which both parties waived and abandoned all their claims against each other and released and indemnified each other from all past and future liabilities.
Section 197: Labour Relations ActTelkom has also been engaging with organised labour in relation to the outsourcing of various business operations in an effort to unlock operating and cost efficiencies in line with the Company’s multi-year turnaround strategy. This necessitated invoking a process in terms of Section 197 of the Labour Relations Act, in a bid to outsource certain services as going concerns. Section 197 (7) states that Telkom and the new employers are jointly and severally liable to any employee who becomes entitled to receive a payment a result of the employee’s dismissal for a reason relating to the new employer’s operational requirements or liquidation or sequestration. Telkom will be held liable for a period of 12 months after the date of transfer, which may result in an onerous obligation.
Onerous lease obligationIn its bid to create a single Corporate Office at its owned Centurion Campus, Telkom is in the process of terminating the head office lease of buildings in the CBD with the Telkom Retirement Fund. The optimal exit strategy is being considered and may result in an onerous cost if the settlement value is more than the present value of the lease obligation.
Tax mattersFollowing Telkom’s objection, the assessment received from SARS in respect of the 2010 year of assessment has been resolved as at 31 March 2015.
Contingent assetsTax mattersAs noted in the 2014 consolidated annual financial statements the tax treatment of the loss that arose in 2012 and 2014 financial years on the sale of foreign subsidiaries are based on a specific set of circumstances and a complex legislative environment. A tax refund received during the prior financial year, relating to the 2012 sale, is contingent and will only be recognised once the matter has been resolved with SARS. Refer to note 18.

Group Annual Results for the year ended 31 March 2015 59
2015Rm
2014Rm
21. Related partiesDetails of material transactions and balances with related parties were as follows:With shareholders:Government of South Africa*Related party balances
Finance lease receivable 366 51 Trade receivables 462 456Provision for doubtful debt (16) –Related party transactionsRevenue (3 747) (3 334)
Individually significant revenue** (1 771) (1 322)
City of Cape Town (41) (45)Department of Correctional Services (82) (90)Department of Health: Gauteng (389) (51)Department of Justice (109) (114)South African National Defence Force (69) (72)South African Police Services (628) (597)South African Revenue Services (34) (38)S.I.T.A. Proprietary Ltd (205) (206)South African Post Office (55) (52)Ekurhuleni Metropolitan Council*** (52) –KZN Ethekwini Municipality*** (46) –Department of Internal Affairs (61) (57)
Collectively significant revenue** (1 976) (2 012)
*Comparatives were restated. This was to incorporate the finance lease transaction.**The nature of the individually and collectively significant revenue consists mostly of data revenue.***Individually significant from the current year.
At 31 March 2015, the Government of South Africa held 39,8% (2014: 39,8%) of Telkom’s shares and the Public Investment Corporation held 12% (2014:13,5%) of Telkom’s shares.

60
Notes to the condensed consolidated provisional annual financial statements (continued)for the year ended 31 March 2015
2015Rm
2014Rm
21. Related parties (continued)With entities under common control:Major public entitiesRelated party balancesTrade receivables 74 35Trade payables (1) (1)Related party transactionsRevenue (238) (253)Expenses 238 250
Individually significant expenses 226 236
South African Post Office 77 89Eskom 144 136South African Broadcasting Corporation 5 11
Collectively significant expenses 12 14
Rent received (53) (49)
Individually significant rent received: South African Post Office (46) (43)Collectively significant rent received (7) (6)
Rent paid 29 29
Individually significant rent paid: South African Post Office 19 19Collectively significant rent paid 10 10
Key management personnel compensation:(Including directors and prescribed officers’ emoluments)Related party transactionsShort-term employee benefits 141 190Post-employment benefits 10 10Termination benefits 5 2Equity compensation benefits – 6
Terms and conditions of transactions with related partiesOutstanding balances at the year-end are unsecured, interest free and settlement occurs in cash. There have been no guarantees provided or received for related party receivables or payables.

Group Annual Results for the year ended 31 March 2015 61
22. Significant eventsResults of the Telkom Annual General Meeting regarding Directors re-appointments All Board members were re-elected as per the Annual general meeting ordinary resolutions with the exception of Mr L Maasdorp who withdrew his nomination to be re-elected as director with effect from 27 August 2014.
Retirement of Director Telkom announced on 8 August 2014 that Mr Jacques Schindehütte retired from the Board with full benefits and the disciplinary proceedings have been discontinued. Telkom settled the retirement benefit with Mr Schindehütte during November 2014.
Appointment of Executive Director and Chief Financial Officer Telkom announced on 15 September 2014 that Mr Deon Fredericks had been appointed as an Executive Director and Chief Financial Officer of Telkom SA SOC Ltd effective from 12 September 2014.
Appointment of Non-Executive Directors Telkom announced on 1 December 2014 that Ms Thembisa Dingaan, Mr Graham Dempster, Mr Rex Tomlinson and Ms Nunu Ntshingila have been appointed as Non-Executive Directors with effect from 3 December 2014.
Resignation of Director Telkom announced on 3 December 2014 that Dr Clive Fynn had resigned as a non-executive director with immediate effect.
Post-Retirement Medical Aid During November 2014, Telkom provided the Post-1994 pensioners the option to transfer their post-retirement medical aid benefit to an insurer. All except three pensioners exercised their option to transfer their benefit to the insurer. A settlement gain was recognised in the current financial year.
MTN and Telkom Radio Access Network (RAN) assets Transaction On 7 March 2014, Telkom signed a heads of agreement in terms of which MTN South Africa would take over the financial and operational responsibility for the roll-out and operation of Telkom’s RAN. The parties will conclude reciprocal roaming agreements to enable customers of either party to roam on each other’s network.
The proposed transaction is subject to conclusion by the parties of various binding commercial agreements to give effect to the transaction, and various other approvals, including approvals by regulatory authorities as may be required for the implementation of the proposed transaction.
Acquisition of Business Connexion (BCX) On 22 May 2014, Telkom announced its firm intention to make an offer to acquire the entire issued share capital of BCX in a bid to improve performance and restore profitability.
Shareholders of BCX approved the acquisition by Telkom at an Ordinary Scheme Meeting held on 11 August 2014. On 13 May 2015 the Competition Commission of South Africa approved the acquisition subject to certain conditions. Both parties are awaiting approval from the Competition Tribunal and discussions are being held with the Independent Communications Authority of South Africa.
Restructuring of the organisation-management and specialist layers In April 2014, as part of the larger Telkom turnaround strategy the Company initiated discussions with organised labour, with a focus on an organisational restructuring process that would result in headcount reduction.
The staff affected by this organisational restructuring, was limited to the management and specialist layers. Telkom consulted with organised labour on an ongoing basis since 4 May 2014, regarding possible dismissals in terms of Section 189 of the Labour Relations Act, on all elements of the restructuring process. At the end of September 2014, the Section 189 process was concluded in relation to the affected staff.

62
Notes to the condensed consolidated provisional annual financial statements (continued)for the year ended 31 March 2015
22. Significant events (continued)Restructuring of the organisation-management and specialist layers (continued)The intention of the Telkom turnaround strategy is to secure the future commercial sustainability of the business. The sustainable success of the Company is largely dependent on both the attraction and retention of qualified, competent and experienced professional staff. The organisational restructuring is not driven so much by headcount reduction targets as it is by business imperatives that will shape the long-term commercial sustainability of the Company.
Outsourcing of various business elements Telkom has also been engaging with organised labour in relation to the outsourcing of various business operations in an effort to unlock operating and cost efficiencies in line with the Company’s multi-year turnaround strategy. This necessitated invoking a process in terms of Section 197 of the Labour Relations Act, in a bid to outsource certain services as going concerns. Telkom’s call centre operations, internal printing division as well as the network and operations and retail supply chain sections, were transferred and outsourced on 30 April 2015.
Telkom also offered Voluntary Severance (VSPs) and Voluntary Early Retirement Packages (VERPs) to employees affected by the Section 197 process and who opted for severance or early retirement packages. These employees exited Telkom’s services on 30 April 2015.
Closure of unviable stores In a continuous bid to unlock cost efficiencies Telkom conducted a detailed analysis of the viability of the 95 Telkom Direct Stores. Certain stores were unprofitable and deemed unviable, making closure inevitable. Section 189 notices were issued to organised labour in relation to the affected staff in this environment. After exploring every option to place affected employees in other areas of business, unsuccessful employees were retrenched.
Telkom driving ICT innovation and growth On 7 May 2015 Telkom launched the Future Makers programme in terms of which it will invest over R100 million for enterprise and supplier development. Future Makers focuses on driving innovation in the ICT sector by growing access to technology and by offering long-term business support, mentorship and funding to small, medium and micro-enterprises.
Head Office move to Centurion Business Park There are currently two Telkom Campuses in Tshwane i.e. the Corporate Offices within the Pretoria CBD area, which Telkom is leasing from the Telkom Retirement Fund (TRF) and secondly, the Centurion Campus. The financial and business objectives are to create a single Telkom Corporate Office at Telkom’s owned Centurion Campus by virtue of expanding and revamping the facility. The current Telkom offices in the CBD are outdated and do not represent a look and feel that portraits a modern company and a conducive working environment. In addition, the space allocated to staff is considered to be non-economical as space can be better utilised by having a more open plan concept.
Telkom intends to vacate the CBD premises and settle the outstanding lease and other obligations with the TRF. The benefits to Telkom includes; savings pertaining to rental, utility and maintenance expenditure at the Pretoria CBD Campus, establishment of a modern Campus at Centurion with associated facilities, a conducive working environment with a better look and feel, better utilization of accommodation and future expansion opportunities.
The exit strategy pertaining to the corporate offices within the Pretoria CBD, which is subject to a lease that expires in 2019, is being assessed.

23. Subsequent events Dividends The Telkom Board declared an ordinary dividend of 215 cents per share and a special divident of 30 cents per share on 5 June 2015 payable on 20 July 2015 to shareholders registered on 17 July 2015.
Transfer of ordinary sharesOn 2 June 2015, Telkom transferred 1 584 641 ordinary shares from Acajou Investment Proprietary Limited to Escrow. These shares were allocated to employees as part of the Telkom Employee Share Plan.
Issuing of ordinary sharesOn 4 June 2015, Telkom issued 2 185 452 ordinary shares for no consideration. The shares will be allotted and issued in terms of the Telkom Employee Share Plan.
Allocation of shares in terms of the Telkom Employee Share PlanOn 5 June 2015, the Board approved the third and final allocation of shares to employees in terms of its employee share plan. The number of shares to vest will depend on the extent to which the performance conditions are met at the end of the applicable performance period.
Other matters The directors are not aware of any other matter or circumstance since the financial year ended 31 March 2015 and the date of this report, or otherwise dealt with in the financial statements, which significantly affects the financial position of the Group and the results of its operations.
1 0 2 7

www.telkom.co.za