group annual financial statements 2015 - … · redefine group annual financial statements 2015 1...
TRANSCRIPT

resultsREDEFINE PROPERTIES LIMITED
GROUP ANNUAL FINANCIAL STATEMENTS 2015

reflect2015 marks 15 years since listing. We celebrated 15 years of growth this year – growth in terms of returns, assets, people and impact. We’re not landlords. We’re people.
Black River Park, Observatory, Cape Town
Redefine Group Annual Financial Statements 2015 1
SECT
ION
1
HIGHLIGHTS FOR 2015CONTENTS
Section 1: ANNUAL FINANCIAL STATEMENTS 6
Directors’ responsibility and approval 6
Declaration by company secretary 6
Audit and risk committee report 7
Independent auditor’s report 10
Directors’ report 11
Consolidated statements of financial position 21
Consolidated statements of profit or loss and other comprehensive income 22
Consolidated statements of changes in equity 23
Consolidated statements of cashflows 24
Notes to the consolidated financial statements 25
Section 2: PROPERTY INFORMATION 90
Office 90
Retail 93
Industrial 95
Property portfolio 98
Section 3: GENERAL INFORMATION 100
Shareholders’ diary 100
Definitions 100
Administration IBC
Interactive PDF navigation
Contents list
Previous page
Next page
Search
Exit full screen
Interactive item
Report references
Integrated report
Annual financial statements
Full manufactured capital review
Social, ethics and sustainability report
Corporate governance report
Capitals
Financial
Manufactured
Human
Social and relationship
Intellectual
Natural
Building type
Office
Retail
Industrial
HOW TO NAVIGATE THE REPORT
Icons have been developed to make this report easier to read.
IR AFS SES
IR AFS SES
CGR MC
CGR MC
IR AFS SESO R I
O R I
O R I
This report also has interactivity enabled, buttons appear at the top of each page as a quick tool. Please see the list of interactivity functions above.
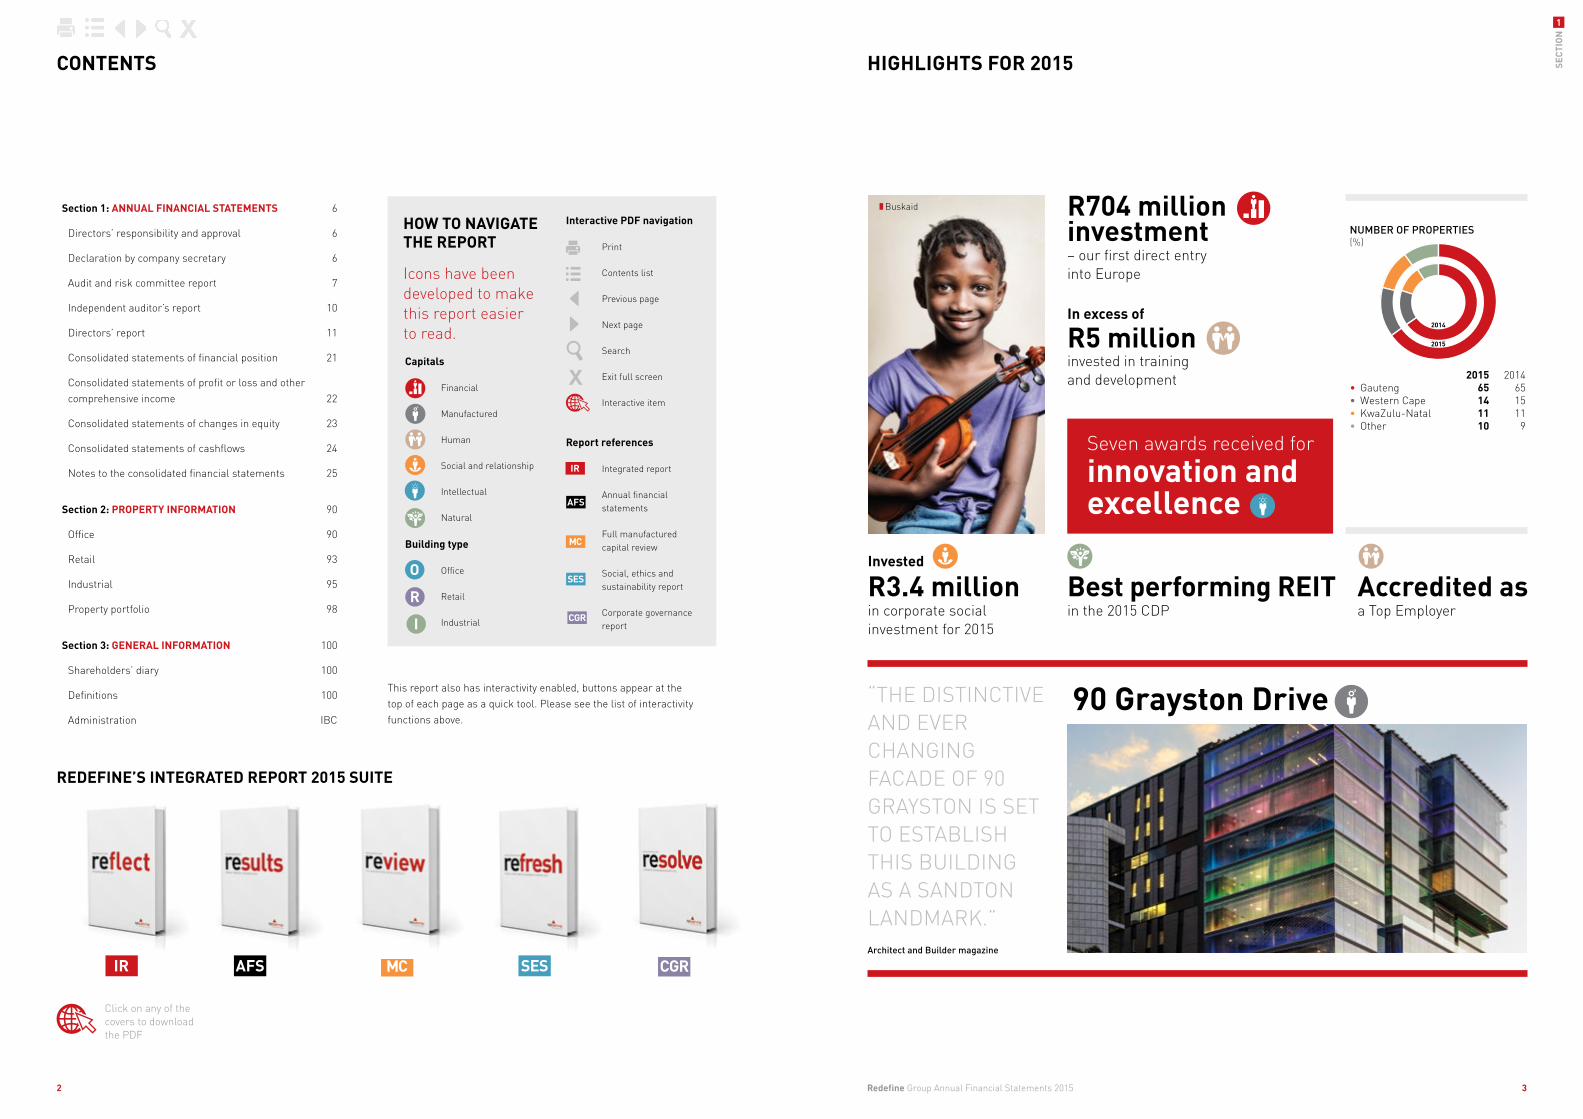
“THE DISTINCTIVE AND EVER CHANGING FACADE OF 90 GRAYSTON IS SET TO ESTABLISH THIS BUILDING AS A SANDTON LANDMARK.”Architect and Builder magazine
90 Grayston Drive
Invested
R3.4 million in corporate social investment for 2015
Seven awards received for
innovation and excellence
Best performing REITin the 2015 CDP
In excess of
R5 million invested in training and development
R704 million investment– our first direct entry into Europe
Accredited asa Top Employer
NUMBER OF PROPERTIES (%)
2015 2014• Gauteng 65 65• Western Cape 14 15• KwaZulu-Natal 11 11• Other 10 9
2015
2014
Buskaid
IR AFS SESIR AFS SES IR AFS SES CGR MCCGR MC
REDEFINE’S INTEGRATED REPORT 2015 SUITE
Redefine Group Annual Financial Statements 2015 3
SECT
ION
1
2
Click on any of the covers to download the PDF

reactionSection 1: Annual financial statementsPrepared in accordance with IFRS, JSE Listing Requirements King III and the requirements of the Companies Act 2008. We’re not landlords. We’re people.
Ericcson Woodmead, Johannesburg
Redefine Group Annual Financial Statements 2015 54
DIRECTORS’ RESPONSIBILITY AND APPROVALfor the year ended 31 August 2015
AUDIT AND RISK COMMITTEE REPORTfor the year ended 31 August 2015
CERTIFICATE BY COMPANY SECRETARY
The directors are responsible for the preparation and fair presentation of the company and group annual financial statements of Redefine Properties Limited, comprising the statement of financial position at 31 August 2015 and statements of comprehensive income, changes in equity and cashflows for the year then ended. To achieve the highest standards of financial reporting, these financial statements and group financial statements have been prepared in accordance with International Financial Reporting Standards, SAICA Financial Reporting Guides as issued by the Accounting Practices Committee, the Johannesburg Stock Exchange Listings Requirements, the requirements of the South African Companies Act, 71 of 2008, as amended.
The directors’ responsibility includes the design, implementation and maintenance of internal controls that will ensure the preparation, integrity and fair presentation of the financial statements and other financial information included in this report, selecting and applying appropriate accounting policies and making accounting estimates that are reasonable in the circumstances.
The directors have reviewed the appropriateness of the accounting policies and conclude that estimates and judgements are reasonable. They are of the opinion that the annual financial statements fairly present the financial position of the company and the group at 31 August 2015 and of its financial performance and cashflows for the year to 31 August 2015. The external auditors, who have unrestricted access to all records and information, as well as to the audit committee, concur with this statement. The directors believe that all representations made to the independent auditors during their audit are valid and appropriate. The unqualified audit report of Grant Thornton is presented on page 10.
In addition, the directors have also reviewed the cashflow forecast for the year to 31 August 2016 and believe that the company and the group have adequate resources to continue in operation for the foreseeable future. Accordingly, the annual financial statements have been prepared on a going-concern basis. These financial statements support the viability of the company and of the group.
The annual financial statements were approved by the board of directors on 4 November 2015 and are signed on its behalf by:
Marc Wainer Andrew KönigChairman Chief executive officer
In terms of section 88(2)(e) of the Companies Act, No 71 of 2008, as amended (the Companies Act), we declare that to the best of my knowledge, for the year ended 31 August 2015, Redefine Properties Limited has lodged with the Registrar of Companies all such returns as are required of a public company in terms of the Act and that such returns are true, correct and up to date.
Bronwyn BakerCompany secretary
4 November 2015
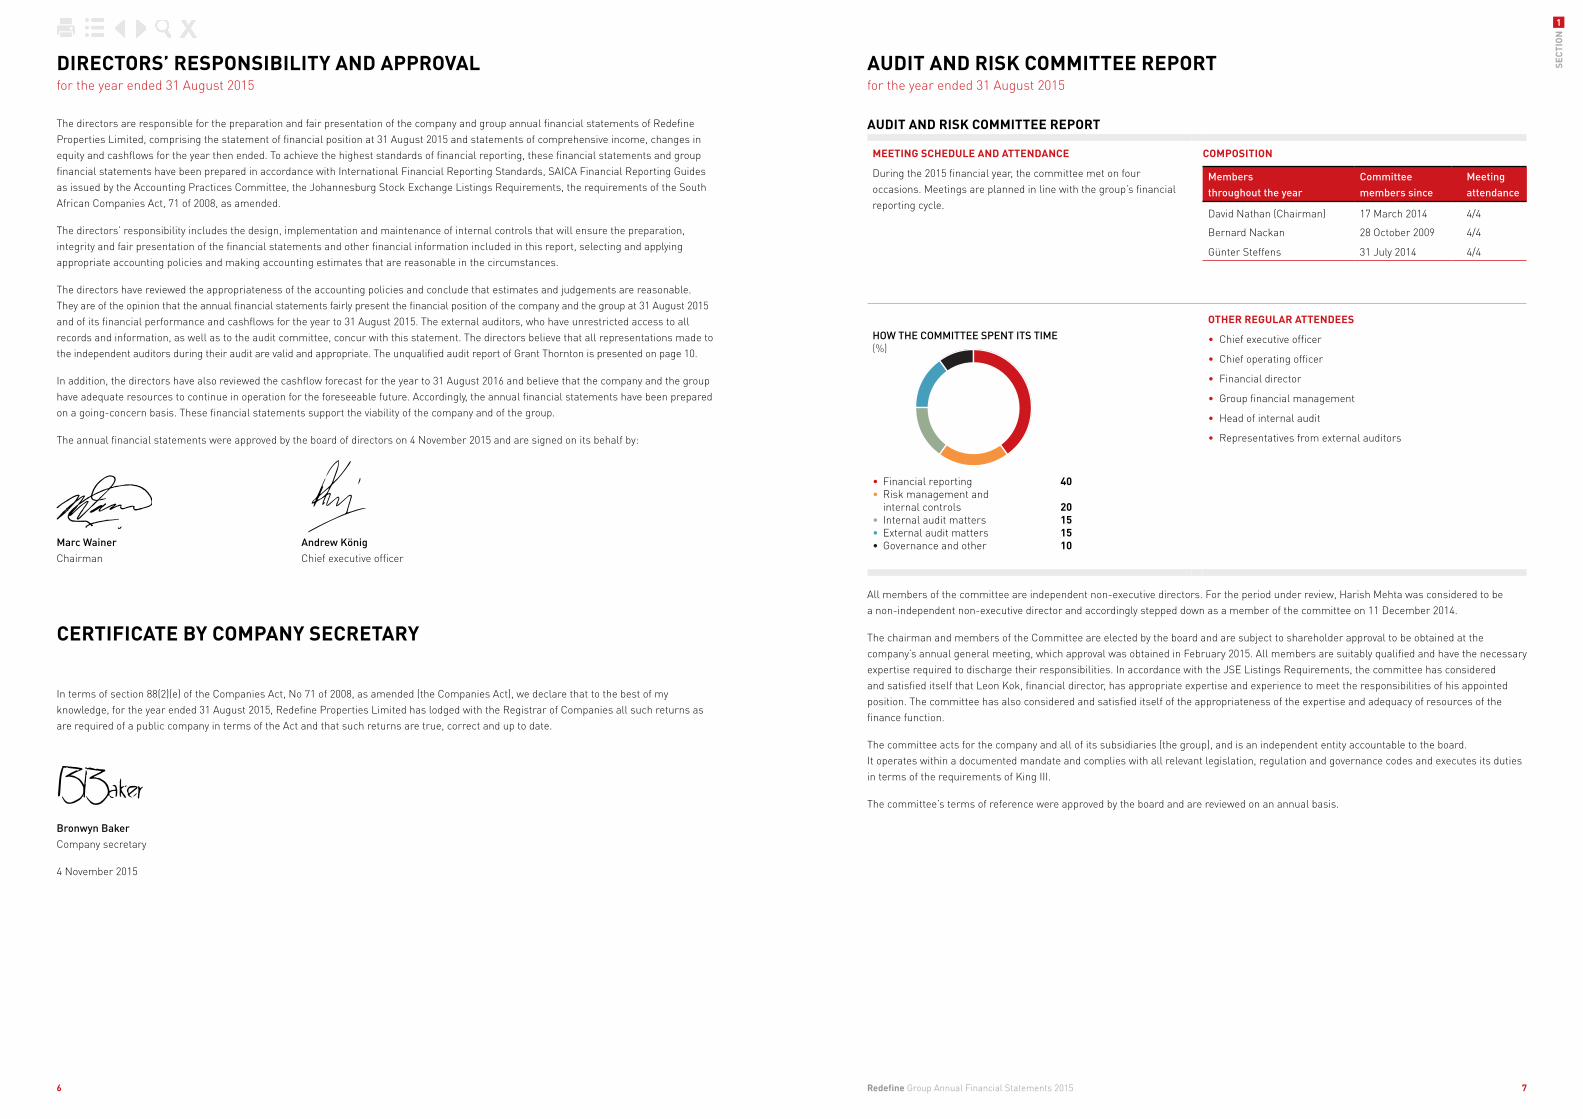
AUDIT AND RISK COMMITTEE REPORT
MEETING SCHEDULE AND ATTENDANCE
During the 2015 financial year, the committee met on four occasions. Meetings are planned in line with the group’s financial reporting cycle.
COMPOSITION
Members throughout the year
Committee members since
Meetingattendance
David Nathan (Chairman) 17 March 2014 4/4
Bernard Nackan 28 October 2009 4/4
Günter Steffens 31 July 2014 4/4
HOW THE COMMITTEE SPENT ITS TIME (%)
• Financial reporting 40• Risk management and internal controls 20• Internal audit matters 15• External audit matters 15• Governance and other 10
OTHER REGULAR ATTENDEES
• Chief executive officer
• Chief operating officer
• Financial director
• Group financial management
• Head of internal audit
• Representatives from external auditors
All members of the committee are independent non-executive directors. For the period under review, Harish Mehta was considered to be a non-independent non-executive director and accordingly stepped down as a member of the committee on 11 December 2014.
The chairman and members of the Committee are elected by the board and are subject to shareholder approval to be obtained at the company’s annual general meeting, which approval was obtained in February 2015. All members are suitably qualified and have the necessary expertise required to discharge their responsibilities. In accordance with the JSE Listings Requirements, the committee has considered and satisfied itself that Leon Kok, financial director, has appropriate expertise and experience to meet the responsibilities of his appointed position. The committee has also considered and satisfied itself of the appropriateness of the expertise and adequacy of resources of the finance function.
The committee acts for the company and all of its subsidiaries (the group), and is an independent entity accountable to the board. It operates within a documented mandate and complies with all relevant legislation, regulation and governance codes and executes its duties in terms of the requirements of King III.
The committee’s terms of reference were approved by the board and are reviewed on an annual basis.
Redefine Group Annual Financial Statements 2015 7
SECT
ION
1
6

The committee concluded that the head of internal audit provides appropriate leadership of the internal audit function which remains effective in carrying out its mandate.
INTERNAL FINANCIAL CONTROL AND COMPLIANCEThe committee:
• Reviewed and approved the existing funding policy and reviewed the quarterly funding reports prepared by management
• Reviewed the quarterly legal and regulatory reports setting out the latest legislative and regulatory developments impacting the group
• Reviewed and approved the revised compliance policy
• Fulfilled an oversight function with regards to tax governance and compliance
• Monitored compliance with BBBEE requirements
• Considered, and where appropriate, made recommendations on internal financial controls
The committee considered the comments in the audit reports issued by the head of internal audit on the audits conducted, and together with other information available from management and the year-end external audit reports, and determined that there were no material weaknesses in internal control and risk management. On this basis, the committee has made a recommendation to the board on the effectiveness of the system of internal controls for inclusion in the directors’ responsibility statement.
RISK MANAGEMENTThe committee:
• Reviewed and approved the enterprise risk management policy and framework, the risk management plan, tolerance levels and most significant risks
• Monitored fraud risk management, including the whistle-blower facility
• Monitored compliance with the risk management policy
• Reviewed the risk disclosures, including key sustainability risks, to shareholders to be included in the integrated report and advised the board on their appropriateness
The committee is reasonably satisfied that adequate compensating controls are in place in order to mitigate identified significant risks.
INFORMATION TECHNOLOGY GOVERNANCEThe board mandated the committee to provide oversight over IT governance. As such, the committee oversaw the implementation and review of all relevant IT governance mandates, policies, processes and control frameworks while ensuring compliance with all the standards adopted by the company.
In order to assist the committee in the discharge of its duties in respect of IT governance, the committee mandated the company’s IT steering committee with the executive oversight of IT governance. The steering committee ensure that the IT strategy supports the business goals and objectives as well as the sustainability objectives of the group. The steering committee are responsible for the implementation of, and measurement against, the IT governance framework and related initiatives in conjunction with the other existing oversight bodies.
Based on the processes and assurances obtained, the committee believes that the company’s accounting practices are effective.
COMMITTEE FOCUS IN 2016While the committee will continue to operate within its terms of reference and ensure that the meetings address all regular matters reserved for its consideration, the following additional key activities are expected to require the committee’s attention during 2016:
• IT governance and cyber security
• Risk management and internal control
• Combined assurance
On behalf of the audit and risk committee
David Nathan
Audit and risk committee chairman
COMMITTEE ACTIVITIESThe principal matters attended to by the committee during the year include:
EXTERNAL AUDITThe committee:
• Reviewed the external auditors effectiveness, independence and objectivity
• Approved, in consultation with management, the audit fee and engagement terms for the external auditors for the 2015 financial year
• Reviewed and approved the non-audit services fees and ensured that the fees were within limit and in line with the non-audit services policy
• Determined the nature and extent of allowable non-audit services and approved the contract terms for the provision of non-audit services
• Reviewed and approved the external audit plan
• Reviewed the external audit reports and managements response thereto and considered their effect on the financial statements and internal financial control
The committee confirms that the external auditor has functioned in accordance with its terms of reference for the 2015 financial year.
EXTERNAL AUDIT TENDERIn line with corporate governance best practice, the committee decided to put the external audit out to tender in October 2015.
Having considered all relevant factors in relation to the tender process, the committee made a recommendation to, and which was accepted by the board that resolutions to appoint KPMG Incorporated as the company’s independent external auditors to be approved by shareholders at the annual general meeting of the company, to be held in February 2016.
FINANCIAL STATEMENTSThe committee reviewed the interim results and year-end financial statements, including the public announcements of the group’s financial results, and made recommendations to the board for their approval. In the course of its review, the committee:
• Took steps to ensure that the financial statements were prepared in accordance with IFRS
• Considered the appropriateness of accounting policies and disclosures made
• Completed a detailed review of the going concern assumption, confirming that it was appropriate in the preparation of the financial statements
The committee was not required to deal with any complaints relating to accounting practices or internal audit, nor to the content or audit of the financial statements, nor internal financial controls and related matters.
INTEGRATED REPORTThe committee fulfilled an oversight role regarding the company’s integrated report and the reporting process. Accordingly, it has:
• Considered the integrated report and assessed the consistency of operational, financial and other information known to the committee with the annual financial statements
• Assisted the board and the social and ethics committee in approving disclosure of sustainability issues in the integrated report by ensuring the information is reliable and does not conflict with the financial results
• Recommended the integrated report for the year ended 31 August 2015 for approval by the board
INTERNAL AUDITThe committee:
• Reviewed and approved the existing internal audit charter, which ensures that the internal audit function is independent and has the necessary resources, standing and authority within the organisation to enable it to discharge its duties
• Satisfied itself of the credibility, independence and objectivity of the internal audit function
• Ensured that internal audit had direct access to the chairman of the committee
• Reviewed and approved the annual internal audit plan, ensuring that material risk areas were included and that the coverage of significant business processes was acceptable
• Reviewed the quarterly internal audit reports, covering the effectiveness of internal controls, material fraud incidents and material non-compliance with the company’s policies and procedures
• Considered and reviewed with management and internal audit, any significant findings and management responses thereto in relation to reliable financial reporting, corporate governance and effective internal controls to ensure appropriate action was taken
The internal audit function provided a written assessment of the effectiveness of the company’s system of internal controls and confirmed that, based on results of work undertaken; they provided reasonable assurance regarding the adequacy and effectiveness of the systems of internal control.
AUDIT AND RISK COMMITTEE REPORT continued
for the year ended 31 August 2015
Redefine Group Annual Financial Statements 2015 9
SECT
ION
1
8

INDEPENDENT AUDITOR’S REPORTfor the year ended 31 August 2015
DIRECTORS’ REPORTfor the year ended 31 August 2015
TO THE SHAREHOLDERS OF REDEFINE PROPERTIES LIMITEDWe have audited the consolidated and separate financial statements of Redefine Properties Limited set out on pages 21 to 87, which comprise the statements of financial position as at 31 August 2015, and the statements of profit or loss and other comprehensive income, statements of changes in equity and statements of cashflows for the year then ended, and the notes, comprising a summary of significant accounting policies and other explanatory information.
DIRECTORS’ RESPONSIBILITY FOR THE FINANCIAL STATEMENTSThe company’s directors are responsible for the preparation and fair presentation of these consolidated and separate financial statements in accordance with International Financial Reporting Standards and the requirements of the Companies Act of South Africa and for such internal control as the directors determine is necessary to enable the preparation of consolidated and separate financial statements that are free from material misstatements, whether due to fraud or error.
AUDITOR’S RESPONSIBILITYOur responsibility is to express an opinion on these consolidated and separate financial statements based on our audit. We conducted our audit in accordance with International Standards on Auditing. Those standards require that we comply with ethical requirements and plan and perform the audit to obtain reasonable assurance about whether the consolidated and separate financial statements are free from material misstatement.
An audit involves performing procedures to obtain audit evidence about the amounts and disclosures in the financial statements. The procedures selected depend on the auditor’s judgement, including the assessment of the risks of material misstatement of the financial statements, whether due to fraud or error. In making those risk assessments, the auditor considers internal control relevant to the entity’s preparation and fair presentation of the financial statements in order to design audit procedures that are appropriate in the circumstances, but not for the purpose of expressing an opinion on the effectiveness of the entity’s internal control. An audit also includes evaluating the appropriateness of accounting policies used and the reasonableness of accounting estimates made by management, as well as evaluating the overall presentation of the financial statements.
We believe that the audit evidence we have obtained is sufficient and appropriate to provide a basis for our audit opinion.
OPINIONIn our opinion, the consolidated and separate financial statements present fairly, in all material respects, the consolidated and separate financial position of Redefine Properties Limited as at 31 August 2015, and its consolidated and separate financial performance and consolidated and separate cashflows for the year then ended in accordance with International Financial Reporting Standards, and the requirements of the Companies Act of South Africa.
OTHER REPORTS REQUIRED BY THE COMPANIES ACTAs part of our audit of the consolidated and separate financial statements for the year ended 31 August 2015, we have read the Directors’ Report, Audit Committee’s Report and Company Secretary’s Certificate for the purpose of identifying whether there are material inconsistencies between these reports and the audited consolidated and separate financial statements. These reports are the responsibility of the respective preparers. Based on reading these reports we have not identified material inconsistencies between these reports and the audited consolidated and separate financial statements. However, we have not audited these reports and accordingly do not express an opinion on these reports.
GRANT THORNTON JOHANNESBURG PARTNERSHIPRegistered Auditors
G M ChaitowitzPartnerRegistered AuditorChartered Accountant (SA)
4 November 2015
@Grant ThorntonWanderers Office Park52 Corlett DriveIllovo, 2196
TO THE SHAREHOLDERS OF REDEFINE PROPERTIES LIMITED
We have pleasure in presenting the annual financial statements of Redefine Properties Limited for the year ended 31 August 2015.
CORPORATE OVERVIEWRedefine is a listed Real Estate Investment Trust. It derives rental income from investments in office, retail and industrial properties, distributions from listed security investments, distributions from investment in associates and joint ventures and earns fee income from rendering property and asset management services.
NATURE OF THE BUSINESSThe nature of business and operations are commented on in detail in the business overview section of the integrated report.
FINANCIAL RESULTSThe annual financial results for the year ended 31 August 2015 are set out in detail on pages 21 to 87 of these annual financial statements.
INTERNATIONAL FINANCIAL REPORTING STANDARDSThe annual financial statements are prepared in terms of International Financial Reporting Standards.
YEAR UNDER REVIEWThe year under review is covered fully in the chairman’s, chief executive’s review and financial director’s report in the integrated report.
STATED CAPITALThe company’s authorised stated capital consists of 6 500 000 000 ordinary shares of no par value.
Pursuant to the general authority to issue shares for cash and for the acquisition of property assets granted at the annual general meetings in January 2014 and February 2015, the following additional shares were issued during:
• 86 904 498 shares were issued at an issue price of R9.66 per share on 29 September 2014
• 3 260 000 shares were issued at an issue price of R9.50 per share on 2 October 2014
• 143 107 149 shares were issued at an issue price of R9.50 per share on 10 October 2014
• 16 773 280 shares were issued at an issue price of R9.42 per share on 17 October 2014
• 103 991 300 shares were issued at an issue price of R9.50 per share on 3 December 2014
• 139 610 425 shares were issued at an issue price of R12.43 per share on 15 April 2015
• 58 722 042 shares were issued at an issue price of R10.70 per share on 9 July 2015
• 300 000 000 shares were issued at an issue price of R10.18 per share on 17 July 2015
• 337 078 515 shares were issued at an issue price of R11.15 per share on 3 August 2015
• 154 545 455 shares were issued at an issue price of R11.00 per share on 27 August 2015
At 31 August 2015 there were 4 754 499 789 shares in issue.
As a result of the above shares issues, 4 754 499 789 shares rank for the dividend declared on 5 November 2015.
DIVIDEND DISTRIBUTIONSOn 6 November 2014 the board declared a final dividend of 38.14 cents for the six months ended 31 August 2014 which was paid on 1 December 2014.
On 7 May 2015 the board declared an interim dividend of 39.00 cents for the six months ended 28 February 2015 which was paid on 1 June 2015.
Subsequent to year-end, on 5 November 2015, the board declared a final dividend of 41.00 cents for the six months ended 31 August 2015 which will be paid on 30 November 2015.
This dividend has been declared from distributable earnings and meets the requirement of a REIT “qualifying distribution” for purposes of section 25BB of the Income Tax Act, No 58 of 1962 (as amended).
Redefine Group Annual Financial Statements 2015 11
SECT
ION
1
10

DIRECTORS’ REPORT continued
for the year ended 31 August 2015
There have been no changes in these holdings between the year-end and the date of this report.
At 31 August 2014, the interests of the directors in the shares of Redefine were as follows:
BENEFICIAL
Direct Indirect Associate Total
AJ König 2 416 849 – – 2 416 849
B Nackan 9 339 – – 9 339
DA Nathan – – – –
DH Rice 2 438 793 – – 2 438 793
GZ Steffens – – – –
HK Mehta 107 345 31 434 972 67 689 153 99 231 470
M Wainer 7 956 728 13 055 661 248 984 21 261 373
MJ Ruttell 78 500 – – 78 500
MJ Watters – – – –
13 007 554 44 490 633 67 938 137 125 436 324
FEES EARNED FOR SERVICES AS NON-EXECUTIVE DIRECTORS
2015 2014
B Nackan 615 550
D Gihwala – 396
D Perton – 123
DA Nathan 545 211
GZ Steffens 520 309
HK Mehta 423 465
MK Khumalo – 74
MJ Watters 330 25
P Langeni 110 –
R Robinson – 197
RW Rees 215 430
2 758 2 780
EXECUTIVE DIRECTORS’ REMUNERATION
Salary and allowances
R000
Bonuses and performance
related payments
R000
Other benefits and
payments R000
Retirement benefits
R000Total R000
2015
AJ König 3 268 6 070 128 368 9 834
DH Rice 2 929 6 174 170 263 9 536
LC Kok 2 346 1 616 158 275 4 395
M Wainer 3 863 8 191 147 – 12 201
MJ Ruttell 1 613 3 262 – – 4 875
14 019 25 313 603 906 40 841
2014
AJ König 2 854 5 968 80 326 9 228
DH Rice 2 645 6 141 122 240 9 148
M Wainer 3 615 7 993 139 – 11 747
MJ Ruttell 1 400 1 260 – – 2 660
10 514 21 362 341 566 32 783
DIRECTORATEThe directors of the company at the date of this report were:
Executive directors:M Wainer – Executive chairmanLC Kok – Financial director AJ König – Chief executive officerDH Rice+ – Chief operating officerMJ Ruttell@ – Executive: Development
Non-executive directors:M Barkhuysen*NB Langa-Royds*P Langeni*HK MehtaB Nackan* – Lead independentDA Nathan*GZ Steffens*# MJ Watters
* Independent+ British# German@ Irish
Details of each director’s curriculum vitae can be found in the integrated report.
B Nackan, GZ Steffens and HK Mehta retire at the forthcoming annual general meeting and are all eligible for re-election. The confirmation of appointment of P Langeni, M Barkhuysen and NB Langa-Royds as directors of the company will also be voted on at the forthcoming annual general meeting.
The following changes to the directorate took place during the year:
• LC Kok was appointed on 1 October 2014
• P Langeni was appointed on 6 May 2015
• NB Langa-Royds was appointed on 4 November 2015
• M Barkhuysen was appointed on 4 November 2015
DIRECTORS’ INTERESTSThe interests of the directors in the shares of Redefine at 31 August 2015 were as follows:
BENEFICIAL
Direct Indirect Associate Total
AJ König 2 690 514 – – 2 690 514
B Nackan 11 609 – – 11 609
DA Nathan – – – –
DH Rice 2 685 175 – – 2 685 175
GZ Steffens – – – –
HK Mehta 107 345 31 434 972 69 190 127 100 732 444
M Wainer 8 304 495 13 055 661 319 814 21 679 970
LC Kok 99 988 – – 99 988
MJ Ruttell 212 990 – – 212 990
MJ Watters – – – –
P Langeni – – – –
14 112 116 44 490 633 69 509 941 128 112 690
Redefine Group Annual Financial Statements 2015 13
SECT
ION
1
12

DETAILS OF SHARE APPRECIATION RIGHTS AWARDED TO THE EXECUTIVE DIRECTORS
OPENING AWARDED FORFEITED VESTED CLOSING
Strike price
R
Number of
shares
Strike price
RNumber
of shares
Strike price
R
Number of
sharesVWAP*
R
Number of
shares
Strike price
R
Number of
shares
2015
AJ König 6.50 800 000 – – – – 9.66 (400 000) 6.50 400 000
7.00 500 000 – – – – 9.66 (250 000) 7.00 250 000
DH Rice 6.50 800 000 – – – – 9.66 (400 000) 6.50 400 000
7.00 500 000 – – – – 9.66 (250 000) 7.00 250 000
M Wainer 6.50 1 300 000 – – – – 9.66 (650 000) 6.50 650 000
7.00 400 000 – – – – 9.66 (200 000) 7.00 200 000
MJ Ruttell 6.50 375 000 – – – – 9.66 (187 500) 6.50 187 500
7.00 65 000 – – – – 9.66 (32 500) 7.00 32 500
4 740 000 – – – – – 2 370 000 2 370 000
2014
AJ König 6.50 1 200 000 – – – – 9.12 (400 000) 6.50 800 000
7.00 750 000 – – – – 9.12 (250 000) 7.00 500 000
DH Rice 6.50 1 200 000 – – – – 9.12 (400 000) 6.50 800 000
7.00 750 000 – – – – 9.12 (250 000) 7.00 500 000
M Wainer 6.50 1 950 000 – – – – 9.12 (650 000) 6.50 1 300 000
7.00 600 000 – – – – 9.12 (200 000) 7.00 400 000
MJ Ruttell 6.50 562 500 – – – – 9.12 (187 500) 6.50 375 000
7.00 97 500 – – – – 9.12 (32 500) 7.00 65 000
7 110 000 – – – – – 2 370 000 4 740 000
* Volume weighted average price.
The R6.50 appreciation rights vest in equal tranches of 25% on the following dates:
• 3 September 2012
• 4 September 2013
• 3 September 2014
• 1 September 2015
The R7.00 appreciation rights vest in equal tranches of 33.33% on the following dates:
• 4 September 2013
• 3 September 2014
• 1 September 2015
On 3 September 2012 the first 25% tranche vested. The 10 day VWAP for the share price was R9.29.
On 4 September 2013 the second 25% tranche and first 33.33% tranche vested. The 10 day VWAP for the share price was R9.12.
On 3 September 2014 the third 25% tranche and second 33.33% tranche vested. The 10 day VWAP for the share price was R9.66.
On 8 September 2015 the fourth 25% tranche and third 33.33% tranche vested. The 10 day VWAP for the share price was R11.10.
DIRECTORS’ REPORT continued
for the year ended 31 August 2015
EXECUTIVE DIRECTORS’ TOTAL REMUNERATION IN TERMS OF IFRSThe table below provides an indication of the total cost to company in relation to executive directors’ remuneration. Total cash payments and benefits reflect the information disclosed in the tables on the previous page. The IFRS accounting charge reflects the cost that has been expensed by the company in profit or loss in the relevant year in relation to long-term incentive awards that have been granted to executives.
Salary,bonuses
and otherbenefits
R000
AccountingIFRS charge in
respect ofStaff Incentive
Schemeawards^
R000
Total IFRS Remuneration
R000
2015
AJ König 9 834 2 889 12 723
DH Rice 9 536 3 019 12 555
LC Kok 4 395 2 878 7 273
M Wainer 12 201 3 948 16 149
MJ Ruttell 4 875 2 805 7 680
40 841 15 539 56 380
2014
AJ König 9 228 3 123 12 351
DH Rice 9 148 3 852 13 000
M Wainer 11 747 5 124 16 871
MJ Ruttell 2 660 11 2 671
32 783 12 110 44 893
^ The IFRS charge is a calculation based on the present value of total awards made to executives that will vest in future years, compared to the amount calculated in the prior year, arriving at the expense accounted for in profit or loss. It should be noted that the amount estimated here will differ significantly from the actual expense in the current and future years, which is based on the number of shares that vested, calculated at the price at which they vested
PRESCRIBED OFFICERS’ REMUNERATION
Salary and allowances
R000
Bonuses and performance
related payments R000
Other benefits and payments
R000
Retirement benefits
R000TotalR000
2015
There were no prescribed officers other than executive directors during 2015 – – – – –
– – – – –
2014
Prescribed officer 1 092 1 017 77 130 2 316
Prescribed officer 841 806 107 91 1 845
1 933 1 823 184 221 4 161
Redefine Group Annual Financial Statements 2015 15
SECT
ION
1
14

GOING CONCERNThe directors consider that the group has adequate resources to continue operating for the foreseeable future and that it is appropriate to adopt the going-concern basis in preparing the group financial statements. The company has reasonably satisfied the liquidity and solvency test as required by the Companies Act and the directors have satisfied themselves that the group is in a sound financial position and that it has access to sufficient funding facilities to meet its foreseeable cash requirements.
MAJOR SHAREHOLDERSBeneficial shareholders holding in excess of 2% of the shares in issue are detailed in the integrated report.
INTEREST IN SUBSIDIARIESDetails of Redefine’s interest in directly held subsidiaries at 31 August 2015 are as follows:
Name of subsidiary
Country of incorpo-
ration % Held
Net profit/(loss)R000
Issued share
capital R000
Indebted-nessR000
Sharesat cost
R000
31 August 2015TotalR000
31 August R000
Madison Property Fund Managers Holdings Limited and subsidiaries South Africa 100 474 899 – 1 454 148 80 399 1 534 547 1 441 002
Redefine Retail Proprietary Limited South Africa 100 723 379 4 2 923 226 1 429 001 4 352 227 9 749 104
Redefine Pacific Proprietary Limited Mauritius 100 48 195 45 525 488 45 525 533 506 641
Fountainhead Property Administration Proprietary Limited South Africa 100 12 599 – 272 475 235 029 507 504 525 176
Fountainhead Property Trust Management Limited South Africa 100 7 778 1 000 – 128 080 128 080 128 080
Redefine Global Proprietary Limited and subsidiaries South Africa 100 330 058 2 309 062 – 2 309 062 2 309 062 2 184 000
Annuity Properties Limited South Africa 100 64 972 2 396 689 115 1 307 514 1 996 629 1 309 740
Annuity Asset Managers Proprietary Limited South Africa 100 (110) 10 5 552 80 648 86 200 86 200
Annuity Property Managers Proprietary Limited South Africa 100 (31) 10 – 16 900 16 900 16 900
Redefine Property Management Proprietary Limited South Africa 100 (335) – 2 945 – 2 945 –
Leaf Property Fund Proprietary Limited and subsidiaries South Africa 100 (20 448) 78 660 125 417 2 529 873 2 655 290 –
Partridge Investments Limited and subsidiaries
British Virgin Islands and
South Africa 100 650 443 – 3 893 694 294 698 187 –
Total 2 291 399 2 391 187 6 002 259 8 810 845 14 813 104 15 946 843
SUBSEQUENT EVENTSDIVIDEND DECLARATION AFTER REPORTING DATE
In line with IAS 10, Events after the Reporting Period, the declaration of the dividend occurred after the end of the reporting period, resulting in a non-adjusting event that is not recognised in the financial statements.
EXTERNAL AUDIT TENDER
In line with corporate governance best practice, the committee decided to put the external audit out to tender in October 2015.
Having considered all relevant factors in relation to the tender process, the committee made a recommendation to, and which was accepted by the board that resolutions to appoint KPMG Incorporated as the company’s independent external auditors be proposed at the annual general meeting of the company, to be held in February 2016.
SECRETARYCIS Company Secretaries resigned with effect from 1 August 2015 and B Baker was appointed to act as the company secretary with effect from 1 August 2015.
DETAILS OF THE EXECUTIVE DIRECTORS RESTRICTED SHARE SCHEMEThe second grant of the restricted share scheme took place during the current financial year.
Balance at31 August 2014 Allotted Forfeited Vested
Balance at31 August 2015
AJ König 540 000 225 000 (30 240) (149 760) 585 000
DH Rice 675 000 225 000 (37 800) (187 200) 675 000
LC Kok – 640 000 – (160 000) 480 000
M Wainer 900 000 300 000 (50 400) (249 600) 900 000
MJ Ruttell – 600 000 – (150 000) 450 000
2 115 000 1 990 000 (118 440) (896 560) 3 090 000
In terms of this scheme the directors have a conditional right to a share, which is awarded subject to performance and vesting conditions. Refer to note 20, share based payments, in the annual financial statements.
DETAILS OF THE EXECUTIVE DIRECTORS MATCHING SHARE SCHEMEThe second grant of the matching shares scheme took place during the current financial year.
In terms of this scheme the directors are invited annually to utilise a predetermined percentage of their after tax bonus to acquire Redefine shares. Directors holding these shares at the third anniversary of the date of award will be awarded additional Redefine shares free of consideration based on a multiple of the original shares linked to the group and individuals performance. Refer to note 20, share based payments, in the annual financial statements.
Balance at31 August 2014 Allotted
Balance at31 August 2015
AJ König 318 600 316 515 635 115
DH Rice 293 829 284 256 578 085
M Wainer 367 167 370 935 738 102
MJ Ruttell 21 165 23 725 44 890
1 000 761 995 431 1 996 192
FEES EARNED FOR SERVICES AS EXECUTIVE DIRECTORS OF FOUNTAINHEAD PROPERTY TRUST MANAGEMENT LIMITED (A SUBSIDIARY COMPANY)
Director2015 Fees
R2014 Fees
R
AJ König (remitted to Redefine Properties Limited) 296 500 242 500
DH Rice (remitted to Redefine Properties Limited) 296 500 242 500
M Wainer (remitted to Redefine Properties Limited) 296 500 242 500
B Nackan 218 500 205 000
SERVICE CONTRACTSExecutive directors retire from their positions and from the board (as executive directors) at the age of 65. Though normal retirement age is 65 years for executive directors, the company’s retirement policy makes provision to extend the working relationship beyond the normal retirement age. The executive directors are subject to three calendar month’s written notice under their existing employment contracts.
DIRECTORS’ REPORT continued
for the year ended 31 August 2015
Redefine Group Annual Financial Statements 2015 17
SECT
ION
1
16

Company Nature of special resolution Date passed Date registered
REDEFINE GLOBAL PROPRIETARY LIMITED
Financial assistance to related and inter-related parties
Authorisation for the company to provide direct or indirect financial assistance as contemplated in Section 45 of the Companies Act by way of loans, guarantees, the provision of security or otherwise, to any of its present or future subsidiaries and/or any other company or corporation that is or becomes related or inter-related to the company for any purpose or in connection with any matter, subject to the board of directors being satisfied that the terms under which the financial assistance is proposed to be given are fair and reasonable to the company and that, immediately after the provision of such financial assistance, the company would satisfy the solvency and liquidity test contemplated in the Companies Act, such authority to endure for a period of two years or until its renewal.
30 January 2015 Not required to be registered
FOUNTAINHEAD PROPERTY ADMINISTRATION PROPRIETARY LIMITED
Financial assistance to related and inter-related parties
Authorisation for the company to provide direct or indirect financial assistance as contemplated in Section 45 of the Companies Act by way of loans, guarantees, the provision of security or otherwise, to any of its present or future subsidiaries and/or any other company or corporation that is or becomes related or inter-related to the company for any purpose or in connection with any matter, subject to the board of directors being satisfied that the terms under which the financial assistance is proposed to be given are fair and reasonable to the company and that, immediately after the provision of such financial assistance, the company would satisfy the solvency and liquidity test contemplated in the Companies Act, such authority to endure for a period of two years or until its renewal.
30 January 2015 Not required to be registered
MADISON PROPERTY FUND MANAGERS LIMITED
Financial assistance to related and inter-related parties
Authorisation for the company to provide direct or indirect financial assistance as contemplated in Section 45 of the Companies Act by way of loans, guarantees, the provision of security or otherwise, to any of its present or future subsidiaries and/or any other company or corporation that is or becomes related or inter-related to the company for any purpose or in connection with any matter, subject to the board of directors being satisfied that the terms under which the financial assistance is proposed to be given are fair and reasonable to the company and that, immediately after the provision of such financial assistance, the company would satisfy the solvency and liquidity test contemplated in the Companies Act, such authority to endure for a period of two years or until its renewal.
30 January 2015 Not required to be registered
SPECIAL RESOLUTIONSThe following special resolutions were registered for Redefine Properties Limited and its subsidiaries, having been passed by the shareholders to the date of this report:
Company Nature of special resolution Date passed Date registered
REDEFINE PROPERTIES LIMITED
Approval of 2015 fees payable to non-executive directors
Approval, in accordance with Section 66(9) of the Companies Act, for the payment by the company of remuneration to each of the non-executive directors of the company for each non-executive directors services as a non-executive director for the 2015 financial year.
19 February 2015 Not required to be registered
Share repurchases 19 February 2015 Not required to be registered
Authorisation, by way of a general approval, for the company or any of its subsidiaries, to acquire ordinary shares issued by the company, in terms of Sections 46 and 48 of the Companies Act and in terms of the JSE Listings Requirements.
Financial assistance to related and inter-related parties 19 February 2015 Not required to be registered
Authorisation for the company to provide direct or indirect financial assistance as contemplated in Section 45 of the Companies Act by way of loans, guarantees, the provision of security or otherwise, to any of its present or future subsidiaries and/or any other company or corporation that is or becomes related or inter-related to the company for any purpose or in connection with any matter, subject to the board of directors being satisfied that the terms under which the financial assistance is proposed to be given are fair and reasonable to the company and that, immediately after the provision of such financial assistance, the company would satisfy the solvency and liquidity test contemplated in the Companies Act, such authority to endure for a period of two years or until its renewal.
REDEFINE RETAIL PROPRIETARY LIMITED
Financial assistance to related and inter-related parties
Authorisation for the company to provide direct or indirect financial assistance as contemplated in Section 45 of the Companies Act by way of loans, guarantees, the provision of security or otherwise, to any of its present or future subsidiaries and/or any other company or corporation that is or becomes related or inter-related to the company for any purpose or in connection with any matter, subject to the board of directors being satisfied that the terms under which the financial assistance is proposed to be given are fair and reasonable to the company and that, immediately after the provision of such financial assistance, the company would satisfy the solvency and liquidity test contemplated in the Companies Act, such authority to endure for a period of two years or until its renewal.
30 January 2015 Not required to be registered
DIRECTORS’ REPORT continued
for the year ended 31 August 2015
Redefine Group Annual Financial Statements 2015 19
SECT
ION
1
18

DIRECTORS’ REPORT continued
for the year ended 31 August 2015
Company Nature of special resolution Date passed Date registered
MADISON PROPERTY FUND MANAGERS HOLDINGS LIMITED
Financial assistance to related and inter-related parties
Authorisation for the company to provide direct or indirect financial assistance as contemplated in Section 45 of the Companies Act by way of loans, guarantees, the provision of security or otherwise, to any of its present or future subsidiaries and/or any other company or corporation that is or becomes related or inter-related to the company for any purpose or in connection with any matter, subject to the board of directors being satisfied that the terms under which the financial assistance is proposed to be given are fair and reasonable to the company and that, immediately after the provision of such financial assistance, the company would satisfy the solvency and liquidity test contemplated in the Companies Act, such authority to endure for a period of two years or until its renewal.
30 January 2015 Not required to be registered
LEAF PROPERTY FUND PROPRIETARY LIMITED/REDEFINE COMMERCIAL PROPRIETARY LIMITED
Change of company name
Change of name from Leaf Property Fund (Proprietary) Limited to Redefine Commercial (Proprietary) Limited.
22 July 2015 19 August 2015
CONSOLIDATED STATEMENTS OF FINANCIAL POSITIONas at 31 August
GROUP COMPANY
Note2015R000
2014R000
2015R000
2014R000
ASSETSNon-current assets 67 465 410 55 007 339 65 703 472 43 352 797 Investment property 49 898 869 40 906 077 40 855 786 25 190 902 – Fair value of investment property 2 46 589 717 37 710 045 38 059 340 23 177 055 – Straight-line rental income accrual 3 1 436 762 1 213 985 1 262 744 762 016 – Properties under development 4 1 872 390 1 982 047 1 533 702 1 251 831 Listed securities 5 988 793 2 750 900 1 749 490 621 845 Goodwill and intangible assets 6 5 367 047 5 328 676 1 168 697 275 416 Interest in associates and joint ventures 7 9 823 319 4 173 173 – – Loans receivable 8 1 184 924 1 727 212 4 238 782 1 222 299 Other financial assets 9 – 23 510 2 691 197 –Interest rate swaps 22 93 150 – 78 718 –Guarantee fees receivable 10 73 760 50 000 73 760 50 000 Property, plant and equipment 11 35 548 47 791 33 938 45 492 Interest in subsidiaries 12 – – 14 813 104 15 946 843
Current assets 1 422 776 992 697 636 045 565 672Properties held-for-trading 13 1 080 21 349 1 080 21 349 Trade and other receivables 14 617 964 580 021 482 560 498 776 Loans receivable 8 587 440 2 050 2 050 2 050
Listed security income receivable 86 368 38 671 97 692 –Cash and cash equivalents 15 129 924 350 606 52 663 43 497 Non-current assets held-for-sale 16 1 289 612 1 490 128 1 196 975 501 060Total assets 70 177 798 57 490 164 67 536 492 44 419 529
EQUITY AND LIABILITIESShareholders’ interest 45 145 459 32 720 342 45 172 509 28 970 671 Stated capital 17 33 738 010 22 558 039 36 806 435 22 572 383 Reserves 11 407 449 10 162 303 8 366 074 6 398 288 Non-controlling interests 19 – 3 015 595 – –Total shareholders interest 45 145 459 35 735 937 45 172 509 28 970 671Other non-current liabilities 21 894 566 14 997 245 19 008 118 10 489 888Interest-bearing liabilities 21 21 602 140 14 355 324 18 853 557 10 238 603 Interest rate swaps 22 – 95 192 – 98 771 Other financial liabilities 23 17 507 36 731 17 507 36 731 Deferred taxation 24 274 919 509 998 137 054 115 783 Current liabilities 3 137 773 6 756 982 3 355 865 4 958 970 Trade and other payables 25 1 106 230 1 294 307 1 345 130 727 311 Interest-bearing liabilities 21 1 980 226 5 401 205 1 980 226 4 201 666 Interest rate swaps 22 10 488 926 12 072 926 Other financial liabilities 23 18 437 12 872 18 437 12 872 Taxation payable 22 392 47 672 – 16 195
Total equity and liabilities 70 177 798 57 490 164 67 536 492 44 419 529
Number of shares in issue* 4 448 623 3 404 630 4 754 500 3 410 507 Net asset value per share (excluding deferred tax and NCI) (cents) 1 021.00 976.03 952.98 852.85 Net tangible asset value per share (excluding deferred tax and NCI) (cents) 900.35 819.52 928.40 844.77 * Net of 305 876 766 (2014: 5 876 766) treasury shares
Redefine Group Annual Financial Statements 2015 21
SECT
ION
1
20
Statedcapital
Non-distributable
reserveAccumulated
profit/(loss)
Non-controlling
interests Total
GROUP
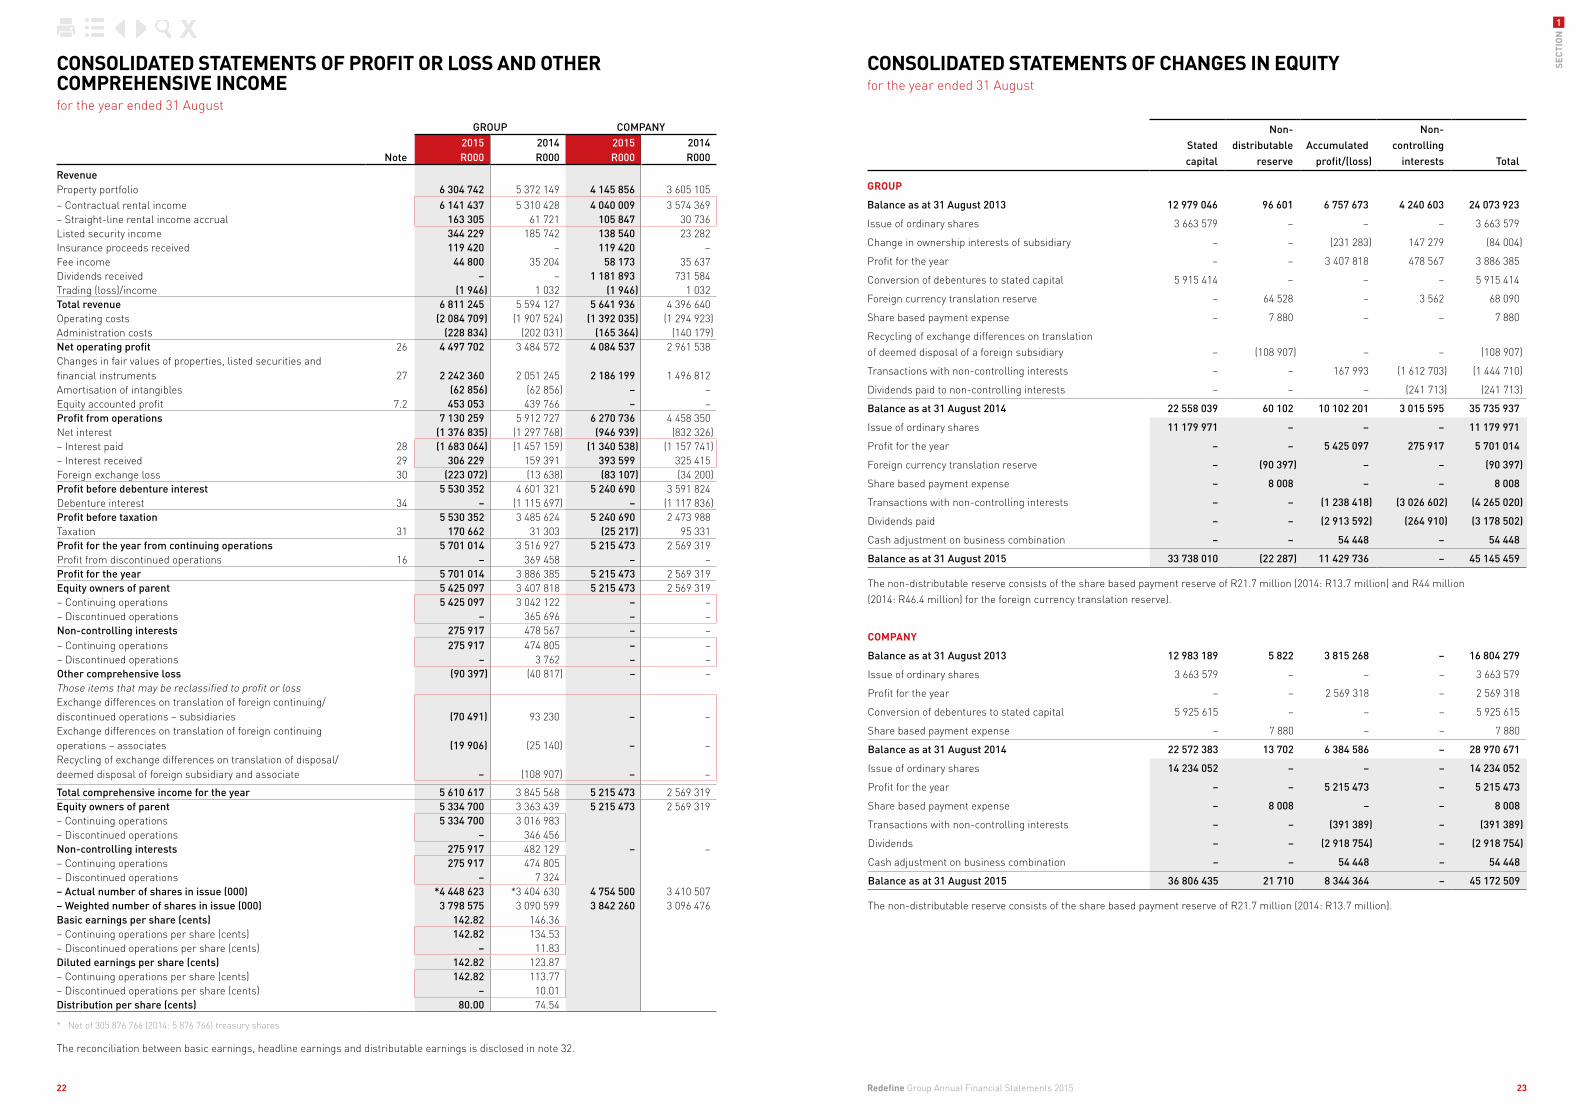
Balance as at 31 August 2013 12 979 046 96 601 6 757 673 4 240 603 24 073 923
Issue of ordinary shares 3 663 579 – – – 3 663 579
Change in ownership interests of subsidiary – – (231 283) 147 279 (84 004)
Profit for the year – – 3 407 818 478 567 3 886 385
Conversion of debentures to stated capital 5 915 414 – – – 5 915 414
Foreign currency translation reserve – 64 528 – 3 562 68 090
Share based payment expense – 7 880 – – 7 880
Recycling of exchange differences on translationof deemed disposal of a foreign subsidiary – (108 907) – – (108 907)
Transactions with non-controlling interests – – 167 993 (1 612 703) (1 444 710)
Dividends paid to non-controlling interests – – – (241 713) (241 713)
Balance as at 31 August 2014 22 558 039 60 102 10 102 201 3 015 595 35 735 937
Issue of ordinary shares 11 179 971 – – – 11 179 971
Profit for the year – – 5 425 097 275 917 5 701 014
Foreign currency translation reserve – (90 397) – – (90 397)
Share based payment expense – 8 008 – – 8 008
Transactions with non-controlling interests – – (1 238 418) (3 026 602) (4 265 020)
Dividends paid – – (2 913 592) (264 910) (3 178 502)
Cash adjustment on business combination – – 54 448 – 54 448
Balance as at 31 August 2015 33 738 010 (22 287) 11 429 736 – 45 145 459
The non-distributable reserve consists of the share based payment reserve of R21.7 million (2014: R13.7 million) and R44 million (2014: R46.4 million) for the foreign currency translation reserve).
COMPANY
Balance as at 31 August 2013 12 983 189 5 822 3 815 268 – 16 804 279
Issue of ordinary shares 3 663 579 – – – 3 663 579
Profit for the year – – 2 569 318 – 2 569 318
Conversion of debentures to stated capital 5 925 615 – – – 5 925 615
Share based payment expense – 7 880 – – 7 880
Balance as at 31 August 2014 22 572 383 13 702 6 384 586 – 28 970 671
Issue of ordinary shares 14 234 052 – – – 14 234 052
Profit for the year – – 5 215 473 – 5 215 473
Share based payment expense – 8 008 – – 8 008
Transactions with non-controlling interests – – (391 389) – (391 389)
Dividends – – (2 918 754) – (2 918 754)
Cash adjustment on business combination – – 54 448 – 54 448
Balance as at 31 August 2015 36 806 435 21 710 8 344 364 – 45 172 509
The non-distributable reserve consists of the share based payment reserve of R21.7 million (2014: R13.7 million).
CONSOLIDATED STATEMENTS OF PROFIT OR LOSS AND OTHER COMPREHENSIVE INCOMEfor the year ended 31 August
CONSOLIDATED STATEMENTS OF CHANGES IN EQUITYfor the year ended 31 August
GROUP COMPANY
Note2015R000
2014R000
2015R000
2014R000
RevenueProperty portfolio 6 304 742 5 372 149 4 145 856 3 605 105 – Contractual rental income 6 141 437 5 310 428 4 040 009 3 574 369 – Straight-line rental income accrual 163 305 61 721 105 847 30 736 Listed security income 344 229 185 742 138 540 23 282 Insurance proceeds received 119 420 – 119 420 –Fee income 44 800 35 204 58 173 35 637 Dividends received – – 1 181 893 731 584 Trading (loss)/income (1 946) 1 032 (1 946) 1 032 Total revenue 6 811 245 5 594 127 5 641 936 4 396 640 Operating costs (2 084 709) (1 907 524) (1 392 035) (1 294 923)Administration costs (228 834) (202 031) (165 364) (140 179)Net operating profit 26 4 497 702 3 484 572 4 084 537 2 961 538 Changes in fair values of properties, listed securities and financial instruments 27 2 242 360 2 051 245 2 186 199 1 496 812 Amortisation of intangibles (62 856) (62 856) – –Equity accounted profit 7.2 453 053 439 766 – –Profit from operations 7 130 259 5 912 727 6 270 736 4 458 350 Net interest (1 376 835) (1 297 768) (946 939) (832 326)– Interest paid 28 (1 683 064) (1 457 159) (1 340 538) (1 157 741)– Interest received 29 306 229 159 391 393 599 325 415 Foreign exchange loss 30 (223 072) (13 638) (83 107) (34 200)Profit before debenture interest 5 530 352 4 601 321 5 240 690 3 591 824 Debenture interest 34 – (1 115 697) – (1 117 836)Profit before taxation 5 530 352 3 485 624 5 240 690 2 473 988 Taxation 31 170 662 31 303 (25 217) 95 331 Profit for the year from continuing operations 5 701 014 3 516 927 5 215 473 2 569 319 Profit from discontinued operations 16 – 369 458 – –Profit for the year 5 701 014 3 886 385 5 215 473 2 569 319Equity owners of parent 5 425 097 3 407 818 5 215 473 2 569 319– Continuing operations 5 425 097 3 042 122 – –– Discontinued operations – 365 696 – –Non-controlling interests 275 917 478 567 – –– Continuing operations 275 917 474 805 – –– Discontinued operations – 3 762 – –Other comprehensive loss (90 397) (40 817) – –Those items that may be reclassified to profit or lossExchange differences on translation of foreign continuing/discontinued operations – subsidiaries (70 491) 93 230 – –Exchange differences on translation of foreign continuing operations – associates (19 906) (25 140) – –Recycling of exchange differences on translation of disposal/deemed disposal of foreign subsidiary and associate – (108 907) – –
Total comprehensive income for the year 5 610 617 3 845 568 5 215 473 2 569 319Equity owners of parent 5 334 700 3 363 439 5 215 473 2 569 319– Continuing operations 5 334 700 3 016 983 – Discontinued operations – 346 456 Non-controlling interests 275 917 482 129 – –– Continuing operations 275 917 474 805 – Discontinued operations – 7 324 – Actual number of shares in issue (000) *4 448 623 *3 404 630 4 754 500 3 410 507 – Weighted number of shares in issue (000) 3 798 575 3 090 599 3 842 260 3 096 476 Basic earnings per share (cents) 142.82 146.36 – Continuing operations per share (cents) 142.82 134.53 – Discontinued operations per share (cents) – 11.83 Diluted earnings per share (cents) 142.82 123.87 – Continuing operations per share (cents) 142.82 113.77 – Discontinued operations per share (cents) – 10.01 Distribution per share (cents) 80.00 74.54
* Net of 305 876 766 (2014: 5 876 766) treasury shares
The reconciliation between basic earnings, headline earnings and distributable earnings is disclosed in note 32.
Redefine Group Annual Financial Statements 2015 23
SECT
ION
1
22
GROUP COMPANY
Note2015R000
2014R000
2015R000
2014R000
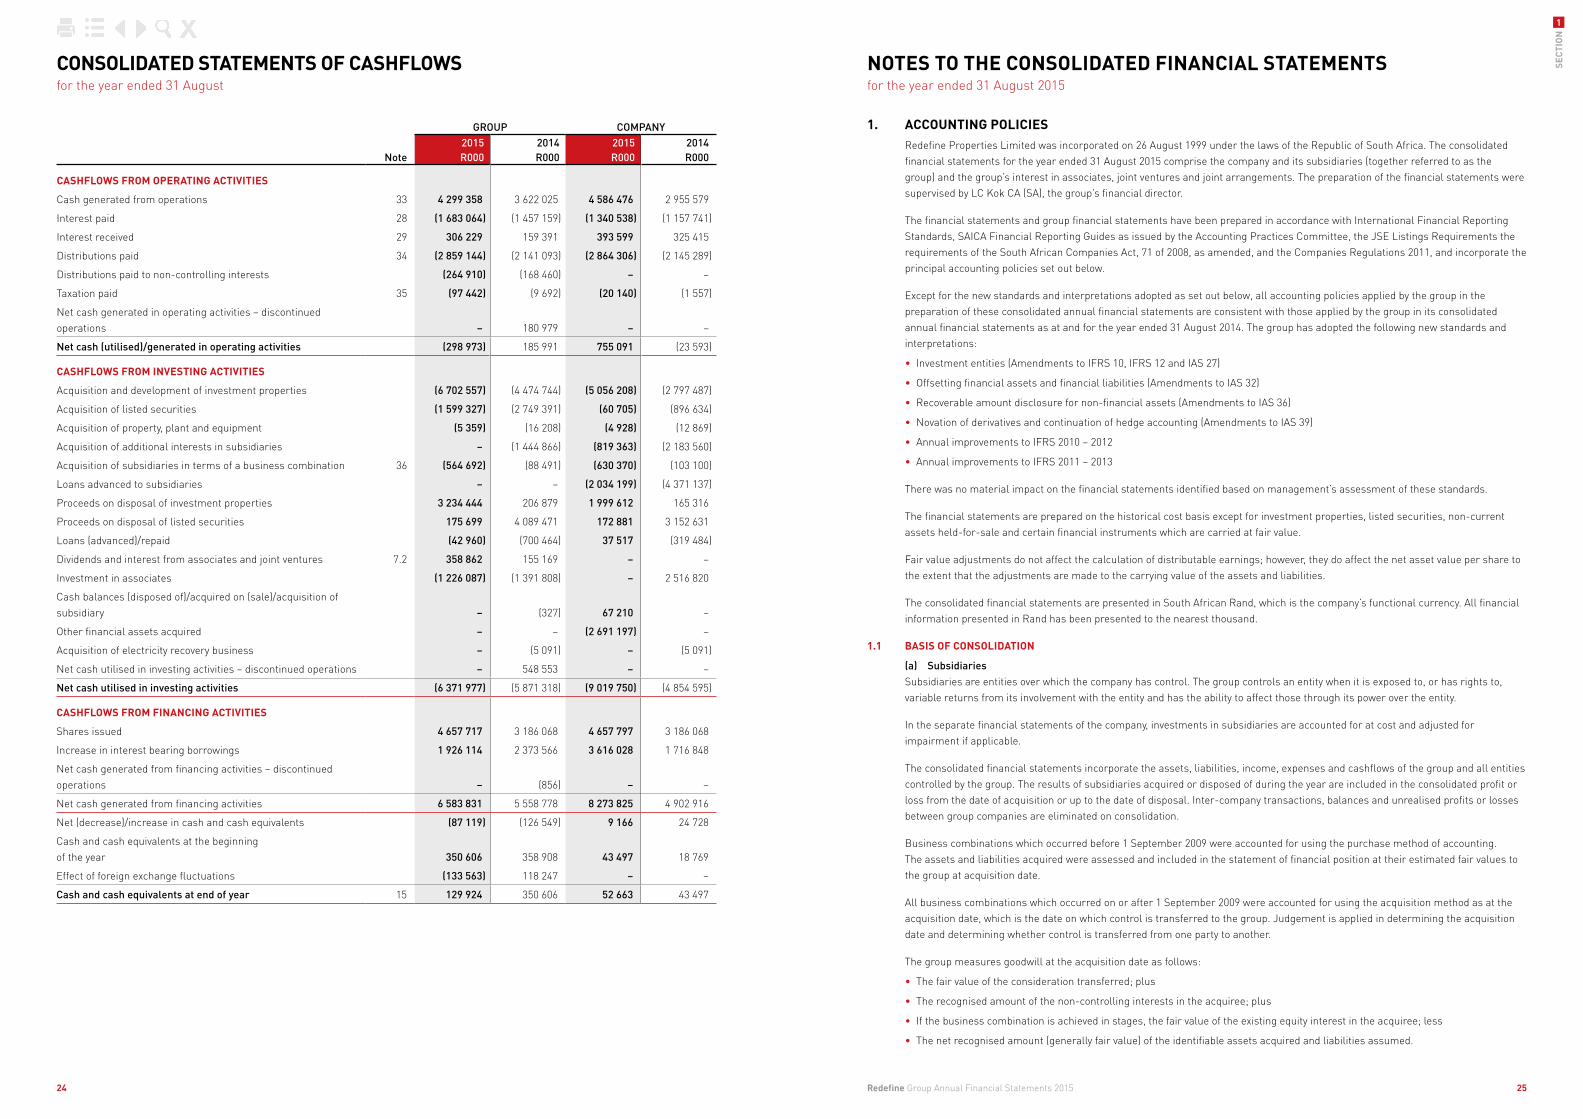
CASHFLOWS FROM OPERATING ACTIVITIES
Cash generated from operations 33 4 299 358 3 622 025 4 586 476 2 955 579
Interest paid 28 (1 683 064) (1 457 159) (1 340 538) (1 157 741)
Interest received 29 306 229 159 391 393 599 325 415
Distributions paid 34 (2 859 144) (2 141 093) (2 864 306) (2 145 289)
Distributions paid to non-controlling interests (264 910) (168 460) – –
Taxation paid 35 (97 442) (9 692) (20 140) (1 557)
Net cash generated in operating activities – discontinued operations – 180 979 – –
Net cash (utilised)/generated in operating activities (298 973) 185 991 755 091 (23 593)
CASHFLOWS FROM INVESTING ACTIVITIES
Acquisition and development of investment properties (6 702 557) (4 474 744) (5 056 208) (2 797 487)
Acquisition of listed securities (1 599 327) (2 749 391) (60 705) (896 634)
Acquisition of property, plant and equipment (5 359) (16 208) (4 928) (12 869)
Acquisition of additional interests in subsidiaries – (1 444 866) (819 363) (2 183 560)
Acquisition of subsidiaries in terms of a business combination 36 (564 692) (88 491) (630 370) (103 100)
Loans advanced to subsidiaries – – (2 034 199) (4 371 137)
Proceeds on disposal of investment properties 3 234 444 206 879 1 999 612 165 316
Proceeds on disposal of listed securities 175 699 4 089 471 172 881 3 152 631
Loans (advanced)/repaid (42 960) (700 464) 37 517 (319 484)
Dividends and interest from associates and joint ventures 7.2 358 862 155 169 – –
Investment in associates (1 226 087) (1 391 808) – 2 516 820
Cash balances (disposed of)/acquired on (sale)/acquisition of subsidiary – (327) 67 210 –
Other financial assets acquired – – (2 691 197) –
Acquisition of electricity recovery business – (5 091) – (5 091)
Net cash utilised in investing activities – discontinued operations – 548 553 – –
Net cash utilised in investing activities (6 371 977) (5 871 318) (9 019 750) (4 854 595)
CASHFLOWS FROM FINANCING ACTIVITIES
Shares issued 4 657 717 3 186 068 4 657 797 3 186 068
Increase in interest bearing borrowings 1 926 114 2 373 566 3 616 028 1 716 848
Net cash generated from financing activities – discontinued operations – (856) – –
Net cash generated from financing activities 6 583 831 5 558 778 8 273 825 4 902 916
Net (decrease)/increase in cash and cash equivalents (87 119) (126 549) 9 166 24 728
Cash and cash equivalents at the beginningof the year 350 606 358 908 43 497 18 769
Effect of foreign exchange fluctuations (133 563) 118 247 – –
Cash and cash equivalents at end of year 15 129 924 350 606 52 663 43 497
1. ACCOUNTING POLICIESRedefine Properties Limited was incorporated on 26 August 1999 under the laws of the Republic of South Africa. The consolidated financial statements for the year ended 31 August 2015 comprise the company and its subsidiaries (together referred to as the group) and the group’s interest in associates, joint ventures and joint arrangements. The preparation of the financial statements were supervised by LC Kok CA (SA), the group’s financial director.
The financial statements and group financial statements have been prepared in accordance with International Financial Reporting Standards, SAICA Financial Reporting Guides as issued by the Accounting Practices Committee, the JSE Listings Requirements the requirements of the South African Companies Act, 71 of 2008, as amended, and the Companies Regulations 2011, and incorporate the principal accounting policies set out below.
Except for the new standards and interpretations adopted as set out below, all accounting policies applied by the group in the preparation of these consolidated annual financial statements are consistent with those applied by the group in its consolidated annual financial statements as at and for the year ended 31 August 2014. The group has adopted the following new standards and interpretations:
• Investment entities (Amendments to IFRS 10, IFRS 12 and IAS 27)
• Offsetting financial assets and financial liabilities (Amendments to IAS 32)
• Recoverable amount disclosure for non-financial assets (Amendments to IAS 36)
• Novation of derivatives and continuation of hedge accounting (Amendments to IAS 39)
• Annual improvements to IFRS 2010 – 2012
• Annual improvements to IFRS 2011 – 2013
There was no material impact on the financial statements identified based on management’s assessment of these standards.
The financial statements are prepared on the historical cost basis except for investment properties, listed securities, non-current assets held-for-sale and certain financial instruments which are carried at fair value.
Fair value adjustments do not affect the calculation of distributable earnings; however, they do affect the net asset value per share to the extent that the adjustments are made to the carrying value of the assets and liabilities.
The consolidated financial statements are presented in South African Rand, which is the company’s functional currency. All financial information presented in Rand has been presented to the nearest thousand.
1.1 BASIS OF CONSOLIDATION
(a) SubsidiariesSubsidiaries are entities over which the company has control. The group controls an entity when it is exposed to, or has rights to, variable returns from its involvement with the entity and has the ability to affect those through its power over the entity.
In the separate financial statements of the company, investments in subsidiaries are accounted for at cost and adjusted for impairment if applicable.
The consolidated financial statements incorporate the assets, liabilities, income, expenses and cashflows of the group and all entities controlled by the group. The results of subsidiaries acquired or disposed of during the year are included in the consolidated profit or loss from the date of acquisition or up to the date of disposal. Inter-company transactions, balances and unrealised profits or losses between group companies are eliminated on consolidation.
Business combinations which occurred before 1 September 2009 were accounted for using the purchase method of accounting. The assets and liabilities acquired were assessed and included in the statement of financial position at their estimated fair values to the group at acquisition date.
All business combinations which occurred on or after 1 September 2009 were accounted for using the acquisition method as at the acquisition date, which is the date on which control is transferred to the group. Judgement is applied in determining the acquisition date and determining whether control is transferred from one party to another.
The group measures goodwill at the acquisition date as follows:
• The fair value of the consideration transferred; plus
• The recognised amount of the non-controlling interests in the acquiree; plus
• If the business combination is achieved in stages, the fair value of the existing equity interest in the acquiree; less
• The net recognised amount (generally fair value) of the identifiable assets acquired and liabilities assumed.
NOTES TO THE CONSOLIDATED FINANCIAL STATEMENTSfor the year ended 31 August 2015
CONSOLIDATED STATEMENTS OF CASHFLOWSfor the year ended 31 August
Redefine Group Annual Financial Statements 2015 25
SECT
ION
1
24
Unrealised gains arising from transactions with associates and joint ventures are eliminated to the extent of the group’s interest in these enterprises. Unrealised losses are eliminated in the same way except that they are only eliminated to the extent that there is no evidence of impairment.
(c) Jointly controlled operationsA jointly controlled operation is a joint arrangement whereby the parties that have joint control of the arrangement have rights to the assets and obligations to the liabilities, relating to the arrangement.
In respect of its interest in jointly controlled operations, the group recognises in its financial statements on a line by line basis from the date joint control commences until the date that joint control ceases:
• Its share of the jointly controlled assets, classified according to the nature of the assets
• Any liabilities that it has incurred
• Its share of any liabilities incurred jointly with the other ventures in relation to the jointly controlled asset
• Any income from the sale or use of its share of the output of the jointly controlled asset, together with its share of any expenses incurred by the jointly controlled asset
• Any expenses that it has incurred in respect of its interest in the jointly controlled asset
1.2 FINANCIAL INSTRUMENTS
Financial instruments are contracts that give rise to a financial asset of one entity and a financial liability or equity instrument of another entity.
Financial instruments are recognised in the statement of financial position when the group becomes party to the contractual provisions of the instrument. Any gains or losses on these instruments do not affect distributable earnings.
The group derecognises a financial asset when the contractual rights to the cashflows from the assets expire, or it transfers the rights to receive the contractual cashflows on the financial asset in a transaction in which substantially all the risks and rewards of ownership of the financial asset are transferred. Any interest in transferred financial assets that is created or retained by the group is recognised as a separate asset or liability. Regular way purchases and sales of financial assets are accounted for at trade date, i.e. the date that the group commits itself to purchase or sell the asset.
The group derecognises a financial liability when the group’s obligations specified in the contract expire or are discharged or cancelled.
Financial assets and liabilities are initially measured at fair value including transaction costs (other than financial instruments classified as fair value through profit or loss where the transaction costs incurred are immediately expensed in profit or loss). Subsequent to initial recognition, these instruments are measured as follows:
Financial assets• Listed securities are measured at fair value through profit or loss, less the accrual for distributions receivable which is included
in current assets
• Listed security income receivables are measured at amortised cost using the effective interest rate method less accumulated impairments
• Loans receivable are measured at amortised cost using the effective interest rate method less any accumulated impairments
• Other financial assets are measured at fair value through profit or loss
• Trade and other receivables are stated at amortised cost using the effective interest rate method less any accumulated impairments
• Cash and cash equivalents are measured at amortised cost using the effective interest rate method
• Guarantee fees receivable are measured at amortised cost using the effective interest rate method less any accumulated impairments
• Interest rate swaps are held-for-trading financial instruments measured at fair value through profit or loss
Financial liabilities• Debenture capital was considered as a financial liability and was recognised at amortised cost using the effective interest rate
method (see linked units below)
• Interest-bearing borrowings are recognised at amortised cost using the effective interest rate method
• Interest rate swaps are held-for-trading financial instruments measured at fair value through profit or loss
• Financial guarantee contracts are measured at the higher of fair value or the amount initially recognised less accumulated amounts recorded as income to date
1. ACCOUNTING POLICIES continued
1.1 BASIS OF CONSOLIDATION continued
(a) Subsidiaries continuedWhere the excess is negative this is immediately recognised in profit or loss as a gain on a bargain purchase.
A “business” is defined as an integrated set of activities and assets that is capable of being conducted and managed for the purpose of providing a return in the form of dividends, lower costs or other economic benefits directly to investors or other owners, members or participants.
A “business combination” is defined as a transaction or other event in which an acquirer obtains control of one or more businesses.
If a business combination results in the termination of pre-existing relationships between the group and the acquiree, then the lower of the termination amount, as contained in the agreement, and the value of the off-market element is deducted from the consideration transferred and recognised in profit or loss.
Costs related to the acquisition, other than those associated with the issue of debt or equity securities, that the group incurs in connection with a business combination are expensed as incurred.
Costs associated with the issue of debt or equity securities are recorded directly in the statement of changes in equity.
Any contingent consideration payable is recognised at fair value at the acquisition date. If the contingent consideration is classified as equity, it is not remeasured and settlement is accounted for within equity. Otherwise subsequent changes to the fair value of the contingent consideration are recognised in profit or loss.
Transactions with non-controlling interest holdersTransactions with non-controlling interest holders are treated as transactions with equity holders of the group. Disposals to non-controlling interest holders that do not result in the loss of control, result in gains and losses for the group that are recorded directly in the statement of changes in equity. The difference between any consideration paid and the relevant share of the net asset value acquired from non-controlling interests is recorded directly in the statement of changes in equity.
Common control transactionsAcquisitions of businesses which do not result in a change of control of the business are accounted for as common control transactions. The excess of the cost of the acquisition over the group’s interest in the carrying value of the identifiable assets and liabilities of the acquired business is recognised in equity.
(b) Associates and joint venturesAssociates are companies over which the group has significant influence but not control.
Joint ventures are arrangements in which the group has joint control, whereby the group has rights to the net assets of the arrangement, rather than rights to its assets and obligations for its liabilities.
In the separate financial statements of the company, investments in associates and joint ventures are accounted for at cost and adjusted for impairment if applicable.
In the consolidated financial statements associates and joint ventures are accounted for using the equity method of accounting and are initially recognised at cost. The group’s share of post-acquisition profits or losses is recognised in profit or loss and its share of post-acquisition movements in reserves is recognised in reserves. The cumulative post- acquisition movements are adjusted against the carrying amount of the investment.
Where the group acquires an additional shareholding or where it obtains significant influence such that an investment which was previously accounted for as an investment under IAS 39 is now deemed to be an associate undertaking, the group’s previously held interest is remeasured to fair value through profit or loss for the period. The cost of the associate is determined as the fair value of the original investment plus the fair value of any additional consideration given to achieve significant influence.
Goodwill arising on acquisition is included in the carrying amount of the investment and is treated in accordance with the group’s accounting policy for goodwill.
Dividends from associates and joint ventures are deducted from the carrying value of the investment. Where the group’s share of losses of associates and joint ventures exceeds the carrying amount of the group’s net investment in the associate and joint venture the investment is carried at nil.
Additional losses are only recognised to the extent that the group has incurred obligations or made payments on behalf of the associate or joint venture.
NOTES TO THE CONSOLIDATED FINANCIAL STATEMENTS continued
for the year ended 31 August 2015
Redefine Group Annual Financial Statements 2015 27
SECT
ION
1
26
NOTES TO THE CONSOLIDATED FINANCIAL STATEMENTS continued
for the year ended 31 August 2015
1.5 GOODWILL
Goodwill arises on the acquisition of a business and represents the excess of the cost of the acquisition over the group’s interest in the net fair value of the identifiable assets, liabilities and contingent liabilities acquired. Negative goodwill is recognised immediately in profit or loss.
Subsequent to initial recognition, goodwill is measured at cost less accumulated impairment losses.
1.6 INTANGIBLE ASSETS
Intangible assets with an indefinite useful life are stated at cost less accumulated impairment losses. These intangible assets are tested for impairment annually by comparing the recoverable amount with its carrying amount. Useful life is reviewed at each year-end to determine whether events and circumstances continue to support an indefinite useful life assessment. If they do not, the change in useful life assessment from indefinite to finite is accounted for as a change in estimate.
Intangible assets with finite useful lives are measured at cost less accumulated amortisation and accumulated impairment losses. Amortisation is recognised in profit or loss on a straight-line basis over the estimated useful lives of the assets. Assets are amortised to their residual values. The amortisation methods, residual values as well as useful lives are reviewed at each period-end and adjusted if necessary.
The estimated useful lives of the right to manage property assets are 15 years.
1.7 PROPERTY, PLANT AND EQUIPMENT
Land and buildings are shown at fair value based on periodic valuations less subsequent depreciation. Any gain or loss arising from a change in fair value is accounted for directly in other comprehensive income.
All other plant and equipment are recorded at cost less depreciation and impairment.
Property, plant and equipment are depreciated on a straight-line basis over the current useful lives of the assets. The estimated useful lives of the assets are:
• Computer hardware five to six years
• Computer software three years
• Furniture and fittings and office equipment three years
• Motor vehicles five years
• Buildings 50 years
• Land is not depreciated as it is deemed to have an indefinite life
The useful lives, depreciation methods and residual values are assessed at each financial period-end and adjusted accordingly.
Subsequent expenditure is capitalised when it is probable that future economic benefits will flow to the group and its cost can be reliably measured. All other expenditure is recognised as an expense in the period in which it is incurred.
Gains and losses on the disposal of property, plant and equipment are recognised in profit or loss and are calculated as the difference between the sales price and the carrying value of the item of property, plant and equipment sold.
1.8 IMPAIRMENT OF NON-FINANCIAL ASSETS
The carrying value of assets is reviewed for impairment at each reporting date. Assets are impaired when events or changes in circumstances indicate that the carrying values may not be recoverable.
If such indication exists and where the carrying values exceed the estimated recoverable amounts, the assets are written down to their recoverable amounts.
Recoverable amount is determined as the higher of fair value less costs to sell or value in use. Where it is not possible to estimate the recoverable amount of an individual asset, the recoverable amount is determined for the cash-generating unit to which the asset belongs.
In assessing the value in use, the estimated cashflows are discounted to their present value using a discount rate that reflects current market assessments of the time value of money and the risks specific to the asset. For the purpose of impairment testing, goodwill is allocated to the cash-generating unit expected to benefit from the synergies of the business combination.
1. ACCOUNTING POLICIES continued
1.2 FINANCIAL INSTRUMENTS continued
Financial liabilities continued• Trade and other payables are stated at amortised cost using the effective interest rate method
• Linked unit holders for distribution were measured at amortised cost using the effective interest rate method
For all financial instruments carried at amortised cost using the effective interest rate method, where the effects of discounting are not considered to be material, these instruments are not discounted as their carrying values approximate their amortised cost values.
Financial assets and financial liabilities are offset and the net amount reported in the statement of financial position when the group has a legally enforceable right to set off the recognised amounts, and intends either to settle on a net basis, or to realise the asset and settle the liability simultaneously.
The group assesses all receivables held at amortised cost for impairment at each financial year-end. An impairment loss is calculated as the difference between the asset’s carrying value and the present value of the estimated future cash inflows discounted at the asset’s original effective interest rate. Impairment losses are recognised in profit or loss and reflected in an allowance account against receivables. When a subsequent event causes the amount of the impairment loss to decrease, the decrease in impairment loss is reversed through profit or loss.
Linked unitsPrior to the conversion to an all equity structure, each and every ordinary share issued was irrevocably linked to a debenture. The debentures were redeemable at the option of the holder and accrued interest half-yearly. As a result of this contractual obligation to deliver cash the group classified the debentures issued as a liability, and the interest that accrued as an interest expense through profit or loss. The debentures issued were initially recognised at fair value. As mentioned above, debenture capital was subsequently carried at amortised cost using the effective interest rate method.
1.3 INVESTMENT PROPERTIES
Investment properties, both freehold and leasehold, are properties held for the purpose of earning rental income and for capital appreciation. Investment properties are initially recorded at cost and include transaction costs arising on acquisition. Subsequent expenditure to add to or to replace a part of the property is capitalised at cost. The carrying amount of any replaced part is written off to profit or loss when replaced.
Leasehold properties that are leased out to tenants under operating leases are classified as investment properties as appropriate, and included in the statement of financial position at fair value. Land interests held under an operating lease are classified and accounted for as investment property on a property-by-property basis when they are held to earn rentals or for capital appreciation on both the land and the property. Any such property interest under an operating lease classified as investment property is carried at fair value.
Tenant installations and lease commissions are carried at cost less accumulated amortisation. Amortisation is provided to write down the cost, less residual value, by equal installments over the period of the lease.
Investment properties are valued annually and adjusted to fair value at the reporting date.
The portfolio is valued annually. For the purposes of the independent valuation at 31 August 2015, all properties above R20 million were valued. Independent valuations were also obtained for a portion of the properties under R20 million.
Properties under R20 million are valued externally on a three-year rotational basis.
Any gain or loss arising from a change in the fair value of the investment property is included in profit or loss for the period to which it relates. Changes in fair value are excluded from the calculation of distributable earnings.
Gains and losses on the disposal of investment properties are recognised in profit or loss, and are calculated as the difference between the sale price and the carrying value of the property.
1.4 PROPERTIES UNDER DEVELOPMENT
Properties under development comprise the cost of the land and development, and are stated at fair value. If the fair value cannot be reasonably determined it is stated at cost and is not depreciated. Investment property that requires development is transferred from investment properties to properties under development when development commences. On completion of the development these properties become part of investment property.
Redefine Group Annual Financial Statements 2015 29
SECT
ION
1
28

NOTES TO THE CONSOLIDATED FINANCIAL STATEMENTS continued
for the year ended 31 August 2015
1.14 PROVISIONS
Provisions are recognised when there is a present obligation, whether legal or constructive, as a result of a past event for which it is probable that a transfer of economic benefits will be required to settle the obligation and a reliable estimate can be made of the amount of the obligation. Such provisions are calculated on a discounted basis where the effect is material to the original undiscounted provision. The rate applied is a market-related rate adjusted for the risks associated with the obligation. The carrying amount of the provision increases in each period to reflect the passage of time and the unwinding of the discount and the movement is recognised in profit or loss within interest costs. Provisions are not recognised for future operating losses; however, provisions are recognised for onerous contracts where a contract is expected to be loss-making (and not merely less profitable than expected).
1.15 REVENUE RECOGNITION
1.15.1 Property portfolio revenueProperty portfolio revenue comprises gross rental income and fixed operating cost recoveries from the letting of investment properties. Rental income is recognised in profit and loss on a straight-line basis over the term of the lease.
Recoveries of costs from lessees, where the entity merely acts as an agent and makes payment of these costs on behalf of lessees, are offset against the relevant costs.
Contingent rents (turnover rentals) are included in revenue when the amounts can be reliably measured. Premiums to terminate leases are recognised in profit or loss as they arise.
1.15.2 Listed security incomeDividends from listed securities are recognised in profit and loss when declared. Realised profits and losses on the sale of listed securities are included in profit and loss.
1.15.3 Trading incomeTrading income represents income from development units sold and is recognised once:
• The risks and rewards of ownership have transferred
• The group no longer has managerial involvement
• The amount of revenue and costs can be measured reliably
• It is probable that the economic benefits from the sale will flow
1.15.4 Interest receivedInterest earned on cash invested with financial institutions is recognised on an accrual basis using the effective interest rate method. Where the group previously issued linked units at a market price that included accrued interest, the accrued interest portion of the price was included in interest received as an antecedent divestiture of distribution. As confirmed by the guidance letter: Application of IFRS for antecedent interest on linked units, issued by the JSE on 9 October 2014, antecedent interest was no longer recognised as interest received but capitalised to the issue cost of previously issued linked units.
1.15.5 Fee incomeFee income is recognised on an accrual basis in accordance with the substance of the relevant agreements and measured at fair value of the consideration receivable.
1.16 EMPLOYEE BENEFITS
1.16.1 Short-term benefitsThe cost of the short-term employee benefits is recognised during the period in which the employees render the related service. Short-term employee benefits are measured on an undiscounted basis. The accrual for employee entitlements to salaries, bonuses and annual leave represents the amount which the group has a present legal or constructive obligation to pay as a result of the employees’ services provided up to the reporting date.
1.16.2 Defined contribution plansA defined contribution plan is a post-employment benefit plan under which the group pays fixed contributions to a separate entity and will have no legal or constructive obligation to pay further amounts if the fund does not hold sufficient assets to pay all employees the benefits relating to employee service in the current and prior periods. The contributions are recognised as an employee benefit expense when they are due. Prepaid contributions are recognised as an asset to the extent that a cash refund or a reduction in the future payments is available.
1. ACCOUNTING POLICIES continued
1.8 IMPAIRMENT OF NON-FINANCIAL ASSETS continued
Impairment losses and the reversal of impairment losses are recognised in profit or loss other than those relating to revalued assets, in which case the impairment or reversal of impairment is accounted for as a revaluation decrease or increase respectively. In the case of a cash-generating unit, an impairment is first allocated to goodwill and then to the other assets in the cash-generating unit on a pro rata basis. Impairments to goodwill are not subsequently reversed. An impairment loss is only reversed if there is an indication that the impairment loss no longer exists and the recoverable amount increases as a result of a change in estimates used to determine the recoverable amount, but not to an amount higher than the carrying amount that would have been determined (net of depreciation or amortisation) had no impairment loss been recognised in prior years.
1.9 PROPERTIES HELD-FOR-TRADING
Properties held-for-trading comprise properties acquired as well as properties developed with the intention of disposing for a profit, and are recorded at the lower of cost and net realisable value.
Costs include all costs of purchase, transaction costs, costs of conversion and other costs incurred in bringing the properties to their present condition. Net realisable value is the estimated selling price in the ordinary course of business less the estimated costs of selling.
1.10 NON-CURRENT ASSETS HELD-FOR-SALE AND DISPOSAL GROUPS
A non-current asset or a disposal group comprising assets and liabilities is classified as held-for-sale if it is expected that its carrying amount will be recovered principally through sale rather than through continuing use, it is available for immediate sale and the sale is highly probable to occur within one year. For the sale to be highly probable, the appropriate level of management must be committed to a plan to sell the asset or disposal group.
Where the group is committed to a sale plan involving the loss of control of a subsidiary it classifies all the assets and liabilities of that subsidiary as held-for-sale when the criteria set out above and detailed in IFRS 5 non-current assets held-for-sale and discontinued operations are met, regardless of whether the group will retain a non-controlling interest in its former subsidiary after the sale.
On initial classification as held-for-sale, generally, non-current assets and disposal groups are measured at the lower of the carrying amount and fair value less costs to sell, with any adjustments taken to profit or loss (or other comprehensive income in the case of a revalued asset). The same applies to gains and losses on subsequent remeasurement. However, certain items, such as financial assets within the scope of IAS 39 and investment property within the scope of IAS 40, continue to be measured in accordance with those standards.
Impairment losses subsequent to classification of assets as held-for-sale are recognised in profit or loss. Increases in fair value less costs to sell assets that have been classified as held-for-sale are recognised in profit or loss to the extent that the increase is not in excess of any cumulative impairment loss previously recognised in respect of the asset. Assets classified as held-for-sale are not depreciated.
Gains and losses on remeasurement and impairment losses subsequent to classification as disposal groups and non-current assets held-for-sale are shown within continuing operations in profit or loss, unless they qualify as discontinued operations.
Disposal groups and non-current assets held-for-sale are presented separately from other assets and liabilities on the statement of financial position. Prior periods are not reclassified.
1.11 STATED CAPITAL
Ordinary shares are classified as equity. External costs directly attributable to the issue of new shares are shown as a deduction from equity.
1.12 TREASURY SHARES
Where a subsidiary company holds shares in the holding company, the consideration paid to acquire these shares is deducted from stated capital as treasury shares, but disclosed separately in the statement of changes in equity. When these shares are sold or reissued, any consideration received is included in stated capital.
1.13 DIVIDENDS
Dividends and other distributions to the holders of equity instruments, in their capacity as owners, are recognised directly in equity on the date of declaration.
Redefine Group Annual Financial Statements 2015 31
SECT
ION
1
30
NOTES TO THE CONSOLIDATED FINANCIAL STATEMENTS continued
for the year ended 31 August 2015
Deferred income tax is provided for all temporary differences arising between the tax bases of assets and liabilities and their carrying values for financial reporting purposes. In principle, deferred tax liabilities are recognised for all taxable temporary differences and deferred tax assets are recognised to the extent that it is probable that taxable profit will be available against which deductible temporary differences can be utilised. Such assets and liabilities are not recognised if the temporary difference arises:
• From the initial recognition of goodwill in a business combination
• From the initial recognition of other assets and liabilities in a transaction which is not a business combination and affects neither accounting profit nor taxable income
• Differences related to investments in subsidiaries and joint ventures to the extent that it is probable that they will not reverse in the foreseeable future
Deferred tax is calculated at the tax rates that are expected to apply to the period when the asset is realised or the liability settled.
Deferred tax adjustments are recognised in profit or loss.
Deferred tax assets and liabilities are offset if there is a legally enforceable right to offset current tax assets and liabilities and they relate to income tax levied by the same authority on the same taxable entity, or on different tax entities, but they intend to settle current tax assets and liabilities on a net basis or their tax assets and liabilities will be realised simultaneously.
1.20 OPERATING SEGMENTS
An operating segment is a component of the group that engages in business activities from which it may earn revenues and incur expenses, including revenues and expenses that relate to transactions with any of the group’s other components. An operating segment’s operating results are reviewed regularly by the group’s executive committee to make decisions about resources to be allocated to the segment and assess its performance, and for which discrete financial information is available.
1.21 LEASES
1.21.1 Group as a lesseeWhere the group leases property and has substantially all the risks and rewards of ownership, the leases are classified as finance leases. Finance leases are capitalised at the lease’s inception at the fair value of the leased property or, if lower, the present value of the minimum lease payments. Each lease payment is allocated between the liability and finance charges so as to achieve a constant rate on the finance balance outstanding. The corresponding rental obligations, net of finance charges, are included in interest-bearing liabilities. The interest element of the finance cost is charged to the profit or loss over the lease period so as to produce a constant periodic rate of interest on the remaining balance of the liability for each period. The properties acquired under finance leases are recognised at fair value in terms of IAS 40 and are not depreciated.
Leases where the lessor retains substantially all the risks and rewards of ownership are classified as operating leases. Payments made under operating leases (net of any incentives received from the lessor) are recognised in profit or loss on a straight-line basis over the period of the lease.
1.21.2 Group as a lessorProperties leased to third parties under operating leases are included in investment property in the statement of financial position. Rental income (net of any incentives given to lessees) is recognised on a straight-line basis over the lease term. This does not affect distributable earnings.
1.22 EARNINGS, HEADLINE EARNINGS AND DISTRIBUTABLE EARNINGS PER SHARE
Earnings per share is calculated on the weighted average number of shares in issue, net of treasury shares, in respect of the year and is based on profit attributable to shareholders. Headline earnings per share are calculated in terms of the requirements set out in Circular 2/2013 issued by SAICA.
1.23 KEY ESTIMATES AND ASSUMPTIONS
The preparation of financial statements in conformity with IFRS requires management to make judgements, estimates and assumptions that affect amounts reported in the financial statements. Actual results may differ from these estimates. Estimates and assumptions are reviewed on an ongoing basis. Revisions to accounting estimates are recognised in the period in which they were revised and in any future periods affected.
1. ACCOUNTING POLICIES continued
1.16 EMPLOYEE BENEFITS continued 1.16.3 Share appreciation scheme
The group operates a cash-settled share appreciation scheme which is recognised at fair value in the statement of financial position over the vesting period up to and including settlement date with a corresponding charge to profit or loss. The liability is remeasured at each reporting date, using the Black Scholes model to reflect the revised fair value adjusted for changes in assumptions. Changes in the fair value are recognised in profit or loss.
1.16.4 Share-based paymentsRestricted share schemeIn terms of the restricted share scheme, a conditional right to shares is awarded to employees subject to performance and vesting conditions. The scheme is accounted for as an equity-settled share-based payment. The fair value of services received in return for the restricted shares has been determined as follows: the number of shares expected to vest multiplied by the share price at the date of award less discounted future anticipated distributions.
Matching share schemeIn terms of the matching share scheme, participants are invited annually to utilise a predetermined percentage of their after tax bonus to acquire Redefine shares. Participants holding shares at the third anniversary of the date of award will be awarded Redefine shares free of consideration based on a multiple of the original shares linked to the group and individuals performance. The scheme is accounted for as an equity-settled share-based payment. The fair value of services received in return for the matching shares has been determined as follows: the number of shares expected to vest multiplied by the share price at the date of award less discounted future anticipated distributions.
The costs of the schemes are recognised over the vesting period and the cost is adjusted for changes in management’s estimate of the number of shares expected to vest. The cost is recognised in profit or loss and a corresponding adjustment in equity.
1.17 BORROWING COSTS
Borrowing costs that are directly attributable to the development or acquisition of qualifying assets are capitalised to the cost of that asset until such time as it is substantially ready for its intended use.
The capitalisation rate is arrived at by reference to the actual rate payable on borrowings for development purposes; or with regard to that part of the development cost financed out of general funds, to the average rate.
All other borrowing costs are expensed in the period in which they are incurred.
1.18 FOREIGN CURRENCY
1.18.1 Foreign currency transactionsTransactions in foreign currencies are translated at the foreign exchange rate ruling at the date of the transaction. Monetary assets and liabilities denominated in foreign currencies at the reporting date are translated to the functional currency at the foreign exchange rate ruling at that date. Foreign exchange differences arising on translation are recognised in the profit or loss. Non-monetary assets and liabilities denominated in foreign currencies that are stated at fair value are translated to the functional currency at the foreign exchange rates ruling on the dates that the values are determined.
1.18.2 Foreign operationsExchange differences arising from the translation of the net investment in foreign operations are taken to the foreign currency translation reserve. They are released into other comprehensive income upon disposal. On consolidation, the statement of financial position of foreign subsidiaries is translated at the closing rate and the statement of comprehensive income is translated at the average rate for the period. Differences arising are taken to the FCTR.
The movement in the FCTR during the reporting period is accounted for in other comprehensive income.
1.19 TAXATION
Income tax expense comprises current and deferred tax. Income tax expense is recognised in profit or loss except to the extent that it relates to items recognised directly in equity or in other comprehensive income, in which case it is recognised in equity or other comprehensive income respectively.
The charge for current tax is based on the results for the period as adjusted for items which are non-assessable or disallowed and any tax payable in respect of previous years. It is calculated using rates that have been enacted or substantially enacted by the reporting date.
Redefine Group Annual Financial Statements 2015 33
SECT
ION
1
32

NOTES TO THE CONSOLIDATED FINANCIAL STATEMENTS continued
for the year ended 31 August 2015
Business combination versus asset acquisition – the directors have assessed the properties acquired and have concluded that in their view these acquisitions are property acquisitions in terms of IAS 40 and are therefore accounted for in terms of that standard. In the opinion of the directors these properties do not constitute a business as defined in terms of IFRS 3, as there were not adequate processes identified within these properties to warrant classification as businesses.
1.24 STANDARDS AND INTERPRETATIONS APPLICABLE, NOT YET EFFECTIVE
There are new or revised Accounting Standards and Interpretations in issue that are not yet effective. These include the following Standards and Interpretations that are material to the business of the group and may have an impact on future financial statements, or those for which the impact has not as yet been assessed.
IFRS 9 financial Instruments IFRS 9 will be adopted by the group for the first time for its financial reporting period ending 31 August 2019. The standard will be applied retrospectively, subject to transitional provisions.
IFRS 9 addresses the following and will replace the relevant sections of IAS 39:
• The classification and measurement of financial assets
• The derecognition of financial assets and liabilities
• The classification and measurement of financial liabilities
Under IFRS 9 there are two options in respect of the classification of financial assets, namely, financial assets measured at amortised cost or at fair value. Financial assets are measured at amortised cost when the business model is to hold assets in order to collect contractual cashflows and when they give rise to cashflows that are solely payments of principal and interest on the principal outstanding. All other financial assets are measured at fair value.
Embedded derivatives are no longer separated from hybrid contracts that have a financial asset host.
IFRS 9 has retained in general the requirements of IAS 39 for financial liabilities, except for the following two aspects:
• Fair value changes for financial liabilities (other than financial guarantees and loan commitments) designated at fair value through profit or loss, that are attributable to the changes in the credit risk of the liability, will be presented in other comprehensive income. The remaining amount of the fair value change is recognised in profit or loss. However, if this requirement creates or enlarges an accounting mismatch in profit or loss, then the whole fair value change is presented in profit or loss. The determination as to whether such presentation would create or enlarge an accounting mismatch is made on initial recognition and is not subsequently reassessed
• Derivative liabilities that are linked to and must be settled by delivery of an unquoted equity instrument whose fair value cannot be reliably measured, are measured at fair value
IFRS 9 incorporates the guidance in IAS 39 dealing with fair value measurement and accounting for derivatives embedded in a host contract that is not a financial asset, as well as the requirements of IFRIC 9 Reassessment of Embedded Derivatives.
The impact on the financial statements for the group has not yet been determined as the standard is not yet finalised.
IFRS 15 revenue from contracts with customersIFRS 15 will be adopted by the group for the first time for its financial reporting period ending 31 August 2019. The amendment will be applied retrospectively.
This standard replaces IAS 11 construction contracts, IAS 18 revenue, IFRIC 13 customer loyalty programmes, IFRIC 15 agreements for the construction of real estate, IFRIC 18 transfer of assets from customers and SIC-31 revenue – barter of transactions involving advertising services.
The standard is effective for annual periods beginning on or after 1 January 2018, with early adoption permitted under IFRS. The standard contains a single model that applies to contracts with customers and two approaches to recognising revenue: at a point in time or over time. The model features a contract-based five-step analysis of transactions to determine whether, how much and when revenue is recognised.
The impact on the financial statements for the group has not yet been determined.
1. ACCOUNTING POLICIES continued
1.23 KEY ESTIMATES AND ASSUMPTIONS continuedInformation on key estimates and assumptions which have the most significant effect on the financial statements are set out in the following notes in the financial statements:
Fair value of financial instruments – All financial instruments, regardless of their IAS 39 categorisation, are initially recorded at fair value (adjusted for transaction costs for all those financial instruments other than those classified as at fair value through profit or loss). The fair value of a financial instrument on initial recognition is normally the transaction price, which is the fair value of the consideration paid or received. Subsequent to initial recognition, the fair values of financial instruments measured at fair value that are quoted in active markets are based on bid prices for the assets. When quoted prices are not available, fair values are determined by using valuation techniques that refer as far as possible to observable market data. These include comparison with similar instruments where market observable prices exist. The carrying values of all financial instruments approximate their fair values. In the case of short-term and trade receivables, the impact of discounting is not material and the carrying amount therefore approximates fair value. The judgement as to whether a market is active may include, for example, consideration of factors such as the magnitude and frequency of trading activity, the availability of prices and the size of bid/offer spreads. In inactive markets, obtaining assurance that the transaction price provides evidence of fair value or determining the adjustments to transaction prices that are necessary to measure the fair value of the asset or liability requires additional work during the valuation process. The majority of valuation techniques employ only observable market data, and so the reliability of the fair value measurement is high. However, certain financial assets and liabilities are valued on the basis of valuation techniques that feature one or more significant market inputs that are unobservable and, for them, the derivation of fair value is more judgemental. A financial asset or liability in its entirety is classified as valued using significant unobservable inputs if a significant proportion of that asset or liability’s carrying amount is driven by unobservable inputs. In this context, “unobservable” means that there is little or no current market data available for which to determine the price at which an arm’s length transaction is likely to occur. It generally does not mean that there is no market data available at all upon which to base a determination of fair value. Furthermore, in some cases the majority of the fair value derived from a valuation technique with significant unobservable inputs may be attributable to observable inputs. For more information refer to note 2 and 41.4.
Goodwill – determining whether goodwill is impaired requires an estimation of the value in use of the cash-generating units to which goodwill has been allocated. The value-in-use calculation requires the group to estimate the future cashflows expected to arise from the cash-generating unit at a suitable discount rate in order to calculate the present value. Refer to note 6 for further information.
Investment properties – the portfolio is valued annually. For the purposes of the independent valuation at 31 August 2015, all properties above R20 million were valued. Independent valuations were also obtained for a portion of the properties under R20 million. Properties under R20 million are valued externally on a three-year rotational basis. By obtaining external valuations from accredited valuators for the majority of the portfolio, management is of the opinion that the risk relating to estimation uncertainty has been mitigated. Refer to notes 1.3 and note 2 for further information.
Property, plant and equipment – the determination of the useful life and residual values of property, plant and equipment is subject to management estimation. The group regularly reviews all of its depreciation rates and residual values to take account of any changes in circumstances, and any changes that could affect prospective depreciation charges and asset carrying values. Refer to note 11 for more information.
Trade and other receivables – allowance for doubtful debts – the group assesses its doubtful debt allowance at each reporting date. Key assumptions applied are the estimated recovery rates and future market conditions that could affect recovery. For more detail on the allowance see note 41.1 on credit risk.
Deferred taxation – deferred tax assets are raised to the extent that it is probable that future taxable profit will be available against which the unused tax losses and unused tax credits can be utilised. Assessment of future taxable profit is performed at every reporting date, in the form of future cashflows using a suitable growth rate. Refer to note 24 for more detail on deferred taxation.
Taxation – the group is subject to income taxes in numerous jurisdictions. Significant judgement is required in determining the worldwide provision for income taxes. There are many transactions and calculations for which the ultimate tax determination is uncertain during the ordinary course of business. The group recognises liabilities for anticipated tax audit issues based on estimates of whether additional taxes will be due. Where the final tax outcome of these matters is different from the amounts that were initially recorded, such differences will impact the income tax and deferred tax provisions in the period in which the determination is made. Refer to note 31.
Business combinations – on the acquisition of a company or a business, a determination of the fair value and useful life of intangible assets acquired is performed, which requires the application of management judgement. Future events could cause the assumptions used by the group to change which would have a significant impact on the results and net position of the group. Refer to note 6 for more detail on intangible assets.
Redefine Group Annual Financial Statements 2015 35
SECT
ION
1
34
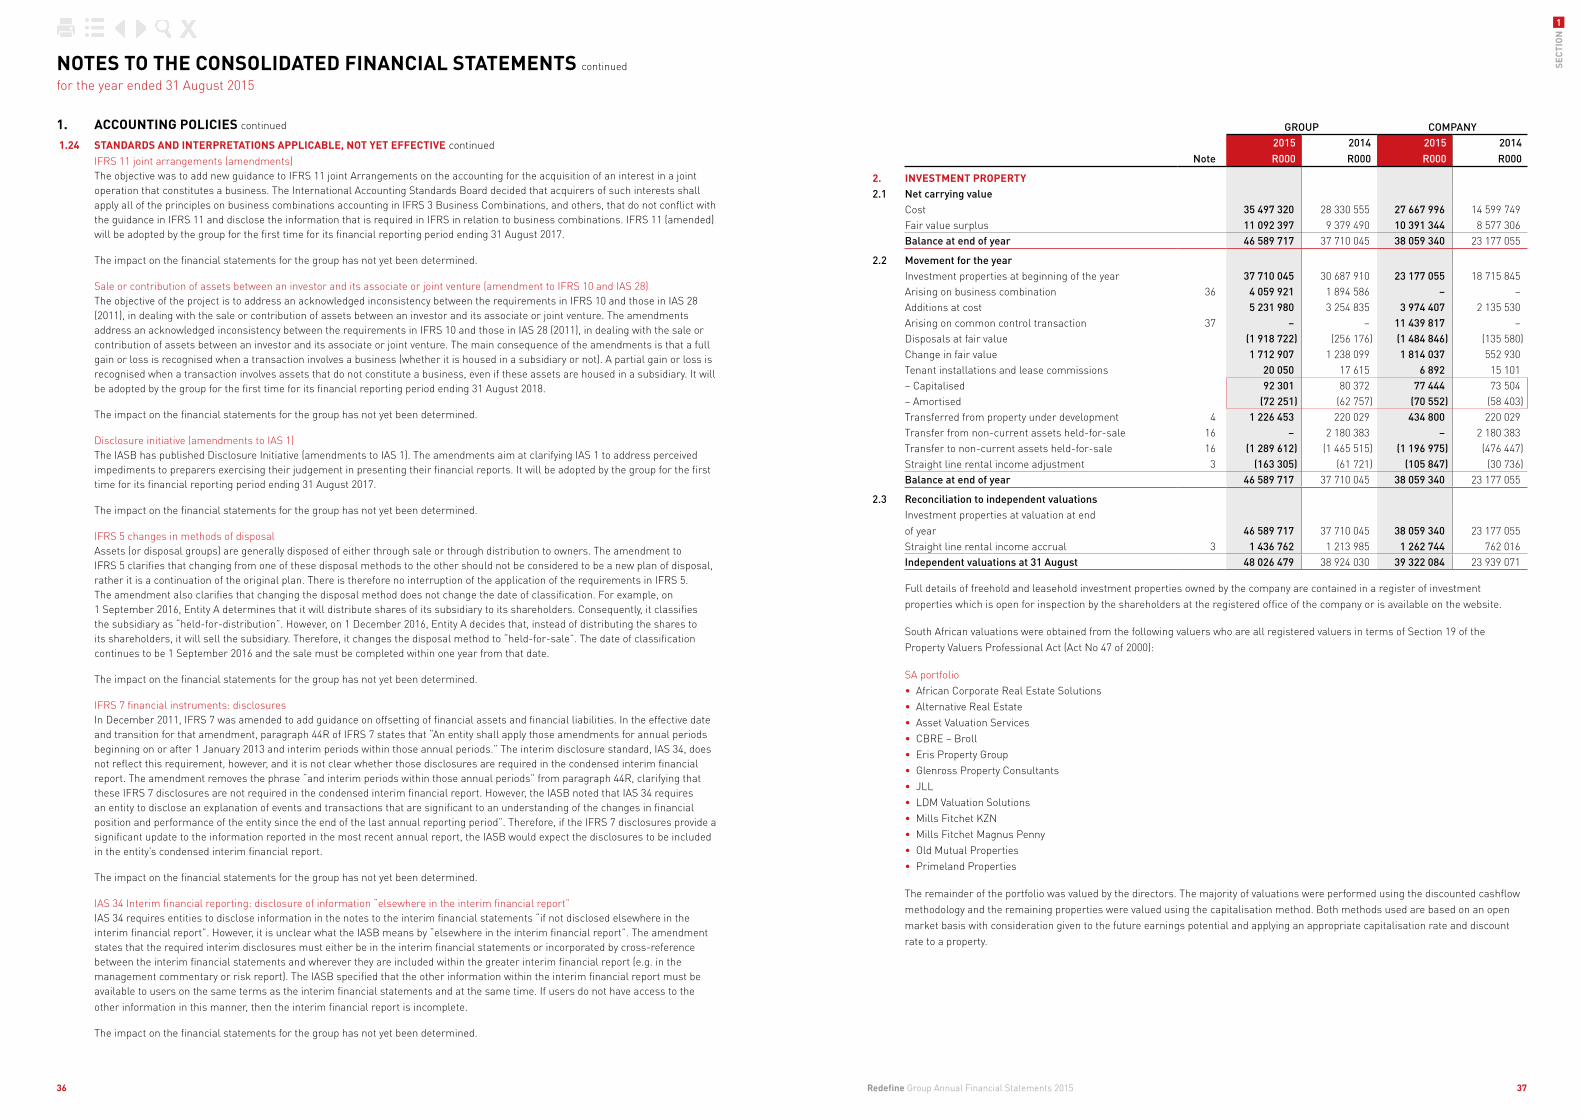
NOTES TO THE CONSOLIDATED FINANCIAL STATEMENTS continued
for the year ended 31 August 2015
GROUP COMPANY
Note2015R000
2014R000
2015R000
2014R000
2. INVESTMENT PROPERTY2.1 Net carrying value
Cost 35 497 320 28 330 555 27 667 996 14 599 749 Fair value surplus 11 092 397 9 379 490 10 391 344 8 577 306 Balance at end of year 46 589 717 37 710 045 38 059 340 23 177 055
2.2 Movement for the yearInvestment properties at beginning of the year 37 710 045 30 687 910 23 177 055 18 715 845Arising on business combination 36 4 059 921 1 894 586 – –Additions at cost 5 231 980 3 254 835 3 974 407 2 135 530 Arising on common control transaction 37 – – 11 439 817 –Disposals at fair value (1 918 722) (256 176) (1 484 846) (135 580)Change in fair value 1 712 907 1 238 099 1 814 037 552 930 Tenant installations and lease commissions 20 050 17 615 6 892 15 101 – Capitalised 92 301 80 372 77 444 73 504 – Amortised (72 251) (62 757) (70 552) (58 403)Transferred from property under development 4 1 226 453 220 029 434 800 220 029 Transfer from non-current assets held-for-sale 16 – 2 180 383 – 2 180 383 Transfer to non-current assets held-for-sale 16 (1 289 612) (1 465 515) (1 196 975) (476 447)Straight line rental income adjustment 3 (163 305) (61 721) (105 847) (30 736)Balance at end of year 46 589 717 37 710 045 38 059 340 23 177 055
2.3 Reconciliation to independent valuationsInvestment properties at valuation at end of year 46 589 717 37 710 045 38 059 340 23 177 055 Straight line rental income accrual 3 1 436 762 1 213 985 1 262 744 762 016 Independent valuations at 31 August 48 026 479 38 924 030 39 322 084 23 939 071
Full details of freehold and leasehold investment properties owned by the company are contained in a register of investment properties which is open for inspection by the shareholders at the registered office of the company or is available on the website.
South African valuations were obtained from the following valuers who are all registered valuers in terms of Section 19 of the Property Valuers Professional Act (Act No 47 of 2000):
SA portfolio• African Corporate Real Estate Solutions• Alternative Real Estate• Asset Valuation Services• CBRE – Broll• Eris Property Group• Glenross Property Consultants• JLL• LDM Valuation Solutions• Mills Fitchet KZN• Mills Fitchet Magnus Penny• Old Mutual Properties• Primeland Properties
The remainder of the portfolio was valued by the directors. The majority of valuations were performed using the discounted cashflow methodology and the remaining properties were valued using the capitalisation method. Both methods used are based on an open market basis with consideration given to the future earnings potential and applying an appropriate capitalisation rate and discount rate to a property.
1. ACCOUNTING POLICIES continued
1.24 STANDARDS AND INTERPRETATIONS APPLICABLE, NOT YET EFFECTIVE continuedIFRS 11 joint arrangements (amendments)The objective was to add new guidance to IFRS 11 joint Arrangements on the accounting for the acquisition of an interest in a joint operation that constitutes a business. The International Accounting Standards Board decided that acquirers of such interests shall apply all of the principles on business combinations accounting in IFRS 3 Business Combinations, and others, that do not conflict with the guidance in IFRS 11 and disclose the information that is required in IFRS in relation to business combinations. IFRS 11 (amended) will be adopted by the group for the first time for its financial reporting period ending 31 August 2017.
The impact on the financial statements for the group has not yet been determined.
Sale or contribution of assets between an investor and its associate or joint venture (amendment to IFRS 10 and IAS 28)The objective of the project is to address an acknowledged inconsistency between the requirements in IFRS 10 and those in IAS 28 (2011), in dealing with the sale or contribution of assets between an investor and its associate or joint venture. The amendments address an acknowledged inconsistency between the requirements in IFRS 10 and those in IAS 28 (2011), in dealing with the sale or contribution of assets between an investor and its associate or joint venture. The main consequence of the amendments is that a full gain or loss is recognised when a transaction involves a business (whether it is housed in a subsidiary or not). A partial gain or loss is recognised when a transaction involves assets that do not constitute a business, even if these assets are housed in a subsidiary. It will be adopted by the group for the first time for its financial reporting period ending 31 August 2018.
The impact on the financial statements for the group has not yet been determined.
Disclosure initiative (amendments to IAS 1)The IASB has published Disclosure Initiative (amendments to IAS 1). The amendments aim at clarifying IAS 1 to address perceived impediments to preparers exercising their judgement in presenting their financial reports. It will be adopted by the group for the first time for its financial reporting period ending 31 August 2017.
The impact on the financial statements for the group has not yet been determined.
IFRS 5 changes in methods of disposalAssets (or disposal groups) are generally disposed of either through sale or through distribution to owners. The amendment to IFRS 5 clarifies that changing from one of these disposal methods to the other should not be considered to be a new plan of disposal, rather it is a continuation of the original plan. There is therefore no interruption of the application of the requirements in IFRS 5. The amendment also clarifies that changing the disposal method does not change the date of classification. For example, on 1 September 2016, Entity A determines that it will distribute shares of its subsidiary to its shareholders. Consequently, it classifies the subsidiary as “held-for-distribution”. However, on 1 December 2016, Entity A decides that, instead of distributing the shares to its shareholders, it will sell the subsidiary. Therefore, it changes the disposal method to “held-for-sale”. The date of classification continues to be 1 September 2016 and the sale must be completed within one year from that date.
The impact on the financial statements for the group has not yet been determined.
IFRS 7 financial instruments: disclosuresIn December 2011, IFRS 7 was amended to add guidance on offsetting of financial assets and financial liabilities. In the effective date and transition for that amendment, paragraph 44R of IFRS 7 states that “An entity shall apply those amendments for annual periods beginning on or after 1 January 2013 and interim periods within those annual periods.” The interim disclosure standard, IAS 34, does not reflect this requirement, however, and it is not clear whether those disclosures are required in the condensed interim financial report. The amendment removes the phrase “and interim periods within those annual periods” from paragraph 44R, clarifying that these IFRS 7 disclosures are not required in the condensed interim financial report. However, the IASB noted that IAS 34 requires an entity to disclose an explanation of events and transactions that are significant to an understanding of the changes in financial position and performance of the entity since the end of the last annual reporting period”. Therefore, if the IFRS 7 disclosures provide a significant update to the information reported in the most recent annual report, the IASB would expect the disclosures to be included in the entity’s condensed interim financial report.
The impact on the financial statements for the group has not yet been determined.
IAS 34 Interim financial reporting: disclosure of information “elsewhere in the interim financial report”IAS 34 requires entities to disclose information in the notes to the interim financial statements “if not disclosed elsewhere in the interim financial report”. However, it is unclear what the IASB means by “elsewhere in the interim financial report”. The amendment states that the required interim disclosures must either be in the interim financial statements or incorporated by cross-reference between the interim financial statements and wherever they are included within the greater interim financial report (e.g. in the management commentary or risk report). The IASB specified that the other information within the interim financial report must be available to users on the same terms as the interim financial statements and at the same time. If users do not have access to the other information in this manner, then the interim financial report is incomplete.
The impact on the financial statements for the group has not yet been determined.
Redefine Group Annual Financial Statements 2015 37
SECT
ION
1
36

GROUP COMPANY
Note2015R000
2014R000
2015R000
2014R000
3 STRAIGHT-LINE RENTAL INCOME ACCRUAL
Balance at beginning of year 1 213 985 1 089 942 762 016 731 280
Arising on business combination/common control 36 & 37 59 472 62 322 394 881 –
Arising during the year 2 163 305 61 721 105 847 30 736
Balance at end of year 1 436 762 1 213 985 1 262 744 762 016
4 PROPERTIES UNDER DEVELOPMENT
At cost
At beginning of the year 1 982 047 1 034 642 1 251 831 849 675 Development costs including capitalised borrowing costs 1 388 392 1 133 702 1 004 357 588 453 Change in fair value (271 596) 33 732 (287 686) 33 732 Transferred from investment property 2 393 614 39 681 124 500 39 681 Completed developments transferred to investment properties 2 (1 620 067) (259 710) (559 300) (259 710)Balance at end of year 1 872 390 1 982 047 1 533 702 1 251 831
Borrowing costs of R153.1 million (group) and R143.8 million (company) (2014: R131.8 million (group) and R97.8 million (company)) were capitalised to properties under development using the average weighted cost of debt.
5 LISTED SECURITIES PORTFOLIO5.1 At fair value
Emira Property Fund 988 793 – 988 793 –Redefine International PLC – – 760 697 621 845 Cromwell Property Group – 2 750 900 – –Balance at end of year 988 793 2 750 900 1 749 490 621 845
5.2 Movement for the year
Balance at beginning of the year 2 750 900 2 050 203 621 845 2 050 203 Additions 2 632 829 2 739 378 1 094 207 886 621 Disposals (172 881) (1 826 776) (172 881) (2 093 327)Changes in fair values 127 718 (211 905) 206 319 (221 652)Transfer to investment in associate (4 349 773) – – –Balance at end of year 988 793 2 750 900 1 749 490 621 845
5.3 Details of listed securitiesStock
exchange % held
Number of units held –
2015
Number of units held –
2014
Emira Property Fund JSE 11.47 58 564 627 –
Cromwell Property Group ASX 25.60 446 538 850 275 038 850
Emira Property FundDuring the period Redefine issued 106 937 778 shares in exchange for 69.56 million Emira (13.7% of the issued shareholders capital of Emira). Redefine subsequently sold 11 million Emira shares, therefore the remaining shareholding at year-end is 11.47%.
The fair value of the investment in Emira is based on the closing price on the JSE, less an accrual for declared distributions, included separately on the statement of financial position as listed security income receivable.
Cromwell Property GroupDuring the period Redefine Properties Australia (Pty) Ltd, a wholly owned subsidiary incorporated in Australia, transferred its 12.8% holding in Cromwell to Redefine Global (Pty) Ltd, a wholly owned subsidiary incorporated in South Africa, resulting in the entire 15.9% holding in Cromwell being held by Redefine Global (Pty) Ltd.
Redefine Global (Pty) Ltd acquired a further 9.7% holding in Cromwell shortly before year-end, increasing their holding in Cromwell to 25.6%. Due to Redefine Global holding more than 20% in Cromwell, the investment was revalued to its market value of R4.4 billion and accounted for as an investment in associate. Refer to note 7.7.
NOTES TO THE CONSOLIDATED FINANCIAL STATEMENTS continued
for the year ended 31 August 2015
2. INVESTMENT PROPERTY continued
First mortgage bonds have been registered over South African investment property (which includes investment property reclassified as held-for-sale), with a fair value of R37.8 billion (2014: R30.6 billion) as security for secured interest-bearing liabilities of R23.6 billion (2014: R13.5 billion).
The independent valuers applied current market related assumptions to the risks in rental streams of properties. Discount rates in the respective sectors are disclosed below.
At the reporting date, the key assumptions used by the group in determining fair value were in the following ranges for the group’s portfolio of properties:
2015%
2014%
Retail sectorDiscount rate 9.00 – 17.00 10.00 – 18.50Exit capitalisation rate 7.50 – 14.00 7.50 – 13.00
Office sectorDiscount rate 8.00 – 17.50 10.50 – 18.00Exit capitalisation rate 8.00 – 13.00 8.00 – 12.50
Industrial sectorDiscount rate 9.50 – 18.50 10.50 – 16.50Exit capitalisation rate 7.75 – 12.50 9.00 – 12.50
Measurement of fair valueFair value hierarchyThe following table shows the valuation technique used in measuring the fair value of investment property, as well as the significant unobservable inputs used:
Valuation techniques Significant unobservable inputs
Inter-relationship between key unobservable inputs and fair value measurements
All external valuations were completed using the discounted cashflow method of valuation. The valuation model generates a net present value for each property by discounting forecasted future cashflows and a residual value at the end of the cashflow projection period by the discount rate of each property. The residual value is calculated by capitalising the net income forecasted for the 12 month period immediately following the final year of the cashflow at the exit/reversionary capitalisation rate. The discount rate applied by each valuator is determined by adding a growth rate per property, based on forecasted market related rental increases, to the determined capitalisation rate per property. The discount rate is then tested for reasonableness by benchmarking the rate against recent comparable sales and surveys prepared by IPD/SAPOA. The capitalisation rate is dependent on a number of factors, such as location, the condition of the improvements, current market conditions, the lease covenants and the risk inherent in the property and is also tested for reasonableness by benchmarking against comparable recent comparable sales and surveys prepared by IPD/SAPOA.
– Expected market rental growth (4% – 9%)
– Expected expense growth estimated (7% – 10%)
– Vacant periods (0 – 12 months)
– Occupancy rate (average 95.94%)
– Rent-free periods (0 – 3 months)
– Discount rates (9% – 18.5%)
– Reversionary capitalisation rate (7.5% – 14%)
– Capitalisation rate 7.5% – 14%)
The estimated fair value would increase/(decrease) if:
– Expected market rental growth was higher/(lower)
– Expected expense growth was lower/(higher)
– Vacant periods were shorter/(longer)
– The occupancy rate was higher/(lower)
– Rent-free periods were shorter/(longer)
– Discount rate was lower/(higher)
– Reversionary capitalisation rate was lower/(higher)
– Capitalisation rate was lower/(higher)
The fair value measurement for investment property of R49 899 million (group) and R40 856 million (company) (2014: R40 906 million (group) and R25 190 (company)) has been categorised as level 3 under the fair value hierarchy based on the inputs to the valuation technique used. Refer to note 41.4 for the level 3 reconciliation.
Redefine Group Annual Financial Statements 2015 39
SECT
ION
1
38

The following key assumptions were used in calculating the value in use of the electricity recovery business:
– Electricity recovered from tenants will increase by 6%
– Operating expenses will increase by 6%
– All profits will be distributed and thus no normal tax is payable
– A discount rate of 12% applies
– The value in use was calculated over a period of five years
GROUP COMPANY
Note2015R000
2014R000
2015R000
2014R000
7 INVESTMENTS IN ASSOCIATES AND JOINT VENTURES
7.1 Carrying amount
Joint venture – Leopard Holdings 7.6 653 046 – – –
– Shareholders loans 704 342 – – –
– Interest received (54 101) – – –
– Share of equity accounted results 2 805 – – –
Associate – Redefine International PLC 7.4 4 145 157 3 501 379 – –
– Gross consideration 3 696 508 3 174 764 – –
– Dividend received (358 534) (112 074) – –
– Share of equity accounted results 807 183 438 689 – –
Joint venture – Cromwell Partners Trust 7.5 675 343 671 794 – –
– Gross consideration 733 864 733 865 – –
– Dividend received (101 396) (43 096) – –
– Share of equity accounted results 42 875 (18 975) – –
Associate – Cromwell Property Group 7.7 4 349 773 – – –
– Gross consideration 4 349 773 – – –
Balance at end of year 9 823 319 4 173 173 – –
7.2 Movement for the year
Balance at beginning of year 4 173 173 1 654 067 – 1 526 098
Acquisitions 5 575 861 3 908 628 – –
Equity accounted results for the year 433 147 414 612 – –
Equity accounted results for the year per statement of comprehensive income 453 053 439 766 – –
Share of distributable profit 358 862 155 169 – –
Fair value adjustments (net of deferred tax) 94 191 284 597 – –
Other comprehensive income (19 906) (25 154) – –
Disposal – (1 648 964) – (1 526 098)
Interest received (54 101) – – –
Dividend received (304 761) (155 170) – –
Balance at end of year 9 823 319 4 173 173 – –
NOTES TO THE CONSOLIDATED FINANCIAL STATEMENTS continued
for the year ended 31 August 2015
5 LISTED SECURITIES PORTFOLIO continued
Redefine International PLCRedefine International PLC is accounted for as a listed security at a company level and an associate at group level.
GROUP COMPANY
Note2015R000
2014R000
2015R000
2014R000
6. GOODWILL AND INTANGIBLES
Reconciliation of goodwill and intangibles
Balance at beginning of year 5 328 676 5 264 122 275 416 270 325
Goodwill acquired through business combination/transactions under common control 101 227 122 319 893 280 –
Amortisation of intangibles (62 856) (62 856) – –
Intangibles acquired – 5 091 – 5 091
Balance at end of year 5 367 047 5 328 676 1 168 696 275 416
Goodwill and intangibles
– ApexHi, Ambit and Madison 2 570 534 2 570 534 – –
– Fountainhead Property Trust Management Limited and Evening Star 768 Trading (Proprietary) Limited 183 437 183 437 – –
– Fountainhead Property Trust 37 1 548 413 893 280 893 280 –
– Annuity Properties, Annuity Asset Managers and Annuity Property Managers 122 319 122 319 – –
– Leaf Property Fund 36 101 227 – – –
Total goodwill 4 525 930 3 769 570 893 280 –
The right to manage property – Redefine 565 701 628 557 – –
– Cost 942 835 942 835 – –
– Amortisation (377 134) (314 278) – –
The right to manage property – Fountainhead – 655 133
Electricity recovery business 275 416 275 416 275 416 275 416
Total intangibles 841 117 1 559 106 275 416 275 416
Total goodwill and intangibles 5 367 047 5 328 676 1 168 696 275 416
GoodwillFor the purpose of impairment testing, goodwill acquired has been allocated to the group as a whole, as management believes that the group as a whole will benefit from the synergies of the business combinations undertaken.
Discounted cashflow valuations, used for the purpose of impairment testing, are based on the cashflow forecasts in respect of the continuing use of the cash generating unit for a period of five years, discounted at a yield of 6.72% (2014: 8.94%).
The following key assumptions were used in calculating the cashflow forecasts used in the impairment test:
– All profits will be distributed and thus no normal tax is payable
– Growth rate of between 6% and 7.0% which is in line with industry expectations
IntangiblesThe right to manage property – Redefine, arose on the business combination of ApexHi, Ambit and Madison on 1 July 2009. The remaining amortisation period is 106 months (2014: 118 months).
The right to manage property – Fountainhead, arose on the business combination of Fountainhead ManCo and Evening Star on 1 August 2012. In terms of the Fountainhead Property Trust debenture trust deed, this results in a perpetual right to manage the Fountainhead property portfolio and as such this has not been amortised. As a result of Redefine’s acquisition of Fountainhead’s assets and liabilities as at 3 August 2015, the right to manage property has been transferred to the goodwill figure raised on initial acquisition of Fountainhead.
The electricity recovery business was acquired in terms of the business combination on 14 April 2013.
Redefine Group Annual Financial Statements 2015 41
SECT
ION
1
40

NOTES TO THE CONSOLIDATED FINANCIAL STATEMENTS continued
for the year ended 31 August 2015
GROUP COMPANY
Note2015R000
2014R000
2015R000
2014R000
7 INVESTMENTS IN ASSOCIATES AND JOINT VENTURES continued
7.3 Group’s share of post acquisition reserves
Fair valuation reserves
Share of reserves at beginning of year 348 294 186 807
Share of profit for the year 141 939 346 667
Deemed disposal of an associate – (185 180)
Share of reserves at end of year 490 233 348 294
Accumulated profits
Share of reserves at beginning of year 71 420 125 029
Share of profit and other comprehensive income for the year 291 210 67 945
Deemed disposal of an associate – (121 554)
Share of reserves at end of year 362 630 71 420
Total post acquisition reserves 852 863 419 714
7.4 Redefine International PLC
During the prior period Redefine’s indirect holding in RI PLC through Redefine International transferred to a direct holding as a result of the inward listing of RI PLC on the JSE. This resulted in the deemed disposal of RIN and deemed acquisition of RI PLC.
RI PLC is a UK REIT listed on the London Stock Exchange and inwardly listed on the JSE. Redefine held 443 371 181 (402 846 870 on the JSE and 40 524 311 on the LSE) (30.07%) (2014: 389 525 639 (388 498 851 on the JSE and 1 026 788 on the LSE)) of the issued share capital at 31 August 2015. The closing share price of RI PLC on 31 August 2015 was R11.06 (2014: R9.28) on the JSE and 52.75 pence (R10.83) (2014: 51.8 pence (R9.14)) on the LSE.
An impairment test was performed using the fair value as quoted on the JSE and LSE (less the distribution receivable). The fair value exceeds the carrying value and no impairment was considered necessary. There are no restrictions on the ability of RI PLC to transfer funds to its shareholders in the form of cash and dividends.
GROUP
Note2015R000
2014R000
Summarised statement of profit or loss and other comprehensive income
Revenue 1 460 168 1 268 576
Operating expenses (85 701) (69 329)
Admin Expenses (160 336) (131 246)
Fair value adjustments 478 512 939 338
Equity accounted profit 133 704 72 610
Interest received 26 288 42 052
Interest paid (465 899) (439 207)
Foreign exchange loss – (2 584)
Profit before taxation 1 386 736 1 680 210
Taxation (16 569) (24 315)
Profit after taxation 1 370 167 1 655 895
Non-controlling interest (78 633) (61 700)
Distributable earnings attributable to equity holders 1 291 534 1 594 195
Other comprehensive income:
Foreign currency translation (66 192) (75 071)
Total equity accounted comprehensive income 1 225 342 1 519 124
GROUP
Note2015R000
2014R000
Redefine’s 30.07% (2014:30.05%) share in equity accounted results 368 493 438 689
Summarised statement of financial position
Non-current assets 20 406 609 18 905 734
Investment property 19 178 369 16 660 470
Other financial assets 37 243 1 767 064
Investment in associates and joint ventures 1 153 850 408 022
Other non-current assets 37 147 70 178
Current assets 4 777 448 1 968 180
Trade and other receivables 2 855 043 373 539
Cash and cash equivalents 1 922 405 1 594 641
Total assets 25 184 057 20 873 914
Non-current liabilities 11 544 875 11 381 663
Interest bearing borrowings 11 412 193 11 276 412
Derivatives 87 939 92 879
Deferred taxation 44 743 12 372
Current liabilities 566 497 501 744
Trade and other payables 566 497 501 744
Total liabilities 12 111 372 11 883 407
Net assets 13 072 685 8 990 507
RI PLC carrying amount 4 145 157 3 501 379
Redefine’s 30.07% (2014: 30.05%) share in equity 3 930 958 2 701 648
Goodwill 214 199 799 731
7.5 Cromwell Partners TrustThe Trust was formed to acquire and hold units in Northpoint Trust, which itself was constituted to acquire the Northpoint Tower in the North Sydney CBD. The Northpoint property, located at 100 Miller Street, North Sydney, New South Wales was acquired by NPT on 19 December 2013. The Cromwell Property Group and Redefine Global (Pty) Ltd each own 50% of the issued units of the trust.
Redefine invested AUS $80 million in CPT, equating to an investment in CPT of R734 million.
CPT has a 30 June financial year-end and as such all results to 30 June 2015 and for the two months July and August 2015 have been equity accounted.
An impairment test was performed using the net asset value of CPT. Redefine’s 50% share of the NAV exceeds the carrying value and no impairment was considered necessary. There are no restrictions on the ability of CPT to transfer funds to its shareholders in the form of cash and dividends.
Redefine Group Annual Financial Statements 2015 43
SECT
ION
1
42
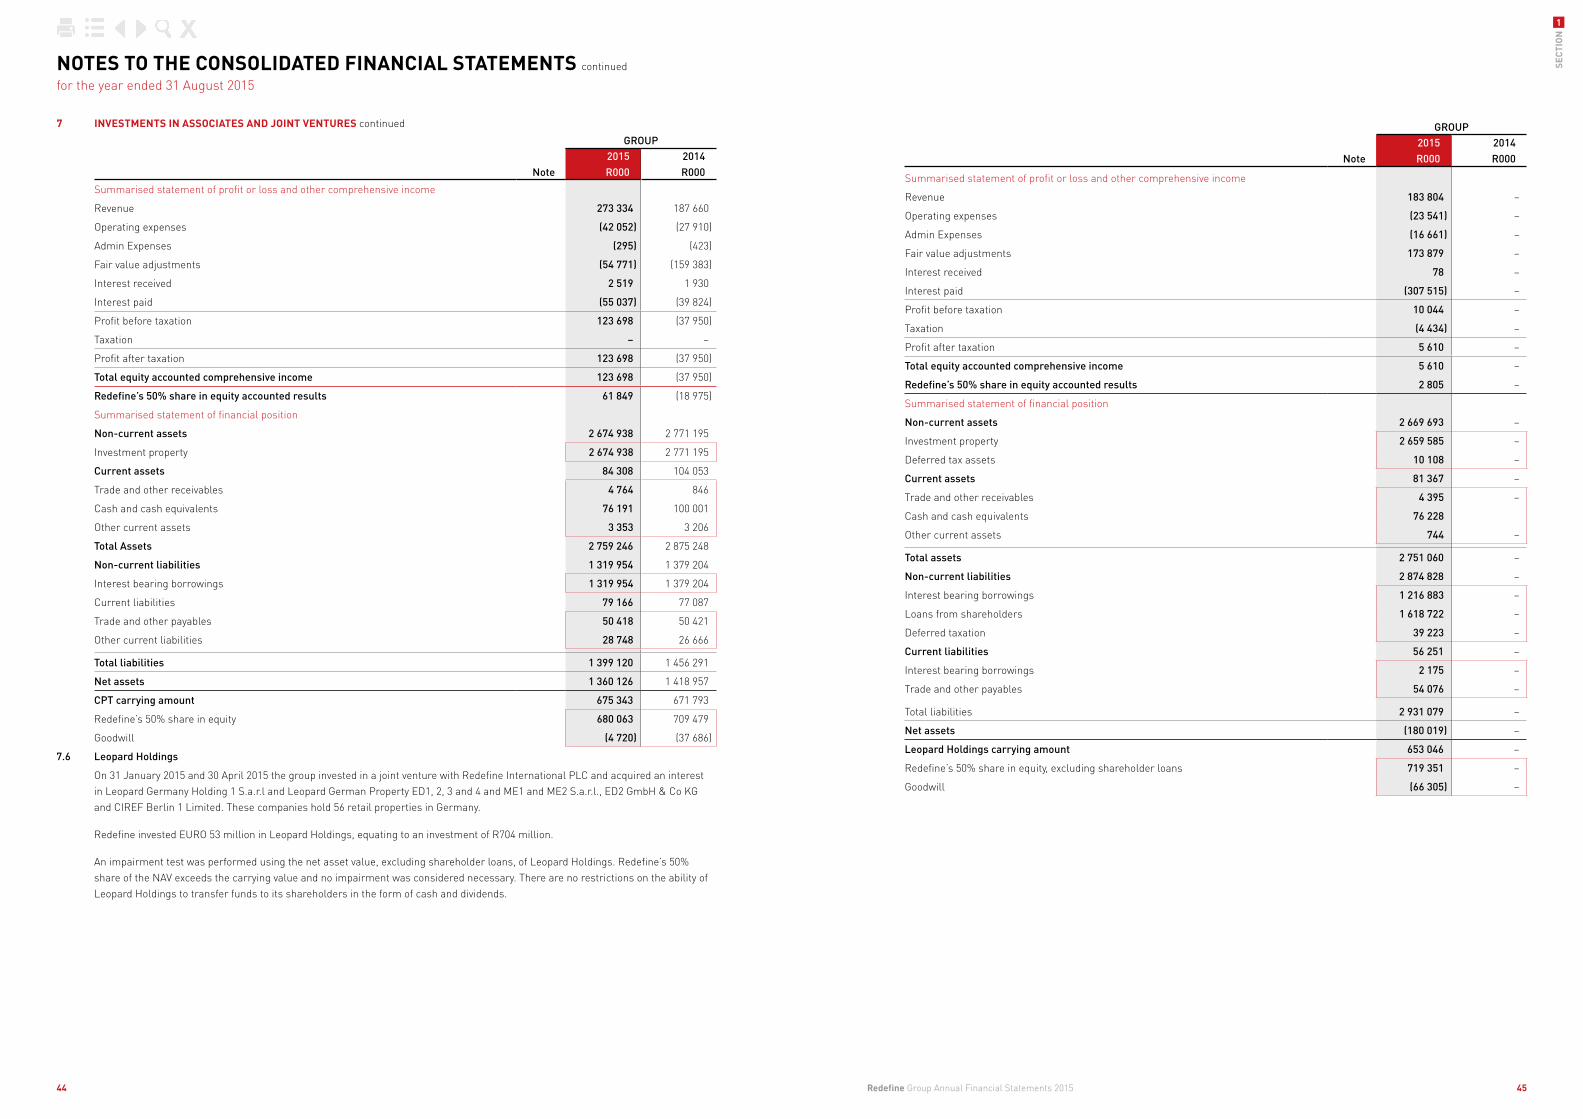
NOTES TO THE CONSOLIDATED FINANCIAL STATEMENTS continued
for the year ended 31 August 2015
7 INVESTMENTS IN ASSOCIATES AND JOINT VENTURES continued
GROUP
Note2015R000
2014R000
Summarised statement of profit or loss and other comprehensive income
Revenue 273 334 187 660
Operating expenses (42 052) (27 910)
Admin Expenses (295) (423)
Fair value adjustments (54 771) (159 383)
Interest received 2 519 1 930
Interest paid (55 037) (39 824)
Profit before taxation 123 698 (37 950)
Taxation – –
Profit after taxation 123 698 (37 950)
Total equity accounted comprehensive income 123 698 (37 950)
Redefine’s 50% share in equity accounted results 61 849 (18 975)
Summarised statement of financial position
Non-current assets 2 674 938 2 771 195
Investment property 2 674 938 2 771 195
Current assets 84 308 104 053
Trade and other receivables 4 764 846
Cash and cash equivalents 76 191 100 001
Other current assets 3 353 3 206
Total Assets 2 759 246 2 875 248
Non-current liabilities 1 319 954 1 379 204
Interest bearing borrowings 1 319 954 1 379 204
Current liabilities 79 166 77 087
Trade and other payables 50 418 50 421
Other current liabilities 28 748 26 666
Total liabilities 1 399 120 1 456 291
Net assets 1 360 126 1 418 957
CPT carrying amount 675 343 671 793
Redefine’s 50% share in equity 680 063 709 479
Goodwill (4 720) (37 686)
7.6 Leopard Holdings
On 31 January 2015 and 30 April 2015 the group invested in a joint venture with Redefine International PLC and acquired an interest in Leopard Germany Holding 1 S.a.r.l and Leopard German Property ED1, 2, 3 and 4 and ME1 and ME2 S.a.r.l., ED2 GmbH & Co KG and CIREF Berlin 1 Limited. These companies hold 56 retail properties in Germany.
Redefine invested EURO 53 million in Leopard Holdings, equating to an investment of R704 million.
An impairment test was performed using the net asset value, excluding shareholder loans, of Leopard Holdings. Redefine’s 50% share of the NAV exceeds the carrying value and no impairment was considered necessary. There are no restrictions on the ability of Leopard Holdings to transfer funds to its shareholders in the form of cash and dividends.
GROUP
Note2015R000
2014R000
Summarised statement of profit or loss and other comprehensive income
Revenue 183 804 –
Operating expenses (23 541) –
Admin Expenses (16 661) –
Fair value adjustments 173 879 –
Interest received 78 –
Interest paid (307 515) –
Profit before taxation 10 044 –
Taxation (4 434) –
Profit after taxation 5 610 –
Total equity accounted comprehensive income 5 610 –
Redefine’s 50% share in equity accounted results 2 805 –
Summarised statement of financial position
Non-current assets 2 669 693 –
Investment property 2 659 585 –
Deferred tax assets 10 108 –
Current assets 81 367 –
Trade and other receivables 4 395 –
Cash and cash equivalents 76 228
Other current assets 744 –
Total assets 2 751 060 –
Non-current liabilities 2 874 828 –
Interest bearing borrowings 1 216 883 –
Loans from shareholders 1 618 722 –
Deferred taxation 39 223 –
Current liabilities 56 251 –
Interest bearing borrowings 2 175 –
Trade and other payables 54 076 –
Total liabilities 2 931 079 –
Net assets (180 019) –
Leopard Holdings carrying amount 653 046 –
Redefine’s 50% share in equity, excluding shareholder loans 719 351 –
Goodwill (66 305) –
Redefine Group Annual Financial Statements 2015 45
SECT
ION
1
44

GROUP
Note2015R000
2014R000
Non-current liabilities 10 530 619 –
Interest bearing borrowings 10 391 764 –
Derivatives 107 123 –
Deferred taxation 31 732 –
Current liabilities 1 775 302 –
Interest bearing borrowings 611 009 –
Derivatives 270 394 –
Distribution payable 329 847 –
Trade and other payables 564 052 –
Total liabilities 12 305 921 –
Net assets 12 299 534 –
The summarised financial information presented above for the Cromwell Property Group is for the period ended 30 June 2015, the financial year-end for the Cromwell Property Group.
Redefine did not equity account the results of Cromwell Property Group due to the fact that the investment was only accounted for as an investment in associate on the last day of the financial year.
There were no material movements between the summarised financial information presented above and the financial information as at 31 August 2015.
GROUP COMPANY
Note2015R000
2014R000
2015R000
2014R000
8 LOANS RECEIVABLE
Redefine Empowerment Trust – – 3 054 000 –
The loan is secured by 300 million Redefine shares and bears interest at the lower of 16% per annum or the amount of the distribution received by the Redefine Empowerment Trust.
The loan is repayable in two installments of 15% and seven installments of 10% of the original loan balance. The first loan repayment will occur on 1 September 2016 provided the Redefine share price has grown by R1 from the share price on the date the loan was advanced. The share price is required to appreciate by 6% each repayment date in order for an installment to be repaid.
Milestone Property Group 9 750 10 000 9 750 10 000
The loan is secured by a first mortgage bond over investment property and bears interest at the rate of 9.5% per annum.
The loan is repayable in full 48 months after loan advance, being June 2018, with the first twelve months being interest and thereafter interest and capital over remaining 36 months.
NOTES TO THE CONSOLIDATED FINANCIAL STATEMENTS continued
for the year ended 31 August 2015
7 INVESTMENTS IN ASSOCIATES AND JOINT VENTURES continued
7.7 Cromwell Property GroupDuring the period Redefine Properties Australia (Pty) Ltd, a wholly owned subsidiary incorporated in Australia, transferred its 12.8% holding in Cromwell to Redefine Global (Pty) Ltd, a wholly owned subsidiary incorporated in South Africa, resulting in the entire 15.9% holding in Cromwell being held by Redefine Global (Pty) Ltd.
Redefine Global (Pty) Ltd acquired a further 9.7% holding in Cromwell shortly before year-end, increasing their holding in Cromwell to 25.6%. Due to Redefine Global holding more than 20% in Cromwell, the investment was revalued to its market value of R4.3 billion and accounted for as an investment in associate. Refer to note 5.3.
The fair value of the investment in Cromwell is based on the closing price on the ASX and rand/Australian dollar exchange rate at 31 August 2015.
An impairment test was performed using the fair value as quoted on the ASX (less the distribution receivable). The fair value exceeds the carrying value and no impairment was considered necessary. There are no restrictions on the ability of Cromwell Property Group to transfer funds to its shareholders in the form of cash and dividends.
GROUP
Note2015R000
2014R000
Summarised statement of profit or loss and other comprehensive income
Revenue 2 493 425 –
Operating expenses (398 576) –
Admin Expenses (431 678) –
Fair value adjustments 277 661 –
Equity accounted profit 74 647 –
Interest received 52 435 –
Interest paid (588 424) –
Foreign exchange loss (74 902) –
Profit before taxation 1 404 588 –
Taxation 368 –
Distributable earnings attributable to equity holders 1 404 956 –
Other comprehensive income:
Foreign currency translation 59 282 –
Total equity accounted comprehensive income 1 464 238 –
Summarised statement of financial position
Non-current assets 23 117 777 –
Investment property 20 315 138 –
Other financial assets 414 476 –
Investment in associates and joint ventures 733 946 –
Deferred tax 11 214 –
Intangible assets 1 574 692 –
Other non-current assets 68 311 –
Current assets 1 487 678 –
Trade and other receivables 175 824 –
Other current assets 276 324 –
Cash and cash equivalents 1 035 530 –
Total assets 24 605 455 –
Redefine Group Annual Financial Statements 2015 47
SECT
ION
1
46
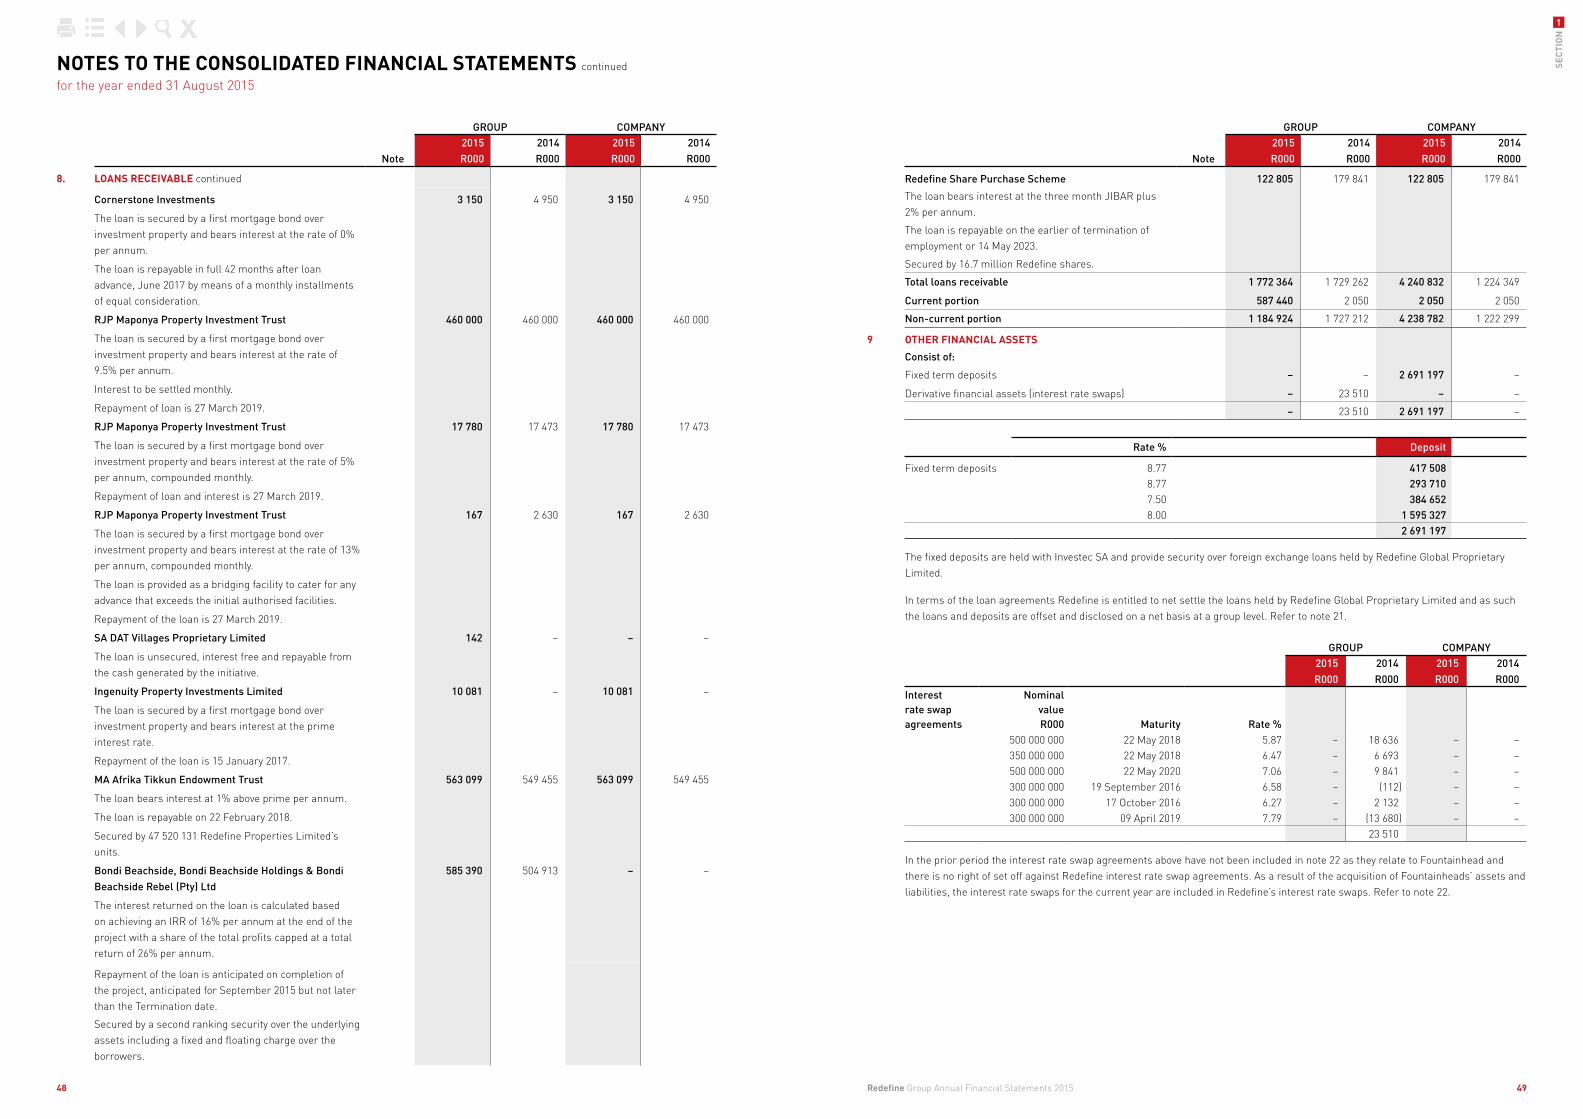
GROUP COMPANY
Note2015R000
2014R000
2015R000
2014R000
Redefine Share Purchase Scheme 122 805 179 841 122 805 179 841
The loan bears interest at the three month JIBAR plus 2% per annum.
The loan is repayable on the earlier of termination of employment or 14 May 2023.
Secured by 16.7 million Redefine shares.
Total loans receivable 1 772 364 1 729 262 4 240 832 1 224 349
Current portion 587 440 2 050 2 050 2 050
Non-current portion 1 184 924 1 727 212 4 238 782 1 222 299
9 OTHER FINANCIAL ASSETS
Consist of:
Fixed term deposits – – 2 691 197 –
Derivative financial assets (interest rate swaps) – 23 510 – –
– 23 510 2 691 197 –
Rate % Deposit
Fixed term deposits 8.77 417 508 8.77 293 710 7.50 384 652 8.00 1 595 327
2 691 197
The fixed deposits are held with Investec SA and provide security over foreign exchange loans held by Redefine Global Proprietary Limited.
In terms of the loan agreements Redefine is entitled to net settle the loans held by Redefine Global Proprietary Limited and as such the loans and deposits are offset and disclosed on a net basis at a group level. Refer to note 21.
GROUP COMPANY2015R000
2014R000
2015R000
2014R000
Interest rate swap agreements
NominalvalueR000 Maturity Rate %
500 000 000 22 May 2018 5.87 – 18 636 – – 350 000 000 22 May 2018 6.47 – 6 693 – – 500 000 000 22 May 2020 7.06 – 9 841 – – 300 000 000 19 September 2016 6.58 – (112) – – 300 000 000 17 October 2016 6.27 – 2 132 – – 300 000 000 09 April 2019 7.79 – (13 680) – –
23 510
In the prior period the interest rate swap agreements above have not been included in note 22 as they relate to Fountainhead and there is no right of set off against Redefine interest rate swap agreements. As a result of the acquisition of Fountainheads’ assets and liabilities, the interest rate swaps for the current year are included in Redefine’s interest rate swaps. Refer to note 22.
GROUP COMPANY
Note2015R000
2014R000
2015R000
2014R000
8. LOANS RECEIVABLE continued
Cornerstone Investments 3 150 4 950 3 150 4 950
The loan is secured by a first mortgage bond over investment property and bears interest at the rate of 0% per annum.
The loan is repayable in full 42 months after loan advance, June 2017 by means of a monthly installments of equal consideration.
RJP Maponya Property Investment Trust 460 000 460 000 460 000 460 000
The loan is secured by a first mortgage bond over investment property and bears interest at the rate of 9.5% per annum.
Interest to be settled monthly.
Repayment of loan is 27 March 2019.
RJP Maponya Property Investment Trust 17 780 17 473 17 780 17 473
The loan is secured by a first mortgage bond over investment property and bears interest at the rate of 5% per annum, compounded monthly.
Repayment of loan and interest is 27 March 2019.
RJP Maponya Property Investment Trust 167 2 630 167 2 630
The loan is secured by a first mortgage bond over investment property and bears interest at the rate of 13% per annum, compounded monthly.
The loan is provided as a bridging facility to cater for any advance that exceeds the initial authorised facilities.
Repayment of the loan is 27 March 2019.
SA DAT Villages Proprietary Limited 142 – – –
The loan is unsecured, interest free and repayable from the cash generated by the initiative.
Ingenuity Property Investments Limited 10 081 – 10 081 –
The loan is secured by a first mortgage bond over investment property and bears interest at the prime interest rate.
Repayment of the loan is 15 January 2017.
MA Afrika Tikkun Endowment Trust 563 099 549 455 563 099 549 455
The loan bears interest at 1% above prime per annum.
The loan is repayable on 22 February 2018.
Secured by 47 520 131 Redefine Properties Limited’s units.
Bondi Beachside, Bondi Beachside Holdings & Bondi Beachside Rebel (Pty) Ltd
585 390 504 913 – –
The interest returned on the loan is calculated based on achieving an IRR of 16% per annum at the end of the project with a share of the total profits capped at a total return of 26% per annum.
Repayment of the loan is anticipated on completion of the project, anticipated for September 2015 but not later than the Termination date.
Secured by a second ranking security over the underlying assets including a fixed and floating charge over the borrowers.
NOTES TO THE CONSOLIDATED FINANCIAL STATEMENTS continued
for the year ended 31 August 2015
Redefine Group Annual Financial Statements 2015 49
SECT
ION
1
48
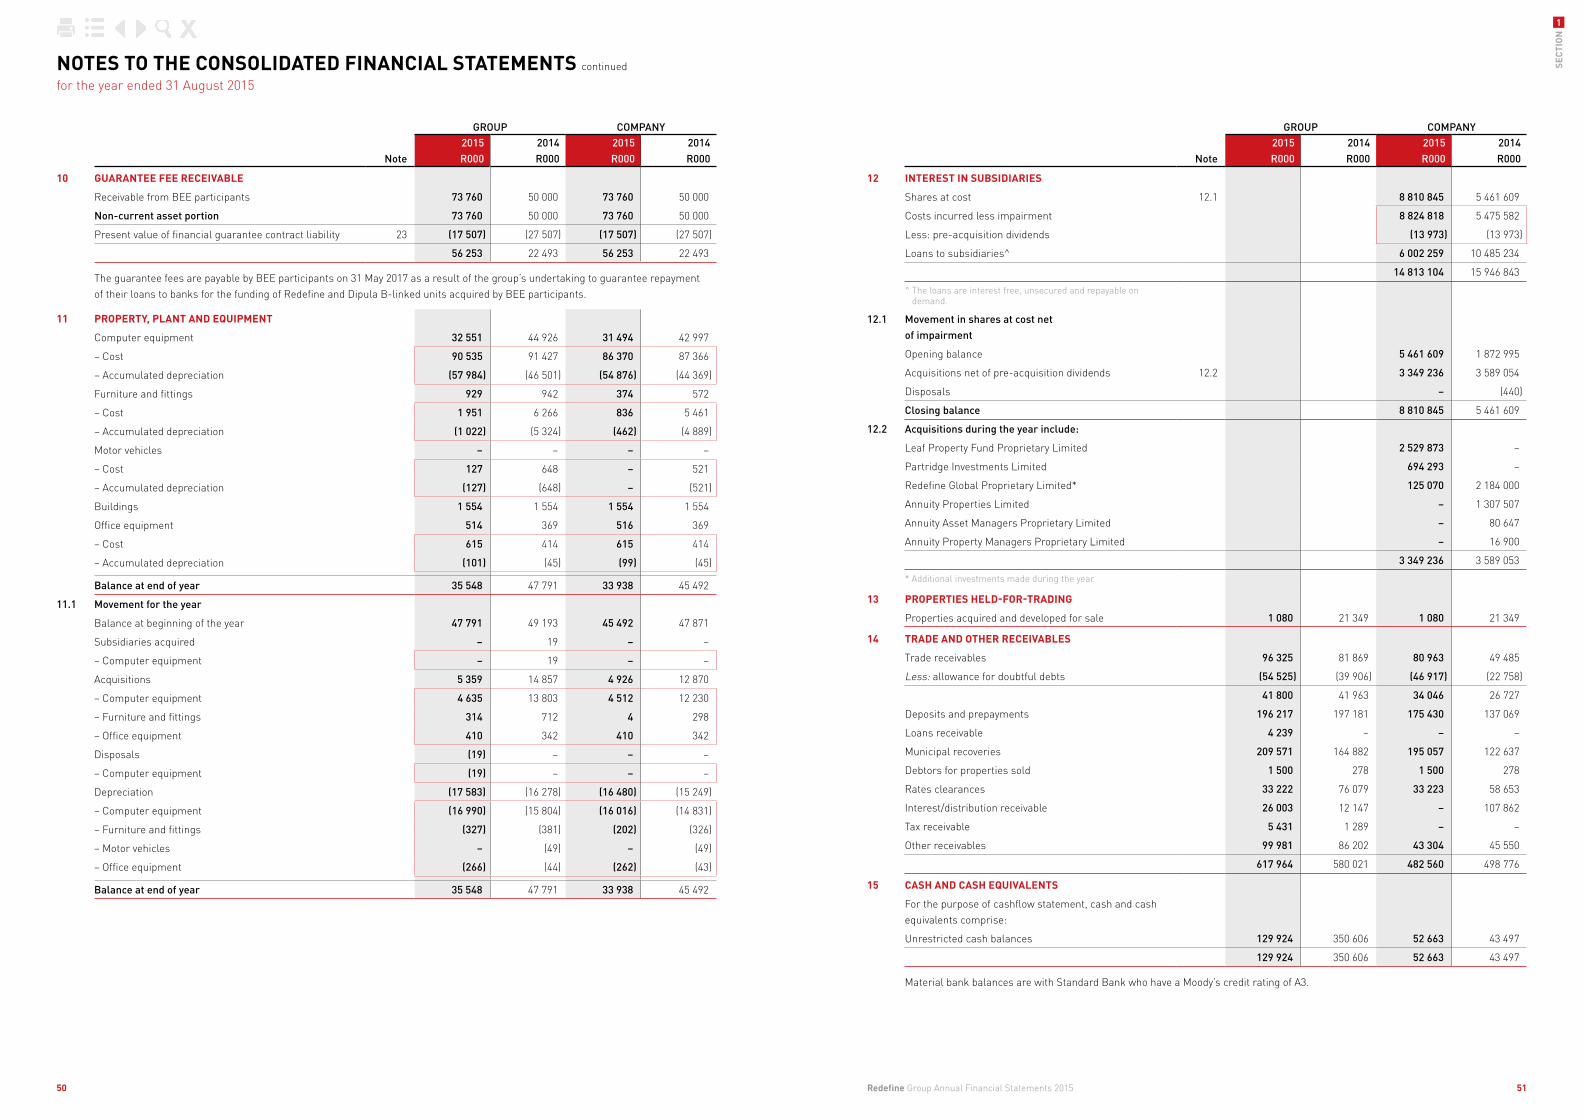
GROUP COMPANY
Note2015R000
2014R000
2015R000
2014R000
12 INTEREST IN SUBSIDIARIES
Shares at cost 12.1 8 810 845 5 461 609
Costs incurred less impairment 8 824 818 5 475 582
Less: pre-acquisition dividends (13 973) (13 973)
Loans to subsidiaries^ 6 002 259 10 485 234
14 813 104 15 946 843
^ The loans are interest free, unsecured and repayable on demand.
12.1 Movement in shares at cost net of impairment
Opening balance 5 461 609 1 872 995
Acquisitions net of pre-acquisition dividends 12.2 3 349 236 3 589 054
Disposals – (440)
Closing balance 8 810 845 5 461 609
12.2 Acquisitions during the year include:
Leaf Property Fund Proprietary Limited 2 529 873 –
Partridge Investments Limited 694 293 –
Redefine Global Proprietary Limited* 125 070 2 184 000
Annuity Properties Limited – 1 307 507
Annuity Asset Managers Proprietary Limited – 80 647
Annuity Property Managers Proprietary Limited – 16 900
3 349 236 3 589 053
* Additional investments made during the year
13 PROPERTIES HELD-FOR-TRADING
Properties acquired and developed for sale 1 080 21 349 1 080 21 349
14 TRADE AND OTHER RECEIVABLES
Trade receivables 96 325 81 869 80 963 49 485
Less: allowance for doubtful debts (54 525) (39 906) (46 917) (22 758)
41 800 41 963 34 046 26 727
Deposits and prepayments 196 217 197 181 175 430 137 069
Loans receivable 4 239 – – –
Municipal recoveries 209 571 164 882 195 057 122 637
Debtors for properties sold 1 500 278 1 500 278
Rates clearances 33 222 76 079 33 223 58 653
Interest/distribution receivable 26 003 12 147 – 107 862
Tax receivable 5 431 1 289 – –
Other receivables 99 981 86 202 43 304 45 550
617 964 580 021 482 560 498 776
15 CASH AND CASH EQUIVALENTS
For the purpose of cashflow statement, cash and cash equivalents comprise:
Unrestricted cash balances 129 924 350 606 52 663 43 497
129 924 350 606 52 663 43 497
Material bank balances are with Standard Bank who have a Moody’s credit rating of A3.
GROUP COMPANY
Note2015R000
2014R000
2015R000
2014R000
10 GUARANTEE FEE RECEIVABLE
Receivable from BEE participants 73 760 50 000 73 760 50 000
Non-current asset portion 73 760 50 000 73 760 50 000
Present value of financial guarantee contract liability 23 (17 507) (27 507) (17 507) (27 507)
56 253 22 493 56 253 22 493
The guarantee fees are payable by BEE participants on 31 May 2017 as a result of the group’s undertaking to guarantee repayment of their loans to banks for the funding of Redefine and Dipula B-linked units acquired by BEE participants.
11 PROPERTY, PLANT AND EQUIPMENT
Computer equipment 32 551 44 926 31 494 42 997
– Cost 90 535 91 427 86 370 87 366
– Accumulated depreciation (57 984) (46 501) (54 876) (44 369)
Furniture and fittings 929 942 374 572
– Cost 1 951 6 266 836 5 461
– Accumulated depreciation (1 022) (5 324) (462) (4 889)
Motor vehicles – – – –
– Cost 127 648 – 521
– Accumulated depreciation (127) (648) – (521)
Buildings 1 554 1 554 1 554 1 554
Office equipment 514 369 516 369
– Cost 615 414 615 414
– Accumulated depreciation (101) (45) (99) (45)
Balance at end of year 35 548 47 791 33 938 45 492
11.1 Movement for the year
Balance at beginning of the year 47 791 49 193 45 492 47 871
Subsidiaries acquired – 19 – –
– Computer equipment – 19 – –
Acquisitions 5 359 14 857 4 926 12 870
– Computer equipment 4 635 13 803 4 512 12 230
– Furniture and fittings 314 712 4 298
– Office equipment 410 342 410 342
Disposals (19) – – –
– Computer equipment (19) – – –
Depreciation (17 583) (16 278) (16 480) (15 249)
– Computer equipment (16 990) (15 804) (16 016) (14 831)
– Furniture and fittings (327) (381) (202) (326)
– Motor vehicles – (49) – (49)
– Office equipment (266) (44) (262) (43)
Balance at end of year 35 548 47 791 33 938 45 492
NOTES TO THE CONSOLIDATED FINANCIAL STATEMENTS continued
for the year ended 31 August 2015
Redefine Group Annual Financial Statements 2015 51
SECT
ION
1
50
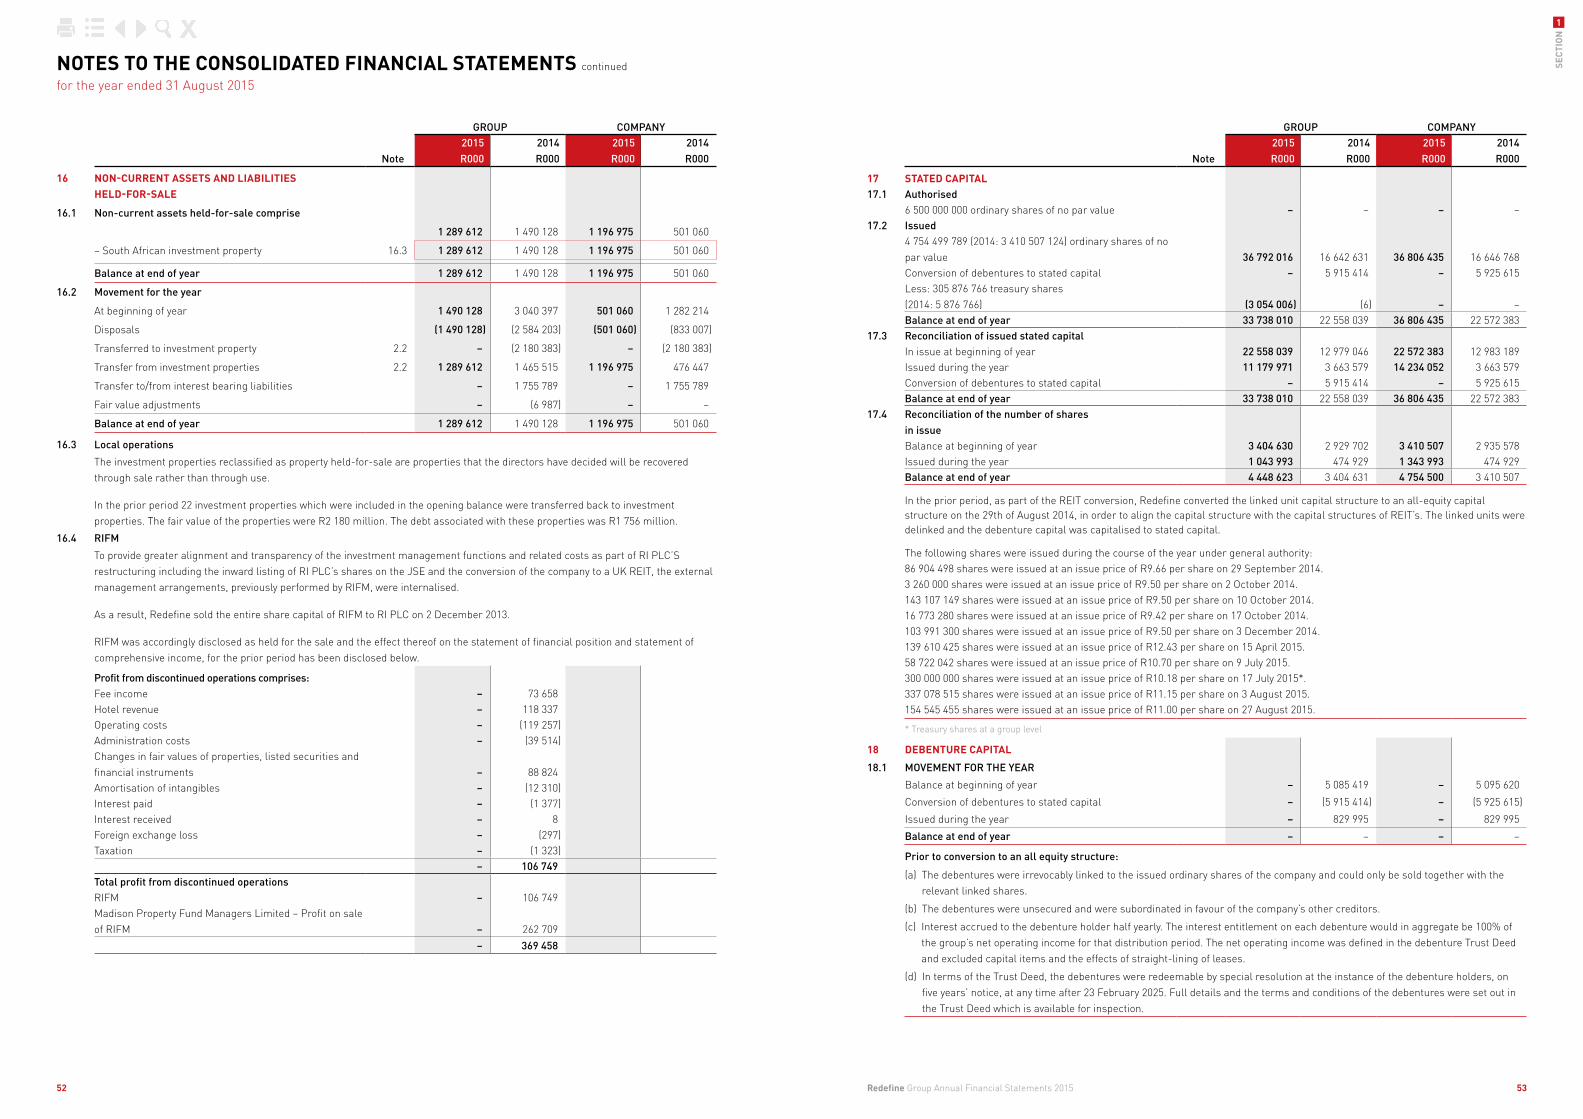
GROUP COMPANY
Note2015R000
2014R000
2015R000
2014R000
17 STATED CAPITAL 17.1 Authorised
6 500 000 000 ordinary shares of no par value – – – –17.2 Issued
4 754 499 789 (2014: 3 410 507 124) ordinary shares of no par value 36 792 016 16 642 631 36 806 435 16 646 768 Conversion of debentures to stated capital – 5 915 414 – 5 925 615Less: 305 876 766 treasury shares (2014: 5 876 766) (3 054 006) (6) – –Balance at end of year 33 738 010 22 558 039 36 806 435 22 572 383
17.3 Reconciliation of issued stated capitalIn issue at beginning of year 22 558 039 12 979 046 22 572 383 12 983 189 Issued during the year 11 179 971 3 663 579 14 234 052 3 663 579 Conversion of debentures to stated capital – 5 915 414 – 5 925 615Balance at end of year 33 738 010 22 558 039 36 806 435 22 572 383
17.4 Reconciliation of the number of shares in issueBalance at beginning of year 3 404 630 2 929 702 3 410 507 2 935 578Issued during the year 1 043 993 474 929 1 343 993 474 929 Balance at end of year 4 448 623 3 404 631 4 754 500 3 410 507
In the prior period, as part of the REIT conversion, Redefine converted the linked unit capital structure to an all-equity capital structure on the 29th of August 2014, in order to align the capital structure with the capital structures of REIT’s. The linked units were delinked and the debenture capital was capitalised to stated capital.
The following shares were issued during the course of the year under general authority:86 904 498 shares were issued at an issue price of R9.66 per share on 29 September 2014.3 260 000 shares were issued at an issue price of R9.50 per share on 2 October 2014.143 107 149 shares were issued at an issue price of R9.50 per share on 10 October 2014.16 773 280 shares were issued at an issue price of R9.42 per share on 17 October 2014.103 991 300 shares were issued at an issue price of R9.50 per share on 3 December 2014.139 610 425 shares were issued at an issue price of R12.43 per share on 15 April 2015.58 722 042 shares were issued at an issue price of R10.70 per share on 9 July 2015.300 000 000 shares were issued at an issue price of R10.18 per share on 17 July 2015*.337 078 515 shares were issued at an issue price of R11.15 per share on 3 August 2015.154 545 455 shares were issued at an issue price of R11.00 per share on 27 August 2015.
* Treasury shares at a group level
18 DEBENTURE CAPITAL
18.1 MOVEMENT FOR THE YEAR
Balance at beginning of year – 5 085 419 – 5 095 620
Conversion of debentures to stated capital – (5 915 414) – (5 925 615)
Issued during the year – 829 995 – 829 995
Balance at end of year – – – –
Prior to conversion to an all equity structure:
(a) The debentures were irrevocably linked to the issued ordinary shares of the company and could only be sold together with the relevant linked shares.
(b) The debentures were unsecured and were subordinated in favour of the company’s other creditors.
(c) Interest accrued to the debenture holder half yearly. The interest entitlement on each debenture would in aggregate be 100% of the group’s net operating income for that distribution period. The net operating income was defined in the debenture Trust Deed and excluded capital items and the effects of straight-lining of leases.
(d) In terms of the Trust Deed, the debentures were redeemable by special resolution at the instance of the debenture holders, on five years’ notice, at any time after 23 February 2025. Full details and the terms and conditions of the debentures were set out in the Trust Deed which is available for inspection.
GROUP COMPANY
Note2015R000
2014R000
2015R000
2014R000
16 NON-CURRENT ASSETS AND LIABILITIES HELD-FOR-SALE
16.1 Non-current assets held-for-sale comprise
1 289 612 1 490 128 1 196 975 501 060
– South African investment property 16.3 1 289 612 1 490 128 1 196 975 501 060
Balance at end of year 1 289 612 1 490 128 1 196 975 501 060
16.2 Movement for the year
At beginning of year 1 490 128 3 040 397 501 060 1 282 214
Disposals (1 490 128) (2 584 203) (501 060) (833 007)
Transferred to investment property 2.2 – (2 180 383) – (2 180 383)
Transfer from investment properties 2.2 1 289 612 1 465 515 1 196 975 476 447
Transfer to/from interest bearing liabilities – 1 755 789 – 1 755 789
Fair value adjustments – (6 987) – –
Balance at end of year 1 289 612 1 490 128 1 196 975 501 060
16.3 Local operations
The investment properties reclassified as property held-for-sale are properties that the directors have decided will be recovered through sale rather than through use.
In the prior period 22 investment properties which were included in the opening balance were transferred back to investment properties. The fair value of the properties were R2 180 million. The debt associated with these properties was R1 756 million.
16.4 RIFM
To provide greater alignment and transparency of the investment management functions and related costs as part of RI PLC’S restructuring including the inward listing of RI PLC’s shares on the JSE and the conversion of the company to a UK REIT, the external management arrangements, previously performed by RIFM, were internalised.
As a result, Redefine sold the entire share capital of RIFM to RI PLC on 2 December 2013.
RIFM was accordingly disclosed as held for the sale and the effect thereof on the statement of financial position and statement of comprehensive income, for the prior period has been disclosed below.
Profit from discontinued operations comprises:Fee income – 73 658 Hotel revenue – 118 337 Operating costs – (119 257) Administration costs – (39 514)Changes in fair values of properties, listed securities and financial instruments – 88 824 Amortisation of intangibles – (12 310) Interest paid – (1 377) Interest received – 8 Foreign exchange loss – (297) Taxation – (1 323)
– 106 749 Total profit from discontinued operationsRIFM – 106 749 Madison Property Fund Managers Limited – Profit on sale of RIFM – 262 709
– 369 458
NOTES TO THE CONSOLIDATED FINANCIAL STATEMENTS continued
for the year ended 31 August 2015
Redefine Group Annual Financial Statements 2015 53
SECT
ION
1
52
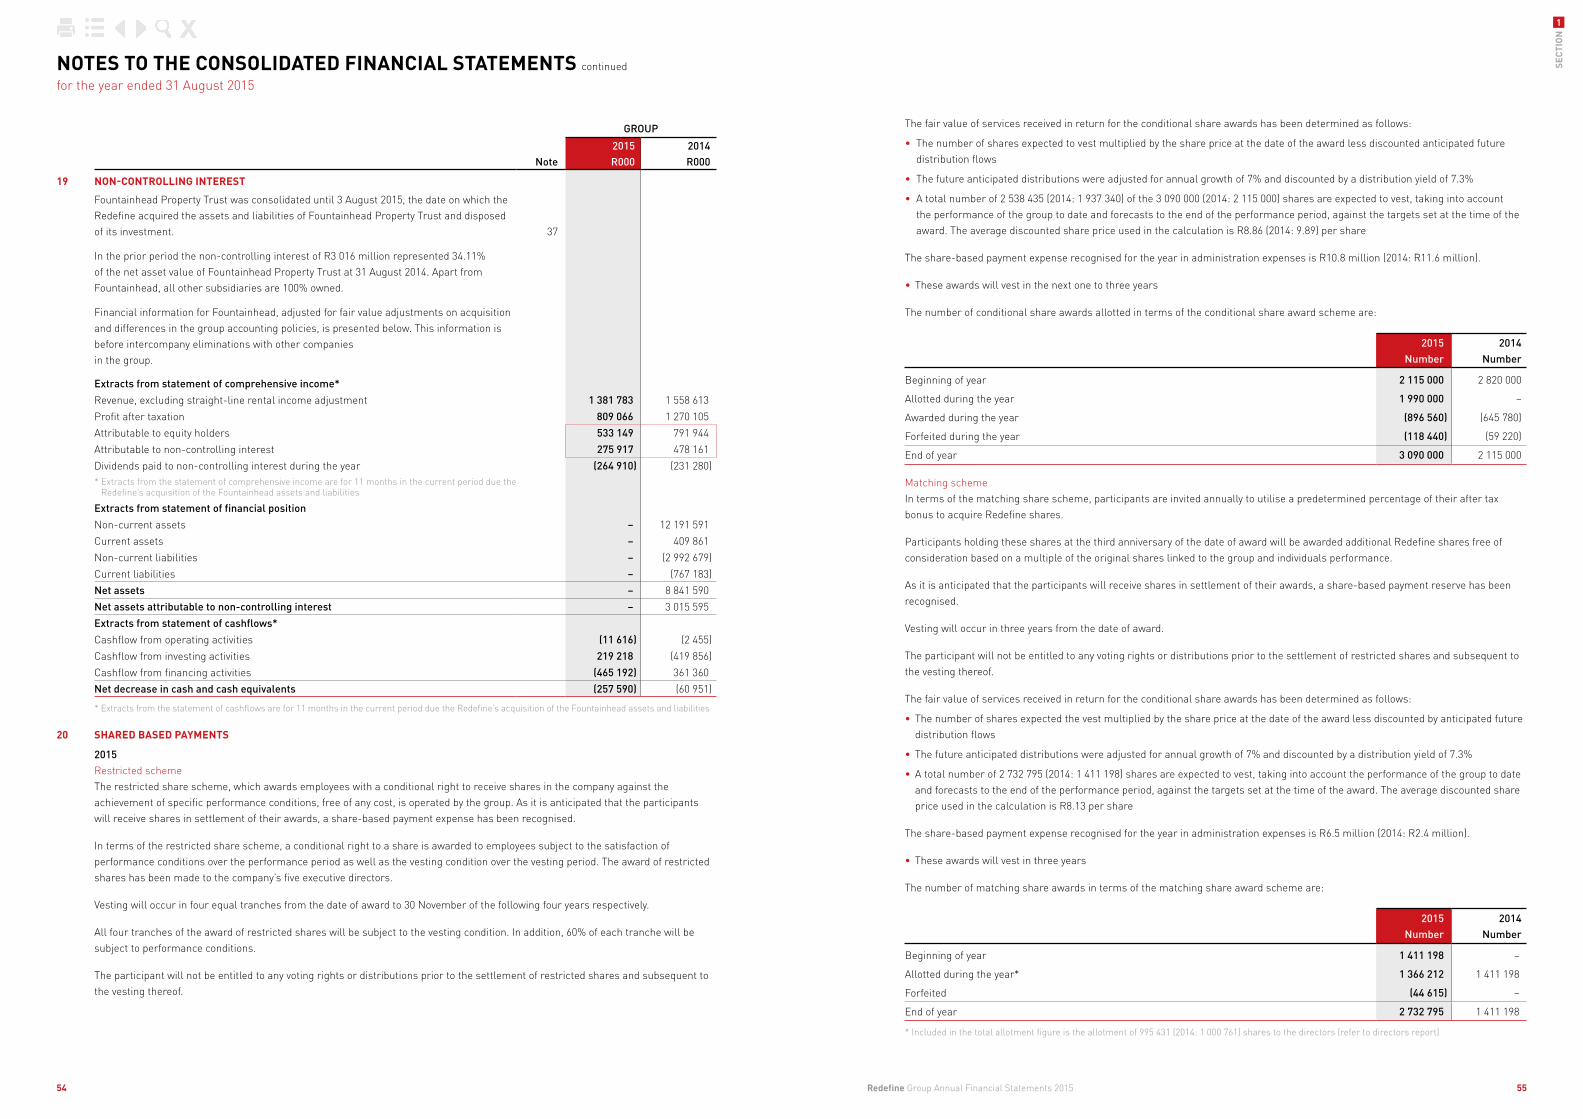
The fair value of services received in return for the conditional share awards has been determined as follows:
• The number of shares expected to vest multiplied by the share price at the date of the award less discounted anticipated future distribution flows
• The future anticipated distributions were adjusted for annual growth of 7% and discounted by a distribution yield of 7.3%
• A total number of 2 538 435 (2014: 1 937 340) of the 3 090 000 (2014: 2 115 000) shares are expected to vest, taking into account the performance of the group to date and forecasts to the end of the performance period, against the targets set at the time of the award. The average discounted share price used in the calculation is R8.86 (2014: 9.89) per share
The share-based payment expense recognised for the year in administration expenses is R10.8 million (2014: R11.6 million).
• These awards will vest in the next one to three years
The number of conditional share awards allotted in terms of the conditional share award scheme are:
2015Number
2014Number
Beginning of year 2 115 000 2 820 000
Allotted during the year 1 990 000 –
Awarded during the year (896 560) (645 780)
Forfeited during the year (118 440) (59 220)
End of year 3 090 000 2 115 000
Matching schemeIn terms of the matching share scheme, participants are invited annually to utilise a predetermined percentage of their after tax bonus to acquire Redefine shares.
Participants holding these shares at the third anniversary of the date of award will be awarded additional Redefine shares free of consideration based on a multiple of the original shares linked to the group and individuals performance.
As it is anticipated that the participants will receive shares in settlement of their awards, a share-based payment reserve has been recognised.
Vesting will occur in three years from the date of award.
The participant will not be entitled to any voting rights or distributions prior to the settlement of restricted shares and subsequent to the vesting thereof.
The fair value of services received in return for the conditional share awards has been determined as follows:
• The number of shares expected the vest multiplied by the share price at the date of the award less discounted by anticipated future distribution flows
• The future anticipated distributions were adjusted for annual growth of 7% and discounted by a distribution yield of 7.3%
• A total number of 2 732 795 (2014: 1 411 198) shares are expected to vest, taking into account the performance of the group to date and forecasts to the end of the performance period, against the targets set at the time of the award. The average discounted share price used in the calculation is R8.13 per share
The share-based payment expense recognised for the year in administration expenses is R6.5 million (2014: R2.4 million).
• These awards will vest in three years
The number of matching share awards in terms of the matching share award scheme are:
2015Number
2014Number
Beginning of year 1 411 198 –
Allotted during the year* 1 366 212 1 411 198
Forfeited (44 615) –
End of year 2 732 795 1 411 198
* Included in the total allotment figure is the allotment of 995 431 (2014: 1 000 761) shares to the directors (refer to directors report)
NOTES TO THE CONSOLIDATED FINANCIAL STATEMENTS continued
for the year ended 31 August 2015
GROUP
Note2015R000
2014R000
19 NON-CONTROLLING INTEREST
Fountainhead Property Trust was consolidated until 3 August 2015, the date on which the Redefine acquired the assets and liabilities of Fountainhead Property Trust and disposed of its investment. 37
In the prior period the non-controlling interest of R3 016 million represented 34.11% of the net asset value of Fountainhead Property Trust at 31 August 2014. Apart from Fountainhead, all other subsidiaries are 100% owned.
Financial information for Fountainhead, adjusted for fair value adjustments on acquisition and differences in the group accounting policies, is presented below. This information is before intercompany eliminations with other companies in the group.
Extracts from statement of comprehensive income*
Revenue, excluding straight-line rental income adjustment 1 381 783 1 558 613 Profit after taxation 809 066 1 270 105 Attributable to equity holders 533 149 791 944 Attributable to non-controlling interest 275 917 478 161 Dividends paid to non-controlling interest during the year (264 910) (231 280)* Extracts from the statement of comprehensive income are for 11 months in the current period due the
Redefine’s acquisition of the Fountainhead assets and liabilities
Extracts from statement of financial position
Non-current assets – 12 191 591 Current assets – 409 861 Non-current liabilities – (2 992 679)Current liabilities – (767 183)Net assets – 8 841 590 Net assets attributable to non-controlling interest – 3 015 595 Extracts from statement of cashflows*
Cashflow from operating activities (11 616) (2 455)Cashflow from investing activities 219 218 (419 856)Cashflow from financing activities (465 192) 361 360 Net decrease in cash and cash equivalents (257 590) (60 951)
* Extracts from the statement of cashflows are for 11 months in the current period due the Redefine’s acquisition of the Fountainhead assets and liabilities
20 SHARED BASED PAYMENTS
2015Restricted schemeThe restricted share scheme, which awards employees with a conditional right to receive shares in the company against the achievement of specific performance conditions, free of any cost, is operated by the group. As it is anticipated that the participants will receive shares in settlement of their awards, a share-based payment expense has been recognised.
In terms of the restricted share scheme, a conditional right to a share is awarded to employees subject to the satisfaction of performance conditions over the performance period as well as the vesting condition over the vesting period. The award of restricted shares has been made to the company’s five executive directors.
Vesting will occur in four equal tranches from the date of award to 30 November of the following four years respectively.
All four tranches of the award of restricted shares will be subject to the vesting condition. In addition, 60% of each tranche will be subject to performance conditions.
The participant will not be entitled to any voting rights or distributions prior to the settlement of restricted shares and subsequent to the vesting thereof.
Redefine Group Annual Financial Statements 2015 55
SECT
ION
1
54

GROUP COMPANY2015R000
2014R000
2015R000
2014R000
Capital repayment date Rate
Rand Merchant Bank 7 907 662 7 427 636 7 507 662 3 000 000
04-Dec-20 3mth JIBAR +1.7% 1 500 000 875 000 1 500 000 875 000
04-Sep-17 3 month JIBAR +1.85% 1 125 000 1 125 000 1 125 000 1 125 000
04-Oct-18 3mth JIBAR +1.7% 1 000 000 1 000 000 1 000 000 1 000 000
04-Dec-17 Prime less 1.7% 57 000 – 57 000 –
02-Apr-18 3mth JIBAR +1.7% 613 000 604 241 613 000 –
15-Aug-19 3mth JIBAR +1.57% 1 900 000 1 900 000 1 900 000 –
15-Aug-19 PRIME –1.73% 287 662 342 679 287 662 –
30-Nov-14 JIBAR +1.30% – 250 000 – –
04-Feb-19 JIBAR +1.61% – 225 000 – –
04-Feb-19 3mth JIBAR +1.61% 525 000 525 000 525 000 –
18-Dec-15 3mth JIBAR +2.05% – 334 649 – –
04-Feb-16 Prime less 1.5% – 62 214 – –
04-Dec-16 3mth JIBAR +1.75% – 18 000 – –
08-Aug-16 3mth JIBAR +2.05% – 30 000 – –
07-Oct-16 3mth JIBAR +1.60% – 74 939 – –
04-Feb-15 Fixed rate –8.83% – 60 000 – –
04-Feb-15 Prime less 1% – 914 – –
04-Dec-19 3mth JIBAR +1.75% 500 000 – 500 000 –
03-Sep-17 3mth JIBAR +1.50% 200 000 – – –
30-Oct-18 3mth JIBAR +1.70% 200 000 – – –
ABSA 500 000 1 431 000 500 000 1 431 000
31-Dec-14 1month JIBAR +1.95% – 931 000 – 931 000
01-Jul-20 3mth JIBAR +1.75% 500 000 500 000 500 000 500 000
Total secured variable rate loans – South Africa 19 017 859 15 784 010 17 382 859 11 263 918
Secured variable rate loans – foreign
Macquarie 17-Dec-16 BBA 3month + 3% 932 853 796 168 – –
Investec* 180 730 – – –
22-Jan-20 2.86% 46 695 – – –
06-Mar-20 3.07% 55 555 – – –
30-Apr-20 2.54% 43 956 – – –
31-Aug-20 4.5055% 34 524 – – –
Total secured variable rate loans – foreign 1 113 583 796 168 – –
Fixed deposits are held with Investec SA and provide security over foreign exchange loans held by Redefine Global Proprietary Limited.
In terms of the loan agreements Redefine is entitled to net settle the loans held by Redefine Global Proprietary Limited and as such the loans and deposits are offset and disclosed on a net basis at group level.
Loan Fixed
deposit Net
2 871 927 2 691 197 180 730
Investec Euro Loan 464 203 417 508 46 695
Investec GBP Loan 440 207 384 652 55 555
Investec EURO Loan 337 666 293 710 43 956
Investec AUD Loan 1 629 851 1 595 327 34 524
NOTES TO THE CONSOLIDATED FINANCIAL STATEMENTS continued
for the year ended 31 August 2015
GROUP COMPANY
Note2015R000
2014R000
2015R000
2014R000
21 INTEREST-BEARING LIABILTIES
Interest bearing borrowings consist of:
Bank loans 21.1 20 569 366 16 956 529 17 820 783 11 640 269
Bonds and commercial paper 21.3 3 013 000 2 800 000 3 013 000 2 800 000
Total interest bearing borrowings 23 582 366 19 756 529 20 833 783 14 440 269
Non-current interest bearing borrowings
Bank loans 19 863 140 13 316 324 17 114 557 9 199 603
Bonds and commercial paper 1 739 000 1 039 000 1 739 000 1 039 000
Total non-current borrowings 21 602 140 14 355 324 18 853 557 10 238 603
Current interest bearing borrowings
Bank loans 706 226 3 640 205 706 226 2 440 666
Bonds and commercial paper 1 274 000 1 761 000 1 274 000 1 761 000
Total current borrowings 1 980 226 5 401 205 1 980 226 4 201 666
GROUP COMPANY2015R000
2014R000
2015R000
2014R000
21.1 Bank loans
Secured variable rate loans – South AfricaCapital repayment date Rate
Nedbank 4 735 000 3 000 000 3 800 000 3 000 00030-Jun-18 3mth JIBAR +1.56% 245 000 – – –30-Jun-19 3mth JIBAR +1.70% 15 000 – – –20-Oct-18 3mth JIBAR +1.75% 25 000 – – –
26-May-19 3mth JIBAR +1.70% 500 000 – – –26-May-19 3mth JIBAR +1.70% 150 000 – – –31-Dec-19 3mth JIBAR +1.71% 800 000 – 800 000 –30-Aug-17 3mth JIBAR +1.58% 500 000 500 000 500 000 500 000 30-Aug-18 3mth JIBAR +1.61% 500 000 500 000 500 000 500 000 03-Jun-18 3mth JIBAR +1.67% 2 000 000 2 000 000 2 000 000 2 000 000
Standard bank 5 875 197 3 925 374 5 575 197 3 832 918 31-Mar-20 3mth JIBAR – 290 083 – 290 083 31-Mar-20 3mth JIBAR – 181 646 – 181 646 31-Mar-18 3mth JIBAR +1.67% 393 000 390 400 393 000 390 400 31-Mar-20 Prime less 1.8% 277 800 300 000 277 800 300 000 31-Mar-20 3mth JIBAR – 200 000 – 200 000 31-Mar-20 3mth JIBAR +1.57% 2 429 397 500 000 2 429 397 500 000 31-Mar-20 3mth JIBAR – 451 249 – 451 249 31-Mar-20 3mth JIBAR – 584 540 – 584 540 31-Mar-20 3mth JIBAR – 220 000 – 220 000 30-Sep-17 3mth JIBAR +1.61% 150 000 300 000 150 000 300 000 30-Sep-17 Prime less 1.75% – 75 000 – 75 000 30-Sep-18 3mth JIBAR +1.67% 150 000 300 000 150 000 300 000 30-Sep-18 Prime less 1.70% – 40 000 – 40 000 31-Mar-20 3mth JIBAR 100 000 – 100 000 –31-May-15 3mth JIBAR – 92 456 – –31-Oct-19 3mth JIBAR +1.63% 575 000 – 575 000 –31-Oct-19 3mth JIBAR +1.63% 300 000 – 300 000 –31-Oct-19 3mth JIBAR +1.67% 400 000 – 400 000 –30-Sep-17 3mth JIBAR +1.61% 150 000 – 150 000 –30-Sep-18 3mth JIBAR +1.67% 150 000 – 150 000 –01-Jun-19 3mth JIBAR +1.69% 500 000 – 500 000 –30-Jun-17 3mth JIBAR +1.48% 270 000 – – –30-Jun-18 3mth JIBAR +1.73% 30 000 – – –
Redefine Group Annual Financial Statements 2015 57
SECT
ION
1
56

NOTES TO THE CONSOLIDATED FINANCIAL STATEMENTS continued
for the year ended 31 August 2015
GROUP COMPANY2015R000
2014R000
2015R000
2014R000
22 INTEREST RATE SWAPS
South Africa
Nominal value Maturity Rate %
Interest rate swap agreements 230 000 000 8-Oct-18 10.48 21 764 30 109 21 764 30 109
413 795 000 12-Nov-18 8.86 17 251 27 150 17 251 27 150 230 000 000 12-Aug-20 7.72 1 748 5 887 1 748 5 887 295 000 000 12-Feb-18 7.70 4 857 8 556 4 857 8 556 140 000 000 11-Nov-18 10.64 1 488 3 229 1 488 3 229 270 000 000 12-Aug-20 7.72 3 505 7 344 3 505 7 344 355 000 000 14-Feb-18 7.70 13 148 18 396 13 148 18 396 190 000 000 12-May-16 7.58 89 5 056 89 5 056
85 000 000 5-Dec-15 6.84 4 463 8 834 4 463 8 834 215 000 000 7-Dec-15 6.84 1 527 3 443 1 527 3 443 100 000 000 16-Feb-17 6.94 164 533 164 533 250 000 000 1-Jun-16 8.06 537 1 686 537 1 686 320 000 000 20-Feb-18 6.59 – 249 – 249 200 000 000 31-Aug-17 6.56 203 1 180 203 1 180 500 000 000 9-Apr-18 6.57 – (438) – (438) 300 000 000 21-Aug-17 8.04 3 162 6 834 3 162 6 834 350 000 000 21-Aug-17 8.10 (4 658) (4 253) (4 658) (4 253) 150 000 000 30-Aug-16 7.86 (1 769) (1 423) (1 769) (1 423) 750 000 000 5-Apr-18 6.66 (8 076) (7 639) (8 076) (7 639) 500 000 000 17-Oct-17 6.60 5 426 9 676 5 426 9 676 250 000 000 21-Nov-16 6.59 (5 843) (5 782) (5 843) (5 782) 500 000 000 20-Nov-17 7.00 6 795 11 863 6 795 11 863 250 000 000 20-Nov-19 7.57 1 689 3 443 1 689 3 443 200 000 000 27-Nov-17 7.00 (9 960) (9 619) (9 960) (9 619) 200 000 000 25-Nov-19 7.56 (4 937) (3 544) (4 937) (3 544) 200 000 000 8-Apr-19 7.68 (583) (456) (583) (456) 200 000 000 13-May-19 7.52 (1 541) 1 453 (1 541) 1 453 200 000 000 15-Aug-19 7.40 (731) 3 387 (731) 3 387 400 000 000 27-Nov-17 7.10 (659) 528 (659) 528 400 000 000 28-Jan-19 8.05 (705) 2 560 (705) 2 560 400 000 000 28-Jan-19 8.05 1 367 4 588 1 367 4 588 500 000 000 4-Feb-19 8.35 (113) 2 839 (113) 2 839 500 000 000 4-Feb-19 8.35 (1 348) 1 570 (1 348) 1 570 300 000 000 5-Feb-19 8.20 (320) 2 265 (320) 2 265 100 000 000 18-Jul-19 7.44 (6 310) (9 017) (6 310) (9 017) 750 000 000 15-Oct-19 7.40 (6 310) (9 017) (6 310) (9 017)
675 000 000 18-Nov-19 7.25 (6 838) (10 052) (6 838) (10 052) 600 000 000 23-Jul-18 6.50 (5 864) (7 792) (5 864) (7 792) 300 000 000 9-Dec-19 6.86 (3 858) (5 062) (3 858) (5 062) 525 000 000 27-Nov-19 6.98 (327) 1 133 (327) 1 133 500 000 000 22-May-18 5.87 (5 368) – (5 368) – 350 000 000 22-May-18 6.47 (9 765) – (9 765) – 500 000 000 22-May-20 7.06 (13 144) – (13 144) – 300 000 000 19-Sep-16 6.58 (9 270) – (9 270) – 300 000 000 17-Oct-16 6.27 (12 876) – (12 876) – 500 000 000 9-Apr-19 7.79 (7 095) – (7 095) –
50 000 000 30-Oct-15 5.73 (13 497) – (13 497) – 50 000 000 31-Oct-16 6.06 (17 578) – (17 578) – 50 000 000 30-Oct-17 6.36 (1 527) – (1 527) –
50 000 000 30-Oct-15 5.56 (163) – (163) –
GROUP COMPANY2015R000
2014R000
2015R000
2014R000
21 INTEREST-BEARING LIABILTIES continued
Unsecured variable rate loans – South Africa
Capital repayment date Rate
Standard finance isle of man 437 924 376 351 437 924 376 351
31-Mar-20 LIBOR +3.45% 156 698 134 666 156 698 134 666 31-May-16 LIBOR +4.54% 281 226 241 685 281 226 241 685
Total unsecured variable rate loans – South Africa 437 924 376 351 437 924 376 351 Total bank loans 20 569 366 16 956 529 17 820 783 11 640 269
21.2 Other loans
Vendor Loans^ 22 June 2015 and 3 May 2017 Zero interest – (26 077) – –
Ironwood Trustees# 22 June 2015 and 3 May 2017 8.95% – 26 077 – –
– – – –
^ In the prior period the loans had a nominal value of R43 414 386 have been recognised for accounting purposes at the discounted present value have been netted off against loans receivable
# The loans were receivable from Ironwood Trustees Proprietary Limited
The loans were settled during the current period.21.3 Bonds and commercial paper
Bonds 1 739 000 1 539 000 1 739 000 1 539 000 3 year 30-Mar-15 3mth JIBAR +1.40% – 500 000 – 500 000 3 year 27-Nov-17 3mth JIBAR +1.60% 199 000 – 199 000 –5 year 27-Nov-19 3mth JIBAR +2.0% 501 000 – 501 000 –5 year 11-Mar-18 3mth JIBAR +1.60% 300 000 300 000 300 000 300 000 5 year 11-Mar-18 3mth JIBAR +1.60% 164 000 164 000 164 000 164 000 5 year 11-Mar-18 3mth JIBAR +1.60% 150 000 150 000 150 000 150 000 3 year 22-Mar-16 3mth JIBAR +1.60% 425 000 425 000 425 000 425 000
Commercial paper 1 274 000 1 261 000 1 274 000 1 261 000 6 month 25-Nov-15 3mth JIBAR +0.76% 449 000 – 449 000 –12 month 25-May-16 3mth JIBAR +1.05% 35 000 – 35 000 –12 month 27-Jul-16 3mth JIBAR +1.05% 100 000 – 100 000 –12 month 25-Nov-15 3mth JIBAR +0.90% 109 000 – 109 000 –6 month 28-Sep-15 6mth JIBAR +0.35% 305 000 – 305 000 –
12 month 24-Mar-16 3mth JIBAR +1.1% 276 000 – 276 000 –3 month 25-Nov-14 3mth JIBAR +0.27% – 579 000 – 579 000 3 month 24-Mar-15 3mth JIBAR +0.65% – 682 000 – 682 000
Total bonds and commercial paper 3 013 000 2 800 000 3 013 000 2 800 000
The average all-in interest rate in respect of total group borrowings is 8.35% (2014: 8.04%).
Total group borrowings (net of cash on hand) represent 36.8% (2014:38.0%) of the value of property portfolio (which includes investment properties, listed securities, loans receivable and interests in associates).
Group interest bearing borrowings have been secured by mortgage loans over investment property and pledges over listed securities to the value of R37.4 billion (2014: R33.4 billion).
Certain loans are repayable in the next 12 months in terms of the original loan agreements and have been disclosed as current.
During the year Redefine restructured and renegotiated certain loans, to optimise funding costs and maturity profiles.
Redefine Group Annual Financial Statements 2015 59
SECT
ION
1
58
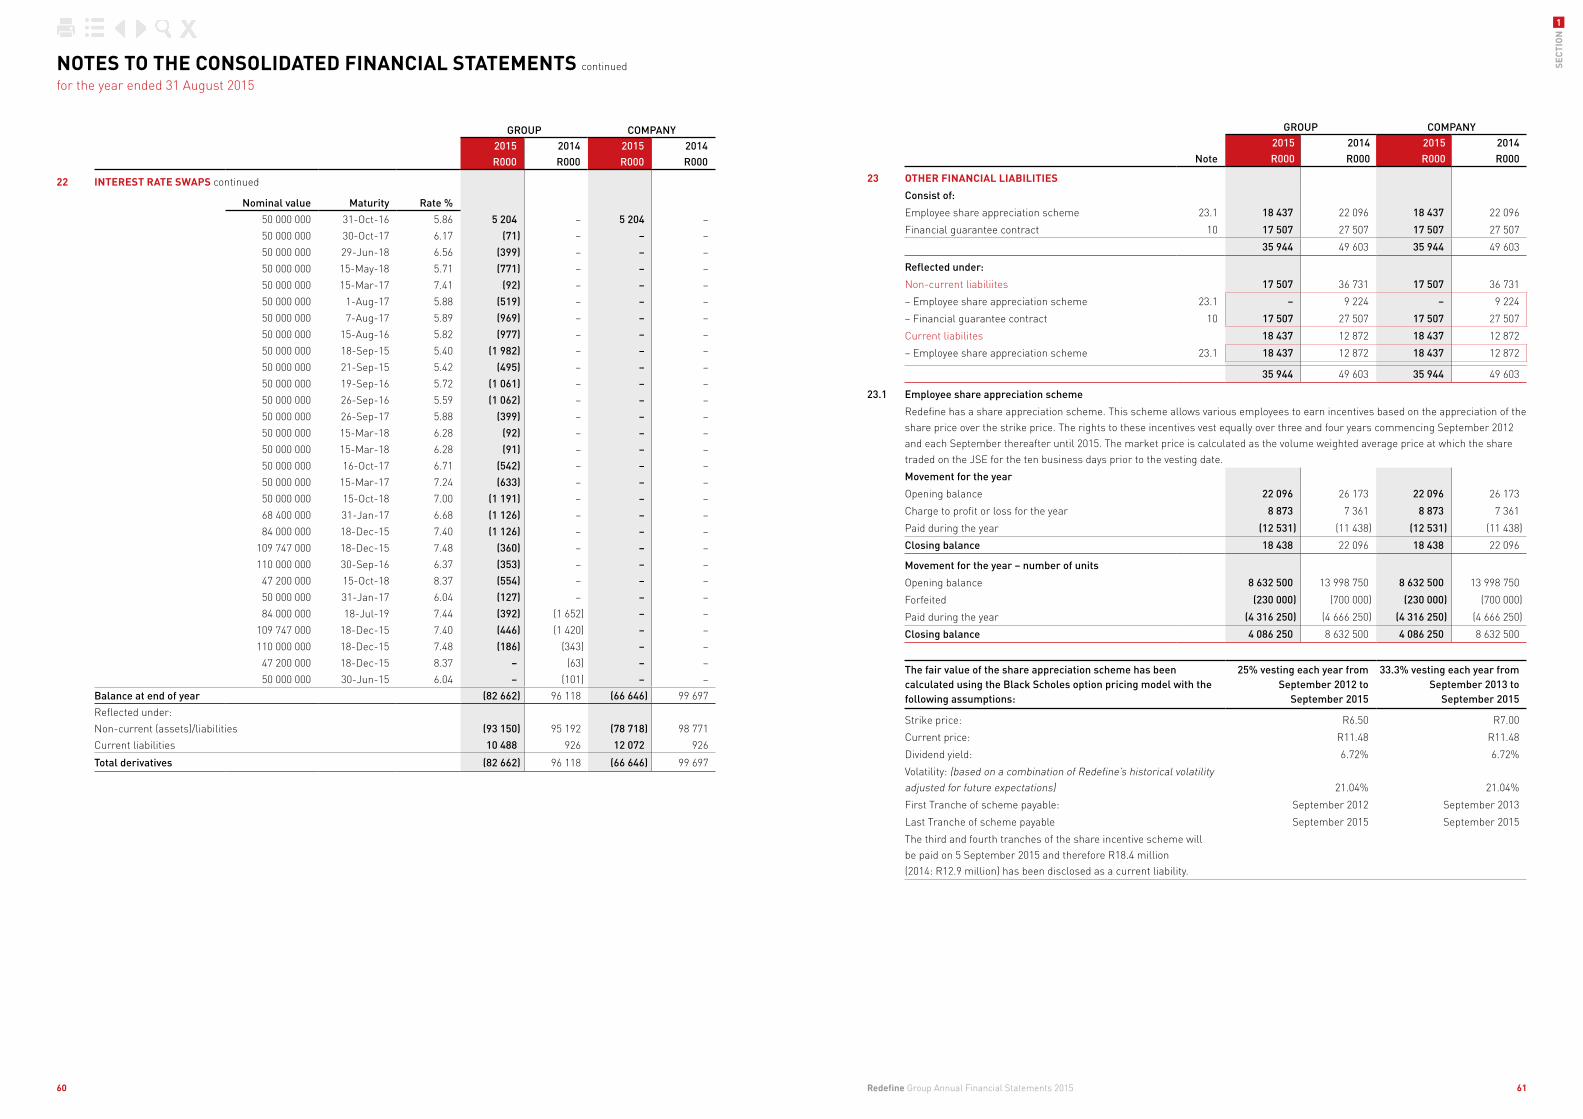
GROUP COMPANY
Note2015R000
2014R000
2015R000
2014R000
23 OTHER FINANCIAL LIABILITIES
Consist of:
Employee share appreciation scheme 23.1 18 437 22 096 18 437 22 096
Financial guarantee contract 10 17 507 27 507 17 507 27 507
35 944 49 603 35 944 49 603
Reflected under:
Non-current liabiliites 17 507 36 731 17 507 36 731
– Employee share appreciation scheme 23.1 – 9 224 – 9 224
– Financial guarantee contract 10 17 507 27 507 17 507 27 507
Current liabilites 18 437 12 872 18 437 12 872
– Employee share appreciation scheme 23.1 18 437 12 872 18 437 12 872
35 944 49 603 35 944 49 603
23.1 Employee share appreciation scheme
Redefine has a share appreciation scheme. This scheme allows various employees to earn incentives based on the appreciation of the share price over the strike price. The rights to these incentives vest equally over three and four years commencing September 2012 and each September thereafter until 2015. The market price is calculated as the volume weighted average price at which the share traded on the JSE for the ten business days prior to the vesting date.
Movement for the year
Opening balance 22 096 26 173 22 096 26 173
Charge to profit or loss for the year 8 873 7 361 8 873 7 361
Paid during the year (12 531) (11 438) (12 531) (11 438)
Closing balance 18 438 22 096 18 438 22 096
Movement for the year – number of units
Opening balance 8 632 500 13 998 750 8 632 500 13 998 750
Forfeited (230 000) (700 000) (230 000) (700 000)
Paid during the year (4 316 250) (4 666 250) (4 316 250) (4 666 250)
Closing balance 4 086 250 8 632 500 4 086 250 8 632 500
The fair value of the share appreciation scheme has been calculated using the Black Scholes option pricing model with the following assumptions:
25% vesting each year from September 2012 to
September 2015
33.3% vesting each year from September 2013 to
September 2015
Strike price: R6.50 R7.00
Current price: R11.48 R11.48
Dividend yield: 6.72% 6.72%
Volatility: (based on a combination of Redefine’s historical volatility adjusted for future expectations) 21.04% 21.04%
First Tranche of scheme payable: September 2012 September 2013
Last Tranche of scheme payable September 2015 September 2015
The third and fourth tranches of the share incentive scheme will be paid on 5 September 2015 and therefore R18.4 million (2014: R12.9 million) has been disclosed as a current liability.
GROUP COMPANY2015R000
2014R000
2015R000
2014R000
22 INTEREST RATE SWAPS continued
Nominal value Maturity Rate %
50 000 000 31-Oct-16 5.86 5 204 – 5 204 – 50 000 000 30-Oct-17 6.17 (71) – – – 50 000 000 29-Jun-18 6.56 (399) – – –
50 000 000 15-May-18 5.71 (771) – – – 50 000 000 15-Mar-17 7.41 (92) – – –
50 000 000 1-Aug-17 5.88 (519) – – – 50 000 000 7-Aug-17 5.89 (969) – – – 50 000 000 15-Aug-16 5.82 (977) – – – 50 000 000 18-Sep-15 5.40 (1 982) – – – 50 000 000 21-Sep-15 5.42 (495) – – – 50 000 000 19-Sep-16 5.72 (1 061) – – – 50 000 000 26-Sep-16 5.59 (1 062) – – – 50 000 000 26-Sep-17 5.88 (399) – – – 50 000 000 15-Mar-18 6.28 (92) – – – 50 000 000 15-Mar-18 6.28 (91) – – – 50 000 000 16-Oct-17 6.71 (542) – – – 50 000 000 15-Mar-17 7.24 (633) – – – 50 000 000 15-Oct-18 7.00 (1 191) – – – 68 400 000 31-Jan-17 6.68 (1 126) – – – 84 000 000 18-Dec-15 7.40 (1 126) – – –
109 747 000 18-Dec-15 7.48 (360) – – – 110 000 000 30-Sep-16 6.37 (353) – – –
47 200 000 15-Oct-18 8.37 (554) – – – 50 000 000 31-Jan-17 6.04 (127) – – – 84 000 000 18-Jul-19 7.44 (392) (1 652) – –
109 747 000 18-Dec-15 7.40 (446) (1 420) – – 110 000 000 18-Dec-15 7.48 (186) (343) – –
47 200 000 18-Dec-15 8.37 – (63) – – 50 000 000 30-Jun-15 6.04 – (101) – –
Balance at end of year (82 662) 96 118 (66 646) 99 697 Reflected under:Non-current (assets)/liabilities (93 150) 95 192 (78 718) 98 771 Current liabilities 10 488 926 12 072 926
Total derivatives (82 662) 96 118 (66 646) 99 697
NOTES TO THE CONSOLIDATED FINANCIAL STATEMENTS continued
for the year ended 31 August 2015
Redefine Group Annual Financial Statements 2015 61
SECT
ION
1
60

GROUP COMPANY
Note2015R000
2014R000
2015R000
2014R000
26 NET OPERATING INCOME
Net operating income includes the following charges:
Amortisation and depreciation 77 684 76 376 16 483 15 249
Auditor’s remuneration 3 603 4 910 2 995 3 815
– External auditor – audit fees 3 275 3 479 2 667 2 384
– External auditor – non-audit fees 328 1 431 328 1 431
Asset management fees – 1 786 – –
Staff costs 128 837 108 235 100 487 83 436
Defined contribution fund 9 094 7 608 7 843 6 216
Property management fees 35 754 27 718 24 918 24 583
Valuation fees paid to third parties 5 170 3 314 5 170 1 879
Share based payment expense 17 291 14 030 17 291 14 030
Directors emoluments (refer to directors’ report page 11) 43 598 35 563 43 598 35 563
Share appreciation rights expense 23 8 873 7 361 8 873 7 361
Trading property cost of sales 24 888 4 238 24 888 4 238
Internal audit fees 329 642 – –
27 CHANGES IN FAIR VALUES OF PROPERTIES, LISTED SECURITIES AND FINANCIAL INSTRUMENTS
Property portfolio 1 935 227 1 158 864 1 437 437 507 173
– Realised 7 171 (15 857) 13 706 (13 363)
– Unrealised 1 928 056 1 174 721 1 423 731 520 536
Listed securities 160 774 296 647 198 252 93 783
– Realised – 636 794 – 568 615
– Unrealised 160 774 (340 147) 198 252 (474 832)
Interest rate swaps – mark to market 143 107 (128 495) 133 021 (73 103)
Deemed profit on disposal of investment in associate – 734 568 – 990 723
Loss on sale of subsidiary – (10 585) – (21 764)
Profit on disposal of unlisted investment – 246 – –
Other 3 252 – – –
Realised reserves on acquisition of Fountainhead assets and liabilities – – 417 489 –
2 242 360 2 051 245 2 186 199 1 496 812
28 INTEREST PAID
Interest paid on interest bearing borrowings (1 683 064) (1 457 159) (1 340 538) (1 157 741)
(1 683 064) (1 457 159) (1 340 538) (1 157 741)
29 INTEREST RECEIVED
Interest received on cash invested 80 056 30 507 53 504 2 799
Vendor loans 217 335 126 586 114 742 98 737
Other 8 838 2 298 8 491 2 298
Interest received from subsidiaries – – 216 862 221 581
306 229 159 391 393 599 325 415
30 FOREIGN EXCHANGE LOSS
Foreign exchange loss (223 072) (13 638) (83 107) (34 200)
NOTES TO THE CONSOLIDATED FINANCIAL STATEMENTS continued
for the year ended 31 August 2015
GROUP COMPANY
Note2015R000
2014R000
2015R000
2014R000
24 DEFERRED TAXATION
Arising on:
Revaluation of listed securities investments 13 509 28 588 1 285 783
Other timing differences 263 132 484 186 135 769 115 000
Assessed loss (1 722) (2 776) – –
274 919 509 998 137 054 115 783
At the beginning of the year 509 998 589 524 115 783 222 491
Acquired through business combination 36 9 346 (102) – –
Change in the capital gains tax inclusion rate (429) – – –
Deferred capital gains tax (15 154) (57 627) 503 (84 383)
Other timing differences (230 083) (24 160) 20 768 (22 325)
Assessed loss 1 241 2 363 – –
Balance at end of year 274 919 509 998 137 054 115 783
Redefine’s application to the JSE Limited for REIT status was approved on 5 July 2013. The conversion to a REIT was effective 1 September 2013.
IAS 12 Income taxes (amended) requires the sale rate to be applied, unless rebutted, when calculating deferred tax on the fair value adjustments on investment property. After the conversion to a REIT, capital gains taxation is no longer applicable on the sale of investment property in terms of section 25BB of the Income Tax Act. The deferred tax rate applied to investment property at the sale rate will therefore be 0%. Consequently, no deferred tax was raised on the fair value adjustments on investment property.
In addition, deferred tax is no longer calculated on the straight-line rental income accrual as the rental accrual will form part of the group’s distributions in the future. Given the conversion to a REIT, such distributions are fully deductible for tax purposes and hence no tax liability will arise on straight-line rental income accruals.
Allowances relating to immovable property can no longer be claimed and if a REIT sells immovable property, the allowances claimed in previous years will be recouped. A deferred tax liability was raised in this respect.
GROUP COMPANY
Note2015R000
2014R000
2015R000
2014R000
25 TRADE AND OTHER PAYABLES
Trade payables 42 631 60 375 44 663 55 774
Accrued expenses 411 654 322 066 354 147 249 993
Tenant deposits 168 267 138 026 134 701 96 584
Tenant receipts paid in advance 128 818 123 578 109 944 87 578
Municipal expenses 267 905 250 416 237 403 179 636
VAT 14 731 8 369 23 408 15 699
Sundry creditors 72 224 41 399 59 003 42 047
Creditors for listed securities purchased – 233 883 – –
Subsidiary distribution payable to non-controlling interests – 116 195 – –
Creditors for investment property sold* – – 381 861 –
Balance at end of year 1 106 230 1 294 307 1 345 130 727 311
* Included in trade and other payables is an amount received in advance for the disposal of an undivided share in industrial land acquired during the year. On a group basis this amount has been offset against the land held by the underlying subsidiary to give effect to the economic substance of the transaction
Redefine Group Annual Financial Statements 2015 63
SECT
ION
1
62
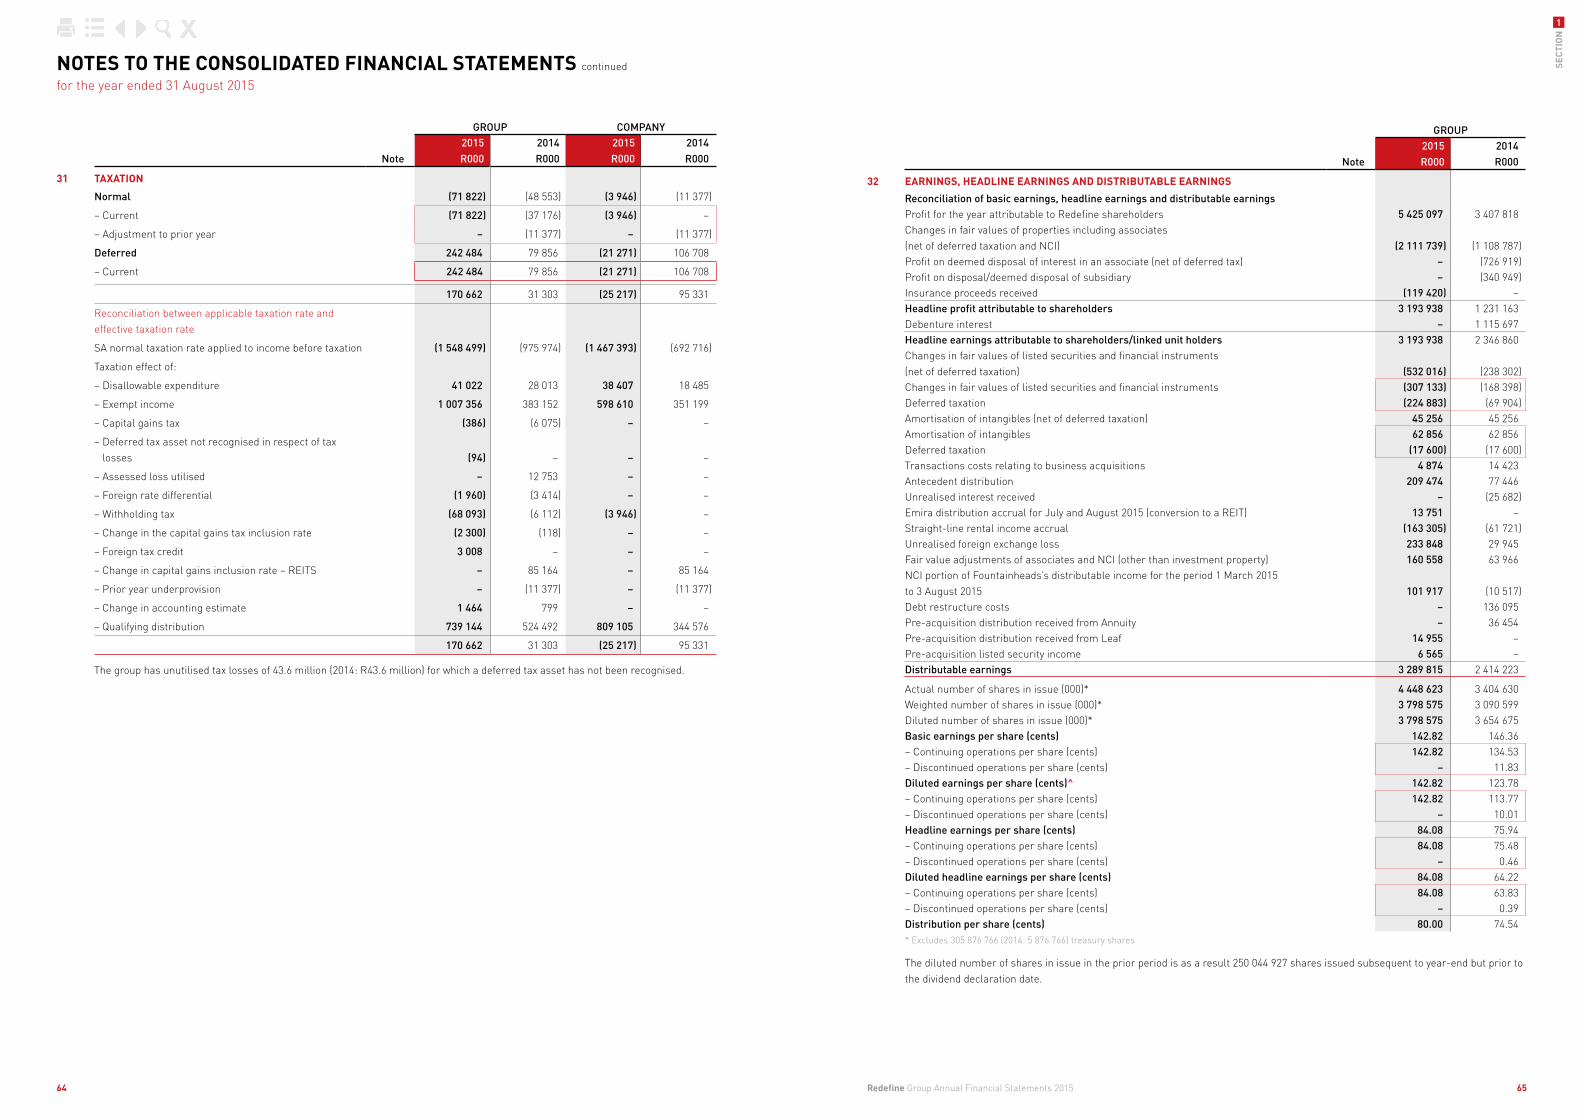
GROUP
Note2015R000
2014R000
32 EARNINGS, HEADLINE EARNINGS AND DISTRIBUTABLE EARNINGS
Reconciliation of basic earnings, headline earnings and distributable earningsProfit for the year attributable to Redefine shareholders 5 425 097 3 407 818 Changes in fair values of properties including associates (net of deferred taxation and NCI) (2 111 739) (1 108 787)Profit on deemed disposal of interest in an associate (net of deferred tax) – (726 919)Profit on disposal/deemed disposal of subsidiary – (340 949)Insurance proceeds received (119 420) –Headline profit attributable to shareholders 3 193 938 1 231 163 Debenture interest – 1 115 697 Headline earnings attributable to shareholders/linked unit holders 3 193 938 2 346 860 Changes in fair values of listed securities and financial instruments (net of deferred taxation) (532 016) (238 302)Changes in fair values of listed securities and financial instruments (307 133) (168 398)Deferred taxation (224 883) (69 904)Amortisation of intangibles (net of deferred taxation) 45 256 45 256 Amortisation of intangibles 62 856 62 856 Deferred taxation (17 600) (17 600)Transactions costs relating to business acquisitions 4 874 14 423 Antecedent distribution 209 474 77 446 Unrealised interest received – (25 682)Emira distribution accrual for July and August 2015 (conversion to a REIT) 13 751 –Straight-line rental income accrual (163 305) (61 721)Unrealised foreign exchange loss 233 848 29 945 Fair value adjustments of associates and NCI (other than investment property) 160 558 63 966 NCI portion of Fountainheads’s distributable income for the period 1 March 2015 to 3 August 2015 101 917 (10 517)Debt restructure costs – 136 095 Pre-acquisition distribution received from Annuity – 36 454 Pre-acquisition distribution received from Leaf 14 955 –Pre-acquisition listed security income 6 565 –Distributable earnings 3 289 815 2 414 223
Actual number of shares in issue (000)* 4 448 623 3 404 630 Weighted number of shares in issue (000)* 3 798 575 3 090 599 Diluted number of shares in issue (000)* 3 798 575 3 654 675 Basic earnings per share (cents) 142.82 146.36 – Continuing operations per share (cents) 142.82 134.53 – Discontinued operations per share (cents) – 11.83 Diluted earnings per share (cents)^ 142.82 123.78 – Continuing operations per share (cents) 142.82 113.77 – Discontinued operations per share (cents) – 10.01 Headline earnings per share (cents) 84.08 75.94 – Continuing operations per share (cents) 84.08 75.48 – Discontinued operations per share (cents) – 0.46 Diluted headline earnings per share (cents) 84.08 64.22 – Continuing operations per share (cents) 84.08 63.83 – Discontinued operations per share (cents) – 0.39 Distribution per share (cents) 80.00 74.54 * Excludes 305 876 766 (2014: 5 876 766) treasury shares
The diluted number of shares in issue in the prior period is as a result 250 044 927 shares issued subsequent to year-end but prior to the dividend declaration date.
GROUP COMPANY
Note2015R000
2014R000
2015R000
2014R000
31 TAXATION
Normal (71 822) (48 553) (3 946) (11 377)
– Current (71 822) (37 176) (3 946) –
– Adjustment to prior year – (11 377) – (11 377)
Deferred 242 484 79 856 (21 271) 106 708
– Current 242 484 79 856 (21 271) 106 708
170 662 31 303 (25 217) 95 331
Reconciliation between applicable taxation rate and effective taxation rate
SA normal taxation rate applied to income before taxation (1 548 499) (975 974) (1 467 393) (692 716)
Taxation effect of:
– Disallowable expenditure 41 022 28 013 38 407 18 485
– Exempt income 1 007 356 383 152 598 610 351 199
– Capital gains tax (386) (6 075) – –
– Deferred tax asset not recognised in respect of tax losses (94) – – –
– Assessed loss utilised – 12 753 – –
– Foreign rate differential (1 960) (3 414) – –
– Withholding tax (68 093) (6 112) (3 946) –
– Change in the capital gains tax inclusion rate (2 300) (118) – –
– Foreign tax credit 3 008 – – –
– Change in capital gains inclusion rate – REITS – 85 164 – 85 164
– Prior year underprovision – (11 377) – (11 377)
– Change in accounting estimate 1 464 799 – –
– Qualifying distribution 739 144 524 492 809 105 344 576
170 662 31 303 (25 217) 95 331
The group has unutilised tax losses of 43.6 million (2014: R43.6 million) for which a deferred tax asset has not been recognised.
NOTES TO THE CONSOLIDATED FINANCIAL STATEMENTS continued
for the year ended 31 August 2015
Redefine Group Annual Financial Statements 2015 65
SECT
ION
1
64
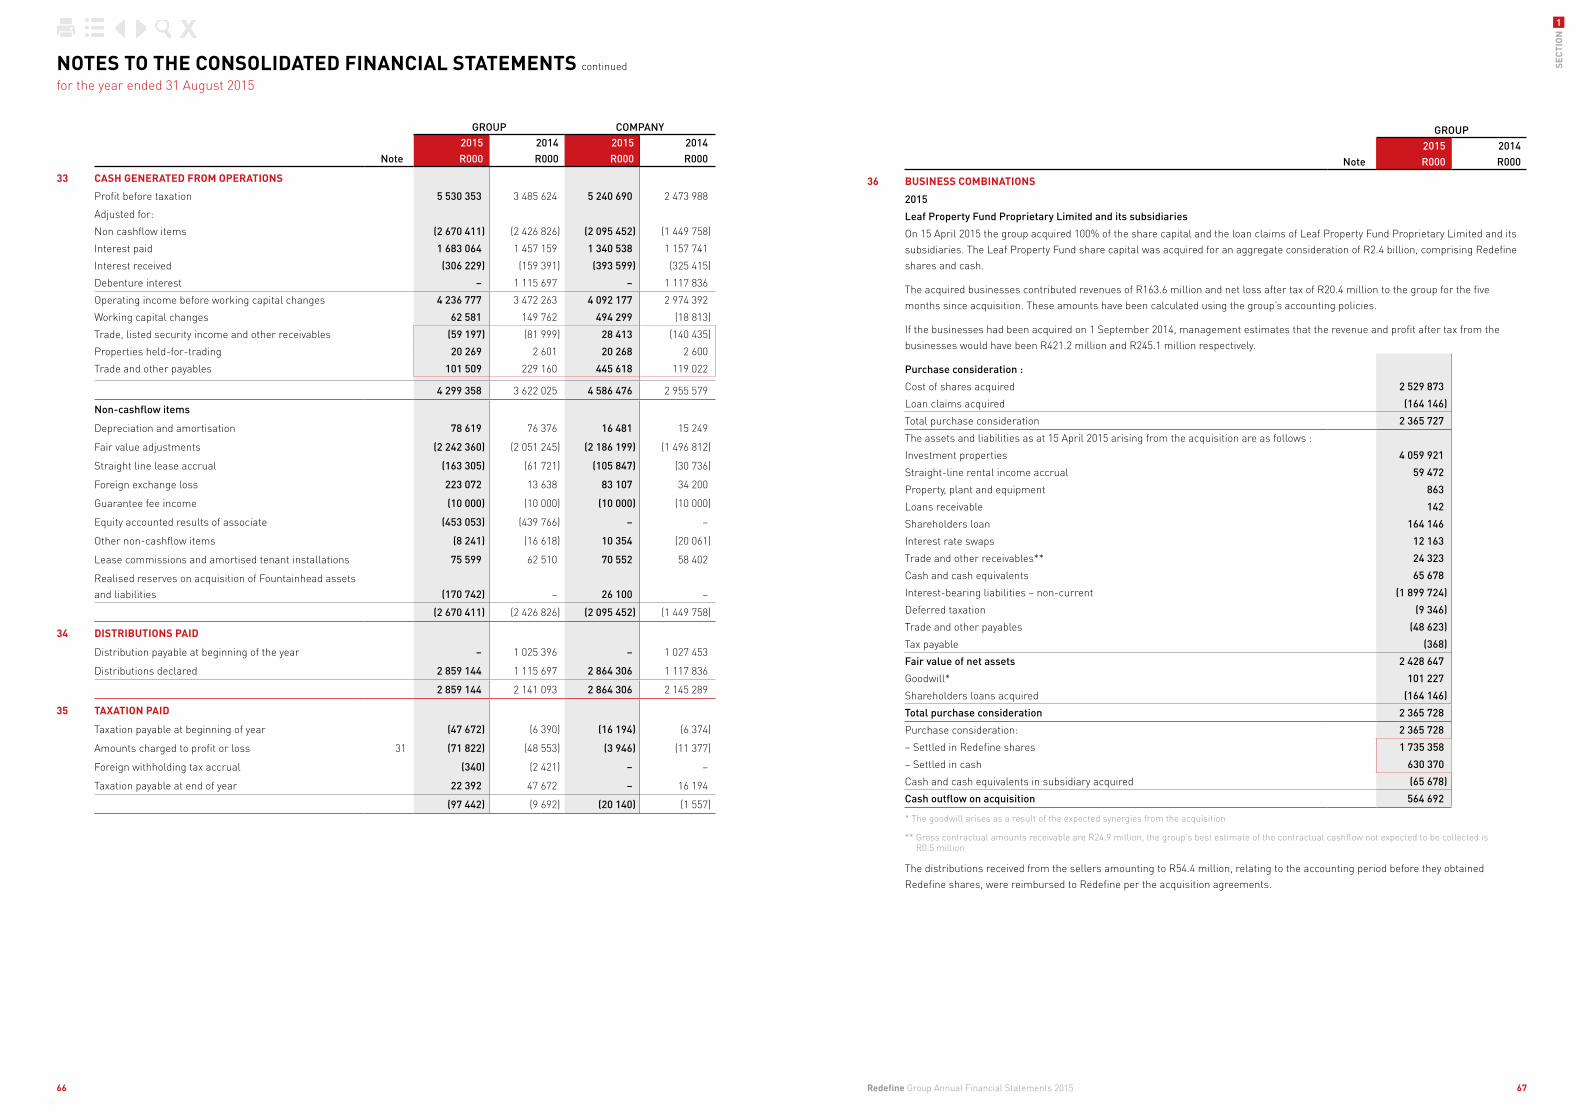
GROUP
Note2015R000
2014R000
36 BUSINESS COMBINATIONS
2015
Leaf Property Fund Proprietary Limited and its subsidiaries
On 15 April 2015 the group acquired 100% of the share capital and the loan claims of Leaf Property Fund Proprietary Limited and its subsidiaries. The Leaf Property Fund share capital was acquired for an aggregate consideration of R2.4 billion, comprising Redefine shares and cash.
The acquired businesses contributed revenues of R163.6 million and net loss after tax of R20.4 million to the group for the five months since acquisition. These amounts have been calculated using the group’s accounting policies.
If the businesses had been acquired on 1 September 2014, management estimates that the revenue and profit after tax from the businesses would have been R421.2 million and R245.1 million respectively.
Purchase consideration :
Cost of shares acquired 2 529 873
Loan claims acquired (164 146)
Total purchase consideration 2 365 727
The assets and liabilities as at 15 April 2015 arising from the acquisition are as follows :
Investment properties 4 059 921
Straight-line rental income accrual 59 472
Property, plant and equipment 863
Loans receivable 142
Shareholders loan 164 146
Interest rate swaps 12 163
Trade and other receivables** 24 323
Cash and cash equivalents 65 678
Interest-bearing liabilities – non-current (1 899 724)
Deferred taxation (9 346)
Trade and other payables (48 623)
Tax payable (368)
Fair value of net assets 2 428 647
Goodwill* 101 227
Shareholders loans acquired (164 146)
Total purchase consideration 2 365 728
Purchase consideration: 2 365 728
– Settled in Redefine shares 1 735 358
– Settled in cash 630 370
Cash and cash equivalents in subsidiary acquired (65 678)
Cash outflow on acquisition 564 692
* The goodwill arises as a result of the expected synergies from the acquisition
** Gross contractual amounts receivable are R24.9 million, the group’s best estimate of the contractual cashflow not expected to be collected is R0.5 million
The distributions received from the sellers amounting to R54.4 million, relating to the accounting period before they obtained Redefine shares, were reimbursed to Redefine per the acquisition agreements.
GROUP COMPANY
Note2015R000
2014R000
2015R000
2014R000
33 CASH GENERATED FROM OPERATIONS
Profit before taxation 5 530 353 3 485 624 5 240 690 2 473 988
Adjusted for:
Non cashflow items (2 670 411) (2 426 826) (2 095 452) (1 449 758)
Interest paid 1 683 064 1 457 159 1 340 538 1 157 741
Interest received (306 229) (159 391) (393 599) (325 415)
Debenture interest – 1 115 697 – 1 117 836
Operating income before working capital changes 4 236 777 3 472 263 4 092 177 2 974 392
Working capital changes 62 581 149 762 494 299 (18 813)
Trade, listed security income and other receivables (59 197) (81 999) 28 413 (140 435)
Properties held-for-trading 20 269 2 601 20 268 2 600
Trade and other payables 101 509 229 160 445 618 119 022
4 299 358 3 622 025 4 586 476 2 955 579
Non-cashflow items
Depreciation and amortisation 78 619 76 376 16 481 15 249
Fair value adjustments (2 242 360) (2 051 245) (2 186 199) (1 496 812)
Straight line lease accrual (163 305) (61 721) (105 847) (30 736)
Foreign exchange loss 223 072 13 638 83 107 34 200
Guarantee fee income (10 000) (10 000) (10 000) (10 000)
Equity accounted results of associate (453 053) (439 766) – –
Other non-cashflow items (8 241) (16 618) 10 354 (20 061)
Lease commissions and amortised tenant installations 75 599 62 510 70 552 58 402
Realised reserves on acquisition of Fountainhead assets and liabilities (170 742) – 26 100 –
(2 670 411) (2 426 826) (2 095 452) (1 449 758)
34 DISTRIBUTIONS PAID
Distribution payable at beginning of the year – 1 025 396 – 1 027 453
Distributions declared 2 859 144 1 115 697 2 864 306 1 117 836
2 859 144 2 141 093 2 864 306 2 145 289
35 TAXATION PAID
Taxation payable at beginning of year (47 672) (6 390) (16 194) (6 374)
Amounts charged to profit or loss 31 (71 822) (48 553) (3 946) (11 377)
Foreign withholding tax accrual (340) (2 421) – –
Taxation payable at end of year 22 392 47 672 – 16 194
(97 442) (9 692) (20 140) (1 557)
NOTES TO THE CONSOLIDATED FINANCIAL STATEMENTS continued
for the year ended 31 August 2015
Redefine Group Annual Financial Statements 2015 67
SECT
ION
1
66
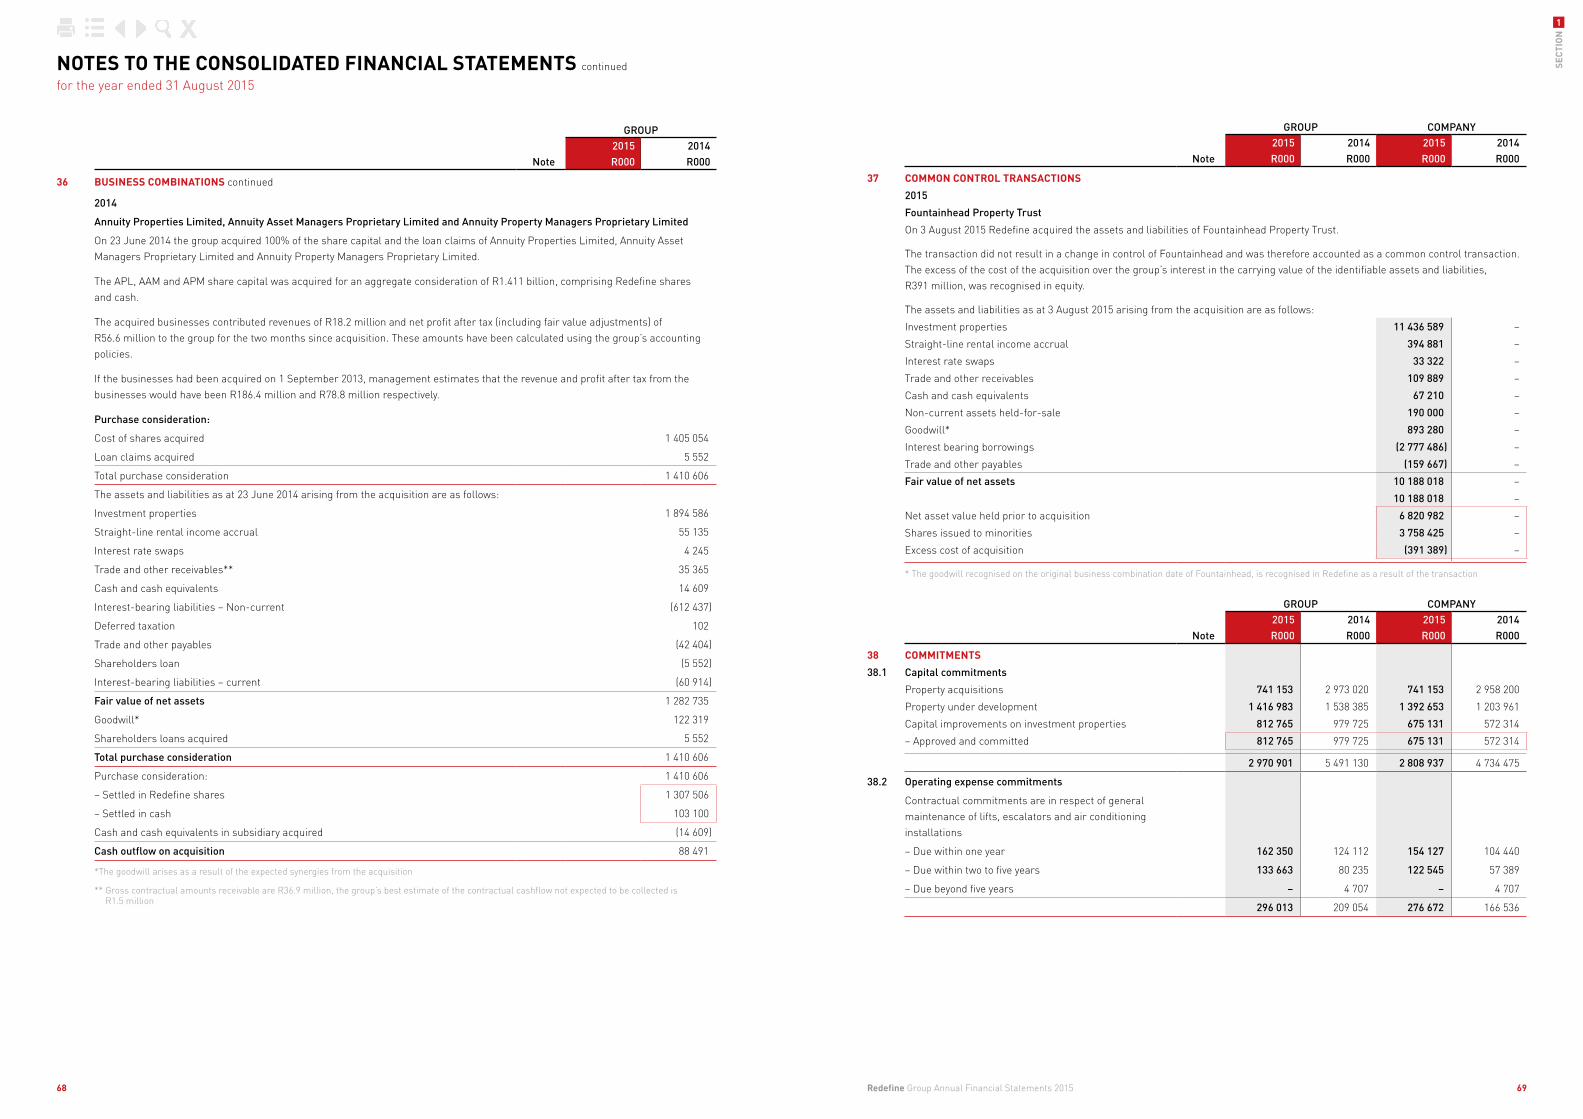
GROUP COMPANY
Note2015R000
2014R000
2015R000
2014R000
37 COMMON CONTROL TRANSACTIONS
2015
Fountainhead Property Trust
On 3 August 2015 Redefine acquired the assets and liabilities of Fountainhead Property Trust.
The transaction did not result in a change in control of Fountainhead and was therefore accounted as a common control transaction. The excess of the cost of the acquisition over the group’s interest in the carrying value of the identifiable assets and liabilities, R391 million, was recognised in equity.
The assets and liabilities as at 3 August 2015 arising from the acquisition are as follows:
Investment properties 11 436 589 –
Straight-line rental income accrual 394 881 –
Interest rate swaps 33 322 –
Trade and other receivables 109 889 –
Cash and cash equivalents 67 210 –
Non-current assets held-for-sale 190 000 –
Goodwill* 893 280 –
Interest bearing borrowings (2 777 486) –
Trade and other payables (159 667) –
Fair value of net assets 10 188 018 –
10 188 018 –
Net asset value held prior to acquisition 6 820 982 –
Shares issued to minorities 3 758 425 –
Excess cost of acquisition (391 389) –
* The goodwill recognised on the original business combination date of Fountainhead, is recognised in Redefine as a result of the transaction
GROUP
Note2015R000
2014R000
36 BUSINESS COMBINATIONS continued
2014
Annuity Properties Limited, Annuity Asset Managers Proprietary Limited and Annuity Property Managers Proprietary Limited
On 23 June 2014 the group acquired 100% of the share capital and the loan claims of Annuity Properties Limited, Annuity Asset Managers Proprietary Limited and Annuity Property Managers Proprietary Limited.
The APL, AAM and APM share capital was acquired for an aggregate consideration of R1.411 billion, comprising Redefine shares and cash.
The acquired businesses contributed revenues of R18.2 million and net profit after tax (including fair value adjustments) of R56.6 million to the group for the two months since acquisition. These amounts have been calculated using the group’s accounting policies.
If the businesses had been acquired on 1 September 2013, management estimates that the revenue and profit after tax from the businesses would have been R186.4 million and R78.8 million respectively.
Purchase consideration:
Cost of shares acquired 1 405 054
Loan claims acquired 5 552
Total purchase consideration 1 410 606
The assets and liabilities as at 23 June 2014 arising from the acquisition are as follows:
Investment properties 1 894 586
Straight-line rental income accrual 55 135
Interest rate swaps 4 245
Trade and other receivables** 35 365
Cash and cash equivalents 14 609
Interest-bearing liabilities – Non-current (612 437)
Deferred taxation 102
Trade and other payables (42 404)
Shareholders loan (5 552)
Interest-bearing liabilities – current (60 914)
Fair value of net assets 1 282 735
Goodwill* 122 319
Shareholders loans acquired 5 552
Total purchase consideration 1 410 606
Purchase consideration: 1 410 606
– Settled in Redefine shares 1 307 506
– Settled in cash 103 100
Cash and cash equivalents in subsidiary acquired (14 609)
Cash outflow on acquisition 88 491
*The goodwill arises as a result of the expected synergies from the acquisition
** Gross contractual amounts receivable are R36.9 million, the group’s best estimate of the contractual cashflow not expected to be collected is R1.5 million
NOTES TO THE CONSOLIDATED FINANCIAL STATEMENTS continued
for the year ended 31 August 2015
GROUP COMPANY
Note2015R000
2014R000
2015R000
2014R000
38 COMMITMENTS
38.1 Capital commitments
Property acquisitions 741 153 2 973 020 741 153 2 958 200
Property under development 1 416 983 1 538 385 1 392 653 1 203 961
Capital improvements on investment properties 812 765 979 725 675 131 572 314
– Approved and committed 812 765 979 725 675 131 572 314
2 970 901 5 491 130 2 808 937 4 734 475
38.2 Operating expense commitments
Contractual commitments are in respect of general maintenance of lifts, escalators and air conditioning installations
– Due within one year 162 350 124 112 154 127 104 440
– Due within two to five years 133 663 80 235 122 545 57 389
– Due beyond five years – 4 707 – 4 707
296 013 209 054 276 672 166 536
Redefine Group Annual Financial Statements 2015 69
SECT
ION
1
68
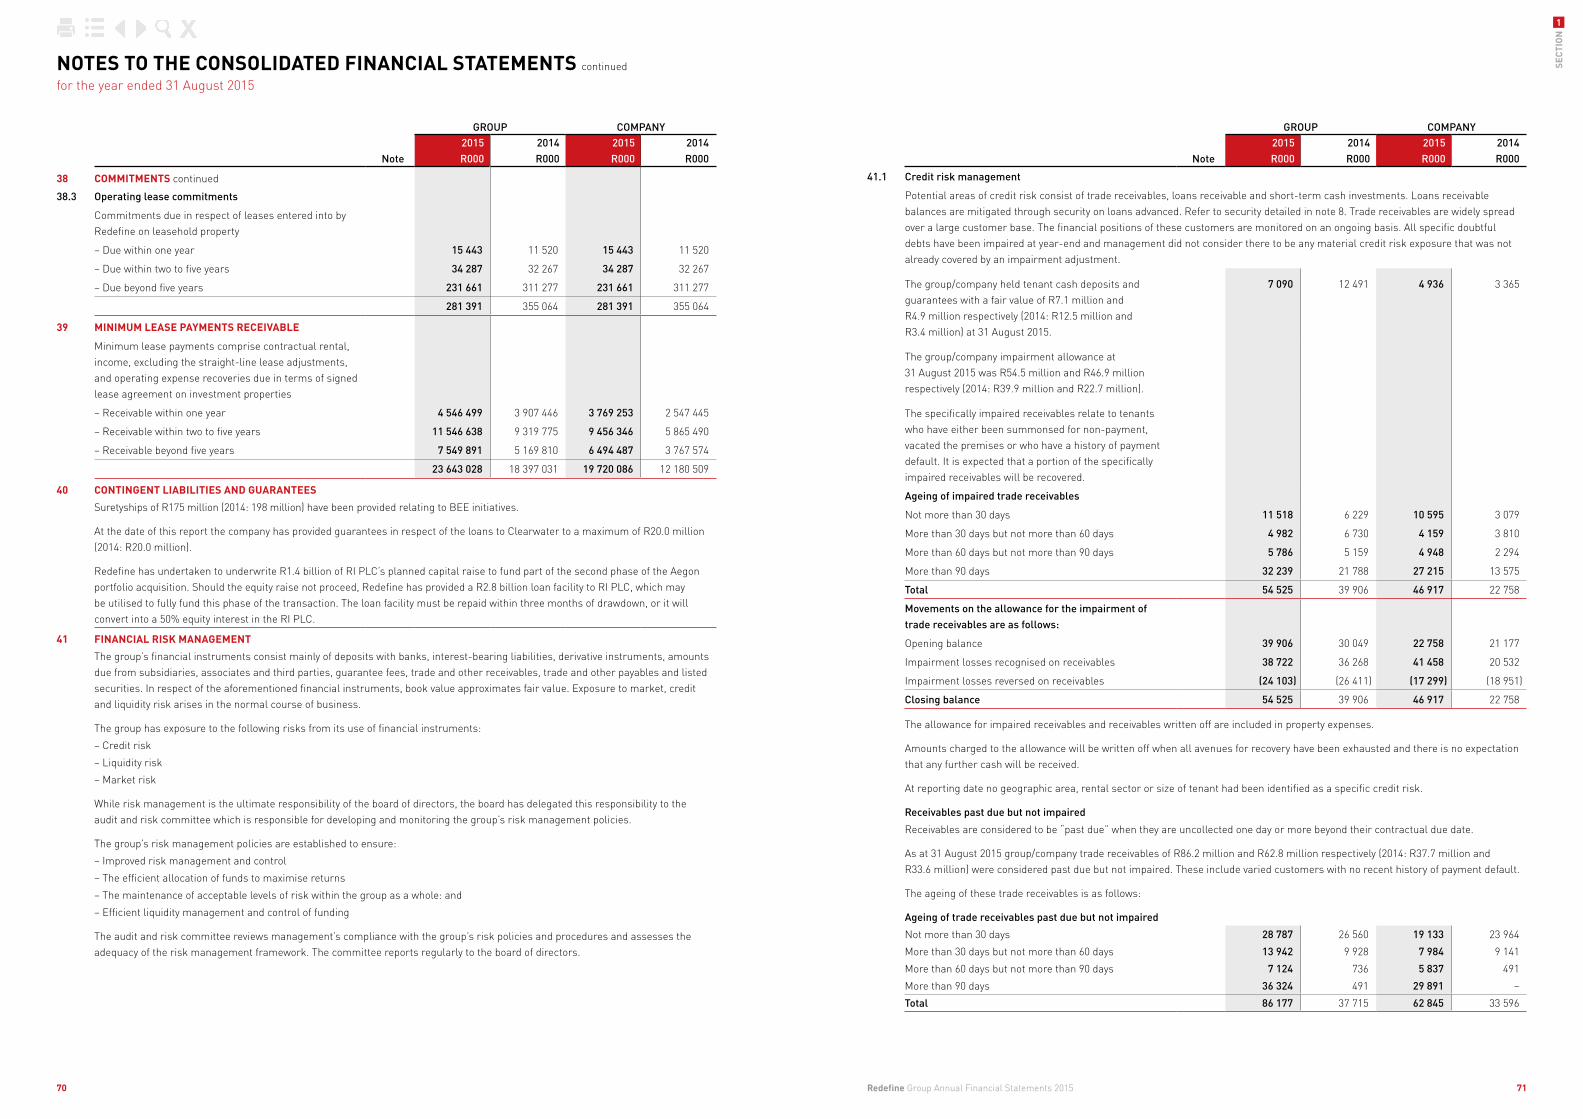
GROUP COMPANY
Note2015R000
2014R000
2015R000
2014R000
41.1 Credit risk management
Potential areas of credit risk consist of trade receivables, loans receivable and short-term cash investments. Loans receivable balances are mitigated through security on loans advanced. Refer to security detailed in note 8. Trade receivables are widely spread over a large customer base. The financial positions of these customers are monitored on an ongoing basis. All specific doubtful debts have been impaired at year-end and management did not consider there to be any material credit risk exposure that was not already covered by an impairment adjustment.
The group/company held tenant cash deposits and guarantees with a fair value of R7.1 million and R4.9 million respectively (2014: R12.5 million and R3.4 million) at 31 August 2015.
7 090 12 491 4 936 3 365
The group/company impairment allowance at 31 August 2015 was R54.5 million and R46.9 million respectively (2014: R39.9 million and R22.7 million).
The specifically impaired receivables relate to tenants who have either been summonsed for non-payment, vacated the premises or who have a history of payment default. It is expected that a portion of the specifically impaired receivables will be recovered.
Ageing of impaired trade receivables
Not more than 30 days 11 518 6 229 10 595 3 079
More than 30 days but not more than 60 days 4 982 6 730 4 159 3 810
More than 60 days but not more than 90 days 5 786 5 159 4 948 2 294
More than 90 days 32 239 21 788 27 215 13 575
Total 54 525 39 906 46 917 22 758
Movements on the allowance for the impairment of trade receivables are as follows:
Opening balance 39 906 30 049 22 758 21 177
Impairment losses recognised on receivables 38 722 36 268 41 458 20 532
Impairment losses reversed on receivables (24 103) (26 411) (17 299) (18 951)
Closing balance 54 525 39 906 46 917 22 758
The allowance for impaired receivables and receivables written off are included in property expenses.
Amounts charged to the allowance will be written off when all avenues for recovery have been exhausted and there is no expectation that any further cash will be received.
At reporting date no geographic area, rental sector or size of tenant had been identified as a specific credit risk.
Receivables past due but not impaired
Receivables are considered to be “past due” when they are uncollected one day or more beyond their contractual due date.
As at 31 August 2015 group/company trade receivables of R86.2 million and R62.8 million respectively (2014: R37.7 million and R33.6 million) were considered past due but not impaired. These include varied customers with no recent history of payment default.
The ageing of these trade receivables is as follows:
Ageing of trade receivables past due but not impaired
Not more than 30 days 28 787 26 560 19 133 23 964
More than 30 days but not more than 60 days 13 942 9 928 7 984 9 141
More than 60 days but not more than 90 days 7 124 736 5 837 491
More than 90 days 36 324 491 29 891 –
Total 86 177 37 715 62 845 33 596
GROUP COMPANY
Note2015R000
2014R000
2015R000
2014R000
38 COMMITMENTS continued
38.3 Operating lease commitments
Commitments due in respect of leases entered into by Redefine on leasehold property
– Due within one year 15 443 11 520 15 443 11 520
– Due within two to five years 34 287 32 267 34 287 32 267
– Due beyond five years 231 661 311 277 231 661 311 277
281 391 355 064 281 391 355 064
39 MINIMUM LEASE PAYMENTS RECEIVABLE
Minimum lease payments comprise contractual rental, income, excluding the straight-line lease adjustments, and operating expense recoveries due in terms of signed lease agreement on investment properties
– Receivable within one year 4 546 499 3 907 446 3 769 253 2 547 445
– Receivable within two to five years 11 546 638 9 319 775 9 456 346 5 865 490
– Receivable beyond five years 7 549 891 5 169 810 6 494 487 3 767 574
23 643 028 18 397 031 19 720 086 12 180 509
40 CONTINGENT LIABILITIES AND GUARANTEES
Suretyships of R175 million (2014: 198 million) have been provided relating to BEE initiatives.
At the date of this report the company has provided guarantees in respect of the loans to Clearwater to a maximum of R20.0 million (2014: R20.0 million).
Redefine has undertaken to underwrite R1.4 billion of RI PLC’s planned capital raise to fund part of the second phase of the Aegon portfolio acquisition. Should the equity raise not proceed, Redefine has provided a R2.8 billion loan facility to RI PLC, which may be utilised to fully fund this phase of the transaction. The loan facility must be repaid within three months of drawdown, or it will convert into a 50% equity interest in the RI PLC.
41 FINANCIAL RISK MANAGEMENT
The group’s financial instruments consist mainly of deposits with banks, interest-bearing liabilities, derivative instruments, amounts due from subsidiaries, associates and third parties, guarantee fees, trade and other receivables, trade and other payables and listed securities. In respect of the aforementioned financial instruments, book value approximates fair value. Exposure to market, credit and liquidity risk arises in the normal course of business.
The group has exposure to the following risks from its use of financial instruments:
– Credit risk
– Liquidity risk
– Market risk
While risk management is the ultimate responsibility of the board of directors, the board has delegated this responsibility to the audit and risk committee which is responsible for developing and monitoring the group’s risk management policies.
The group’s risk management policies are established to ensure:
– Improved risk management and control
– The efficient allocation of funds to maximise returns
– The maintenance of acceptable levels of risk within the group as a whole: and
– Efficient liquidity management and control of funding
The audit and risk committee reviews management’s compliance with the group’s risk policies and procedures and assesses the adequacy of the risk management framework. The committee reports regularly to the board of directors.
NOTES TO THE CONSOLIDATED FINANCIAL STATEMENTS continued
for the year ended 31 August 2015
Redefine Group Annual Financial Statements 2015 71
SECT
ION
1
70

NOTES TO THE CONSOLIDATED FINANCIAL STATEMENTS continued
for the year ended 31 August 2015
Financial instruments by category
Financial assets Financial liabilities Financial instruments
beyond the scope of
IFRS 7 and non-financial instruments Total
At amortised cost^
At fair value through profit
or lossAt amortised
cost^
At fair value through profit
or loss
Year ended 31 August 2015
Financial assets
Listed securities – 988 793 – – – 988 793
Loans receivable 1 772 364 – – – – 1 772 364
Derivatives# – 93 150 – – – 93 150
Guarantee fees receivable 73 760 – – – – 73 760
Trade and other receivables 173 522 – – – 444 442 617 964
Listed security income 86 368 – – – – 86 368
Cash and cash equivalents 129 924 – – – – 129 924
Total financial assets 2 235 938 1 081 943 – – 444 442 3 762 323
Financial liabilities
Interest-bearing liabilities – – 23 582 366 – – 23 582 366
Derivatives# – – – 10 488 – 10 488
Other financial liabilities – – – 17 507 18 437 35 944
Trade and other payables – – 1 049 748 – 56 482 1 106 230
Total financial liabilities – – 24 632 114 27 995 74 919 24 735 028
^ For all financial instruments carried at amortised cost, due to the fact that interest is market related, the amortised cost approximates the fair value
# The derivatives are classified as held-for-trading in terms of IAS 39
Year ended 31 August 2014
Financial assets
Listed securities – 2 750 900 – – – 2 750 900
Loans receivable 1 729 262 – – – – 1 729 262
Other financial assets# – 23 510 – – – 23 510
Guarantee fees receivable 50 000 – – – – 50 000
Trade and other receivables 140 591 – – – 439 430 580 021
Listed security income 38 671 – – – – 38 671
Cash and cash equivalents 350 606 – – – – 350 606
Total financial assets 2 309 130 2 774 410 – – 439 430 5 522 970
Financial liabilities
Interest-bearing liabilities – – 19 756 529 – – 19 756 529
Derivatives# – – – 96 118 – 96 118
Other financial liabilities – – – 27 507 22 096 49 603
Trade and other payables – – 1 254 796 – 39 511 1 294 307
Total financial liabilities – – 21 011 325 123 625 61 607 21 196 557
^ For all financial instruments carried at amortised cost, due to the fact that interest is market related, the amortised cost approximates the fair value
# The derivatives of R23.5 million included in other financial assets and R96.1 million included in interest rate swaps are classified as held-for-trading in terms of IAS 39
41 FINANCIAL RISK MANAGEMENT continued
41.2 Liquidity risk
Liquidity risk is the risk that the group will not be able to meet its financial obligations as they fall due. The group ensures that it always has adequate funds available and seeks to borrow for as long as possible at the lowest possible cost. Liquidity requirements are managed by monitoring forecasted cashflows and the maturity profile of financial liabilities.
A maturity analysis of financial assets and liabilities is set out in the table below.
Less than one year
One – fiveyears
More than five years Total
GROUP
Year ended 31 August 2015
Financial assets
Listed securities – – 988 793 988 793
Loans receivable 587 440 1 062 120 122 804 1 772 364
Derivatives – 93 150 – 93 150
Guarantee fees receivable – 73 760 – 73 760
Trade and other receivables 617 964 – – 617 964
Listed security income receivable 86 368 – – 86 368
Cash and cash equivalents 129 924 – – 129 924
Total financial assets 1 421 696 1 229 030 1 111 597 3 762 323
Interest payments relating to loans receivable above 102 713 102 881 11 741 217 335
Financial liabilities
Interest-bearing liabilities 1 980 226 20 102 140 1 500 000 23 582 366
Derivatives 10 488 – – 10 488
Other financial liabilities 17 507 18 437 – 35 944
Trade and other payables 1 106 230 – – 1 106 230
Total financial liabilities 3 114 451 20 120 577 1 500 000 24 735 028
Interest payments relating to interest-bearing liabilities above 277 933 1 486 716 86 957 1 851 606
Issued guarantees (the maturity has been assumed as the first potential date of drawdown) 152 281 – – 152 281
Year ended 31 August 2014
Financial assets
Listed securities – – 2 750 900 2 750 900
Loans receivable 2 050 1 547 372 179 840 1 729 262
Other financial assets – 23 510 – 23 510
Guarantee fees receivable – 50 000 – 50 000
Trade and other receivables 580 021 – – 580 021
Listed security income 38 671 – – 38 671
Cash and cash equivalents 350 606 – – 350 606
Total financial assets 971 348 1 620 882 2 930 740 5 522 970
Interest payments relating to loans receivable above 6 99 682 13 788 113 476
Financial liabilities
Interest-bearing liabilities 5 401 205 11 627 807 2 727 517 19 756 529
Derivatives 926 95 192 – 96 118
Other financial liabilities 12 872 36 731 – 49 603
Trade and other payables 1 294 307 – – 1 294 307
Total financial liabilities 6 709 310 11 759 730 2 727 517 21 196 557
Interest payments relating to interest-bearing liabilities above 301 806 930 484 207 239 1 439 529
Issued guarantees (the maturity has been assumed as the first potential date of drawdown) 226 950 – – 226 950
Redefine Group Annual Financial Statements 2015 73
SECT
ION
1
72
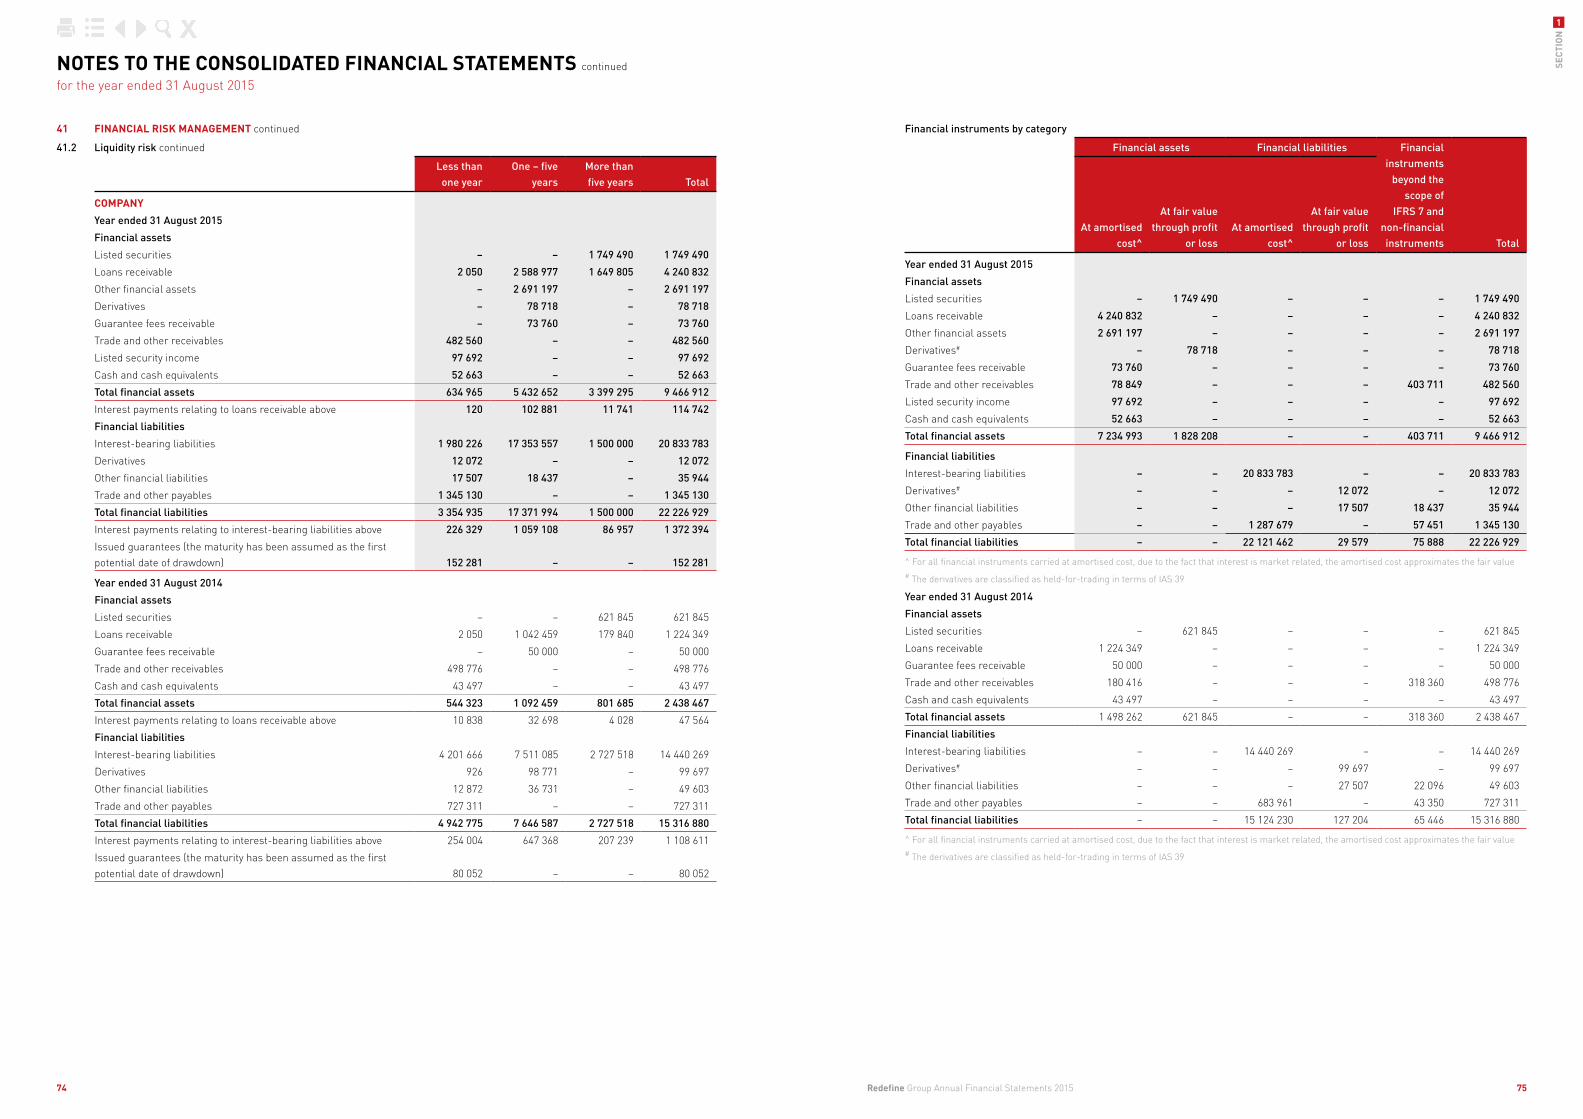
Financial instruments by category
Financial assets Financial liabilities Financial instruments
beyond the scope of
IFRS 7 and non-financial instruments Total
At amortised cost^
At fair value through profit
or lossAt amortised
cost^
At fair value through profit
or loss
Year ended 31 August 2015
Financial assets
Listed securities – 1 749 490 – – – 1 749 490
Loans receivable 4 240 832 – – – – 4 240 832
Other financial assets 2 691 197 – – – – 2 691 197
Derivatives# – 78 718 – – – 78 718
Guarantee fees receivable 73 760 – – – – 73 760
Trade and other receivables 78 849 – – – 403 711 482 560
Listed security income 97 692 – – – – 97 692
Cash and cash equivalents 52 663 – – – – 52 663
Total financial assets 7 234 993 1 828 208 – – 403 711 9 466 912
Financial liabilities
Interest-bearing liabilities – – 20 833 783 – – 20 833 783
Derivatives# – – – 12 072 – 12 072
Other financial liabilities – – – 17 507 18 437 35 944
Trade and other payables – – 1 287 679 – 57 451 1 345 130
Total financial liabilities – – 22 121 462 29 579 75 888 22 226 929
^ For all financial instruments carried at amortised cost, due to the fact that interest is market related, the amortised cost approximates the fair value# The derivatives are classified as held-for-trading in terms of IAS 39
Year ended 31 August 2014
Financial assets
Listed securities – 621 845 – – – 621 845
Loans receivable 1 224 349 – – – – 1 224 349
Guarantee fees receivable 50 000 – – – – 50 000
Trade and other receivables 180 416 – – – 318 360 498 776
Cash and cash equivalents 43 497 – – – – 43 497
Total financial assets 1 498 262 621 845 – – 318 360 2 438 467
Financial liabilities
Interest-bearing liabilities – – 14 440 269 – – 14 440 269
Derivatives# – – – 99 697 – 99 697
Other financial liabilities – – – 27 507 22 096 49 603
Trade and other payables – – 683 961 – 43 350 727 311
Total financial liabilities – – 15 124 230 127 204 65 446 15 316 880
^ For all financial instruments carried at amortised cost, due to the fact that interest is market related, the amortised cost approximates the fair value# The derivatives are classified as held-for-trading in terms of IAS 39
41 FINANCIAL RISK MANAGEMENT continued
41.2 Liquidity risk continued
Less than one year
One – five years
More than five years Total
COMPANY
Year ended 31 August 2015
Financial assets
Listed securities – – 1 749 490 1 749 490
Loans receivable 2 050 2 588 977 1 649 805 4 240 832
Other financial assets – 2 691 197 – 2 691 197
Derivatives – 78 718 – 78 718
Guarantee fees receivable – 73 760 – 73 760
Trade and other receivables 482 560 – – 482 560
Listed security income 97 692 – – 97 692
Cash and cash equivalents 52 663 – – 52 663
Total financial assets 634 965 5 432 652 3 399 295 9 466 912
Interest payments relating to loans receivable above 120 102 881 11 741 114 742
Financial liabilities
Interest-bearing liabilities 1 980 226 17 353 557 1 500 000 20 833 783
Derivatives 12 072 – – 12 072
Other financial liabilities 17 507 18 437 – 35 944
Trade and other payables 1 345 130 – – 1 345 130
Total financial liabilities 3 354 935 17 371 994 1 500 000 22 226 929
Interest payments relating to interest-bearing liabilities above 226 329 1 059 108 86 957 1 372 394
Issued guarantees (the maturity has been assumed as the first potential date of drawdown) 152 281 – – 152 281
Year ended 31 August 2014
Financial assets
Listed securities – – 621 845 621 845
Loans receivable 2 050 1 042 459 179 840 1 224 349
Guarantee fees receivable – 50 000 – 50 000
Trade and other receivables 498 776 – – 498 776
Cash and cash equivalents 43 497 – – 43 497
Total financial assets 544 323 1 092 459 801 685 2 438 467
Interest payments relating to loans receivable above 10 838 32 698 4 028 47 564
Financial liabilities
Interest-bearing liabilities 4 201 666 7 511 085 2 727 518 14 440 269
Derivatives 926 98 771 – 99 697
Other financial liabilities 12 872 36 731 – 49 603
Trade and other payables 727 311 – – 727 311
Total financial liabilities 4 942 775 7 646 587 2 727 518 15 316 880
Interest payments relating to interest-bearing liabilities above 254 004 647 368 207 239 1 108 611
Issued guarantees (the maturity has been assumed as the first potential date of drawdown) 80 052 – – 80 052
NOTES TO THE CONSOLIDATED FINANCIAL STATEMENTS continued
for the year ended 31 August 2015
Redefine Group Annual Financial Statements 2015 75
SECT
ION
1
74

41.4 Fair value hierarchy for financial instruments and investment propertyIFRS 13 requires that an entity disclose for each class of financial instruments measured at fair value, the level in the fair value hierarchy into which the fair value measurements are categorised in their entirety.
The fair value hierarchy reflects the significance of the inputs used in making fair value measurements.
The level in the fair value hierarchy within which the fair value measurement is categorised in its entirety shall be determined on the basis of the lowest level input that is significant to the fair value measurement in its entirety.
The table below analyses financial instruments and investment property carried at fair value, by valuation method.
The fair value hierarchy has the following levels:
Level 1 – quoted prices (unadjusted) in active markets for identical assets or liabilities.
Level 2 – inputs other than quoted prices included within Level 1 that are observable for the asset or liability, either directly (i.e. as prices) or indirectly (i.e. derived from prices).
Level 3 – Inputs for the asset or liability that are not based on observable market data (unobservable inputs).
The table below does not include fair value information for investment property and properties under development measured at fair value if the carrying amount is a reasonable approximation of fair value.
Year ended 31 August 2015 Designated at fair value Level 1 Level 2 Level 3
GROUP
Assets
Investment property 51 188 481 – – 51 188 481
Listed securities 988 793 988 793 – –
Derivatives 93 150 – 93 150 –
Total assets 52 270 424 988 793 93 150 51 188 481
Liabilities
Derivatives 10 488 – 10 488 –
Other financial liabilities 17 507 – 17 507 –
Total liabilities 27 995 – 27 995 –
COMPANY
Assets
Investment property 42 052 761 – – 42 052 761
Listed securities 1 749 490 1 749 490 – –
Derivatives 78 718 – 78 718 –
Total assets 43 880 969 1 749 490 78 718 42 052 761
Liabilities
Derivatives 12 072 – 12 072 –
Other financial liabilities 17 507 – 17 507 –
Total liabilities 29 579 – 29 579 –
41.4.1 Details of changes in valuation technique There have been no significant changes in valuation techniques during the year under review.
41.4.2 Significant transfers between level 1, level 2 and level 3 There have been no significant transfers between level 1, level 2 and level 3 during the year under review.
41 FINANCIAL RISK MANAGEMENT continued
41.3 Market risk
Interest rate riskThe group is exposed to interest rate risk through its variable rate cash balances, receivables, payables and long-term balances.
The group reduces its exposure to changes in interest rates by fixing interest rates in respect of 66% of its local borrowings. This is achieved by entering into agreements to receive variable and pay fixed interest rate swaps.
An increase/decrease of 1% in interest rates for the year ending 31 August 2015 would have increased/decreased the interest expense by approximately R53.1 million (2014: R42.9 million) and therefore the profit would decrease by this amount.
These amounts are determined by calculating 1% on the amount of effective floating interest rate liabilities (i.e. total nominal liabilities net of swaps and fixed interest rate loans).
Equity price riskThe group is exposed to equity securities price risk in respect of listed securities held by the group. Any fluctuations in equity prices do not affect distributions paid to unit holders. If equity security prices increased or decreased by 5% of the carrying amount at year-end, the effect on net income before taxation would have been R51.5 million (2014: R137 million).
Currency riskThe group is exposed to currency risk through its Isle of Man loans, Macquarie loans and investments in the Cromwell Property Group, Redefine International PLC and the Cromwell Partners Trust.
Redefine International PLCIt is estimated that for the distributions from RI PLC, a R1.00 increase/decrease in the spot exchange rate to GBP would increase/ decrease the Group’s expected profit before taxation by R13.6million (2014: R5.7 million).
Cromwell Partners TrustIt is estimated that for the distributions from CPT, a R1.00 increase/decrease in the spot exchange rate to AUD would increase/ decrease the Group’s expected profit before taxation by R6.3 million (2014: R4.4 million).
Macquarie loanIt is estimated that for the interest expense from Macquarie, a R1.00 increase/decrease in the spot exchange rate to AUD would increase/ decrease the Group’s expected profit before taxation by R4.8 million (2014: R3.2 million).
It is estimated that for the loan balance from Macquarie, a R1.00 increase/decrease in the spot exchange rate to AUD would increase/ decrease the loan balance by R98 million (2014: R80 million).
Isle of Man loanIt is estimated that for the interest expense from Isle of Man, a R1.00 increase/decrease in the spot exchange rate to GBP would increase/decrease the Group’s expected profit before taxation by R1.1 million (2014: R1.1 million).
It is estimated that for the loan balance from Isle of Man, a R1.00 increase/decrease in the spot exchange rate to GBP would increase/ decrease the loan balance by R21.3 million (2014: R21.3 million).
Cromwell Property GroupIt is estimated that for the distributions from Cromwell, a R1.00 increase/decrease in the spot exchange rate to AUD would increase/ decrease the Group’s expected profit before taxation by R30.5 million (2014: R12.7 million).
Investec loansIt is estimated that for the interest expense from Investec, a R1.00 increase/decrease in the spot exchange rate to GBP would increase/decrease the Group’s expected profit before taxation by R0.3 million (2014: R0).
It is estimated that for the interest expense from Investec, a R1.00 increase/decrease in the spot exchange rate to AUD would increase/decrease the Group’s expected profit before taxation by R5.5 million (2014: R0).
It is estimated that for the interest expense from Investec, a R1.00 increase/decrease in the spot exchange rate to EUR would increase/decrease the Group’s expected profit before taxation by R0.7 million (2014: R0).
It is estimated that for the loan balance from Investec, a R1.00 increase/decrease in the spot exchange rate to GBP would increase/ decrease the loan balance by R21.4 million (2014: R0).
It is estimated that for the loan balance from Investec, a R1.00 increase/decrease in the spot exchange rate to AUD would increase/ decrease the loan balance by R269.7million (2014: R0).
It is estimated that for the loan balance from Investec, a R1.00 increase/decrease in the spot exchange rate to EUR would increase/ decrease the loan balance by R53.5 million (2014: R0).
NOTES TO THE CONSOLIDATED FINANCIAL STATEMENTS continued
for the year ended 31 August 2015
Redefine Group Annual Financial Statements 2015 77
SECT
ION
1
76
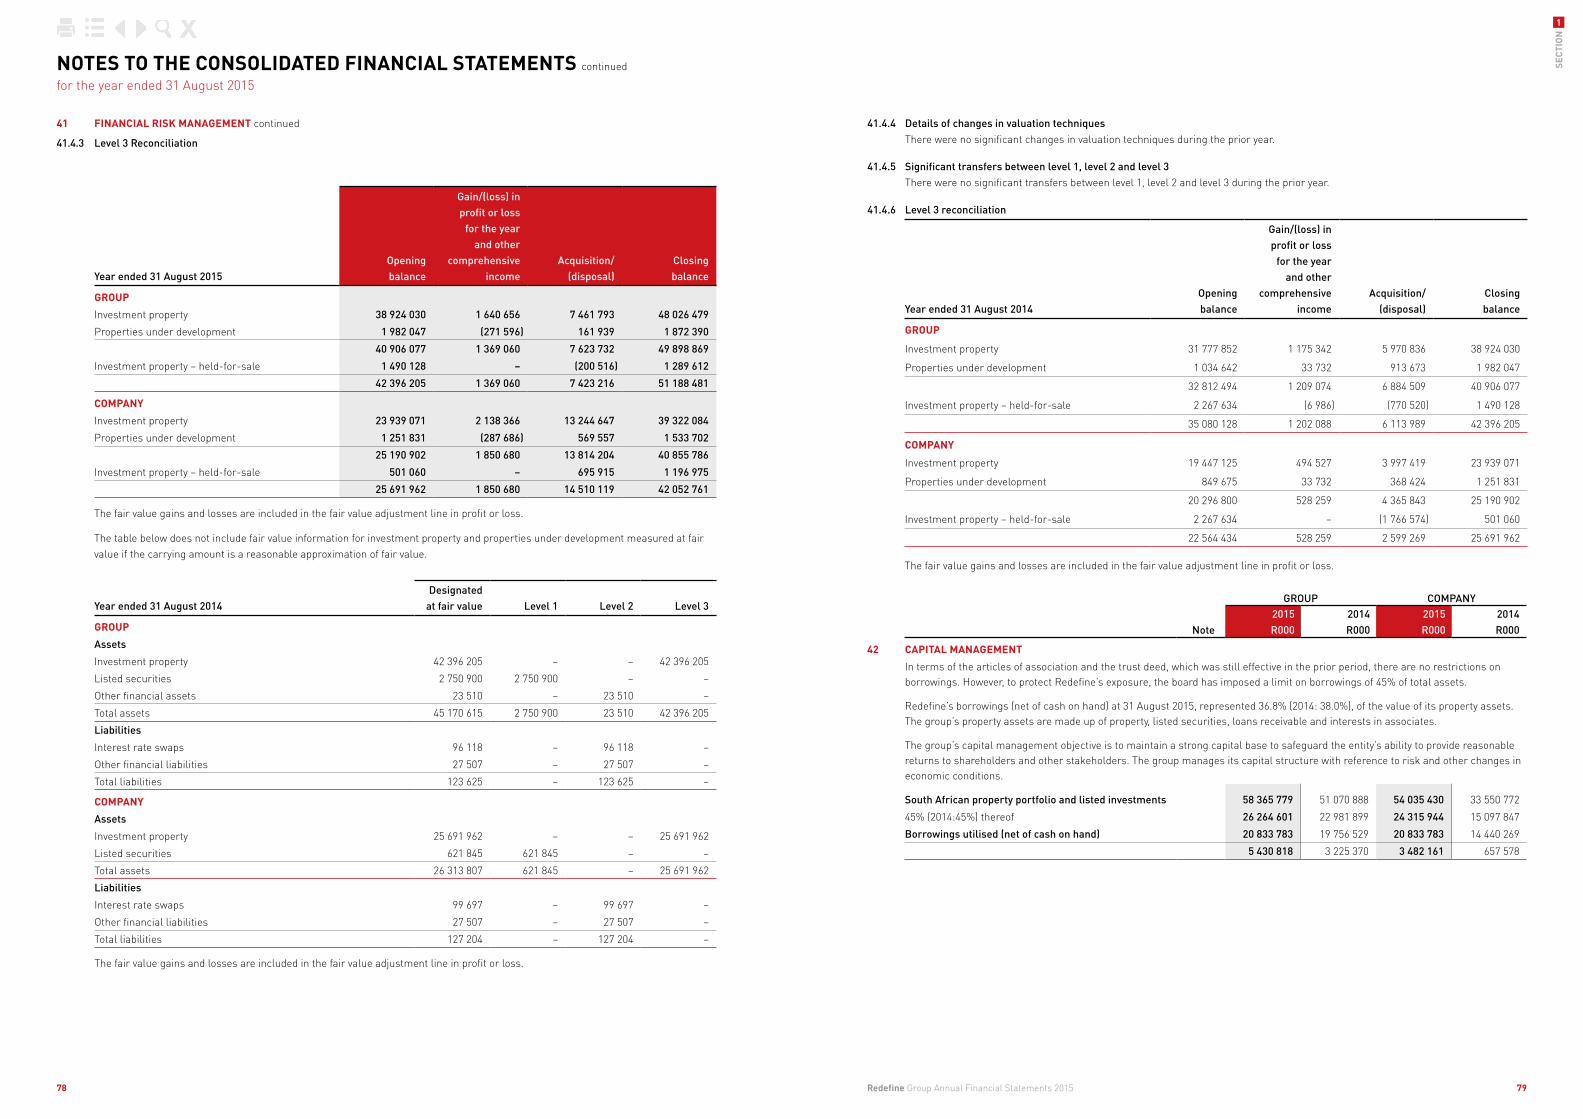
NOTES TO THE CONSOLIDATED FINANCIAL STATEMENTS continued
for the year ended 31 August 2015
GROUP COMPANY
Note2015R000
2014R000
2015R000
2014R000
42 CAPITAL MANAGEMENT
In terms of the articles of association and the trust deed, which was still effective in the prior period, there are no restrictions on borrowings. However, to protect Redefine’s exposure, the board has imposed a limit on borrowings of 45% of total assets.
Redefine’s borrowings (net of cash on hand) at 31 August 2015, represented 36.8% (2014: 38.0%), of the value of its property assets. The group’s property assets are made up of property, listed securities, loans receivable and interests in associates.
The group’s capital management objective is to maintain a strong capital base to safeguard the entity’s ability to provide reasonable returns to shareholders and other stakeholders. The group manages its capital structure with reference to risk and other changes in economic conditions.
South African property portfolio and listed investments 58 365 779 51 070 888 54 035 430 33 550 772
45% (2014:45%) thereof 26 264 601 22 981 899 24 315 944 15 097 847
Borrowings utilised (net of cash on hand) 20 833 783 19 756 529 20 833 783 14 440 269
5 430 818 3 225 370 3 482 161 657 578
41 FINANCIAL RISK MANAGEMENT continued
41.4.3 Level 3 Reconciliation
Year ended 31 August 2015Openingbalance
Gain/(loss) in profit or loss
for the year and other
comprehensive income
Acquisition/ (disposal)
Closingbalance
GROUP
Investment property 38 924 030 1 640 656 7 461 793 48 026 479
Properties under development 1 982 047 (271 596) 161 939 1 872 390
40 906 077 1 369 060 7 623 732 49 898 869
Investment property – held-for-sale 1 490 128 – (200 516) 1 289 612
42 396 205 1 369 060 7 423 216 51 188 481
COMPANY
Investment property 23 939 071 2 138 366 13 244 647 39 322 084
Properties under development 1 251 831 (287 686) 569 557 1 533 702
25 190 902 1 850 680 13 814 204 40 855 786
Investment property – held-for-sale 501 060 – 695 915 1 196 975
25 691 962 1 850 680 14 510 119 42 052 761
The fair value gains and losses are included in the fair value adjustment line in profit or loss.
The table below does not include fair value information for investment property and properties under development measured at fair value if the carrying amount is a reasonable approximation of fair value.
Year ended 31 August 2014 Designated at fair value Level 1 Level 2 Level 3
GROUP
Assets
Investment property 42 396 205 – – 42 396 205
Listed securities 2 750 900 2 750 900 – –
Other financial assets 23 510 – 23 510 –
Total assets 45 170 615 2 750 900 23 510 42 396 205
Liabilities
Interest rate swaps 96 118 – 96 118 –
Other financial liabilities 27 507 – 27 507 –
Total liabilities 123 625 – 123 625 –
COMPANY
Assets
Investment property 25 691 962 – – 25 691 962
Listed securities 621 845 621 845 – –
Total assets 26 313 807 621 845 – 25 691 962
Liabilities
Interest rate swaps 99 697 – 99 697 –
Other financial liabilities 27 507 – 27 507 –
Total liabilities 127 204 – 127 204 –
The fair value gains and losses are included in the fair value adjustment line in profit or loss.
41.4.4 Details of changes in valuation techniques There were no significant changes in valuation techniques during the prior year.
41.4.5 Significant transfers between level 1, level 2 and level 3 There were no significant transfers between level 1, level 2 and level 3 during the prior year.
41.4.6 Level 3 reconciliation
Year ended 31 August 2014Openingbalance
Gain/(loss) in profit or loss
for the year and other
comprehensive income
Acquisition/(disposal)
Closingbalance
GROUP
Investment property 31 777 852 1 175 342 5 970 836 38 924 030
Properties under development 1 034 642 33 732 913 673 1 982 047
32 812 494 1 209 074 6 884 509 40 906 077
Investment property – held-for-sale 2 267 634 (6 986) (770 520) 1 490 128
35 080 128 1 202 088 6 113 989 42 396 205
COMPANY
Investment property 19 447 125 494 527 3 997 419 23 939 071
Properties under development 849 675 33 732 368 424 1 251 831
20 296 800 528 259 4 365 843 25 190 902
Investment property – held-for-sale 2 267 634 – (1 766 574) 501 060
22 564 434 528 259 2 599 269 25 691 962
The fair value gains and losses are included in the fair value adjustment line in profit or loss.
Redefine Group Annual Financial Statements 2015 79
SECT
ION
1
78

NOTES TO THE CONSOLIDATED FINANCIAL STATEMENTS continued
for the year ended 31 August 2015
GROUP COMPANY
Note2015R000
2014R000
2015R000
2014R000
43 RELATED-PARTY TRANSACTIONS
Parties are considered to be related if one party has the ability to control the other party or exercise significant influence over the other party in making financial or operational decisions.
Related parties with whom Redefine transacted during the year were:
Redefine Properties long term incentive scheme 122 805 179 840 122 805 179 840
Leaf Property Fund Proprietary Limited
Debenture interest – – 85 326 –
Loan receivable – – 135 417 –
Relationship: subsidiary company
Madison Property Fund Managers Limited
Income comprising interest distributions – – 62 589 112 701
Loan payable – – 522 355 490 280
Relationship: subsidiary company –
Freedom Square Proprietary Limited
Interest received – – – 1 828
Development fee income – – – 1 500
Relationship: subsidiary company
Redefine Pacific Proprietary Limited
Interest received – – 41 455 26 941
Loan receivable – – 525 488 506 596
Relationship: subsidiary company
Fountainhead Property Trust
Development fee – – 7 021 6 792
Relationship: subsidiary trust
Fountainhead Property Trust Management Limited
Dividend received – – 6 000 8 000
Relationship: subsidiary company
Redefine Retail Proprietary Limited
Income comprising dividend/interest distributions – – 664 035 569 811
Loan receivable – – 2 923 226 8 320 103
Relationship: subsidiary company
Evening Star 768 Proprietary Limited
Interest received – – 27 491 29 007
Loan receivable – – 272 475 290 145
Relationship: subsidiary company
GROUP COMPANY
Note2015R000
2014R000
2015R000
2014R000
43 RELATED-PARTY TRANSACTIONS continued
Madison Property Fund Managers Holdings Limited
Dividend received – – 61 470 28 018
Loan receivable – – 931 793 870 323
Relationship: subsidiary company
Redefine Global Proprietary Limited
Dividend received – – 259 241 97 627
Relationship: subsidiary company
Annuity Asset Managers Proprietary Limited
Loan receivable – – 5 552 5 552
Relationship: subsidiary company
Redefine International PLC
Asset management fees 4 154 – – –
Dividend received 246 461 112 074 40 005 28 018
Directors fees received by repay 635 559 635 559
Relationship: Associate company
Annuity Properties Limited
Income comprising interest distributions – – 151 142 51 104
Loan receivable – – 689 115 2 234
Relationship: subsidiary company
Redefine Property Management Proprietary Limited
Loan receivable – – 2 945 –
Development fees – – 7 785 –
Management fees
Rental income – – 26 494 –
Relationship: subsidiary company
Black River Park Investments Proprietary Limited
Loan payable – – 10 000 –
Relationship: subsidiary company
S&J Land Investments Proprietary Limited
Loan receivable – – 3 893 –
Relationship: subsidiary company
Directors’ emoluments
Non-executive directors (refer to directors report) 2 758 2 780 2 758 2 780
Executive directors (refer to directors report) 40 841 32 783 40 841 32 783
44 SUBSEQUENT EVENTS
Dividend declaration after reporting date
In line with IAS 10, events after the reporting period, the declaration of the dividend occurred after the end of the reporting period, resulting in a non-adjusting event that is not recognised in the financial statements. In the prior periods, the distribution consisted of debenture interest which accrued on a daily basis.
Redefine Group Annual Financial Statements 2015 81
SECT
ION
1
80

GROUP COMPANY
Note2015R000
2014R000
2015R000
2014R000
45 JOINTLY CONTROLLED ASSETS continued
Rosebank Towers (42.5% interest)
Undivided 42.5% share of the immovable property and letting enterprise with Ellwain Investments (Proprietary) Limited and Palm Trust. Effective date 20 June 2014.
Non-current assets 251 878 31 513 251 878 31 513
Current liabilities 1 – 1 –
Income – – – –
Expenses 4 – 4 –
14 Piet Rautenbach (50% interest)
Undivided half share of the immovable property and letting enterprise with JD Group Property Holdings Proprietary Limited. Effective date 26 March 2012.
Non-current assets 52 000 42 200 52 000 42 200
Current assets 663 438 663 438
Current liabilities 619 100 619 100
Income 3 828 3 542 3 828 3 542
Moresport DC (50% interest)
Undivided half share of the immovable property and letting enterprise with KTR Sport Proprietary Limited. Effective date 29 November 2012.
Non-current assets – 42 500 – 42 500
Current assets – – – –
Current liabilities – 311 – 311
Income – 3 266 – 3 266
Chris Hani Crossing (50% interest)
Undivided half share of the immovable property and letting enterprise with Chris Hani Crossing Share Block Proprietary Limited. Effective date 24 August 2012.
Non-current assets 300 500 279 500 300 500 279 500
Current assets 1 445 3 586 1 445 3 586
Current liabilities – – – –
Income 30 393 28 327 30 393 28 327
Expenses 2 545 2 868 2 545 2 868
Dawn Distribution Centre (50% interest)
Undivided half share of the immovable property and letting enterprise with Fin Properties 107 Proprietary Limited. Effective date 2 April 2012.
Non-current assets 240 000 225 000 240 000 225 000
Current liabilities 1 432 1 432
Income 19 624 18 170 19 624 18 170
NOTES TO THE CONSOLIDATED FINANCIAL STATEMENTS continued
for the year ended 31 August 2015
GROUP COMPANY
Note2015R000
2014R000
2015R000
2014R000
45 JOINTLY CONTROLLED ASSETS
East Rand Mall (50% interest)
Undivided half share of the immovable property and letting enterprise with Vukile Property Fund Limited. Effective date 2 April 2014.
Non-current assets 1 187 000 1 108 500 – –
Current assets 13 256 17 212 – –
Current liabilities 6 069 13 445 – –
Income 94 379 90 243 – –
Expenses 14 116 11 719 – –
115 West Street (50% interest)
115 West Street, a jointly controlled and co-owned asset between Redefine and 115 West Street Trust, is proportionally consolidated on a line-by-line basis. Effective date 8 August 2014.
Non-current assets 765 412 815 699 765 412 815 699
Current assets 2 455 3 878 2 455 3 878
Current liabilities 1 096 476 1 096 476
Income 57 174 3 461 57 174 3 461
Expenses 356 59 356 59
Maponya Mall (51% interest)
Maponya Mall, a jointly controlled and co-owned asset between Redefine and RJP Maponya Property Investment Trust, is proportionally consolidated on a line-by-line basis. Effective date 27 March 2014.
Non-current assets 702 780 688 500 – –
Current assets 7 173 7 141 – –
Current liabilities 6 529 6 296 – –
Income 61 279 24 710 – –
Expenses 14 868 5 633 – –
Dock Road (50% interest)
1 Dock Road, a jointly controlled and co-owned asset between Redefine and Ingenuity Property Investments Limited, is proportionally consolidated on a line by line basis. Effective date 13 August 2008.
Non-current assets – 47 000 – 47 000
Current assets – 1 – 1
Current liabilities – 30 – 30
Income – 383 – 383
Expenses – 475 – 475
Redefine Group Annual Financial Statements 2015 83
SECT
ION
1
82
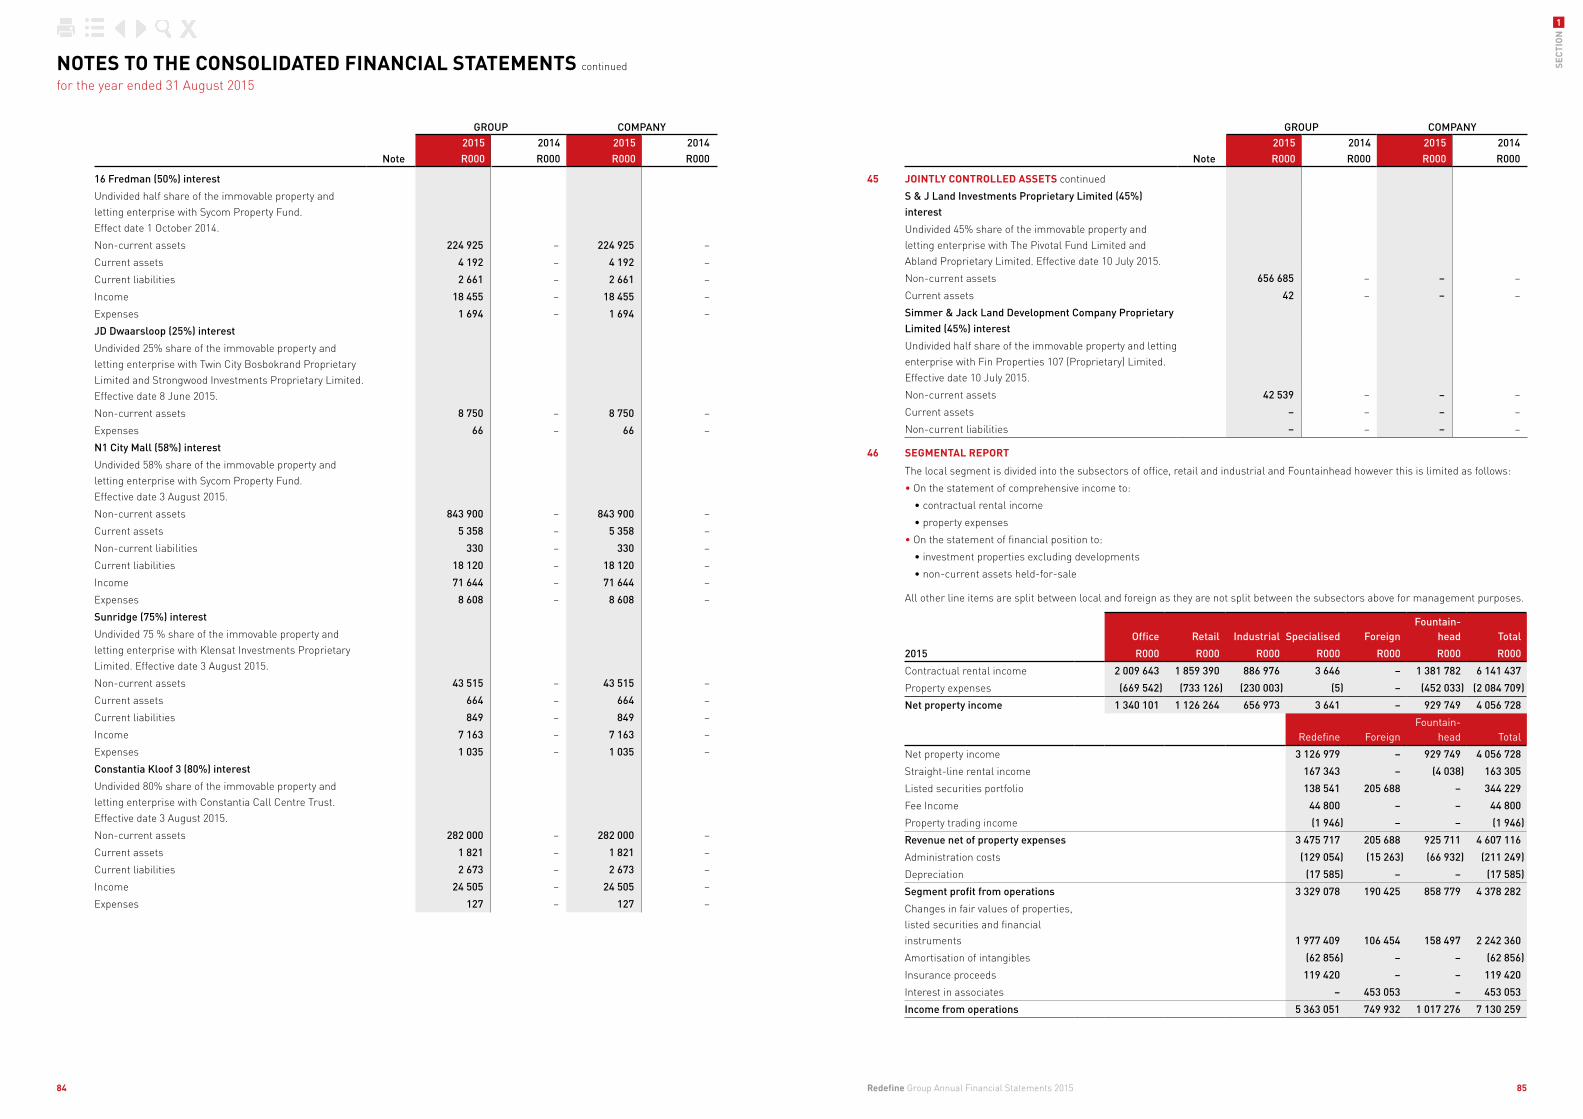
NOTES TO THE CONSOLIDATED FINANCIAL STATEMENTS continued
for the year ended 31 August 2015
GROUP COMPANY
Note2015R000
2014R000
2015R000
2014R000
45 JOINTLY CONTROLLED ASSETS continued
S & J Land Investments Proprietary Limited (45%) interest
Undivided 45% share of the immovable property and letting enterprise with The Pivotal Fund Limited and Abland Proprietary Limited. Effective date 10 July 2015.
Non-current assets 656 685 – – –
Current assets 42 – – –
Simmer & Jack Land Development Company Proprietary Limited (45%) interest
Undivided half share of the immovable property and letting enterprise with Fin Properties 107 (Proprietary) Limited. Effective date 10 July 2015.
Non-current assets 42 539 – – –
Current assets – – – –
Non-current liabilities – – – –
46 SEGMENTAL REPORT
The local segment is divided into the subsectors of office, retail and industrial and Fountainhead however this is limited as follows:
• On the statement of comprehensive income to:
• contractual rental income
• property expenses
• On the statement of financial position to:
• investment properties excluding developments
• non-current assets held-for-sale
All other line items are split between local and foreign as they are not split between the subsectors above for management purposes.
Office Retail Industrial Specialised ForeignFountain-
head Total
2015 R000 R000 R000 R000 R000 R000 R000
Contractual rental income 2 009 643 1 859 390 886 976 3 646 – 1 381 782 6 141 437
Property expenses (669 542) (733 126) (230 003) (5) – (452 033) (2 084 709)
Net property income 1 340 101 1 126 264 656 973 3 641 – 929 749 4 056 728
Redefine ForeignFountain-
head Total
Net property income 3 126 979 – 929 749 4 056 728
Straight-line rental income 167 343 – (4 038) 163 305
Listed securities portfolio 138 541 205 688 – 344 229
Fee Income 44 800 – – 44 800
Property trading income (1 946) – – (1 946)
Revenue net of property expenses 3 475 717 205 688 925 711 4 607 116
Administration costs (129 054) (15 263) (66 932) (211 249)
Depreciation (17 585) – – (17 585)
Segment profit from operations 3 329 078 190 425 858 779 4 378 282
Changes in fair values of properties, listed securities and financial instruments 1 977 409 106 454 158 497 2 242 360
Amortisation of intangibles (62 856) – – (62 856)
Insurance proceeds 119 420 – – 119 420
Interest in associates – 453 053 – 453 053
Income from operations 5 363 051 749 932 1 017 276 7 130 259
GROUP COMPANY
Note2015R000
2014R000
2015R000
2014R000
16 Fredman (50%) interest
Undivided half share of the immovable property and letting enterprise with Sycom Property Fund. Effect date 1 October 2014.
Non-current assets 224 925 – 224 925 –
Current assets 4 192 – 4 192 –
Current liabilities 2 661 – 2 661 –
Income 18 455 – 18 455 –
Expenses 1 694 – 1 694 –
JD Dwaarsloop (25%) interest
Undivided 25% share of the immovable property and letting enterprise with Twin City Bosbokrand Proprietary Limited and Strongwood Investments Proprietary Limited. Effective date 8 June 2015.
Non-current assets 8 750 – 8 750 –
Expenses 66 – 66 –
N1 City Mall (58%) interest
Undivided 58% share of the immovable property and letting enterprise with Sycom Property Fund. Effective date 3 August 2015.
Non-current assets 843 900 – 843 900 –
Current assets 5 358 – 5 358 –
Non-current liabilities 330 – 330 –
Current liabilities 18 120 – 18 120 –
Income 71 644 – 71 644 –
Expenses 8 608 – 8 608 –
Sunridge (75%) interest
Undivided 75 % share of the immovable property and letting enterprise with Klensat Investments Proprietary Limited. Effective date 3 August 2015.
Non-current assets 43 515 – 43 515 –
Current assets 664 – 664 –
Current liabilities 849 – 849 –
Income 7 163 – 7 163 –
Expenses 1 035 – 1 035 –
Constantia Kloof 3 (80%) interest
Undivided 80% share of the immovable property and letting enterprise with Constantia Call Centre Trust. Effective date 3 August 2015.
Non-current assets 282 000 – 282 000 –
Current assets 1 821 – 1 821 –
Current liabilities 2 673 – 2 673 –
Income 24 505 – 24 505 –
Expenses 127 – 127 –
Redefine Group Annual Financial Statements 2015 85
SECT
ION
1
84
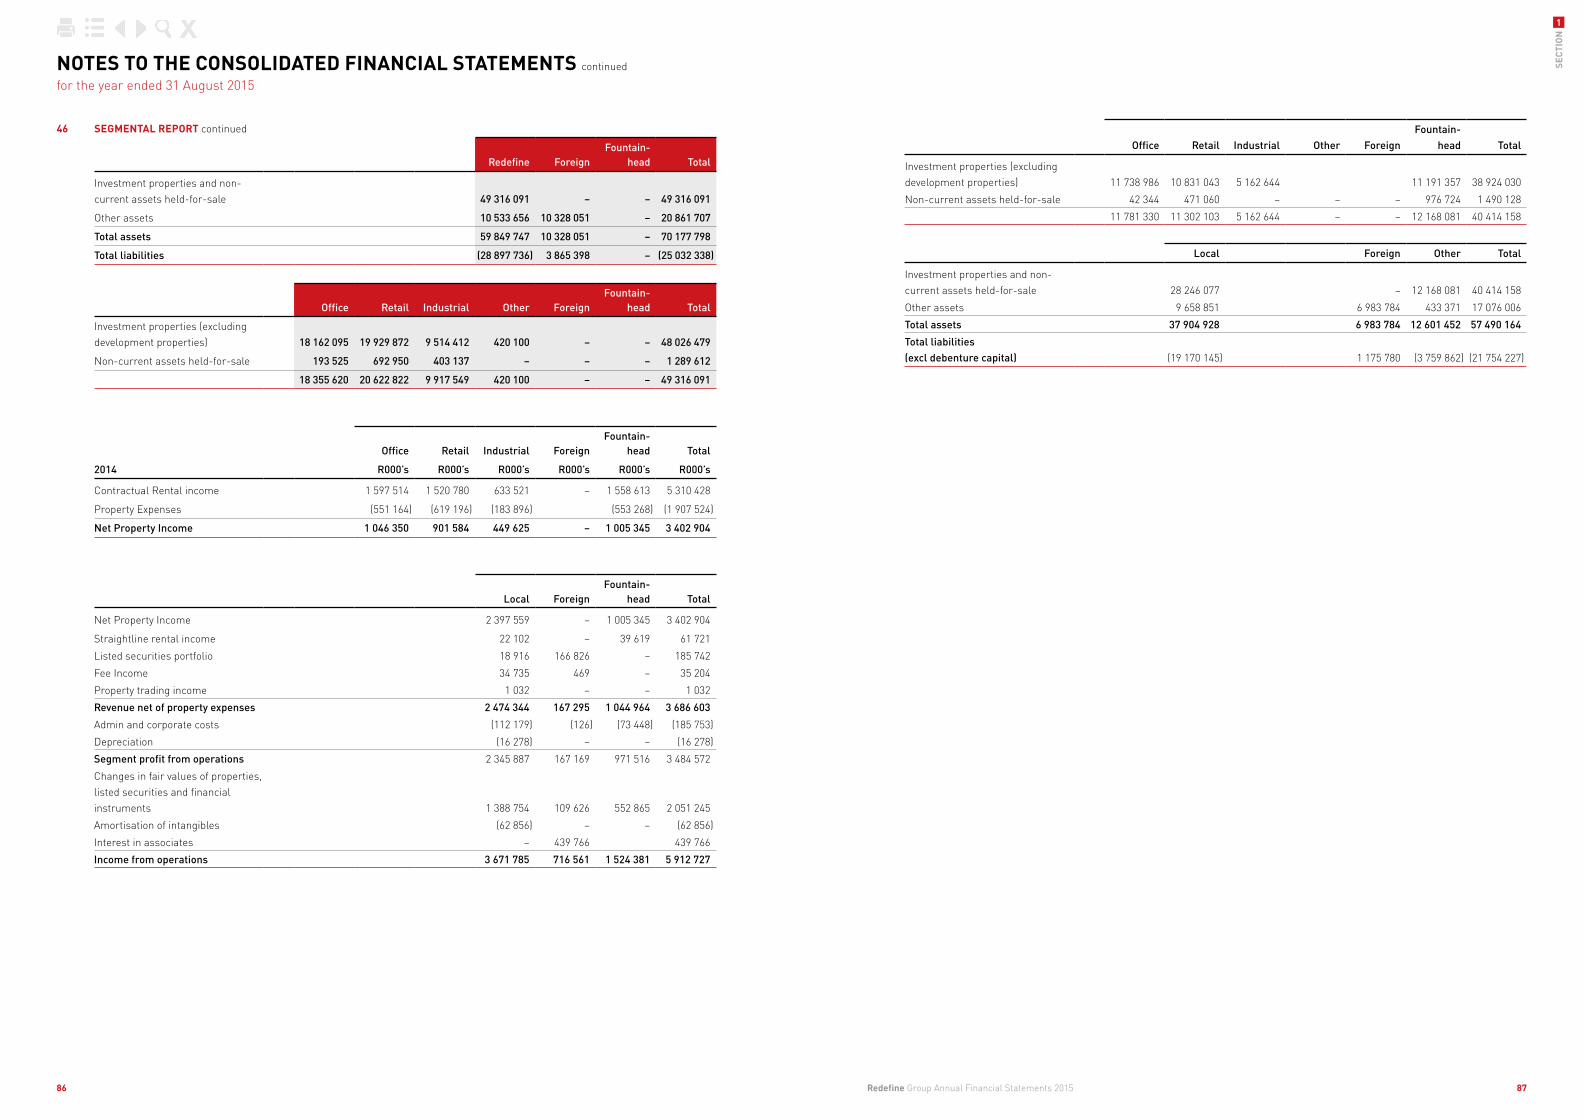
Office Retail Industrial Other ForeignFountain-
head Total
Investment properties (excluding development properties) 11 738 986 10 831 043 5 162 644 11 191 357 38 924 030
Non-current assets held-for-sale 42 344 471 060 – – – 976 724 1 490 128
11 781 330 11 302 103 5 162 644 – – 12 168 081 40 414 158
Local Foreign Other Total
Investment properties and non-current assets held-for-sale 28 246 077 – 12 168 081 40 414 158
Other assets 9 658 851 6 983 784 433 371 17 076 006
Total assets 37 904 928 6 983 784 12 601 452 57 490 164
Total liabilities (excl debenture capital) (19 170 145) 1 175 780 (3 759 862) (21 754 227)
NOTES TO THE CONSOLIDATED FINANCIAL STATEMENTS continued
for the year ended 31 August 2015
46 SEGMENTAL REPORT continued
Redefine ForeignFountain-
head Total
Investment properties and non-current assets held-for-sale 49 316 091 – – 49 316 091
Other assets 10 533 656 10 328 051 – 20 861 707
Total assets 59 849 747 10 328 051 – 70 177 798
Total liabilities (28 897 736) 3 865 398 – (25 032 338)
Office Retail Industrial Other ForeignFountain-
head Total
Investment properties (excluding development properties) 18 162 095 19 929 872 9 514 412 420 100 – – 48 026 479
Non-current assets held-for-sale 193 525 692 950 403 137 – – – 1 289 612
18 355 620 20 622 822 9 917 549 420 100 – – 49 316 091
Office Retail Industrial ForeignFountain-
head Total
2014 R000’s R000’s R000’s R000’s R000’s R000’s
Contractual Rental income 1 597 514 1 520 780 633 521 – 1 558 613 5 310 428
Property Expenses (551 164) (619 196) (183 896) (553 268) (1 907 524)
Net Property Income 1 046 350 901 584 449 625 – 1 005 345 3 402 904
Local ForeignFountain-
head Total
Net Property Income 2 397 559 – 1 005 345 3 402 904
Straightline rental income 22 102 – 39 619 61 721
Listed securities portfolio 18 916 166 826 – 185 742
Fee Income 34 735 469 – 35 204
Property trading income 1 032 – – 1 032
Revenue net of property expenses 2 474 344 167 295 1 044 964 3 686 603
Admin and corporate costs (112 179) (126) (73 448) (185 753)
Depreciation (16 278) – – (16 278)
Segment profit from operations 2 345 887 167 169 971 516 3 484 572
Changes in fair values of properties, listed securities and financial instruments 1 388 754 109 626 552 865 2 051 245
Amortisation of intangibles (62 856) – – (62 856)
Interest in associates – 439 766 439 766
Income from operations 3 671 785 716 561 1 524 381 5 912 727
Redefine Group Annual Financial Statements 2015 87
SECT
ION
1
86

revealSection 2: Property informationEnsuring we are the property owner of choice, with a strategic focus on delivering sustained value to stakeholders. We’re not landlords. We’re people.
Sasfin head office, Waverley, Johannesburg
Redefine Group Annual Financial Statements 2015 8988

Multi/Single Property ProvinceValuation
R000GLA
m²GMR
RGMRR/m²
Vacancym2
Multi Grayston Ridge Office Park Sandton 123 955 11 573 845 770 109 3 834
Single ABSA Investments Campus Greater JHB 119 130 10 469 1 544 474 148 –
Multi Nedbank Centre Nelspruit Other 118 100 15 367 1 215 416 111 4 429
Multi Hatfield Square Pretoria 115 500 – 53 880 – –
Multi Rosebank Corner Greater JHB 114 265 9 625 992 729 123 1 562
Single Accenture Greater JHB 113 300 6 520 831 439 128 –
Multi Cross Place Greater JHB 111 983 5 281 930 160 177 26
Multi Opera Plaza Pretoria Pretoria 103 700 14 912 1 376 122 94 199
Multi Thornhill Office Park Greater JHB 101 500 9 506 960 467 110 798
Multi 150 Rivonia Road Office Park Greater JHB 99 562 6 021 775 607 137 353
Single Glenrand M I B House Greater JHB 98 888 12 832 1 384 847 108 –
Multi Essex Gardens KwaZulu-Natal 98 000 8 374 844 500 121 1 417
Single 240 Justice Mohamed Street Pretoria 97 571 13 087 1 566 815 120 –
Single Heron Place Western Cape 95 000 4 734 672 080 142 –
Single Wheat Board Pretoria 94 200 13 109 873 608 67 –
Multi 222 Smit Street Greater JHB 93 200 21 433 984 359 58 4 428
Multi Knowledge Park Western Cape 92 300 6 210 703 918 113 –
Multi 2 Fricker Road Greater JHB 92 000 4 135 605 871 163 408
Single Batho Pele House Pretoria 92 000 14 258 1 491 244 105 –
Single Shell House KwaZulu-Natal 90 236 14 022 1 379 022 98 –
Multi Shorburg Pretoria 89 800 14 044 1 034 752 81 1 214
Multi Kimberley-Clark House Greater JHB 89 500 6 037 705 741 117 –
Multi Mineralia Building Greater JHB 89 000 13 605 1 454 103 107 –
Multi 17 Harrison Street Greater JHB 87 600 12 379 1 308 279 107 207
Multi Surrey Place Greater JHB 85 084 12 006 710 414 80 3 178
Multi Matlotlo House Greater JHB 81 400 13 853 1 428 276 106 326
Multi Wembley 3 Western Cape 80 000 4 765 573 421 121 11
Single 18 The Boulevard KwaZulu-Natal 78 576 5 232 727 310 148 324
Multi Redefine Place Greater JHB 78 072 4 567 3 920 1 –
Multi Stonewedge Sandton 74 416 7 084 654 841 107 992
Single 2 Pybus Road Sandton 73 929 4 531 534 764 118 –
Multi Hollard House & Parkade Greater JHB 72 600 10 414 819 377 86 927
Multi Silver Point Office Park Sandton 71 000 4 188 593 400 142 –
Multi Dunkeld Office Park Greater JHB 70 580 5 631 693 445 128 234
Single 260 Justice Mohamed Street Pretoria 68 284 1 – – –
Multi Cedarwood House Greater JHB 67 995 4 624 629 919 136 –
Multi Curator Pretoria 66 000 8 928 729 294 121 2 887
Multi Parliament Towers Western Cape 64 200 8 620 940 097 109 –
Multi Outspan House Pretoria 62 800 7 480 510 628 103 2 543
Single Hyde Park Manor Greater JHB 59 620 4 688 505 759 108 –
Multi Ethos Building Greater JHB 59 406 2 496 379 112 152 –
Multi 7 Sturdee Avenue Greater JHB 58 153 4 011 493 452 123 –
Multi West End Shopping Centre Other 57 500 20 971 892 412 61 6 298
Single Emanzeni Pretoria 56 100 9 340 945 955 101 –
Multi Treasury House KwaZulu-Natal 52 797 9 762 824 344 85 87
Single Nashua House Greater JHB 51 900 7 551 – – 7 551
Multi Delmat House KwaZulu-Natal 51 600 4 499 389 924 120 1 259
Multi Wedgefield Sandton 51 006 4 109 431 006 116 405
Multi 66 Peter Place Sandton 50 849 4 273 470 898 120 358
Multi Boskruin Village Office Park Greater JHB 50 840 6 495 582 032 95 382
PROPERTY INFORMATION
SECTORAL SUMMARY AS AT 31 AUGUST 2015 – R’000
Office Retail Industrial Specialised Total
Investment property 18 162 095 19 929 872 9 514 412 420 100 48 026 479
Non-current assets held-for-sale 193 525 692 950 403 137 – 1 289 612
Development 1 102 028 192 424 577 938 – 1 872 390
Properties held-for-trading – 1 080 – – 1 080
19 457 648 20 816 326 10 495 487 420 100 51 189 561
OFFICE
Multi/Single Property ProvinceValuation
R000GLA
m²GMR
RGMRR/m²
Vacancym2
Multi Black River Office Park Western Cape 1 054 000 52 603 6 021 097 115 127 Multi The Towers Western Cape 878 000 54 316 5 678 418 117 5 616
Single 115 West Street (50%) Sandton 765 412 20 546 3 946 407 192 –
Single 155 West Street Sandton 536 400 24 501 3 952 320 161 –
Multi 90 Grayston Drive Sandton 482 000 19 651 2 547 877 146 2 194
Single Thibault Square Western Cape 438 000 30 480 3 828 295 141 3 421
Multi Silver Stream Business Park Sandton 425 000 20 657 2 632 210 130 355
Multi Convention Tower Western Cape 401 000 17 854 3 208 963 259 5 450
Multi Commerce Square Sandton 380 000 16 893 2 263 242 141 868
Multi Boulevard Office Park F&G Western Cape 361 000 16 251 1 836 443 115 341
Multi Observatory Business Park Western Cape 358 000 18 772 2 221 416 119 70
Multi Wembley 2 Western Cape 353 000 17 098 2 168 272 128 144
Multi Poyntons Pretoria 352 000 65 184 5 247 481 82 1 017
Multi Hampton Office Park Sandton 322 000 21 314 2 374 688 121 1 638
Multi Jewel City Greater JHB 316 000 42 360 3 111 084 91 8 063
Single Douglas Roberts Centre Greater JHB 287 000 19 166 2 445 472 128 –
Single Pier Place Western Cape 284 000 14 746 2 418 408 164 –
Single Constantia Kloof 3 (80%) Greater JHB 282 000 12 821 1 855 029 145 –
Single 22 Fredman Drive Sandton 260 000 10 974 2 019 308 184 –
Multi Clearwater Office Park Other 255 000 18 825 1 697 428 98 1 499
Single Centurion Gate Other 253 000 11 541 1 456 297 126 –
Single 300 Middel Street Pretoria 250 500 11 404 2 136 067 187 –
Single Ericsson Woodmead Greater JHB 233 398 11 245 1 680 212 149 –
Multi Isivuno House Pretoria 227 000 23 694 2 843 245 120 –
Single 16 Fredman Drive (50%) Sandton 224 925 11 263 1 748 336 155 –
Multi Wembley 1 Western Cape 224 400 10 805 1 333 059 123 –
Multi 111 Commissioner Street Greater JHB 210 000 29 799 3 066 292 109 1 693
Multi 82 Maude Sandton 210 000 10 004 2 113 559 213 84
Single Sasfin Head Office Building Greater JHB 207 038 8 028 1 752 526 218 –
Multi The Old Match Factory Western Cape 204 850 12 160 1 211 563 100 –
Single De Beers House Greater JHB 193 000 11 919 1 009 473 85 –
Multi Esher Place Sandton 190 000 9 667 – – 9 667
Multi Redefine Towers (320 West Street Durban) KwaZulu-Natal 124 975 24 988 2 234 047 131 7 980
Multi Boulevard Office Park A Western Cape 179 500 6 725 1 062 257 158 –
Single CIB Insurance Greater JHB 176 000 7 513 1 056 581 141 –
Multi Thabakgolo Other 154 000 13 625 1 443 536 114 927
Multi Boulevard Office Park B&C Western Cape 152 000 7 749 824 732 118 764
Single AMR Office Park Greater JHB 146 600 10 563 870 097 104 2 211
Single Knowledge Park II Western Cape 145 800 7 181 1 018 285 142 –
Single 61 Jorrisen Street Greater JHB 141 600 18 181 1 365 490 75 –
Multi Fedsure Forum Pretoria 140 000 28 967 672 883 115 23 121
Multi The Atrium Building Greater JHB 136 690 13 555 655 420 53 1 280
Redefine Group Annual Financial Statements 2015 91
SECT
ION
90
2

PROPERTY INFORMATION continued
DEVELOPMENT
Multi/Single Property ProvinceValuation
R000GLA
m²GMR
RGMRR/m²
Vacancym2
90 Rivonia Road Sandton 775 800 35 636 – – 9 500
Rosebank Towers (42.5%) Greater JHB 251 878 – – – –
15 Baker Street Greater JHB 74 350 – – – –
1 102 028 35 636 9 500
19 457 648 1 439 865 182 011
RETAIL
Multi/Single Property ProvinceValuation
R000GLA
m²GMR
RGMRR/m²
Vacancym2
Multi Centurion Mall Pretoria 3 814 702 119 089 21 750 687 193 6 583 Multi Blue Route Mall Western Cape 1 256 000 55 501 9 230 008 168 588 Multi East Rand Mall (50%) Greater JHB 1 097 000 31 257 10 496 007 336 –Multi Golden Walk Greater JHB 898 000 45 129 7 343 605 165 631 Multi Matlosana Mall Other 893 000 64 624 7 284 681 129 8 094 Multi Kenilworth Centre Western Cape 868 500 48 947 7 490 409 157 1 103 Multi N1 City Mall (58%) Western Cape 843 900 37 241 6 082 740 163 Multi The Boulders Shopping
Centre Greater JHB 765 000 49 203 6 797 679 145 2 183 Multi Maponya Mall (51%) Greater JHB 704 093 36 393 10 460 895 303 1 835 Multi Sammy Marks Square Pretoria 668 000 34 124 5 264 254 155 188 Multi Benmore Gardens Shopping
Centre Sandton 637 000 24 091 4 385 195 211 3 352 Multi Park Meadows Greater JHB 484 300 27 370 3 878 214 145 627 Multi Stoneridge Centre Greater JHB 480 000 52 475 4 761 931 98 3 833 Multi Langeberg Mall Western Cape 430 000 30 089 3 507 359 123 1 566 Single Chris Hani Crossing (50%) Greater JHB 300 500 20 325 2 508 391 123 –Multi Bryanston Shopping Centre Greater JHB 291 000 13 686 2 494 513 188 412 Multi Ottery Centre Western Cape 282 000 30 781 2 256 103 75 631 Multi Standard Bank Centre
Pretoria Pretoria 245 200 23 715 2 891 330 141 3 188 Multi The Village @ Horizon Greater JHB 240 000 19 767 2 080 236 113 1 388 Multi Maynard Mall Western Cape 236 000 23 629 2 467 629 105 76 Multi Southcoast Mall KwaZulu-Natal 227 000 31 513 2 872 886 104 3 947 Multi Shoprite Park Western Cape 206 500 27 800 1 764 373 68 1 895 Multi Ermelo Mall Other 180 300 19 463 1 638 947 87 536 Multi Oakfields Shopping Centre Greater JHB 170 500 11 428 1 501 318 133 172 Multi Alberton Mall Greater JHB 151 000 16 883 1 608 824 103 1 291 Multi Monument Commercial
Centre Greater JHB 147 200 19 562 1 280 599 65 –Single Jetmart Pretoria Pretoria 133 600 11 008 1 399 944 127 –Multi Witbank Medical Centre Other 133 400 13 896 1 150 431 93 1 536 Multi Besterbrown Other 132 000 14 176 1 384 405 103 787 Multi The Pritchard Street Trust Greater JHB 130 000 15 039 1 623 947 108 –Multi The Mall @ Scottsville KwaZulu-Natal 127 000 14 205 1 534 820 118 1 161 Multi Makhado Crossing Shopping Other 117 000 14 459 1 036 565 86 2 444 Multi Riverhorse Valley KwaZulu-Natal 113 818 12 490 1 776 722 142 –Single Festival Square Greater JHB 108 600 11 041 765 450 69 –Multi Rosebank Mews Greater JHB 105 000 7 294 986 187 153 851 Multi Finpark Pretoria 105 000 2 957 131 006 72 1 140 Multi Riverside Mall Western Cape 99 000 9 589 966 092 103 235 Multi Botshabelo Shopping Centre Other 96 800 15 318 1 560 372 105 438 Multi Moreleta Plaza Pretoria 92 700 8 856 942 282 115 674 Multi Capital Centre
Pietermaritzburg KwaZulu-Natal 90 000 11 074 1 058 429 98 312 Multi Turfloop Plaza Other 87 000 6 837 693 153 106 328 Multi Blue Downs Western Cape 84 900 8 651 859 675 100 19 Multi China Town Western Cape 84 000 8 227 847 473 103 –
Multi/Single Property ProvinceValuation
R000GLA
m²GMR
RGMRR/m²
Vacancym2
Single 2 Rissik Street Greater JHB 48 000 6 110 410 730 69 169
Single Kernick House Greater JHB 47 000 3 564 411 020 115 –Multi BCX Greater JHB 46 015 3 047 5 400 675 3 039 Multi The Avenues Greater JHB 45 480 6 318 144 684 81 4 538 Multi Hatfield Forum East Pretoria 44 000 5 943 382 613 77 1 004 Single Delpen Building Greater JHB 43 800 5 550 509 407 92 –Single Sunridge (50%) Sandton 43 515 2 921 537 737 184 –Multi Knowledge Park III Western Cape 43 200 3 779 374 343 103 135 Multi The Ambridge Office Park Greater JHB 42 000 4 784 399 521 94 547 Multi Domus Pretoria 41 600 5 452 450 757 110 1 364 Multi Warich Close Office Park Greater JHB 41 422 3 318 372 008 129 429 Multi Allhart Park Sandton 41 100 4 666 320 300 110 1 744 Multi 5 Sturdee Avenue Greater JHB 40 632 3 518 178 315 92 1 579 Multi Commisioner House
Bellville Western Cape 40 000 4 019 456 998 114 –Multi 3 Sturdee Avenue Greater JHB 39 236 3 459 552 427 160 –Multi 2 Devonshire Place KwaZulu-Natal 39 000 7 969 621 634 78 50 Multi NBS Building Greater JHB 37 000 11 276 152 487 150 10 262 Multi Accord House KwaZulu-Natal 35 100 3 960 397 727 103 115 Multi Glenashley Views KwaZulu-Natal 30 000 2 807 328 204 133 345 Multi Hartmann & Keppler Greater JHB 30 000 2 014 262 511 130 –Multi Cosmopolitan House Greater JHB 28 800 3 140 234 583 88 469 Multi Crawford House Sandton 28 500 1 907 190 001 124 380 Multi Yellowwood House Greater JHB 28 335 2 814 137 851 107 1 524 Single Duncan Street Pretoria 28 200 1 310 245 716 188 –Multi Standard Bank Nelspruit
Branch Other 24 200 2 374 285 971 120 –Single Nosa Pretoria 24 000 3 770 344 916 91 –Single Embassy House Pretoria 23 600 3 419 – – 3 419 Multi Kent House KwaZulu-Natal 20 600 2 769 180 877 110 1 122 Multi Lakeside Place Greater JHB 18 500 3 629 171 859 91 1 732 Multi Odyssey Place KwaZulu-Natal 15 800 2 052 201 757 110 216 Multi BDO House KwaZulu-Natal 15 600 2 208 204 093 92 –Single ABSA Centurion Pretoria 14 900 1 306 110 923 85 –Parkade/vacant land
Boulevard Annex-CPT Western Cape 12 500 – – – –
Multi RPA Centre Greater JHB 12 377 1 493 104 227 78 159 Multi The Ridge KwaZulu-Natal 11 000 1 014 107 827 108 12 Multi Sevenfold KwaZulu-Natal 6 700 670 74 255 111 –Multi Lakeside Building A Pretoria 298 13 061 601 119 131 8 463 Parkade/vacant land
Kay Street ParkingGreater JHB – – – – –
18 162 095 1 384 649 167 983
HELD-FOR-SALE
Multi/Single Property ProvinceValuation
R000GLA
m²GMR
RGMRR/m²
Vacancym2
Multi 6 Durban Club Place KwaZulu-Natal 57 000 8 842 765 686 90 296
Multi Redefine Towers (320 West Street Durban) KwaZulu-Natal 64 025 – – – –
Single 74 Lorne Street KwaZulu-Natal 26 000 4 162 378 623 91 –
Single Clarins – Waverley Greater JHB 25 000 1 442 258 991 180 –
Multi Lakeside 2 Greater JHB 14 000 4 115 56 391 63 3 213
Multi Chesan Greater JHB 7 500 1 019 – – 1 019
193 525 19 580 4 528
OFFICE continued
Redefine Group Annual Financial Statements 2015 93
SECT
ION
92
2

PROPERTY INFORMATION continued
HELD-FOR-SALE
Multi/Single Property ProvinceValuation
R000GLA
m²GMR
RGMRR/m²
Vacancym2
Multi Cleary Park Shopping Centre Other 456 500 36 291 4 533 426 131 1 777
Multi Kempton Square Shopping Centre Greater JHB 166 450 16 850 1 685 536 107 1 169
Multi Die Anker Pretoria 70 000 12 575 – 12 575 692 950 65 716 15 521
DEVELOPMENT
Multi East Rand Mall (50%) Greater JHB 90 000 Multi Wilgespruit Greater JHB 102 424 – – – –
192 424 –
HELD-FOR-TRADING
Multi Buchanan Square Pretoria 1 080 – – 1 080
20 816 326 1 336 076 82 405
INDUSTRIAL
Multi/Single Property ProvinceValuation
R000GLA
m²GMR
RGMRR/m²
Vacancym2
Multi Pepkor Isando Greater JHB 730 000 107 017 5 201 365 49 –Single Robor Greater JHB 616 800 120 277 4 388 136 36 –Single Macsteel Lilianton Boksburg Greater JHB 502 187 73 071 3 432 922 47 –Single Ellerines Cato Ridge KwaZulu-Natal 312 525 50 333 1 675 804 53 18 503 Single Macsteel VRN Roodekop Greater JHB 296 685 57 645 2 028 119 35 –Single Macsteel Coil Processing Wadeville Western Cape 281 407 52 886 1 923 678 36 –Multi Wingfield Park Greater JHB 270 000 56 486 2 760 603 52 3 822 Single Macsteel Tube & Pipe Usufruct Greater JHB 260 683 68 822 1 846 503 27 –Single Macsteel Trading Germiston South Greater JHB 251 992 56 495 1 722 602 30 –Single Dawn (50%) Greater JHB 240 000 22 069 1 666 218 76 –Single GM Coega Other 211 500 38 000 1 505 757 40 –Single Macsteel Cape Town Greater JHB 191 086 38 340 1 306 254 34 –Multi 190 Barbara Road Greater JHB 170 000 32 157 1 266 684 39 18 Single Heron Industrial Western Cape 163 500 23 803 1 351 475 57 –Multi Mifa Industrial Park Greater JHB 160 000 34 197 1 603 156 47 –Single East Balt Pretoria 136 000 9 471 256 972 58 5 055 Single Macsteel Trading Durban KwaZulu-Natal 129 065 21 540 882 278 41 –Multi Strydom Industrial Park Greater JHB 128 100 24 600 1 469 591 60 –Multi CTX Business Park Western Cape 127 000 18 484 1 018 287 55 –Single 29 Springbok Road Greater JHB 126 673 20 067 1 149 727 57 –Single Macsteel Trading Wadeville Greater JHB 121 241 24 128 828 799 34 –Single Edcon Greater JHB 120 000 23 308 854 797 37 –Single Macsteel Roofing Wadeville Greater JHB 117 877 23 729 805 803 34 –Single 8 Jansen Road Greater JHB 116 300 24 147 1 388 734 58 –Multi Pepsi Greater JHB 109 700 15 575 814 604 52 –Multi Supreme Industrial Park Greater JHB 105 200 29 370 1 125 695 42 2 408 Multi Freeway Centre Greater JHB 101 000 41 827 752 105 28 14 722 Single BMG KwaZulu-Natal 100 000 12 355 823 635 67 –Single 2 Lake Road Greater JHB 99 585 13 547 917 369 68 –Single Macsteel Special Steels Dunswart Greater JHB 97 385 19 334 665 715 34 –Multi Murrayfield KwaZulu-Natal 92 500 16 822 1 113 781 66 –Single Moresport DC Western Cape 91 100 12 991 666 426 51 –Single Coricraft – Stormill Greater JHB 87 046 19 369 796 878 41 –Multi 12 Piet Rautenbach Street Pretoria 82 000 26 947 1 398 636 53 650 Multi Berg River Park Western Cape 80 900 35 664 918 557 26 292 Multi Golf Air Park Western Cape 80 097 14 800 518 019 35 –
Multi/Single Property ProvinceValuation
R000GLA
m²GMR
RGMRR/m²
Vacancym2
Multi Riverside Junction Other 79 000 10 169 652 466 70 867
Multi Matsamo Plaza Other 75 700 7 568 706 717 96 207 Multi Pine Parkade KwaZulu-Natal 71 000 2 983 405 330 180 731 Single Shoprite Polokwane Other 67 000 10 150 244 062 24 –Multi 66 Smal Street Greater JHB 66 100 2 152 598 372 278 –Multi Argyle Centre KwaZulu-Natal 65 400 5 299 659 293 133 354 Multi McCarthy Audi Centre West
Rand Greater JHB 60 745 4 309 633 170 147 –Single Pro Shop Woodmead Greater JHB 59 000 5 190 540 833 104 –Multi Klerksdorp Game Store Other 58 000 10 455 734 697 77 867 Multi Bryanston Carvenience Greater JHB 58 000 3 886 542 241 140 20 Single Unitrans Nissan Clearwater Greater JHB 57 101 4 000 553 727 138 –Multi Posthouse Link Greater JHB 56 000 4 586 500 208 133 822 Multi City Centre Eersterivier Western Cape 55 000 6 582 616 171 96 180 Multi Isipingo Junction KwaZulu-Natal 54 263 5 382 703 408 137 254 Multi Post House Greater JHB 49 000 3 228 452 285 149 202 Multi Vaal Walk Greater JHB 48 500 13 968 811 011 68 2 119 Multi Ellerines Pinetown 1 KwaZulu-Natal 48 100 4 209 529 501 144 530 Multi Shoprite Claremont Western Cape 48 000 4 687 302 444 65 –Single Standard Bank Centurion Pretoria 41 000 2 732 339 245 145 386 Multi Acornhoek Shopping Centre Other 40 000 5 403 560 450 104 –Multi CCMA House Rustenburg Other 36 500 6 398 481 148 98 1 486 Single Williams Hunt Randburg Greater JHB 36 000 3 351 355 270 106 –Single Jet Polokwane Other 35 000 3 289 260 181 79 –Multi Standerton Centre Other 34 600 6 496 294 712 69 2 211 Multi 101 Market Street Greater JHB 32 000 5 177 404 388 78 –Multi African City Greater JHB 31 700 6 594 533 615 88 549 Multi Kemsquare Greater JHB 29 900 7 390 240 103 36 767 Multi Nunnerleys Greater JHB 26 700 778 322 592 415 –Multi Nedbank Mall Greater JHB 23 000 1 211 632 581 522 –Single Southern Motors Greater JHB 20 700 3 863 237 375 61 –Multi Kine Centre Greater JHB 19 200 1 156 409 633 354 –Single Standard Bank George Western Cape 15 500 1 199 171 109 143 –Multi Ellerines Pinetown 2 KwaZulu-Natal 15 100 1 742 177 564 102 –Single Edgars Wynberg Western Cape 14 700 2 606 128 671 49 –Multi Leonita – Mallinick Greater JHB 13 400 1 504 273 196 225 288 Multi Schreiner Chambers Greater JHB 9 900 662 297 675 450 –Multi Tamlea – Arundel Greater JHB 9 600 685 294 058 429 –Parkade/vacant land
JD Dwarsloop (25%)Mpumalanga 8 750 – – – –
Multi Small Street Mall Greater JHB 4 200 119 84 208 708 – 19 929 872 1 270 360 66 884
RETAIL continued
Redefine Group Annual Financial Statements 2015 95
SECT
ION
94
2

PROPERTY INFORMATION continued
Multi/Single Property ProvinceValuation
R000GLA
m²GMR
RGMRR/m²
Vacancym2
Single Aviz Labs Greater JHB 18 800 2 871 202 048 70 –
Single Aristocrat Tech Greater JHB 16 959 2 158 197 595 92 –
Single Macsteel Roofing Queenstown KwaZulu-Natal 13 685 4 674 93 547 20 –
Single Trentyre Spartan 2 Greater JHB 12 500 3 138 118 196 38 –
Single Macsteel Trading Welkom Free State 10 826 5 550 83 134 15 –
Single Macsteel VRN Klerksdorp North West 9 923 2 370 67 832 29 –
Single Macsteel Trading Newcastle KwaZulu-Natal 4 605 2 060 31 479 15 –
Single Precision House Greater JHB 2 500 604 34 028 56 –
Multi Erf 755 Denver Greater JHB 1 507 – – – –
Parkade/vacant land
Erf 4462 Clayville Greater JHB 1 268 – – – –
9 514 412 1 887 779 74 940
HELD-FOR-SALE
Multi/Single Property ProvinceValuation
R000GLA
m²GMR
RGMRR/m²
Vacancym2
Single Premier Milling – Durban KwaZulu-Natal 315 000 38 926 2 097 866 54 –Multi S&J Land Greater JHB 67 637 – – – –Single 16th Street Greater JHB 20 500 3 598 186 958 52 –
403 137 42 524 –
DEVELOPMENT
Multi/Single Property ProvinceValuation
R000GLA
m²GMR
RGMRR/m²
Vacancym2
S&J Land Investment Greater JHB 248 688 – –Cornubia KwaZulu-Natal 200 000 – – – –Isando DC Greater JHB 96 250 – – – –Fabric Park Greater JHB 33 000 – – – –Waltloo DC Pretoria – 25 175 – – 25 175
577 938 25 175 25 175 10 495 487 1 955 478 100 115
SPECIALISED
Multi/Single Property ProvinceValuation
R000GLA
m²GMR
RGMRR/m²
Vacancym2
Single Bedford Gardens Hospital Greater JHB 331 600 12 817 2 259 604 176 –
SingleSouthern Sun OR Thambo International Airport Greater JHB 88 500 14 153 1 496 015 106 –
420 100 26 970
Multi/Single Property ProvinceValuation
R000GLA
m²GMR
RGMRR/m²
Vacancym2
Single City Deep 45 & 46 Greater JHB 76 000 13 407 676 023 50 –Single Macsteel Trading Klerksdorp North West 74 953 15 263 512 372 34 –Single Schneider Electric South Africa Greater JHB 73 471 9 788 626 123 64 –Single Schneider Midrand Greater JHB 73 000 11 924 596 109 50 –Multi Spearhead
Business Park Western Cape 72 400 13 549 745 811 55 –
Single Aveng Stormill Greater JHB 69 040 5 965 579 196 97 –Single Macsteel Roofing Harvey Greater JHB 68 222 14 133 466 364 33 –Multi Ferreiras North Riding Greater JHB 67 000 27 144 867 766 32 –Multi Eagle Park Western Cape 66 000 7 102 523 476 74 15 Single Macsteel Trading Witbank Mpumalanga 63 353 5 018 433 080 86 –Single Le Sel 1 Greater JHB 61 724 11 606 554 209 48 –Single Le Sel 2 Greater JHB 61 309 10 680 550 635 52 –Single GNLD International Greater JHB 60 503 5 477 601 758 110 –Single Buco Greater JHB 59 100 27 000 730 000 27 –Single BAT Greater JHB 57 547 6 748 463 317 69 –Single Trentyre Spartan Greater JHB 57 200 12 344 566 257 46 –Multi Platinum Park Western Cape 56 000 9 362 617 772 66 –Multi 18 Halifax Road KwaZulu-Natal 54 867 15 853 448 489 54 7 584 Single 56 Rigger Road Greater JHB 54 000 16 216 608 096 37 –Single S Burde Greater JHB 54 000 19 047 526 690 28 –Multi 101 Lawley KwaZulu-Natal 53 499 33 249 669 512 20 –Multi Amalgamated Inv – Tedelex Greater JHB 52 000 17 512 475 281 27 –Single 14 Piet Rautenbach Street (50%) Pretoria 52 000 7 834 359 797 46 –Single SSAB Greater JHB 50 952 9 473 542 239 57 –Single ITT Flygt Greater JHB 50 420 5 941 557 307 94 –Single Macsteel Trading Rustenburg North West 48 904 7 860 343 854 44 –Single 11 Galaxy Avenue Greater JHB 48 789 6 217 436 269 70 –Single Erf 681 – Alrode Greater JHB 48 400 20 935 465 221 22 –Single Macsteel VRN Pinetown KwaZulu-Natal 48 054 7 517 328 491 44 –Multi Creation Other 47 500 28 723 460 886 25 10 342 Single 26-28 Christiaan Avenue Western Cape 45 900 13 727 422 452 31 –Multi Ohm Street Industrial Park Greater JHB 43 800 12 773 508 790 40 180 Single Jupiter Ext. 1 Greater JHB 42 700 11 507 379 838 33 –Single Macsteel Trading Bloemfontein Free State 39 445 4 947 269 644 55 –Single Macsteel Trading Nelspruit Mpumalanga 39 075 5 262 284 919 54 –Single Trencor Western Cape 39 000 6 861 293 767 43 –Single Macsteel Special Steels Meyerton Greater JHB 37 203 11 693 254 314 22 –Single African Glass – Denver Greater JHB 35 900 7 768 344 870 44 –Single Macsteel VRN
Richards Bay KwaZulu-Natal 34 952 4 117 238 928 58 –Multi 77 & 78 Plane Road Greater JHB 33 000 8 686 371 291 43 –Single 21 Wrench Road Greater JHB 33 000 – – – –Multi Denver Industrial Park Greater JHB 32 700 12 830 419 015 36 1 286 Multi 12 Nourse Avenue Western Cape 32 200 10 581 308 227 29 –Single 52 Mimetes Road Greater JHB 29 900 7 567 265 891 35 –Single Macsteel Kimberley Free State 27 528 6 822 188 179 28 –Multi 2 Sterling Road Greater JHB 27 500 7 144 343 344 48 –
Single Macsteel Trading Pretoria Pretoria 27 395 7 698 187 273 24 –
Single 66 Mimetes Road Greater JHB 27 000 5 903 312 737 53 –
Single 64 Mimetes Road Greater JHB 22 000 5 136 243 950 47 –
Single Macsteel VRN Rustenburg North West 21 789 4 724 148 949 32 –
Single Macsteel VRN Vaal Greater JHB 21 510 6 943 147 044 21 –
Single HK Manufacturing Parow Western Cape 21 000 9 041 278 525 31 –
Single 5 Laub Street Greater JHB 20 000 10 063 – – 10 063
INDUSTRIAL continued
Redefine Group Annual Financial Statements 2015 97
SECT
ION
96
2

PROPERTY INFORMATION continued
PROPERTY PORTFOLIOTENANT GRADING OF TOTAL PORTFOLIO
2015
Grade SectorGMR
%GLA
m²GLA
%Tenant
count
Grade A 60.9 2 413 055 50.7 1 295
Office 23.6 773 722 16.3 222
Retail 27.2 779 111 16.4 1 019
Industrial 9.1 833 252 17.5 52
Specialised 0.9 26 970 0.6 2
Grade B 24.7 1 612 329 33.9 624
Office 9.1 345 311 7.3 202
Retail 6.3 343 752 7.2 215
Industrial 9.2 923 266 19.4 207
Specialised – – – –
Grade C 14.4 368 472 7.7 3 094
Office 3.3 138 820 2.9 1036
Retail 10.0 130 808 2.7 1816
Industrial 1.1 98 844 2.1 242
Specialised – – – –
Total excluding vacancy 4 393 857 92.3 5 013
Office – 194 586 4.1
Retail – 69 830 1.5
Industrial – 100 115 2.1
Specialised – – –
Total vacancy 364 531 7.7
Total 100.0 4 758 388 100.0 5 013
Redefine’s policy is to lease space to quality tenants with a high likelihood of renewal. Redefine classifies its tenants across all sectors as follows:
Grade A: Companies that trade out of multiple geographic locations and/or serve a diverse customer base and generally occupying more than 2 000 m2
Grade B: Companies that have multiple offices although these may not be geographically dispersed, serve a reasonably diverse customer base, and generally occupying more than 1 000 m2 of space
Grade C: Comprises individuals and sole proprietorships as well as other legal entities that trade out of one or very few locations occupying less than 200 m2
LEASE EXPIRY PROFILE BY SECTOR(% of GLA)
Office Retail Industrial Specialised
MONTHLY 2016 2017 2018 2019 BEYOND 2019 VACANCY0
20
40
60
80
100
84 2.28
0 0 0 0 0 0
19 1610
20
15 14 17
511
8 8 6
94 4
100
2432
62
rememberSection 3: General informationAs we look to the future, we believe that the creation of innovative, functional and environmentally-friendly working and living spaces will be fundamental to our business.
90 Grayston, Sandton, Johannesburg
Redefine Group Annual Financial Statements 2015 99
SECT
ION
98
3
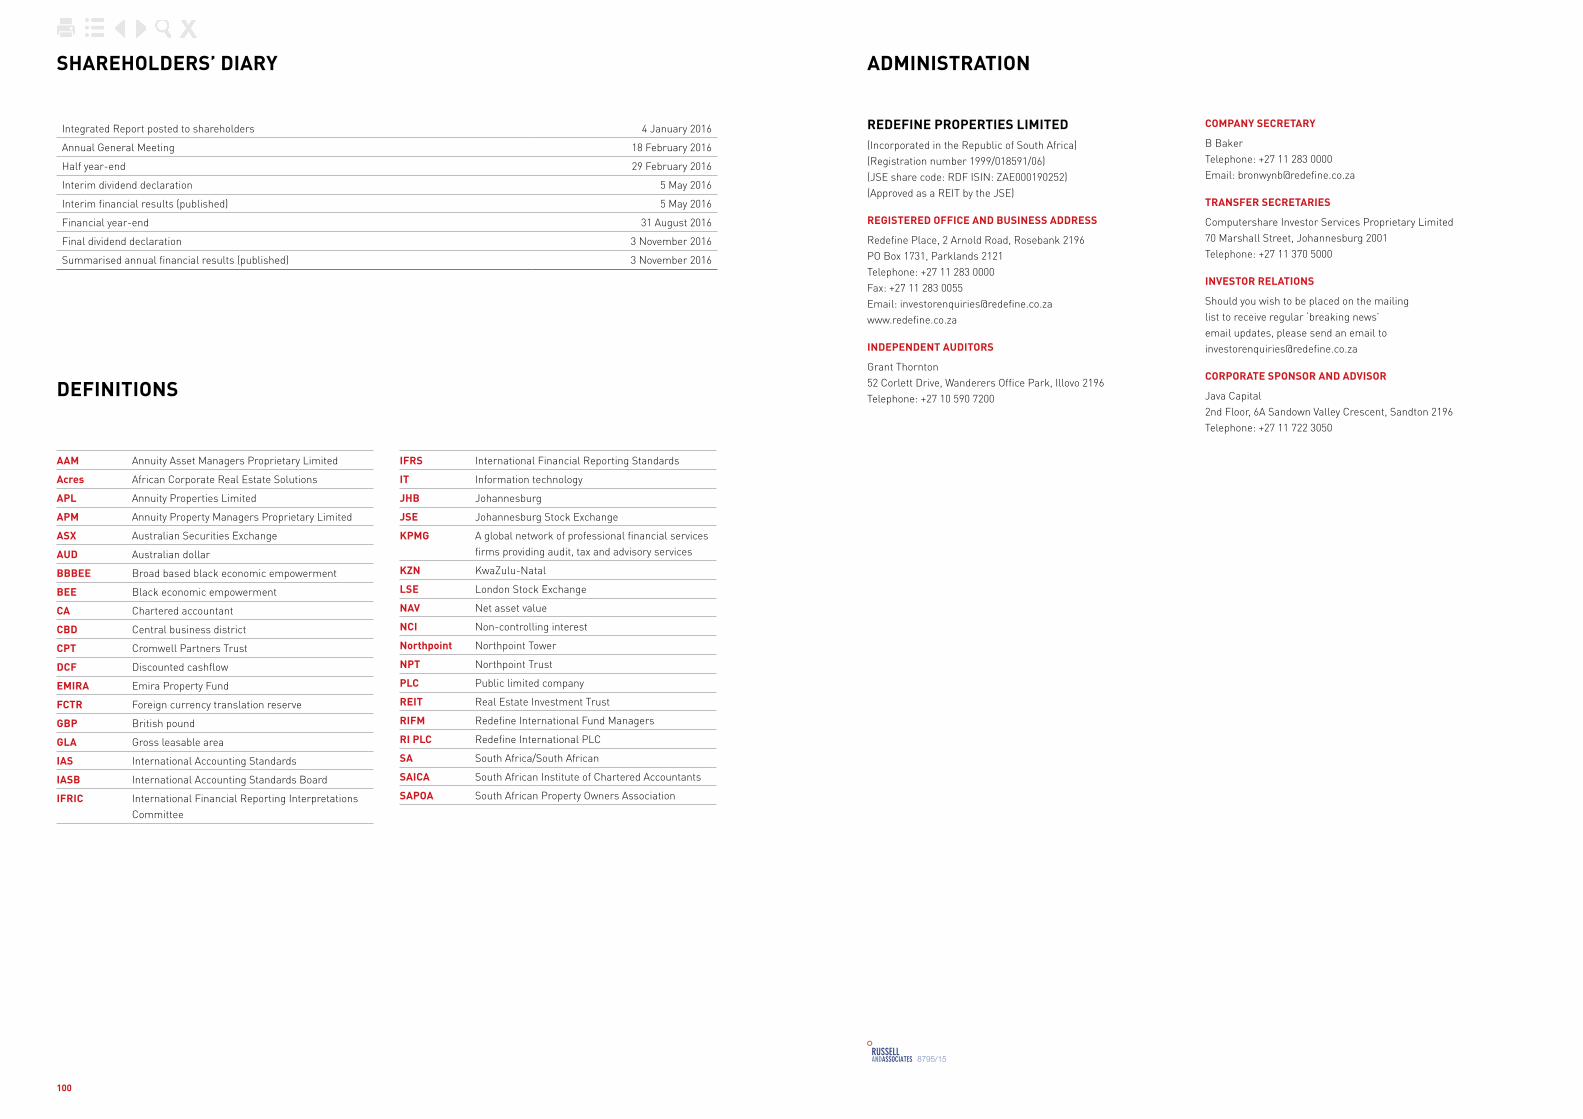
AAM Annuity Asset Managers Proprietary Limited
Acres African Corporate Real Estate Solutions
APL Annuity Properties Limited
APM Annuity Property Managers Proprietary Limited
ASX Australian Securities Exchange
AUD Australian dollar
BBBEE Broad based black economic empowerment
BEE Black economic empowerment
CA Chartered accountant
CBD Central business district
CPT Cromwell Partners Trust
DCF Discounted cashflow
EMIRA Emira Property Fund
FCTR Foreign currency translation reserve
GBP British pound
GLA Gross leasable area
IAS International Accounting Standards
IASB International Accounting Standards Board
IFRIC International Financial Reporting Interpretations Committee
SHAREHOLDERS’ DIARY
DEFINITIONS
Integrated Report posted to shareholders 4 January 2016
Annual General Meeting 18 February 2016
Half year-end 29 February 2016
Interim dividend declaration 5 May 2016
Interim financial results (published) 5 May 2016
Financial year-end 31 August 2016
Final dividend declaration 3 November 2016
Summarised annual financial results (published) 3 November 2016
ADMINISTRATION
8795/15
REDEFINE PROPERTIES LIMITED(Incorporated in the Republic of South Africa)(Registration number 1999/018591/06)(JSE share code: RDF ISIN: ZAE000190252)(Approved as a REIT by the JSE)
REGISTERED OFFICE AND BUSINESS ADDRESS
Redefine Place, 2 Arnold Road, Rosebank 2196PO Box 1731, Parklands 2121Telephone: +27 11 283 0000Fax: +27 11 283 0055Email: [email protected]
INDEPENDENT AUDITORS
Grant Thornton52 Corlett Drive, Wanderers Office Park, Illovo 2196Telephone: +27 10 590 7200
COMPANY SECRETARY
B BakerTelephone: +27 11 283 0000Email: [email protected]
TRANSFER SECRETARIES
Computershare Investor Services Proprietary Limited70 Marshall Street, Johannesburg 2001Telephone: +27 11 370 5000
INVESTOR RELATIONS
Should you wish to be placed on the mailinglist to receive regular ‘breaking news’email updates, please send an email [email protected]
CORPORATE SPONSOR AND ADVISOR
Java Capital2nd Floor, 6A Sandown Valley Crescent, Sandton 2196Telephone: +27 11 722 3050
IFRS International Financial Reporting Standards
IT Information technology
JHB Johannesburg
JSE Johannesburg Stock Exchange
KPMG A global network of professional financial services firms providing audit, tax and advisory services
KZN KwaZulu-Natal
LSE London Stock Exchange
NAV Net asset value
NCI Non-controlling interest
Northpoint Northpoint Tower
NPT Northpoint Trust
PLC Public limited company
REIT Real Estate Investment Trust
RIFM Redefine International Fund Managers
RI PLC Redefine International PLC
SA South Africa/South African
SAICA South African Institute of Chartered Accountants
SAPOA South African Property Owners Association
100

www.redefine.co.zaWe’re not landlords. We’re people.