group 13 telecom
TRANSCRIPT

8/8/2019 Group 13 Telecom
http://slidepdf.com/reader/full/group-13-telecom 1/43
A report on Telecom Sector
2010
GROUP 13
Aman Singh
Anuj Khemka
Amarendra Gorai
Karan Malhotra
2010
Telecom Sector Report
Investment Bank of Kozhikode
Indian Institute of Management, Kozhikode
GROUP 13
Aman Singh
Anuj Khemka
Amarendra Gorai
Karan Malhotra

8/8/2019 Group 13 Telecom
http://slidepdf.com/reader/full/group-13-telecom 2/43
2 | P a g e
CONTENTS
Overview ................................................................ ............................................................... .................................. 5
Evolution ................................................................ ............................................................... .................................. 5
Indian Telecom Industry Framework ............................................................... ....................................................... 6
Indian Government Bodies................................................................................................................................. 6
Independent bodies ......................................................................................................... .................................. 6
Structure of the Industry ........................................................................................................................................ 6
Wire line Sector ................................................................................................................ .................................. 7
Wireless Sector ........................................................... ................................................................. ....................... 7
Government Acts for Regulation Of Telecom Industry .......................................................................................... 9
Important Regulations and their impact ............................................................................................................ 9
Unified Access Service License Regime (UASL) ............................................................................................. . 9
Access Deficit Charges (ADC) ....................................................................................................................... 10
Universal Service Obligation (USO) ......................................................... ..................................................... 10
Foreign Direct Investment .................................................................................................................................... 10
Growth ......................................................... .............................................................. ........................................... 11
Tariff ..................................................................................................................................................................... 12
Current Market: Size and Players ......................................................................................................................... 13
Porter’s Five Forces Analysis ................................................................................................................................ 14
Threats for New Entrants ........................................................................... ...................................................... 14
Incumbent’s wrath ....................................................................................................................................... 14
Declining ARPU ............................................................................................................................................ 14
INFRASTRUCTURE TENANCY COST .......................................................... ..................................................... 14
Customer switching costs ............................................................................................................................ 15
Capital Requirement .................................................................................................................................... 15
Licensing policy ............................................................................................................................................ 15
Bargaining power of buyers ............................................................................................................................. 15
Undifferentiated Products and Services ...................................................................... ................................ 15
Price sensitivity of Buyers ............................................................................................................................ 15

8/8/2019 Group 13 Telecom
http://slidepdf.com/reader/full/group-13-telecom 3/43
3 | P a g e
Buyer Concentration ............................................................................................................... ..................... 16
Bargaining power of suppliers .......................................................... ................................................................ 16
Supplier Concentration ................................................................................................................................ 16
Substitute Inputs ............................................................... ................................................................. .......... 16
Backward and Forward Integration ............................................................................................................. 16
Switching Costs ............................................................................................................................................ 16
Impact of Supplier Prices, Quality, and Service ........................................................................................... 16
Rivalry among existing competitors ................................................................................................................. 17
High exit barriers ............................................................... ................................................................. .......... 17
Short lived advantage of innovation ............................................................................................................ 17
Price wars ............................................................... ................................................................. ..................... 17
Threat of Substitutes ................................................................................................................... ..................... 17
Market SWOT Analysis of the Indian Telecom Sector ................................................................................ .......... 19
Strengths .......................................................................................................................................................... 19
Weaknesses ..................................................... ................................................................. ................................ 19
Opportunities ................................................................................................................................................... 19
Threats ............................................................................................................................................................. 20
Financial Analysis .................................................................................................................................................. 21
Industry Analysis .............................................................................................................................................. 21
Airtel Financial Performance ............................................................................................................................ 24
Idea – Financal Performance .................................................................................................................. .......... 26
Reliance – Financial Performance .................................................................................................................... 28
Tata Communication – Financial Performance ................................................................................................ 29
Spice Mobile – Financial Performance ............................................................................................................. 30
Comparison among different networks ........................................................................... ................................ 31
Recent Events ....................................................................................................................................................... 33
3G and BWA Auction .............................................................................................. .......................................... 33
Virtual Consolidation ............................................................. ................................................................. .......... 36
Major Investments ........................................................................................................................................... 37
Mobile Value added services (MVAS) .............................................................................................................. 38

8/8/2019 Group 13 Telecom
http://slidepdf.com/reader/full/group-13-telecom 4/43
4 | P a g e
A value proposition ...................................................................................................... ................................ 38
Characteristics and Categories ................................................................ ..................................................... 38
Vas Users ..................................................... ................................................................. ................................ 39
Market Size .................................................................................................................................................. 40
The way ahead ............................................................................................................................................. 41
Future Outlook ..................................................................................................................................................... 41
Conclusion ............................................................................................................................................................ 42
References ............................................................................................................................................................ 43

8/8/2019 Group 13 Telecom
http://slidepdf.com/reader/full/group-13-telecom 5/43
5 | P a g e
OVERVIEW
The Indian Telecom Industry has seen a complete transformation since the last 15 years and has
primarily been guided by the growth of the wireless segment. The transformation happened post
liberalization when private players were allowed to enter the market in 1995 and the launch of
mobile services happened. The calling rates have been gradually falling from the initial Rs 25 per
minute to the current 50 paisa per minute with an increase in competition as well as volumes.
The Indian Telecom market is one of the fastest growing markets in the world and is the 2nd largest
in size after China. It reached a milestone of reaching 500 million subscribers in December 2009 and
is said to be growing around 10-15 million subscribers every month.
Here is the current snapshot of the current state of the Industry.
EVOLUTION
Various important laws have been passed in the post liberalization era.

8/8/2019 Group 13 Telecom
http://slidepdf.com/reader/full/group-13-telecom 6/43
6 | P a g e
INDIAN TELECOM INDUSTRY FRAMEWORK
The Telecom sector in India is primarily governed by the Department of Telecommunications (Govt.
of India). It is assisted by an independent body TRAI (Telecom Regulatory Authority of India) that
helps the Government in taking important decisions regarding policies and new technologies
INDIAN GOVERNMENT BODIES
They formulate the various policies that govern the telecom sector in India
Wireless Planning and Coordination (WPC): Handles spectrum allocation and management
Department of Telecommunications : License and frequency management for Telecom
Telecom Commission : Exclusive policy making body of DoT
Group on Telecom and IT : GoT-IT, handles ad hoc issues of the industry
INDEPENDENT BODIES
They undertake various research activities and monitor the quality of service provided in the Indian
telecom industry. They also provide various recommendations to improve the status of telecom
operations in India
TRAI: Telecom regulatory authority of India, setup in 1997 for the protection of consumer
interest and regular monitoring of Quality of Service parameters
TDSAT: Telecom disputes settlement and appellate tribunal, setup in May 2000 to facilitate
an integrated & comprehensive dispute settlement mechanism
STRUCTURE OF THE INDUSTRY
The Indian telecommunication sector can broadly segmented based on the type of service provided
under the following categories:
Indian Telecommunication Sector Segmentation
8/8/2019 Group 13 Telecom
http://slidepdf.com/reader/full/group-13-telecom 7/43
7 | P a g e
WIRE LINE SECTOR
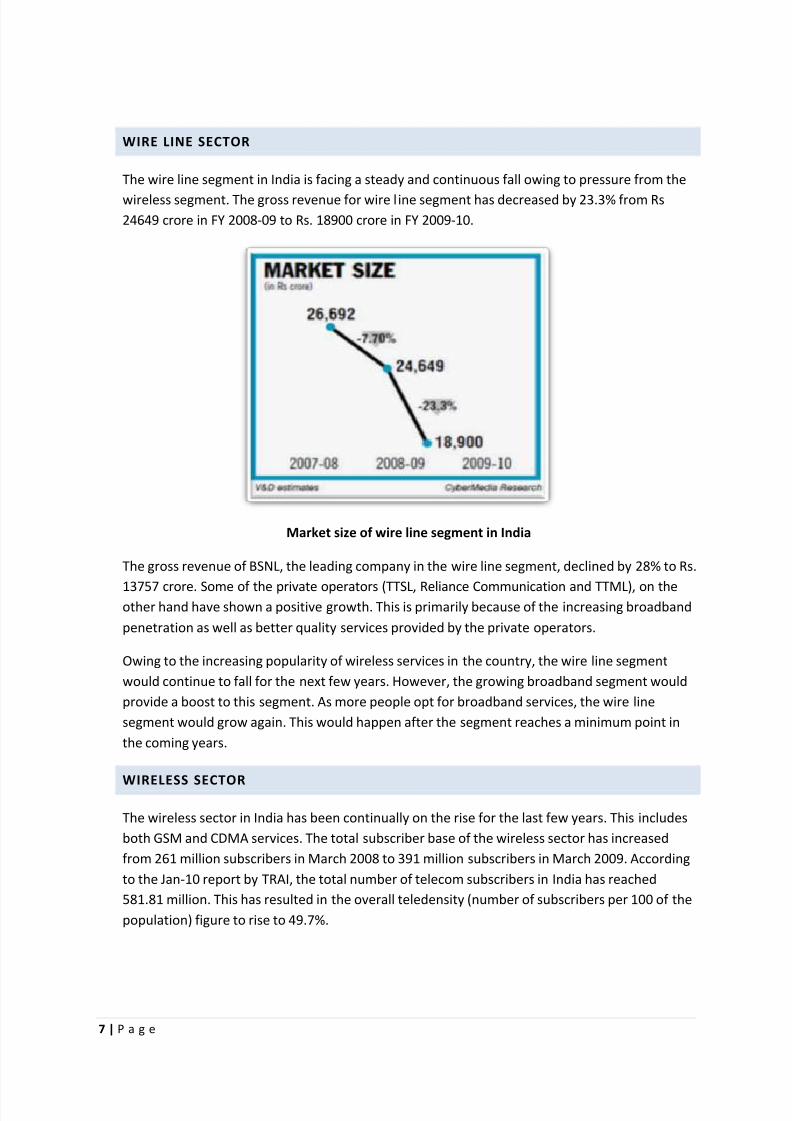
The wire line segment in India is facing a steady and continuous fall owing to pressure from the
wireless segment. The gross revenue for wire l ine segment has decreased by 23.3% from Rs
24649 crore in FY 2008-09 to Rs. 18900 crore in FY 2009-10.
Market size of wire line segment in India
The gross revenue of BSNL, the leading company in the wire line segment, declined by 28% to Rs.
13757 crore. Some of the private operators (TTSL, Reliance Communication and TTML), on theother hand have shown a positive growth. This is primarily because of the increasing broadband
penetration as well as better quality services provided by the private operators.
Owing to the increasing popularity of wireless services in the country, the wire line segment
would continue to fall for the next few years. However, the growing broadband segment would
provide a boost to this segment. As more people opt for broadband services, the wire line
segment would grow again. This would happen after the segment reaches a minimum point in
the coming years.
WIRELESS SECTOR
The wireless sector in India has been continually on the rise for the last few years. This includes
both GSM and CDMA services. The total subscriber base of the wireless sector has increased
from 261 million subscribers in March 2008 to 391 million subscribers in March 2009. According
to the Jan-10 report by TRAI, the total number of telecom subscribers in India has reached
581.81 million. This has resulted in the overall teledensity (number of subscribers per 100 of the
population) figure to rise to 49.7%.

8/8/2019 Group 13 Telecom
http://slidepdf.com/reader/full/group-13-telecom 8/43
8 | P a g e
Subscribers of Wireless Services (GSM & CDMA) (figures in million) (Source:TRAI)
The subscriber base of GSM and CDMA services is also shown separately in the following figures.
In cellular CDMA category, Reliance Communications is the largest operator both in terms of
subscriber base and market share. It is followed by Tata Indicom and then by BSNL. In the
cellular GSM category, Bharti Airtel has consistently been the market leader and has 93.92
million subscribers. Other major operators in the GSM category are Vodafone, BSNL and Idea
with 68.77 million, 46.71 million and 38.89 million respectively.
From the above data, it can be easily inferred that the wireless service segment would continue
to grow at a tremendous rate in the years to come. With the cellular GSM and CDMA service
providers adding value added services and other incentives for customers, the wirelesstelecommunication segment would grow rapidly in the next few years.
The mobile segment is primarily dominated by the Pre-Paid segment with approximately
99% of the new subscriber additions being in prepaid

8/8/2019 Group 13 Telecom
http://slidepdf.com/reader/full/group-13-telecom 9/43
9 | P a g e
Typical Revenue composition of a GSM operator
GOVERNMENT ACTS FOR REGULATION OF TELECOM INDUSTRY
The various telecom India related acts by the Department of Telecommunications India are:
Indian Telegraph Act 1885: This act empowered the government of India to take control of
the existing telegraph lines and lay down the necessary infrastructure for further expansion
of telecommunications in India.
Indian Telegraph Rules 2004: This act set the guidelines for the set up and development of
public telecom services in India.
Indian Wireless Act 1993: According to this act wireless telecom services could be set up
only after due licensing from the telegraphy authority of India.
Information Technology Act 2000: The act defines the information technology based
communications in India. Telecom Industry of India was shown e-commerce way through
this act in a legal manner.
Communication Convergence Bill 2001: This bill declared the establishment of
Communications Commission of India to regulate the transfer of all form of communication
including broadcasting, telecommunications and multimedia.
IMPORTANT REGULATIONS AND THEIR IMPACT
Described below is the impact some of the important regulations passed by the DoT have had on the
Indian telecom Industry
UNIFIED ACCESS SERVICE LICENSE REGIME (UASL)
It marked the end of the license regime in the Indian telecom industry.

8/8/2019 Group 13 Telecom
http://slidepdf.com/reader/full/group-13-telecom 10/43
10 | P a g e
It eliminated the need for different licenses for different services
Players were now allowed to offer both mobile and fixed-line services under a single license
after paying an additional entry fee
It helped in aligning convergent technologies and services
ACCESS DEFICIT CHARGES (ADC)
ADC makes it mandatory for a service provider at the caller’s end to share a percent of the
revenue earned with the service provider at the receiver’s end in long-distance telephony.
This subsidises the infrastructure costs of the service provider enabling access at receiver’s
end, especially because rental for fixed-line services is low
Revision in the ADC regime is expected to be followed by further tariff reduction in telecom
services
UNIVERSAL SERVICE OBLIGATION (USO)
The USO policy was laid to widen the reach of telephony services in rural India
This system was put in place to bridge the wide gap between urban and rural teledensity
All telecom operators are bound to contribute 5 percent of their revenues to this fund.
This system was put in place to bridge the wide gap between urban and rural teledensity
Initially, only basic service providers were under the purview of USO. Later, its scope was
expanded to include mobile services also
Although it increases the cost burden for the telecom companies, USO helps in building the
telecommunication infrastructure in the rural areas.
FOREIGN DIRECT I NVESTMENT
FDI in Indian Telecommunications Industry is one of the most crucial parts that have caused such a
hike in the telecom market so far. India, in the past 15 years have received 10,000 crore of foreign
direct investment and 26 percent of the sum have been invested on the cellular segment.
Telecom is the third largest sector to attract FDI in India in the post-liberalisation era.
Foreign direct investment (FDI) ceilings have been raised from 49 per cent to 74 per cent intelecom services sector.
For telecom equipment manufacturing and provision of IT-enabled services, 100 per cent FDI
is permitted

8/8/2019 Group 13 Telecom
http://slidepdf.com/reader/full/group-13-telecom 11/43
11 | P a g e
39
92108
0
50
100
150
2007-08 2008-09 2009-10
FDI (Indian Rs Mn)
GROWTH
India has become the second largest wireless network in the world, with the number of wireless
connections reaching 525.1 million in Dec 2009. Approximately 85 percent of the Eleventh Five Year
Plan target of 600 million connections has been achieved at the halfway point.
Mobile Connections
High volumes have led to a tremendous decrease in costs and a reduction in the ARPU, as seen by
the trend graph below

8/8/2019 Group 13 Telecom
http://slidepdf.com/reader/full/group-13-telecom 12/43
12 | P a g e
TARIFF
When compared across countries, India has the lowest tariffs per minute falling in the range of 2-3
US cents

8/8/2019 Group 13 Telecom
http://slidepdf.com/reader/full/group-13-telecom 13/43
13 | P a g e
CURRENT MARKET: SIZE AND PLAYERS
27%
21%
13%
13%
10%
8%6%
1% 1%
GSM Market (Q1 2010)
Bharti
Vodafone
IDEA
BSNL
Reliance
Aircel
Tata
MTNL
Unitech
53%37%
6%3% 1%
CDMA Market (Q1 2010)
Reliance
TATA
BSNL
Sistema
Others
The fixed line segment of the Telecom market has seen a stagnant subscriber base of 37 million in
the last 2 years.
73.47%
9.04%
7.54%2.97%
2.58%
4.13%
0.26%
Fixed Line (Q1 2010)
BSNL
MTNL
Bharti Airtel
Relaince
Tata Teleservices
HFCL
Others

8/8/2019 Group 13 Telecom
http://slidepdf.com/reader/full/group-13-telecom 14/43
14 | P a g e
PORTER’S FIVE FORCES ANALYSIS
THREATS FOR NEW ENTRANTS
INCUMBENT’S WRATH
Incumbent’s wrath is the word coined to signify the leverage the players in the market commands.
The existing players are well settled and entrenched in the market with an established network all
over. The incumbents grow because of an established network presence, a brand that consumers
are aware of and sheer economies of scale. By leveraging these points of strength, these players are
able to fight late entrants and challengers more effectively. That is certainly what is happening
between the incumbents (Airtel, Vodafone, Idea, Reliance Communication, and Aircel) and the
challengers (Datacom, Unitech, Swan Telecom, Shyam, and Loop ). The piece under contention is the
mobile termination charge which one operator pays to the other when the customer of the furtheruses the roaming charges of the later. This is 30 paise a minute charge as of today. This is charged to
the consumer as the cost of roaming. With an all India footprint (or 80% coverage), the incumbents
effectively donot have to pay termination charges. The full coverage ensures that calls are
terminated within their network. The incumbents have either been pocketing the termination
charges or passing them to consumers “no roaming charge” kind of schemes. This factor makes the
industry unattractive for the new entrants and investors (a negative factor).
DECLINING ARPU
Average revenue per user (ARPU) today is around the theoretical $5 break point. In mature
markets an ARPU under $5, does serious harm to the bottom-line. In a growing market likeIndia, the strain of a decreasing ARPU may not be significantly visible presently. However, with
markets maturing, the focus will shift from growth to sustainability. The new classes of
consumers are mostly rural and their ARPU would be well below $5 (probably $3-3.5).
Managing bottom-lines at such low levels of revenue per user and increasing costs of
acquisition will prove to be a challenge for new entrant and investors (a negative factor).
INFRASTRUCTURE TENANCY COST
The high capex in towers is one scary part of the telecom business. The cost of active equipment isestimated to be 40 percent of the telecom operator's total capex, while the balance is accounted for
by passive infrastructure. For example, Bharti has invested close to Rs. 230 billion to create the
cellular infrastructure with 45,000 towers across the country. Typically, a ground-based tower costs
Rs. 25-30 lakh. A roof-based tower can be built for Rs.13-14 lakh. On having a look at the additional
1,10,000 towers that were installed from March 2007 to March 2008 at a conservative cost of Rs. 15
lakh per tower—some Rs. 16,500 crore would have been sunk into them as capex. Additionally, cost
of maintaining one tower (active + passive) is estimated at Rs. 60,000-65,000 per month. However, if
a telecom service provider decides to rent the passive network from a tower company than the
telecom service provider in that case would need to pay monthly rent of Rs. 40,000 per tower for
passive network and operating expenses close to Rs. 40,000-45,000 for active network. The monthly
outflow of a TSP would be close to Rs. 80,000-85,000 per tower per month. Furthermore, towersharing among telecom service providers is just 25% as compared to 90% in the west and some

8/8/2019 Group 13 Telecom
http://slidepdf.com/reader/full/group-13-telecom 15/43
15 | P a g e
operators are not even willing to share towers. However, BSNL has recently announced about
leasing its towers which will help both the older and newer players to penetrate into new markets.
This factor makes the telecom industry moderately attractive for the new players and investors
(moderately positive factor).
CUSTOMER SWITCHING COSTS
The cost of new connection is very low, or one can say new connections are available for free.
Moreover, the proposed mobile number portability will make switching all the more easy. TRAI
expected that the subscriber has to pay not be more than Rs. 200, some operators have estimated
the charges can be as low as Rs. 20. The TRAI statistics for May 2010 shows subscriber switching
capacity of 20% with a yearly growth rate of 12.75%. This factor gives new entrant and investors a
reason to entry this industry (positive factor).
CAPITAL REQUIREMENT
Telecom is a highly capital intensive sectors with high fixed cost in terms of infrastructure cost andhigh sunk cost of licensing fees. This is a negative factor for a new entrant and investors.
LICENSING POLICY
The government has provided six new 2G licenses to telecom operators at a fee of Rs. 1650 crore in
2008 on first come first serve basis. This distribution took place after seven years of the previous
distribution. Later, some the players sold their licences instead of launching new services. In recently
held 3G licences auction all the incumbent private players managed to get licenses for 9-13 circles. It
has been evident that the delay in the 3G auction, auction procedure and the head start given to the
incumbent public players has caused lot of unrest in the industry. Also, the auction considered to be
as overpriced has left private players with a lot of debt in their kitty. Moreover, government has
failed to implement number portability which has to be implemented in April 2009. Government
licensing policies, failure to implement number portability and a 74% FDI cap in telecom sector has
made industry unattractive to new entrant and investors (negative factor).
In light of the above factor the overall threat of new entrant is low. Hence, the industry is
unattractive for a corporate to enter into.
BARGAINING POWER OF BUYERS
UNDIFFERENTIATED PRODUCTS AND SERVICES
The product and services offered by telecom operators are relatively undifferentiated. Product,
service, and technology innovations are easily copied by the competitors. This a negative factor for
the industry.
PRICE SENSITIVITY OF BUYERS
Undifferentiated offering makes buyers price sensitive. Price sensitivity of the buyers induces a
constant threat of price war in the industry. Hence, this factor is negative for the industry.

8/8/2019 Group 13 Telecom
http://slidepdf.com/reader/full/group-13-telecom 16/43
16 | P a g e
BUYER CONCENTRATION
Most of the buyers are concentrated in urban India. The teledensity in urban area is about 119% and
that in the ruler area is 26% with an overall teledensity of 53%. The urban area having high ARPU
potential is already saturated and ruler areas are unattractive for the industry. This is a negative
factor.
Considering the factors above the overall bargaining power of the buyers are high, hence, the
industry is unattractive for a corporate to enter into.
BARGAINING POWER OF SUPPLIERS
SUPPLIER CONCENTRATION
There are large numbers of suppliers in the telecom industry. Suppliers are handset manufactureslike, Nokia, Sony Ericson, Samsung, LG, Motorola, etc. Further, other suppliers are fibre optics and
aluminium cable providers; tower infrastructure providers such as GTL Infrastructure Ltd., ATC India,
etc.; and software solution providers such as TCS, Infosis, Wipro, and Mahindra Satyam. There are
sufficient numbers of suppliers in the market providing lesser bargaining power to suppliers in the
industry and hence this factor is positive.
SUBSTITUTE INPUTS
Substitution of input is cost intensive as hardware or software changes demand a change in the
architecture. This gives buyers a little power making is factor moderately negative.
BACKWARD AND FORWARD INTEGRATION
Telecom service providers have backward integration in tower business, handset business and
software development. For example, Bharti and Reliance have their own subsidiaries in tower
business; Reliance and TATA provide their own handsets, Reliance and TATA have their own
software development facilities. Changes of forward intergradation for the suppliers are close of
zero. As a result bargaining power of the suppliers is less, hence, the factor is positive for the
industry.
SWITCHING COSTS
Infrastructure suppliers have higher switching cost due to specific nature of the equipments and
software providers generally enter annual maintenance agreement. Hence, customer switching cost
of the suppliers is high making this factor positive for the industry.
IMPACT OF SUPPLIER PRICES, QUALITY, AND SERVICE
Supplier prices have a great impact on the cost structure and profitability of the telecom industry.
Also, the quality and service provided by the suppliers impacts overall customer satisfaction and
reputation of the industry as a whole. Hence, this factor is a negative factor.

8/8/2019 Group 13 Telecom
http://slidepdf.com/reader/full/group-13-telecom 17/43
17 | P a g e
After analysing the factors above it can be concluded that the bargaining power of suppliers is low,
this increases the attractiveness of the industry for a corporate to enter into.
RIVALRY AMONG EXISTING COMPETITORS
HIGH EXIT BARRIERS
Telecom industry is a capital intensive industry with high sunk and fixed cost due to specialised
equipment, spectrum cost, etc. This raised the exit barrier for an existing player to a very high level.
As a result, in order to sustain in the market the players compete and fight up to the bleeding point.
This makes industry unattractive (negative factor) for the industry.
SHORT LIVED ADVANTAGE OF INNOVATION
In order to differentiate form competitors the industry players are investing heavily in technicalinnovation and marketing strategies. But, due very nature of the industry the technology readily
becomes obsolete. Moreover, the product and service innovations are easily imitated by the
competitors due not to lack of mature intellectual property protection laws. This factor fuels the
competition in the industry (negative factor) and makes the industry unattractive.
PRICE WARS
The price war between the major players and the new entrants has made the competition fiercer.
Market competition accelerates the pace of development and technological advancements but cutthroat competition is detrimental for the health of the industry. Had TRAI made per second billing a
compulsion it would have introduced a necessary evil with no competitive dimension but its decision
to make per second billing voluntary in nature offshoots one more variable that will lead to the
emergence of new permutations of tariff offers, limited only by operator`s marketing prowess. The
primary concern of all stakeholders in Telecom sector right now is the adverse effect of the price
war on EPS and net profit (negative factor).
All the above factors are negative and hence the rivalry among the existing players is very high
making the industry highly competitive. Hence, the industry is unattractive for a corporate to enter
into.
THREAT OF SUBSTITUTES
The threat that substitute products pose to an industry's profitability depends on the relative price-
to-performance ratios of the different types of products or services to which customers can turn to
satisfy the same basic need. The threat of substitution is also affected by switching costs – that is,
the costs in areas such as retraining, retooling and redesigning that are incurred when a customer
switches to a different type of product or service. The potential major substitutes for telecom
industry are voice over internet protocol (VOIP), emails, satellite phones, instant messaging, etc.
Among the several substitutes VOIP has emerged as the biggest threat. Applications like Skype and
Google voice chat have been extremely popular among younger generation users and are fast
emerging as preferred means of communication. However, considering the current penetration of

8/8/2019 Group 13 Telecom
http://slidepdf.com/reader/full/group-13-telecom 18/43
18 | P a g e
the substitutes and spread of the telecom industry these substitutes does not pose any major threat
providing a mildly positive outlook to the investors.
The threat of substitute products is low, this factor makes the industry attractive for a corporate to
enter into.

8/8/2019 Group 13 Telecom
http://slidepdf.com/reader/full/group-13-telecom 19/43
19 | P a g e
MARKET SWOT ANALYSIS OF THE INDIAN TELECOM SECTOR
STRENGTHS
Fastest growing mobile market in the world (forecast to grow at a compound annual growth
rate of around 15 per cent between 2009-10 and 2013-14)
The total telecom subscription in India surged at a CAGR of over 38% from fiscal 2003 to
fiscal 2007, making the country the third largest telecom market in the world
Wireless subscribers growing with a Compounded Annual Growth Rate (CAGR) of 65% during
the last five years (as on July 2009)
Consumers are ready to pay for cutting edge services
Presence of private players and competition has brought the cost down for customers thus
making services affordable
Tremendous Foreign Direct Investments in Telecom 74%-100% across various telecom
services
Unified license regime
Huge wireless subscriber potential
WEAKNESSES
Huge initial investments for any company entering the sector
Too many authorities ruling the sector
Price war amongst the private players has led to the lowest call tariffs in the world thus
reducing the players’ profitability
Market strongly regulated by Government body – Governing both ISP and Telecom sectors
Limited spectrum availability and interconnection charges between the private and state
operators
Huge potential for low end and cheap handsets
Wide scale Consumer churn in Telecom and ISP
Value Added Services deployment is restricted due to language and literacy problems
Indian consumer market is still primarily a voice based market
OPPORTUNITIES
Indian telecom industry is expected to reach a size of Rs 344,921 crore by 2012 at a growth
rate of over 26 per cent (survey report from a Frost and Sullivan)
Use of 3G services to enhance the value proposition of the telecom sector
Huge revenue generation for the Govt. of India
To offer value added services on GSM, CDMA and IPTV
Language independent services
Huge employment generator, likely to generate over ~3 lakh new jobs over the coming 5
years
Mobile Marketing concepts

8/8/2019 Group 13 Telecom
http://slidepdf.com/reader/full/group-13-telecom 20/43
20 | P a g e
Good opportunity for Wireless Broadband services in India. Currently, over 70% households
in India don’t have access to wired lines. Number of mobile users outnumbers PC users.
M-Commerce
Unified messaging platforms
Foreign investment in form of equity or technology
Talent crunch in this sector will push salaries even further than the current 15% hike
THREATS
Low margin for the service providers in India leaves them with no prospect of breaking even
in short term
Regulatory interference by the Govt. of India
Recent hassles over the allocation of 3G bandwidth
Weak IPR protection
Political instability
From the SWOT analysis, it can be inferred that there exists considerable amount of opportunities
for the existing and new entrants in the telecommunication sector. Investors can therefore invest in
this high potential market.

8/8/2019 Group 13 Telecom
http://slidepdf.com/reader/full/group-13-telecom 21/43
21 | P a g e
FINANCIAL ANALYSIS
INDUSTRY ANALYSIS
Before 2009, net revenue per company has always been positive. But in the recent past Net Revenue
for the company has gone in negative for one quarter. As per forecasting based on Econ Trends, Net
Revenue in 2nd quarter of 2010 is expected to increase and a lower net revenue per company in
expected in 3rd quarter.
EBITDA margin for this sector is not expected to stay be good in the next two quarters. It is expected
to show a negative tendency in 2nd quarter of 2010 and a slight positive growth in the 3rd quarter.
If we plot the business cyclicity of this sector in terms of net revenue then at present it is declining.
In the coming months we can expect it to enter the negative territory.

8/8/2019 Group 13 Telecom
http://slidepdf.com/reader/full/group-13-telecom 22/43
22 | P a g e
With the time Net Revenue per company almost stays constant but operating cost is on rise.
EBITDA Profit Margin is also declining with time as clearly shown that operating cost per company is
increasing.

8/8/2019 Group 13 Telecom
http://slidepdf.com/reader/full/group-13-telecom 23/43
23 | P a g e
Net Profit per company is on the declining path. In the last 5 quarters it has continuously declined.
Still more and more companies are investing in this sector. If we see in the last four years
investments have continuously increased in this sector.

8/8/2019 Group 13 Telecom
http://slidepdf.com/reader/full/group-13-telecom 24/43
24 | P a g e
To summarize, in the short run this sector is not seen to show any positive growth as
Operating Costs are on continuous rise
Business cycle is expected to enter into negative cycle
Net Profit per company is declining
EBITDA Margin is expected to be negative in the coming quarters
Concluding all these factors, this sector is not an attractive opportunity to invest in the short run.
However, in the long run we have to consider other factors to reach an optimal decision.
AIRTEL FINANCIAL PERFORMANCE
ANALYSIS
2006 2007 2008 2009 2010
Sales (in Rs. Cr) 11664 18420 27012 37352 41829
Operating Profit Margin 35.86 40.65 41.37 38.74 38.89
Return on Equity 31.98 43.10 38.51 30.91 26.56
Debt Equity Ratio 0.57 0.37 0.19 0.29 0.06
Earnings per share 5.39 10.72 17.12 20.70 24.13

8/8/2019 Group 13 Telecom
http://slidepdf.com/reader/full/group-13-telecom 25/43
25 | P a g e
1. EBITDA Margin
EBITDA Margin is constant throughout the period despite the increase in huge number of
customer base. It shows that with the increase in revenue corresponding expenditure is also
increasing. Company is not able to control on its expenditure part. Thus in order to increase
its profit it must work upon his expenditure part.
2. Net Profit Margin
Since 2007 there has not been much change in the net profit margin. As EBITDA is almost
constant this shows company has not undergone any major liquidation of its assets and has
not generated other income to any major extent. Most of the profit is from operations only.
3. Return on Stockholder’s equity
Airtel’s return on stockholder’s equity has shown a declining trend in the last few years.
Despite the growing revenue and customer base company is losing return on per unit of
invested amount. However, earnings per share are increasing with time thus decrease in
ROE could be because of high rise in equity with respect to Revenue. Thus company is not
able to generate as much as he is accepting from investors. But on the other hand it isdiluting his long term debt. An overall picture shows that invested money is going in
payment of debt. Thus, not a negative sign.
4. Book value per equity share
Book value is increasing over time clearing showing the strength of company is increasing
over time.
5. Debt to Stockholders’ equity
With the time debt to equity ratio of Airtel has fallen at a very rapid pace. It clearly shows
company is becoming more and more self-sufficient. In 2010 it has debt to equity of 0.06,
thus most of the money invested is of shareholders’ only and major benefit is going to them.
It shows a good signal on the company as in the time of difficulty, company can raise debt to
a very good extent and sustain its operations.
To summarize, on most of the parameters Airtel is performing extremely well and shows
sign of good potential in the future depending on external conditions.

8/8/2019 Group 13 Telecom
http://slidepdf.com/reader/full/group-13-telecom 26/43
26 | P a g e
IDEA – FINANCAL PERFORMANCE
Analysis
1. Services Revenue
Idea service revenue has increased by 20 billion, which shows a period of huge growth of
idea in this year. It indicates that idea is able to increase in number of its customer base.
Other income has also increased by 0.6 billion which shows either a disinvestment at profit
or idea’s earnings from other sources.
Other key ratios for the last five years
2006 2007 2008 2009 2010
Sales (in Rs. Cr) 2007 4366 6719 9857 11850
Operating Profit Margin 38.38 36.96 37.07 31.63 23.74
Return on Equity 16.84 21.90 26.38 7.29 8.95
Debt Equity Ratio 4.96 1.95 1.84 0.67 0.57
Earnings per share 0.56 1.94 3.96 3.23 3.19

8/8/2019 Group 13 Telecom
http://slidepdf.com/reader/full/group-13-telecom 27/43
27 | P a g e
2. Operating Profit Margin –
Compared to Airtel idea has faced certain hick-ups to control his operating profit margin.
Initially company has good operating profit but it is now decreasing for the last three years.
Company is able to sell more and more but profit generating out of it are not in right
proportion. This shows company’s expenditure is increasing at faster pace than the profit.
Company must control its expenditure part to stabilize its operating profit margin.
3. Debt Equity Ratio –
Similar to Airtel debt equity ratio is decreasing. Thus, idea is diluting its debt more and more
and relying on equity as a major component of its investment.
4. Return on Equity –
Just like Airtel, Idea’s Return on Equity is declining and maintenance of earnings per share
such that the company is investing investor’s money in clearing debts.
To summarize, idea is on a growth trajectory but it must control its expenditure part to
stabilize its business to a higher extent.

8/8/2019 Group 13 Telecom
http://slidepdf.com/reader/full/group-13-telecom 28/43
28 | P a g e
RELIANCE – FINANCIAL PERFORMANCE
Analysis
2006 2007 2008 2009 2010
Sales (in Rs. Cr) 12,756 14792 15086 13,554.60
Operating Profit Margin 36.95 35.95 28.66 23.93
Return on Equity 10.92 11.40 3.51 0.94
Debt Equity Ratio 0.41 0.77 0.67 0.54
Earnings per share 11.78 12.53 23.27 2.18
1. Sales
In contrast to Airtel and Idea, sales turnover of Reliance has fallen this year. This clearly
shows reliance is facing in retaining problem in holding the current customer base. But if we
see, subscribers for Reliance have increased from 73 million in 2009 to 102 million in 2010.
Thus, there must be some issues with prices, which Reliance is charging from the consumer.
May be this decrease in price has resulted in increased customer base of Reliance.
2. Operating Profit Margin
Operating Profit Margin also supports the data that Reliance takeaway is declining even with
a slight fall in sales. Over the last four years company is continuously losing on its Operating
Profit. One supportive reason, as already mentioned, is to charge lower price from the
customers.
3. Return on Equity
Equity is increasing in the period 2006-2009 faster than the sales. In this period even the
sales fell thus decreasing return on equity to a very lower level of 0.94. Reliance is not able
to produce much out of investor’s money.

8/8/2019 Group 13 Telecom
http://slidepdf.com/reader/full/group-13-telecom 29/43
29 | P a g e
4. Debt Equity Ratio
Debt Equity Ratio is very topsy-turvy for Reliance Communication. It has no regular visible
pattern and changes erratically but to a lower extent. But the good thing here is company is
taking advantage of both Loans and Investor’s money.
5. Earnings per share
Clearly decline in earnings per share shows some problem with the earning power of
Reliance Communication. Company’s structure need to be analyzed to improve its profits.
TATA COMMUNICATION – FINANCIAL PERFORMANCE
Analysis
Other key ratios for the last five years
2006 2007 2008 2009 2010
Sales (in Rs. Cr) 3780 4041 3283 3749 3218
Operating Profit Margin 23.53 23.39 19.32 22.70 23.32
Return on Equity 7.91 7.37 4.65 7.58 6.63

8/8/2019 Group 13 Telecom
http://slidepdf.com/reader/full/group-13-telecom 30/43
30 | P a g e
Debt Equity Ratio 0.02 0.03 0.12 0.34 0.36
Earnings per share 16.83 16.44 10.68 18.10 16.95
1. Sales
Sales of Tata Communication have fallen to the level of 2008 despite increase in 2009. Other
income remains the same and positive interest income shows the company’s ability very less
reliance on loan.
2. Operating Profit Margin
As the operating profit margin almost stays constant it means that company’s expenditure is
in control. On the other hand decrease in sales and no change in operating profit margin
shows that expenditure has no role to play but company’s customer base may have reduced
to a little extent.
3. Return on Equity
Return on equity has also decreased a little bit this year with the equity remaining almost
constant that sales number is slightly disturbed.
4. Debt Equity Ratio
Debt equity ratio may have increased but positive interest income shows that company has
enough of finances and do not have any money crunch.
5. Earnings per share
Earnings per share have fairly been stable as compared to all the other three i.e. Airtel, Idea,
and Reliance who have continuously generated money from the market. On the other hand,
Tata is able to manage its own capital in a fairly better manner.
SPICE MOBILE – FINANCIAL PERFORMANCE
ANALYSIS
Jun’05 Jun’06 Dec’06 Dec’07 Mar’09
Sales (in Rs. Cr) 606.57 661.49 389.16 957.85 1580.48
Operating Profit Margin 27.39 22.04 22.63 24.61 -7.62
Return on Equity -29.31 74.25 25.39 47.61 558.30
Debt Equity Ratio ---- ---- --- 1.50 ---
Earnings per share 0.13 -1.24 -0.70 5.51 -14.78

8/8/2019 Group 13 Telecom
http://slidepdf.com/reader/full/group-13-telecom 31/43
31 | P a g e
It is difficult to obtain data for Spice communications. It is not easily available. But with the given
data we can interpret following things.
1. Sales
Sales of Spice communication per quarter is approximately 150 crore. But in the year 2009 it
has increased to a very good extent. Thus overall spice communication is gaining the marketshare.
2. Operating Profit Margin
It has fallen this year drastically. The main reason that could be inferred here is the drastic
increase in expenses. As seen from the P& L account companies’ manufacturing, selling and
admin as well as other miscellaneous expenses have increased to a very high level.
3. Return on Equity
An increase in sales is one of the reasons of increase in return on equity. Company has
diluted its reserves to a very large amount and thus causing return on equity to fall. But
decrease in reserves is not in proportion with increase in sales which signals company is
facing some problem with its operational activities.
4. Earnings per share
Reason for fall in earnings per share is quite clear as the earnings or operational profit per
margin is decreasing.
COMPARISON AMONG DIFFERENT NETWORKS
Based on above data, we have –

8/8/2019 Group 13 Telecom
http://slidepdf.com/reader/full/group-13-telecom 32/43
32 | P a g e

8/8/2019 Group 13 Telecom
http://slidepdf.com/reader/full/group-13-telecom 33/43
33 | P a g e
On all the parameters Airtel is performing best for the last five years except operating profit margin
this year. Moreover, total customer base for Airtel has been on rising path. In the last year Airtel has
seen 35% growth in its customer base. With the customer base, revenue is also on rise. Company is
expanding its operations all over world. It has entered into Africa by acquiring Zain. It is also
operational in Sri Lanka where its subscriber base has crossed one million customers this year.
Company is also looking Bangladesh has a healthy prospect market. Despite other players Airtel is
performing well for the several years and stays at best in the current Indian Telecom industry.
RECENT EVENTS
3G AND BWA AUCTION
May 2010 put an end to all speculations about Third Generation (3G) and Broadband Wireless
Access (BWA) spectrum auction. The Government of India has auctioned off the 3G spectrum for a
whooping sum of Rs. 67,718.95 crore and BWA spectrum for Rs. 38,617 crore. The total auction
amounts to Rs. 1,06,336.96 crore about three times the envisaged expectations of Rs. 35,000. Such
an aggressive bidding is a positive development for the government, but negative for the telecom
operators.
The final pan-India price of Rs. 16,751 crore for 3G auction is 4.8 times the base price of Rs3,500
crore. There is no single pan-India 3G spectrum license holder. Of the 22 circles put for auction,
Bharti bagged licenses for 13 circles with an aggregate commitment of Rs.12,295 crore. Vodafone
won nine circles for Rs.11,618 crore. Reliance Communications shelled out Rs. 8,585 crore (for 13
circles), Aircel Rs.6,499 crore (for 13 circles) and Idea Cellular Rs.5,769 crore (for 11 circles). It is seen
that the players have been selective in their bids and have tried to get allocation in the circles that
contributes maximum to their revenues and wherein they have a strong market share. The biggies—
Bharti Airtel, Vodafone and Reliance Communications— have won one slot each in the lucrative
Delhi and Mumbai circles. These three operators collectively enjoy 77% and 66% revenue market
share in these markets (Delhi and Mumbai) respectively.

8/8/2019 Group 13 Telecom
http://slidepdf.com/reader/full/group-13-telecom 34/43
34 | P a g e
The pan India licence price for BWA auction stood at Rs. 12,847.77 crore, which is about 6 times the
base of Rs.1,750 crore. Unlike the 3G event, Infotel Broadband won a pan India license, while Aircel
bagged 7 slots; Tikona got 5 slots, Qualcomm and Bharti 4 each and Augere 1.

8/8/2019 Group 13 Telecom
http://slidepdf.com/reader/full/group-13-telecom 35/43
35 | P a g e
According to FICCI, the overall wireless subscriber base is expected to reach 746 million by 2013,
wherein the 3G will contribute 67.5 subscribers, based on household income levels, increasing
affordability and decreasing Total Cost of Ownership (TCO) for a wireless subscriber. By 2013, the
industry ARPU (2G and 3G) will decrease to USD 4.1 at a CAGR of -3.1%, buoyed by increasing
revenues from 3G. The share of VAS ARPU will increase from the current level of 9% to 23%. 3G
service revenues are expected to reach USD 15.8 billion in 2013

8/8/2019 Group 13 Telecom
http://slidepdf.com/reader/full/group-13-telecom 36/43
36 | P a g e
VIRTUAL CONSOLIDATION
Inevitability finally catches up with the new entrants in the Indian Telecom industry. It is a no brainer
to see that a market with 15 players will not have space for the bottom rankers. Thus new entrants
are beginning to scale down the roll out plans and avoiding reduction of the tariffs further. With 14-
15 players jostling for share of the consumer kitty, consolidation is now setting into the Indian
Telecom markets. In most circles, only about 6 players continue to sustain market momentum. The
Top 6 players account for 90% of the market shares by subscriptions and higher shares by value. The
intensity of competition is reducing. Some of the new entrants in the telecoms market have not
rolled out networks in many circles despite being granted spectrum. All new entrants – with the
exception of Sistema – are under investigation by both the Central Vigilance Commission as well as
the Prime Minister’s office for delaying the rollout of their operations. While it has been close to
three years since these firms obtained their licenses, Etisalat DB is yet to launch commercial services,Loop Mobile has started services only in Mumbai while Videocon has launched mobile services in

8/8/2019 Group 13 Telecom
http://slidepdf.com/reader/full/group-13-telecom 37/43
37 | P a g e
only in five of the 22 circles. Even Uninor and S Tel, the other new entrants, have failed to meet all
their rollout obligations. Many new entrants did not bid for 3G and broadband spectrum. All this are
tell-tale signs that consolidation has started in the minds of companies.
Consolidation has also started in the minds of consumers. Even in this crowded market, six operators
now bagged the almost whole of the revenue market share, indicating that customers have learnt torecognise bigger, established, stronger, and better brands. The increase in minutes of usage for
larger mobile companies is a testimony to the fact that only certain players are present in the minds
of consumer. The top 3 Telcos have registered increases in the minutes of usage in the quarter.
Increase in minute of usage (Q2,2010 verses Q1, 2010)
Airtel 3%
Idea 13%
Vodafone 10%
Uninor, STel, Loop, Etisalat DB, Videocon, and Sistema collectively added less than 12% of 18 million
customers in June. This is in sharp contrast to last year’s numbers when Uninor added a million users
within 30 days of launch. STel managed to clock one million subscribers in 90 days from three small
circles. The new entrants together account for less than 3% of India’s 600 million mobile users.
With 10 million and more subscriptions happening per month, The Indian Telecom Market is the
largest growing Telecom market in the world. However, Telco after Telco have made the mistake of entering the Indian Market without a proper and thought through strategy.
MAJOR INVESTMENTS
The domestic telecom market has been attracting a huge chunk of investment which is likely to gain
momentum with the entry of new players and launch of new services. According to the Department
of Industrial Policy and Promotion (DIPP), the telecom sector which includes radio paging, mobile
services and basic telephone services attracted foreign direct investment (FDI) worth US$ 2,554
million during 2009-10. The cumulative flow of FDI in the telecom sector during April 2000 and
March 2010 is US$ 8,930.61 million.
Further, the Indian telecom sector is expected to witness investment of around US$ 40 billion during
the fiscal 2010-11, as per the Telecom Equipment and Services Export Promotion Council. With the
development of 3G, expansion of the current networks and widening of Broadband Wireless Access
(BSA) network, the investment in the telecom sector is likely to increase from the US$ 20 billion
witnessed last year.
As per an industry report the telecom industry signed merger and acquisition (M&A) deals worth
US$ 22.73 billion during April-June 2010, which is about 67.19% of the total valuation of the deals
across all the sectors during the period. The sector had seen M&A deals of around US$ 439.4 million
during April-June 2009. The biggest M&A deal in the telecom sector was made by Anil Ambani's

8/8/2019 Group 13 Telecom
http://slidepdf.com/reader/full/group-13-telecom 38/43
38 | P a g e
Reliance Communication Ltd. that merged GTL infrastructure Ltd., its telecom tower business, for
US$ 11 billion. Other major M&A deals included acquisition of Kuwait-based Zain telecom's African
business for US$ 10.7 billion by Bharti Airtel and acquisition of Infotel broadband for US$ 1032.26
million by Reliance Industries.
Norway-based telecom service provider Telenor has bought a further 7% in Unitech Wireless for alittle over US$ 431.3 million. Telenor now has 67.25% hold of the company. Telenor has completed
its four-stage stake buy and has invested a total of US$ 1.32 billion in Unitech Wireless as per the
agreement signed on latter last year.
The foreign direct investment (FDI) proposal of the Federal Agency for State Property Management
of the Russian Federation to buy 20% stake in telecom service provider Sistema-Shyam for US$ 660.1
million has been approved by government.
MOBILE VALUE ADDED SERVICES (MVAS)
A VALUE PROPOSITION
Continuously declining ARPU (Average Revenue Per User) is a major concern for mobile operators.
Reduction in call rates has reached a stage where it is difficult to sustain. Decreasing call rates has
also resulted in decreasing ARPU for the mobile operator. And thus it initiates the need for VAS as
revenue tool for mobile operator. To maintain a healthy growth, the operator needs to come up
with innovations that will result in revenue generation. These innovations in plans and offerings can
only be offered through VAS. Also, mobile operators can differentiate themselves only on the basisof VAS and no more on the basis of price.
For a subscriber, mobile is not just a device to communicate, it’s a multipurpose tool that enables
users to communicate as well as provides infotainment5 to them. This evolution from mere
substitute to telephone to “All in one” device leads to higher usage of VAS. Voice calls as well as P2P
SMS (conventionally considered a VAS) is more like a commodity. VAS is something which enables
them to do lot more than mere communication.
CHARACTERISTICS AND CATEGORIES
Mobile Value Added Services (MVAS) does not constitute as a basic service offered to a subscriber. It
is provided to subscriber as an add-on service, for which the operator charges a premium. MVAS is
offered to add “value” to subscriber and can also be stated as services beyond voice communication
which are offered by mobile operators to their subscribers at premium. Commonly, it could be
defined as:
Services that are not part of the basic voice offer and availed separately by the end user. They are
used as a tool for differentiation and allow mobile operators to develop another stream of
revenue.

8/8/2019 Group 13 Telecom
http://slidepdf.com/reader/full/group-13-telecom 39/43
39 | P a g e
Indian mobile VAS industry has evolved from P2P SMS to mobile TV over the past decade. It is
evident from the illustration below that as mobile industry in India evolved over the decade, more
innovative and complex VAS entered the market. These services followed the trend Entertainment
VAS- Information VAS- mCommerce.
VAS USERS
The nature and the capabilities of VAS have been changing over the last decade. What used to be
VAS earlier has become more like commodity today. Urban mobile users are relatively mature

8/8/2019 Group 13 Telecom
http://slidepdf.com/reader/full/group-13-telecom 40/43
40 | P a g e
mobile users. Relatively newer VAS such as games, music, mCommerce as well as Internet access is
being tried by urban users.
Almost 50% of mobile users have been added in past 2-3 years. Majority of this addition has
occurred among users in non-urban India. These are relatively new, less mature mobile users. The
expansion of mobile subscribers' base in rural areas presents a great opportunity to the MVASindustry.
MARKET SIZE
Indian mobile industry is slowly but steadily transforming from being a basic telephony (voice-only)
market to a value-driven one. Increasingly, mobile services are being introduced that are designed to
serve specific needs for entertainment, information search or making a fund-related transaction. The
revenues are generated through various means; the composition differs for varying networktechnologies.

8/8/2019 Group 13 Telecom
http://slidepdf.com/reader/full/group-13-telecom 41/43
41 | P a g e
THE WAY AHEAD
Though 3G spectrum auction is over, implementing 3G across the ecosystem will take 2-3 years. It
would be difficult to comment whether 3G will bring paradigm shift in the MVAS industry in a short
span of time. Outlook towards effect of 3G on Mobile VAS industry is certainly positive. 3G will
certainly be one of the main factor or driver for growth of MVAS in India. However, will it be the only
or prime factor remains uncertain so far. 3G has large potential to change VAS industry. Future of
VAS in India is going to be data services and not only voice services.
FUTURE OUTLOOK
As per the data obtained from TRAI, the total number of telephone subscribers in India has increased
from 621.28 million in March 2010 to 638.05 million in April 2010. This signifies a monthly growth
rate of 2.70 % and has led to the increase in overall teledensity in India to 54.10.
Indian Telecom Statistics
Total telephone subscriber base 638.05
Tele-density 54.10%
Fixed-line user base 36.83
Wireless user base
(GSM+CDMA+WLL(F))
601.22
Monthly additions (Wireline +
Wireless)
16.77
Monthly additions (Wireline) -0.13
Monthly additions (Wireless) 16.64
Broadband subscribers 9.00
Total Subscriber Base in April 2010 (Source: telecomindiaonline)
The Indian wire line subscriber base has reduced to 36.83 million in April 2010 from 36.96 million in
March 2010. Consequently the overall wire line teledensity has also fallen to 3.12. However, the
total Broadband subscriber base has increased from 8.75 million in March-2010 to 9 million in April-
2010, there by showing a growth of 2.80%. This growth of broadband subscriber base would reduce
the fall of wire line subscribers in India to certain extent, although as a whole, the wire line
subscriber base is expected to fall.
The wireless segment, on the other hand is growing at a tremendous rate. Its subscriber base in April
2010 was 601.22 million as compared to 584.32 million in March 2010. Also with increasing
demands from consumers for the wireless segment, we expect the market to grow at an even
greater pace than it's doing currently. The drivers for the same would be the new 3G services
launched by major telecom operators in India, the entry of new service providers and also the entry
of new handset manufactures with competitive prices.

8/8/2019 Group 13 Telecom
http://slidepdf.com/reader/full/group-13-telecom 42/43
42 | P a g e
Also, content would play a major role in the Indian telecom sector in the coming few years. With the
upcoming Mobile Value Added Services, the telecom subscription model is expected to operate
more on subscription model like Apple’s iPhone and App store.
The challenges for the Indian telecom sector would be to penetrate to rural market. Electricity and
laying down network would be two major challenges.
The Indian telecom companies are also expected to differentiate their product offerings in future to
gain competitive market share. For e.g., MTS offered 10 lakh free minutes on its launch and it has
more than half a million subscribers already.
CONCLUSION
Indian telecom sector has entered into its maturity phase with a teledensity of 53% as on May 2010.
The telecom sector has grown ten folds between 2003 and 2009 in terms of number of subscriber
will witness a saturation in the subscriber base. Though there is lot of potential in the rural sector
which only has a teledensity of 26%, but with low ARPU customer base the existing players are
indifferent towards this sector. There is a good investment opportunity in rural sector for any new
player who is willing to offer value for money propositions.
The existing players, which were following a market penetration strategy, are now focusing more on
product and service differentiation. With the advent of 3G and BWA services this product
differentiation looks more realistic. The future of telecom is in mobile value added services, wherein
the focus of the operators will be more on data services as compared to voice services. The area of
mobile value added services offers a great opportunity of investment.
The telecom sector is also witnessing backward integration wherein the front players are expanding
their presence in the backend operation of the value chain in order to attain profitability and scale.
The recent inflow of FDI and foreign acquisitions have are a good pointers towards the health of the
industry and incumbent. The virtual consolidation can be witnessed in the industry, which is pointing
to the fact that only big players will sustain eventually in the presently over crowed market.
However, there is a space for niche independent service providers in the data service space, wherein
termination chargers may not be a hurdle

8/8/2019 Group 13 Telecom
http://slidepdf.com/reader/full/group-13-telecom 43/43
REFERENCES
http://economictimes.indiatimes.com/News/News-By-Industry/Virtual-Consolidation-underway-in-
Indian-telecoms-market/articleshow/6438037.cms
http://www.trai.gov.in
http://en.wikipedia.org/wiki/Communications_in_India
http://www.equitymaster.com/research-it/sector-info/telecom/
http://www.indiastat.com/telecommunication/28/stats.aspx
http://www.som.iitb.ac.in/live/L!VE_March2010.pdf
http://www.nkgoyals.com/pdf/Indian-Telecom-Sector-Brief-Perspesctive-by-NKG.pdf
http://www.comviva.com/media/BEsectortelecom.pdf
http://www.iloveindia.com/economy-of-india/telecom-industry.html
http://asiancorrespondent.com/Indianomics/2009/03/28/10-risks-for-indian-telecom-sector-in-
2009-ey-report
http://timesofindia.indiatimes.com/tech/news/telecom/New-telcos-may-exit-set-off-
consolidation/articleshow/6460660.cms
http://www.capitalline.com
http://www.marketline.com
http://www.crisil.com