groundwater quality modeling of amaravathi river … quality modeling of amaravathi river basin of...
TRANSCRIPT
INTERNATIONAL JOURNAL OF ENVIRONMENTAL SCIENCES Volume 1, No1,2010
© Copyright 2010 All rights reserved Integrated Publishing services
Research Article ISSN 0976 – 4402
91
Groundwater Quality Modeling of Amaravathi River Basin of Karur District, Tamil Nadu, Using Visual Modflow
R.Rajamanickam 1 and S.Nagan 2 1. Environmental Engineer, Tamil Nadu Pollution Control Board, Chennai 600 032, India. 2. Associate Professor, Dept. of Civil Engineering, Thiagarajar College of Engineering,
Madurai – 625 015, India. [email protected]
ABSTRACT Amaravathi river basin at the down stream of Karur Town is severely polluted due to discharge of partially treated effluent by the textile bleaching and dyeing units. There are 487 units and they treat the effluent either in individual effluent treatment plant (IETP) or common effluent treatment plant (CETP). Daily about 14600m 3 of coloured effluent with total dissolved solids (TDS) in the range of 5,000 10,000 mg/l is let into river Amaravathi. A study has been conducted using Visual MODFLOW 2.8.1 version. The study area is limited to 320 sq.km. This 320 sq.km is divided into 4572 cells with grid size of 350m x 200m with two layers. The groundwater monitoring data, lithology, hydro geological parameters, topography, rain fall data obtained from PWD, CGWB, Survey of India, India Metrological Department are used in the model. The MODFLOW and MT3D models are calibrated and validated. The validated model is used for simulation of the ground water quality for next 15 years under five difference scenarios: (i) if the present system with 10,000 mg/L TDS discharge into river continues, (ii) if the CETPs meet the TDS discharge standards of 2100 mg/L and discharge the effluent into river, (iii) if the quantum of discharge is doubled with TDS level of 2100 mg/L, (iv) if the dyeing units go for reverse osmosis plant and recycle the entire effluent and achieve zero discharge, (v) 1.5 time groundwater recharge and zero discharge by the units. The simulation results show there is no improvement in groundwater quality even the effluent meet the discharge standards for the next ten years. When the units go for zero discharge then there will be an improvement in the quality of groundwater over a period of few years.
Key Words: Amaravathi river basin, Karur, Textile dyeing effluent discharge, Groundwater quality modeling, Visual Modflow,
1. Introduction
1.1 General
Groundwater contamination and soil pollution have become recognized as important environmental problems over the last 20 years. With the increasing sense of awareness about the environment and the recognition of the need for its protection, the study of solute transport related to groundwater contamination has become the focus of numerous researchers. Specially, during the last three decades, research activities in this area have accelerated to revolutionary level. Different investigators have studied the solute transport from different perspectives. Groundwater modeling is an established tool to study the aquifer response for given inputoutput stress. The findings, in turn, help evolve and select optimal

INTERNATIONAL JOURNAL OF ENVIRONMENTAL SCIENCES Volume 1, No1,2010
© Copyright 2010 All rights reserved Integrated Publishing services
Research Article ISSN 0976 – 4402
92
groundwater management policy. In India pollution and over extraction are important component of the groundwater problem. Mass transport modeling in recent times helps to understand the migration behavior of pollutant in the saturated region. Mass transport results are in turn used to devise the remedial measures to clean the aquifer system.
1.2 Background of the research problem
Amaravathi river basin is located between north latitude 11 o 00' N and 10 o 00'N, east longitude 77 o 00'E and 78 o 15'E. River Amaravathi originates from Thirumurthimalai in Udumalpet taluk of Coimbatore district, Tamil Nadu State. The river flows through Erode district and there after into Karur district. The direction river flow is from southwest to northeast and the total length of river is 160 km. Shanmuganadhi, Nankanchi and Kodaganar rivers are the tributaries of Amaravathi. These tributaries join with Amaravathi at 60, 40 and 20 km upstream of Karur town respectively. The Amaravathi river enters into Karur district near Aravakurichi (30km upstream of Karur) and merges with river Cauvery near Kattali village (10 Km down stream of Karur). The flow in the river is seasonal and is contributed by the northeast and southwest monsoon seasons. Amaravathi river is the main source of water for domestic, irrigation and industrial uses in Karur district. The Amaravathi river water is severely polluted due to the discharge of the textile bleaching and dyeing units located in and around Karur Town. The TDS level in groundwater quality is getting increased. Agricultural production is in the down trend. Farmers are seeking compensation.
Figure 1 Study area and location of monitoring wells
Cauvery River
Amaravthi River
KARUR
N
Not to Scale
Monitoring Wells Kaliyappagoundanur
Vaiyalkaranpudur Puliyur Andankoil
Balamalpuram
Nerur R.Pettai
Dyeing Units
Kattali

INTERNATIONAL JOURNAL OF ENVIRONMENTAL SCIENCES Volume 1, No1,2010
© Copyright 2010 All rights reserved Integrated Publishing services
Research Article ISSN 0976 – 4402
93
1.3 Need for the study
Karur is the head quarter of Karur taluk and district. It is located on the bank of river Amaravathi. During the last three decades the town emerged as a major textile centres with more than 1000 power loom and handloom units producing bed spreads, towels and furnishings. The main raw material is cotton yarn. This cotton yarn and the finished product (i.e) gray cloth are bleached any dyed by the industries located in this town. At present 487 bleaching and dyeing units are in operation. These bleaching and dyeing units are located on either side of Amaravathi river within 2Km from the river. By average one unit generates 30 kilo litres per day (KLD) of trade effluent. These units have provided either individual effluent treatment plant (IETP) or joined in common effluent treatment plant (CETP). After treatment the effluent is discharged into river Amaravathi. The total dissolve solids (TDS) in the river discharge is in the range of 5000 – 10000 mg/L and the chloride is in the range of 2000 – 4000 mg/L. Daily 14600 KLD of partially treated effluent is discharged into the river. On average daily 109 tonnes of TDS with 43 tonnes of chlorides are let into river. This salt ultimately accumulates in the soil and increase the TDS level in the groundwater. The effluent reaching the river is in dark brown in colour. During summer period there is no water flow in river, only effluent flow can be noticed. In monsoon period the colour in river water can be noticed upto Kattali where the river get confluence with river Cauvery. Hence a detailed study on the impact of industrial effluent on the groundwater quality in this area is highly needed.
Figure 2 Jigger Type Dyeing Figure 3 Common Effluent Treatment Plant
1.4 Scope and objectives of the study
The farmers of Amaravathi Ayacut had filed a writ petition in the High Court of Madras seeking compensation for damage caused to their crops, lands and the well water due to pollution by the textile bleaching and dyeing units in Karur. The Hon’ble Court directed the Loss of Ecology (Prevention & Payment of Compensation) Authority, which is a Central Government organization to assess the loss to ecology and environment in the Amaravathi river basin. The LoEA had carried out an extensive study on environmental and ecological impacts in the Amaravathi river basin by collecting groundwater samples in the affected areas and established its linkage to the damage. The survey covered a boundary of about 3 km width on both sides of the Amaravathi river. Based on the TDS values in the ground water, the areas were classified as Class I to V. In all the water samples, the dominant cationic
INTERNATIONAL JOURNAL OF ENVIRONMENTAL SCIENCES Volume 1, No1,2010
© Copyright 2010 All rights reserved Integrated Publishing services
Research Article ISSN 0976 – 4402
94
species was sodium which confirms that chloride is in the form of NaCl which mainly comes from bleaching & dyeing units. The over all study concluded that in three villages the TDS was in the range of 3500 4900 mg/L and majority of villages are in range of 1000 – 3500 mg/L. This study was conducted in 2003. Even after seven years, there is no improvement in the quality of CETP effluent discharge into the river. The problem is aggravated and the farmers are severely making complaints and filed writ petitions. This is because of continuous increase of TDS level in the ground water. This situation motivated for a detailed study on the issue and find out a solution for the same. Accordingly this study was carried out as follows: i. Detailed assessment was made on the existing groundwater quality on either side of
the Amaravathi river basin from Aravakurichi to Kattalai (40 km stretch) with special focus on 10 km stretch (i.e) from Karur to Kattalai which is highly affected due industrial discharge.
ii. Groundwater quality was predicted to this area for next 15 years by using the Visual MODFLOW software under five different scenarios.
iii. Remedial measures are suggested to improve the groundwater quality in this area.
2 Review of Literature
2.1 Groundwater models
Groundwater models describe groundwater flow, fate and transport processes using mathematical equations that are based on certain simplifying assumptions. These assumptions typically involve the direction of flow, geometry of the aquifer, the heterogeneity or anisotropy of the sediments or bedrock within the aquifer, the contaminant transport mechanisms and chemical reactions. The equations that describe the groundwater flow and fate and transport processes can be solved using different types of models. Analytical models give exact solutions to equations that describe very simple flow or transport conditions. Whereas Numerical models give approximation results but solving complex field conditions.
2.2 Governing equation on groundwater quality modeling
2.2.1. General mass balance equation
The equation governing the movement of dissolved constituents in ground water due to advection and dispersion can be developed by utilizing a conservation of mass approach and employing Fick’s law of dispersion. The mass balance of pollutant transport can be stated as, ∑ ∑ ∑ ∑ ∑ = − − + A L O P I … (1) Where I = input, P = production, O = out put, L = loss, A = accumulation.
2.2.2. Flow equation
Modeling is translating the physical system into mathematical terms. The governing flow equation for threedimensional saturated flow in saturated porous media is:

INTERNATIONAL JOURNAL OF ENVIRONMENTAL SCIENCES Volume 1, No1,2010
© Copyright 2010 All rights reserved Integrated Publishing services
Research Article ISSN 0976 – 4402
95
t h S Q
z h K
z y h K
y x h K
x s z y x ∂ ∂
= ±
∂ ∂
∂ ∂
+
∂ ∂
∂ ∂
+
∂ ∂
∂ ∂
... (2)
Where, Kx, Ky, Kz = hydraulic conductivity along the x, y, z axis which are assumed, m/sec
(LT 1 ) h = piezometric head, m (L) Q = volumetric flux per unit volume representing source / sink terms, T 1 Ss = specific storage coefficient defined as the volume of water released
from storage per unit change in head per unit volume of porous material, L 1
t = Time, (s) T
2.2.3. Solute transport equation
The equation represents the movement of flux of solute mass through a control volume. The equation states that the sum of all mass, which consumes or creates solute with the control volume, must be equal to a change in the concentration of the solute with the control volume.
( ) ( )
∂ ∂
+ ∂ ∂
+ ∂ ∂
−
∂ ∂
∂ ∂
+
∂ ∂
∂ ∂
+
∂ ∂
∂ ∂
= ∂ ∂ ) ( C V
z C V
y C V
x z C D
z y C D
y x C D
x t C
z y x z y x … (3)
Where, Vx, Vy, Vz = Seepage velocities in x, y, z directions, m/s (LT 1 ) Dx, Dy, Dz = Dispersion coefficients,m 2 /sec (L 2 T 1 ) C = Solute concentration, mg/m 3 (ML 3 ) t = Time, (s) T The governing equations for groundwater systems are usually solved either analytically or numerically.
2.3 Visual MODFLOW
Visual MODFLOW is an integrated modeling environment for MODFLOW, MODPATH, MT3D. It provides professional 3D groundwater flow and contaminant transport modeling using MODFLOW, MODPATH, MT3DMS and RT3D. It allows to graphical design the model grid, properties and boundary conditions, visualize the model input parameters in two or three dimensions, run the groundwater flow, pathline and contaminant transport simulations, automatically calibrate the model using Win PEST or manual methods, display and interpret the modeling results in threedimensional space.
2.4 Various studies conducted using MODFLOW
2.4.1 Tannery effluent discharge
P.Sundarajan (2000) studied impact of ground water quality due to the tannery effluent discharge in Pernampet block, Vellore District. He concluded that at any stress period, difference between storage in and out was equal to the difference in recharge and abstraction.

INTERNATIONAL JOURNAL OF ENVIRONMENTAL SCIENCES Volume 1, No1,2010
© Copyright 2010 All rights reserved Integrated Publishing services
Research Article ISSN 0976 – 4402
96
Temporal variation of groundwater level indicates the magnitude of recharge and discharge and aquifer storage coefficient. The occurrence and its movement were directly proportional to the rainfall and general geology of the area. Water balance study reveals that the irrigation bstraction is the main parameter for groundwater depletion. The total outflow from the volumetric budget was in higher side than the dynamic groundwater potential obtained from the Theisson polygon map method. B.Srisathya (2001) carried out a study on the groundwater quality degradation due to tanneries and improvement after commencement common effluent treatment plants (CETP) in Vellore district using MODFLOW. He concluded that groundwater quality with respect to TDS had improved after the commissioning of CETPs. Velocity vectors in 1997 and 2000 show considerable change in the flow direction and magnitude after the existence of CETP. M.V. Molykutty et al (2003) had developed model for the TDS movement in Uppar Palar river basin using Visual MODFLOW. At first, the flow modeling of the basin is developed to find out the hydraulic heads and velocity of flow of ground water in the basin. The calculated values are retrieved in the mass transport package MT3D to find the concentration of TDS in the ground water for various scenarios. S.Mohan et al (2004) had applied mathematical model for prediction of pollutant transport in subsurface flow in Palar river basin. They predicted the fate of TDS concentration over a longer period for the following six different scenarios (i.e). the same level of pollution is continued by the tanneries, effluent is treated to the TDS level of 10000 mg/l, the effluent is treated to 2100 mg/l permitted level by Tamil Nadu Pollution Control Board (TNPCB), no effluent discharge into the river Palar basin, the quantum of effluent is doubled with the TDS concentration value of 2100 mg/l, ground water recharge is increase by 1.5 times and with 10,000 mg/L TDS. They concluded that mass transport modeling simulation can effectively be used for studying the pollutant migration in a river basin. Thus the role of water quality models in the filed of groundwater quality and pollutant transport in subsurface studies is fully affirmed. The model parameters can be effectively estimated by solving the inverse problem. The effect of recharge of groundwater is significant as the contamination development in the aquifer getting very much reduced if the recharge rate is increased. The model results show that the effect of contamination will be there for a quite long time even if there is no effluent discharge into the aquifer which infers that remediation measures are to be employed to remove the pollutants from contaminated aquifers. N.C.Mondal et al (2005) had done the modeling of pollutant migration in Tannery belt, Dindigul by applying Visual MODFLOW. They concluded that groundwater in and around Dindigul town in Tamil Nadu, is polluted due to discharge of untreated effluents from 80 functional tanneries. TDS in about 100 km2 area are observed ranging from 2000 to 30,573 mg/L in open dug wells. A mass transport model was constructed to study pollutant migration. The study area covering 240 km2 was chosen to construct the groundwater flow model in the weathered part of unconfined aquifer system. The shallow groundwater potential field computed through the flow model was then used as input to the mass transport model. MT3D computer code was used to simulate mass transport in groundwater. Sensitivity analysis, an integral part of calibration was carried out whereby model parameters, viz. transmissivity, dispersivity etc., were altered slightly and the effect on calibration statistics as observed. This study indicated that the migration phenomenon is mainly through advection rather than dispersion. The study also indicated that even if the pollutant sources were reduced to 50% of the present level, TDS concentration level in the groundwater, even after 20 years, would not be reduced below 50% of present level.

INTERNATIONAL JOURNAL OF ENVIRONMENTAL SCIENCES Volume 1, No1,2010
© Copyright 2010 All rights reserved Integrated Publishing services
Research Article ISSN 0976 – 4402
97
2.4.2 Pulp and paper mill effluent discharge
S. Selvakumar et al (2003) had studied the impact on groundwater quality due to application of treated pulp and paper mill effluent on 565 acres of land in Sirumugai, Coimbatore district using Visual MODFLOW. It was used to simulate the threedimensional ground water flow and contaminant transport in the effluent irrigated area. The application of sustainable option was demonstrated through the simulated values of future concentration levels for TDS, chlorides and sulphate. It is observed that the concentration values are on the increasing trend at all the observation points irrespective of options. However, the effect is minimized if diluted effluent irrigation was carried out. At 25 % and 50 % dilution, the reduction in the rate of accumulation was observed as 2–3 times and 7 times respectively. They concluded that improved or new techniques are needed to determine filed value of certain aquifer properties such as effective porosity and dispersion, which cannot readily be evaluated. Victoria Ljungberg et al (2004) had carried out assessment of groundwater flow and pollutant transport using MODFLOW in the Sulur watershed situated in the Coimbatore District. Due to the discharge of untreated sewage water into the Small tank the water has become unsuitable for irrigation. The contaminated water will also infiltrate to the groundwater and affect the water quality in the surrounding wells. The Sulur watershed hence faces a problem of both quantity and quality of water. The spatial distribution of the contaminants from the Small tank has been assessed with the transport simulation programme MODPATH. The effects of the constructed percolation ponds have also been examined. The modeling results clearly show the influence of pumping wells on the flow pattern. The model results showed that the groundwater level can be increased by the introduction of percolation ponds.
2.4.3 Chromium solid waste dump site
National Geophysical Research Institute (NGRI), Hyderabad (2008) had carried out geo environmental investigations for developing comprehensive remediation plan in and around Tamilnadu Chromate and Chemicals Ltd, Ranipet, Vellore district, where approximately 1,60,000 tonnes of chromium waste was dumped on 2 acres of open land and lying for more than 20 years. They studied chromium heavy metal transport in groundwater using visual MODFLOW. The 17.4 sq.km study area was divided into 71 rows and 46 columns with grid size of 105mX117m and simulated the plume migration for 30 years.
2.4.4 Solid waste dump site
CES, Anna University (2003) had carried a study on groundwater pollution due to solid waste dumping at Perungudi, Chennai. Visual MODFLOW, a groundwater modeling package was used to model the groundwater contamination from the dumpsite. Future scenarios for various pollutant loads were simulated. The study recommends for waste management options including waste minimization/reduction at source, material recycling, waste processing with recovery of resources.
3 Methodology
3.1 Groundwater model development process

INTERNATIONAL JOURNAL OF ENVIRONMENTAL SCIENCES Volume 1, No1,2010
© Copyright 2010 All rights reserved Integrated Publishing services
Research Article ISSN 0976 – 4402
98
The process of aquifer modeling, in general consists of the following activities. i. Identification of parameters characterizing the physical framework of the aquifer and
stress acting on it. ii. Field estimation of the relevant hydrogeological parameters at as many control points
as possible, particularly those at boundaries. iii. Interpolation/extrapolation of these parameters to characterize the entire area under
study. iv. Integration of the entire hydrological data to conceptualize and resurrect the fullscale
natural system. v. An appropriate mathematical equations describing the groundwater regime in terms
of observable such as groundwater levels or concentrations of pollution etc., vi. Calibration of the model for steady and transient condition. vii. A sensitivity analysis of the model to identify those parameters, which need to be
estimated more accurately and also to decipher the error bounds. viii. The refinement of the model to progressively bring in plausibility and compatibility
between filed estimates of the various geohydrological parameters through the process of model calibration and validation, and
ix. To evolve efficient management options to protect the groundwater.
3.2 Data Collection
Data collection is the important component in the model development process. For this research purpose, secondary data are collected from various departments. Viz Central Groundwater Board, State Public Works Department, India Metrological Department, Survey of India, Tamil Nadu Pollution Control Board.
3.2.1 Primary data collection
Apart from the well data collected from the PWD and CGWB, 13 wells were identified in the study area and water samples were collected for three seasons viz., pre monsoon, post monsoon and summer. River water samples were also collected at the upstream and down stream of Karur in 3 locations. The analysis was carried out for physico chemical parameters in Tamilnadu Water Supply and Drainage Board laboratory, Karur. The water level in wells was also measured. These results were used for model validation.
3.3 Input Parameters
3.3.1 Geological settings
Groundwater occurs under water table or phreatic conditions in weathered, jointed and fractured formations. Water table is very shallow in canal irrigated area, whereas it is some what deeper in other regions. The lithology of the boreholes indicates there is considerable thickness of weathering range from 16 m to 20 m below ground level. Sedimentary (alluvium) formation is located on either side of river Amaravathi with a thickness of 10 – 12 metres. The thickness of aquifer in hard rock formation varies from 15 to 35 metres. For modeling purpose two layers are considered. By using the SOI maps the actual elevation

INTERNATIONAL JOURNAL OF ENVIRONMENTAL SCIENCES Volume 1, No1,2010
© Copyright 2010 All rights reserved Integrated Publishing services
Research Article ISSN 0976 – 4402
99
(amsl) of the top layer was entered in the model. By using lithology data the layer thickness are assigned.
3.3.2 Wells
Pumping wells: Based on the groundwater extraction statistics given in the district profile report of Groundwater Division, PWD, pumping wells were located in the grid and the pumping rate were assigned. Uniform pumping rate were assumed throughout the year. Head observation wells: The calibration package of the Visual MODFLOW saves the calculated heads at the locations of specified observation wells. This allows the modular to compare simulated heads with observed heads, produce calibration statistics, and produce hydrographs at observation wells. Therefore head observation wells were located in the grid. Concentration observation well: PWD and CGWB is already monitoring the groundwater quality at the various locations of the Amaravathi river basin. For the model calibration and prediction purpose selected well are marked in the grid and the values are entered. 3.3.3 Aquifer Properties With the available literature and the PWD, CGWB study reports, the aquifer properties are assigned in the model as follows:
Table 1 Aquifer properties
S.No. Model Properties Layer I Alluvium
Layer II Hard Rock
1 Hydraulic conductivity in longitudinal direction Kx, m/sec 5.2e4 1.04e4 2 Hydraulic conductivity in lateral direction Ky, m/sec 5.2e4 1.04e4 3 Hydraulic conductivity in vertical direction Kz, m/sec 5.2e5 1.04e5 4 Transmissivity, m 2 /sec 2.4e3 8.7e4 5 Specific storage Ss (1/m) 5e4 1e4 6 Specific Yield Sy 0.068 0.023 7 Effective Porosity 0.2 0.15 8 Total Porosity 0.2 0.15
3.3.4 Model boundary conditions
4 km on either side of the river Amaravathi is set as north and south model boundary and it is assigned as no flow boundary, because there is no influence of water table due to the flow in the river. This north and south boundary are generally in dry nature hence a constant head is assumed. The river entering point near Aravakurichi and the confluence point at Kattali are assigned as west and east flow boundary. River boundary is assigned in the top layer. The levels (amsl) of river starting point and end point are entered. The conductance of the river is considered as 1000m 2 /day. Recharge 630 mm/year is assigned for the entire top layer. Higher recharge rate is assigned near Karur by taking into account of industrial effluent discharge and wet agricultural lands in the down stream of Karur. Evopatraspiration rate is assumed as 30 % of recharge.

INTERNATIONAL JOURNAL OF ENVIRONMENTAL SCIENCES Volume 1, No1,2010
© Copyright 2010 All rights reserved Integrated Publishing services
Research Article ISSN 0976 – 4402
100
Figure 4 Discretization of Study Area Figure 5 Cross section along column
3.3.5 Particle Transport Parameter As established by the LoEA study, the main cause for groundwater pollution in the basin is TDS. Therefore, the conservative (non reactive) pollutant TDS is taken for the transport analysis. The transport engine is MT3DMS. Linear isotherm (equilibrium controlled) with no kinetic reactions are assumed. The dispersion coefficient 10.15 X 10 10 m 2 /sec is assumed. The dispersivity is taken as 0.00033m.
Figure 6 Calibration graph of MODFLOW Figure 7 Residual distribution histogram
Figure 8 Equipotential Contour lines Figure 9 Cross section along row

INTERNATIONAL JOURNAL OF ENVIRONMENTAL SCIENCES Volume 1, No1,2010
© Copyright 2010 All rights reserved Integrated Publishing services
Research Article ISSN 0976 – 4402
101
Figure 10 Velocity vectors of flow Figure 11 Cross section along row
3.3.6 Designating the contaminant source
CETPs outlet point in the river is located in the grid and the TDS concentration is given in the input file.
3.4 Model Run
MODFLOW is run and calibrated and validated with 15 years data obtained from PWD. Then MODPATH and MT3DMS were run. The concentration levels observed for the year 1994 was taken as initial condition. The initial values of the parameters such as porosity, hydraulic conductivity, longitudinal and transverse dispersitivities were used for simulation.. The simulation was carried out and the results were compared with the observed data for the year 1999, 2004, 2009. The simulation runs were repeated with increments in dispersivity, hydraulic conductivity and porosity. The MODFLOW and MODPATH and MT3D models were run for steady state and transient state. Calibration of the model is done by adjusting the input parameters so to match the simulated results with field measured results with 95 % confidence level. The validated model was run for further 5475 days (15 years) simulation period (forward tracking) under five scenarios as per the objective of the study.
Figure 12 Particle path line – Row view Figure 13 Particle path line – Column view

INTERNATIONAL JOURNAL OF ENVIRONMENTAL SCIENCES Volume 1, No1,2010
© Copyright 2010 All rights reserved Integrated Publishing services
Research Article ISSN 0976 – 4402
102
4.0 Results and Discussion
4.1 Existing ground water quality
The Groundwater Wing of Tamil Nadu State Public Works Department monitors ground water quality in 8 location of Amaravathi river basin of Karur district on half yearly basis, since 1972. Past 15 years data were collected form PWD. TDS observed in eight wells during July 2003 to January 2007 is given in Table 2. The values are in increasing trend.
Table 2. TDS levels (mg/l) in PWD monitoring wells
Well No.
Location Jul’0 3
Jul’ 04
Jan’0 5
Jul’ 05
Jan’0 6
Jul’06 Jan’0 7
14022 Chinnadarapuram 735 1395 1807 477 1543 2132 821 73082 Nagampalli 1050 659 1744 797 1550 1225 750 14008D Karudayampalayam 1740 1679 1708 449 1222 1163 1172 14012D Kakkavadi 1237 897 997 1001 1306 1534 1217 73071 Kaliyappagoundanur 1160 1099 1208 949 787 964 853 73054 Thannirpandalplayam 1756 1881 1890 750 2075 1940 2181 14013D Puliyur 968 538 570 559 700 1121 945 73072 Valayalkaranputhur 2040 1598 1551 223 1568 1757 1776 During this study period, 13 wells were located in addition to 8 PWD monitoring wells in the study area and samples were collected and analyzed. The results are given below.
Table 3 TDS level (mg/l) in the wells located for primary data during this study
Well No.
Village name Pre monsoon (14.9.2008)
Post monsoon (31.1.2009)
Summer (29.5.2009)
Summer (13.3.2010)
1 Aravakuruchi 1460 1880 1470 1560 2 Thokkupatti 720 980 630 830 3 Thumbivadi 1280 1650 2020 1970 4 Senkalipalayam 960 1150 1520 1680 5 Andankoil 3620 1530 3120 3040 6 Kollandagoundanur 3060 2860 2680 2780 7 Balamalpuram 4080 1950 3240 3310 8 Sanapiratti 3860 3220 3060 3240 9 Nerur 3180 3100 3080 3060 10 Kovilpalayam 4100 4280 3760 3890 11 Uthukarapatty 1370 1250 1400 1470 12 Renganathanpettai 1060 1230 1470 1350 13 Kattalai 1910 3160 2280 2370
Desirable TDS level in drinking water as per IS 10500 : 1991 is 500 mg/L. TDS was found in the range of 630 – 4280 mg/L. All 13 locations exceeded the desirable limit of 500 mg/L.

INTERNATIONAL JOURNAL OF ENVIRONMENTAL SCIENCES Volume 1, No1,2010
© Copyright 2010 All rights reserved Integrated Publishing services
Research Article ISSN 0976 – 4402
103
The highest value was recorded in a well at Kovilpalayam.
4.2 River water quality
PhysicoChemical parameters of samples collected in Amaravathi river reveals that the surface water is polluted due to the effluent discharge. TDS at 1 km upstream of Karur town was 230 590 mg/L, near Karur town was 430 – 5360 mg/L and 10 km down stream of Karur town was 480 – 690 mg/L. Permissible level of TDS in class C surface water body as per IS 2296 : 1982 is 500 mg/L. Dissolved oxygen in the river upstream was 5 6.7 mg/L, near Karur was 4.6 – 6.8 mg/L and 10 km down stream was 5.2 – 6.6 mg/L. Minimum DO level in class C surface water body is 4.0 mg/L. During summer there is no water flow in the river. The river acts as drainage for dyeing effluent and domestic sewage.
4.3 Model output
The model out put gives the contours for equipotential, head difference, head flux, drawdown, water table, TDS concentration. The velocity vectors visualize the speed and direction of water particle as it moves through flow field. The out put screen also gives the concentration verses time (in days). The Visual MODFLOW out put screen also gives residual histograms as well as normalized RMS vs time graph. The simulated results for five scenarios are plotted for TDS verses Year for eight monitoring wells located on either side of Amaravthi river which are influenced by the discharge of dyeing effluents. Scenario 1: The existing discharge from the CETPs with TDS of 10,000 mg/L continues, then the TDS level in all the observation wells will be increased. The well located at Puliyur the downstream side of Karur reaches the highest value of 8000 mg/L in the next fifteen years. The well located at Valayalkaranpudur about 7 Km down stream of Karur is marginally influenced with TDS level of 4000 mg/L. Whereas the well at Renganathanpettai is least influenced by the dyeing effluent discharge, because the river Cauvery is flowing at about 2 Km on northern side. Wet agricultural activities by using Cauvery water is going on.
0
1000
2000
3000
4000
5000
6000
1994 1999 2004 2009 2014 2019 2024
Year
TDS m
g/L
Scenario 1 Scenario 2 Scenario 3 Scenario 4 Scenario 5
0
500
1000
1500
2000
2500
3000
3500
1994 1999 2004 2009 2014 2019 2024 Year
TDS m
g/L
Observed Scenario 1 Scenario 2 Scenario 3 Scenario 4 Scenario 5
Figure 14 Aandankoil well TDS Profile Figure 15 Kaliyappagoundanur well TDS Profile

INTERNATIONAL JOURNAL OF ENVIRONMENTAL SCIENCES Volume 1, No1,2010
© Copyright 2010 All rights reserved Integrated Publishing services
Research Article ISSN 0976 – 4402
104
Scenario 2: As per the TNPCB discharge standards when the CETPs meet the TDS level of 2100 mg/L, the impact is felt in ground water quality. TDS level is getting reduced by 1500 mg/L in almost all the wells when compared with scenario 1. However the TDS is towards
increasing trend only, which ultimately have adverse effect on ground water quality.
0
1000
2000
3000
4000
5000
6000
7000
1994 1999 2004 2009 2014 2019 2024
Year
TDS m
g/L
Scenario 1 Scenario 2 Scenario 3
Scenario 4 Scenario 5
0
1000
2000
3000
4000
5000
6000
7000
8000
9000
1994 1999 2004 2009 2014 2019 2024
Year TD
S m
g/L
Observed Scenario 1 Scenario 2
Scenario 3 Scenario 4 Scenario 5
Figure 16 Balamalpuram well TDS Profile Figure 17 Puliyur well TDS Profile
Scenario 3: Karur is a fast growing textile business centre. Therefore the existing industries may go for increase of production which will ultimately result in additional quantity of effluent discharge. For the study purpose it is considered as double the quantity of effluent discharge with TDS level of 2100 mg/L. In such a case the TDS in all the wells are again in raising trend when compared to scenario2. Non of the wells meet the desirable limit of 500 mg/L TDS level in drinking water as per IS 10500: 1991.
0
500
1000
1500
2000
2500
3000
3500
4000
4500
1994 1999 2004 2009 2014 2019 2024
Year
TDS m
g/L
Observed Scenario 1 Scenario 2 Scenario 3 Scenario 4 Scenario 5
0
1000
2000
3000
4000
5000
6000
1994 1999 2004 2009 2014 2019 2024
Year
TDS m
g/L
Scenario 1 Scenario 2 Scenario 3
Scenario 4 Scenario 5
Figure 19 Valayalkaranpudur well TDS Profile Figure 20 Nerur well TDS Profile
Scenario 4: Because of the discharge of untreated / partially treated effluent by the textile bleaching and dyeing units in Karur for past 20 years, the well water on both side of Amaravathi river was affected and hence the farmers seeks compensation. In order to protect
INTERNATIONAL JOURNAL OF ENVIRONMENTAL SCIENCES Volume 1, No1,2010
© Copyright 2010 All rights reserved Integrated Publishing services
Research Article ISSN 0976 – 4402
105
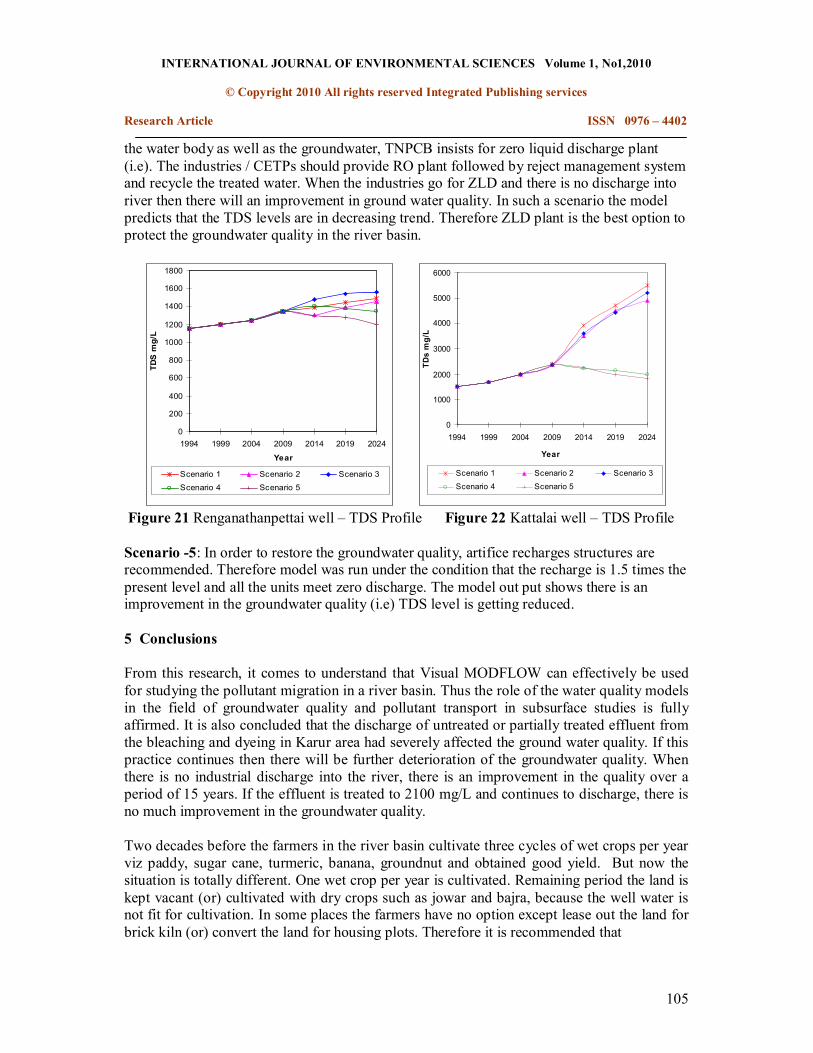
the water body as well as the groundwater, TNPCB insists for zero liquid discharge plant (i.e). The industries / CETPs should provide RO plant followed by reject management system and recycle the treated water. When the industries go for ZLD and there is no discharge into river then there will an improvement in ground water quality. In such a scenario the model predicts that the TDS levels are in decreasing trend. Therefore ZLD plant is the best option to protect the groundwater quality in the river basin.
0
200
400
600
800
1000
1200
1400
1600
1800
1994 1999 2004 2009 2014 2019 2024
Year
TDS m
g/L
Scenario 1 Scenario 2 Scenario 3
Scenario 4 Scenario 5
0
1000
2000
3000
4000
5000
6000
1994 1999 2004 2009 2014 2019 2024
Year
TDs mg/L
Scenario 1 Scenario 2 Scenario 3 Scenario 4 Scenario 5
Figure 21 Renganathanpettai well – TDS Profile Figure 22 Kattalai well – TDS Profile
Scenario 5: In order to restore the groundwater quality, artifice recharges structures are recommended. Therefore model was run under the condition that the recharge is 1.5 times the present level and all the units meet zero discharge. The model out put shows there is an improvement in the groundwater quality (i.e) TDS level is getting reduced.
5 Conclusions
From this research, it comes to understand that Visual MODFLOW can effectively be used for studying the pollutant migration in a river basin. Thus the role of the water quality models in the field of groundwater quality and pollutant transport in subsurface studies is fully affirmed. It is also concluded that the discharge of untreated or partially treated effluent from the bleaching and dyeing in Karur area had severely affected the ground water quality. If this practice continues then there will be further deterioration of the groundwater quality. When there is no industrial discharge into the river, there is an improvement in the quality over a period of 15 years. If the effluent is treated to 2100 mg/L and continues to discharge, there is no much improvement in the groundwater quality.
Two decades before the farmers in the river basin cultivate three cycles of wet crops per year viz paddy, sugar cane, turmeric, banana, groundnut and obtained good yield. But now the situation is totally different. One wet crop per year is cultivated. Remaining period the land is kept vacant (or) cultivated with dry crops such as jowar and bajra, because the well water is not fit for cultivation. In some places the farmers have no option except lease out the land for brick kiln (or) convert the land for housing plots. Therefore it is recommended that

INTERNATIONAL JOURNAL OF ENVIRONMENTAL SCIENCES Volume 1, No1,2010
© Copyright 2010 All rights reserved Integrated Publishing services
Research Article ISSN 0976 – 4402
106
i. The textile bleaching and dyeing units and CETPs shall provide zero liquid discharge plant as recommended by the TNPCB. The discharge into the river system should be completely stopped.
ii. Until implementing ZLD plant, the bleaching and dyeing units and CETPs have to be thoroughly monitored for quality and quantity of effluent discharge. Stringent measures are to be adopted to ensure that the discharged effluent is treated properly and it adheres to the discharge standards prescribed by TNPCB in order to avoid further deterioration of the existing condition.
iii. The existing industries shall switchover from porcelain dyeing to naphtha dyeing process which ultimately reduce the salt usage.
iv. The industries shall go for advance process technology such as soft flow machine so as to reduce water consumption and wastewater generation.
v. New bleaching and dyeing industries should not be permitted in this area until (atleast for 10 years) improvement of existing ground water quality.
vi. Artificial recharge structures such as percolation pond, check dams, recharge pit, recharge shaft, contour trench, nallah bund, recharge tube wells and subsurface dyke shall be constructed in Amaravathi river basin area so as to augment the ground water recharge by way of rain water harvesting.
vii. Indiscriminate sand mining in the river bed had depleted the aquifer recharge rate. This should be stopped immediately. Sand mining in the river bed should be banned atleast for 5 years.
viii. Existing ponds / tanks should be cleaned, protected and properly managed and dumping of municipal solid waste in the tanks / ponds should be banned. Recharging of wells through rooftop rainwater should be made mandatory.
ix. The application of chemical fertilizers and pesticides should be gradually reduced and replaced by biodegradable compost and other substitutes.
x. Farmers should be educated for optimum use of groundwater for irrigation and to go for drip and sprinkler type irrigation.
xi. Salt tolerant crops shall be introduced to the farmers so as to cultivate in the high TDS water area.
xii. The domestic sewage from the Karur town should be completely collected, treated and used for farming. Municipal solid waste should be disposed in engineered land fill. CETP sludge which is classified as hazardous solid waste should be disposed in secured land fill facility (or) it may be disposed for coprocessing in cement kiln.
6. References 1 Ahmed E.Hassan, Hesham M.Bekhit, Jenny B.Chapman (2008) ‘Uncertainty
assessment of a stochastic groundwater flow model using GLUE analysis’ Journal of Hydrology, No. 362 pp. 89109.
2 Alexander Y.Sun (2008) ‘CONSID: A Toolbox for contaminant Source Identification’ Ground Water, Vol. 46 No. 4 pp. 638641.
3 Bhasker K. Rao and Deborah L. Hathaway (1989) ‘A threedimensional mixing cell solute transport and its application’ Ground Water, Vol. 27 No. 4 pp. 509516.
4 Cors ven den Brink, Willem Jan Zaadnoordijk, Saskia Burgers and Jasper Griffioen

INTERNATIONAL JOURNAL OF ENVIRONMENTAL SCIENCES Volume 1, No1,2010
© Copyright 2010 All rights reserved Integrated Publishing services
Research Article ISSN 0976 – 4402
107
(2008) ‘Stochastic uncertainties and sensitivities of a regionalscale transport model of nitrate in groundwater’ Journal of Hydrology, No. 361 pp. 309318.
5 Fritz Stauffer (2005) ‘Uncertainty estimation of pathlines in ground water models’ Ground Water, Vol. 43 No. 6 pp. 843849.
6 Gregorauskas.M, Klimas.A, and Bendoraitis.A (1999) ‘A model of groundwater flow and contaminant transport at Klaipeda oil terminal, Lithuania’ Boundary Filed Problems and Computer Simulation Environmental Simulation, Riga.
7 Hank E.Julian, Mark Boggs .J, Chunmiao Zheng and Erin Feehley.C (2001) ‘Numerical simulation of a natural gradient tracer experiment for the natural attenuation study: Flow and physical transport’ Ground Water, Vol. 39 No. 4 pp. 534 545.
8 Henk Haitjema, Vic Kelson and Wim de Lange. (2001) ‘Selecting MODFLOW cell sizes for accurate flow fields’ Ground Water, Vol.39 No.6 pp. 931938.
9 Jens Wolf, Roland Barthel and Jurgen Braun. (2008) ‘Modeling groundwater flow in alluvial mountainous catchments on a watershed scale’ Ground Water, Vol. 46 No. 5 pp. 695705.
10 Joanna L. Moreno and Peter O.Sinton ‘Groundwater model flow calibration – comparison of a decision tree approach and automated parameter estimation for a practical application with limited data’ URS Corporation, Denver, CO, USA
11 John P.Wilson, William P.Inskeep, Jon M. Wraith and Robert D (1996) ‘GISbased solute transport modeling applications: Scale effects of soil and climate data input’ Journal of Environmental Quality. 25(3) pp. 445453.
12 LiTang Hu and ChongXi Chen (2008) ‘Analytical methods for transient flow to a well in a confinedunconfined aquifer’ Ground Water, Vol. 46 No. 4 pp. 642646.
13 Mohan S and Muthukumaran M. (2004) ‘Modeling of pollutant transport in groundwater’. Institution of Engineers (India) EN, Vol. 85 pp2232.
14 Mohan S and Gandhimathi R. (2009) ‘Solid waste characterization and the assessment of the effect of dumping site leachate on groundwater quality: a case study’. Int. Journal of Environmental and Waste Management, Vol3 , Nos,1/2, pp. 65 – 77
15 Molykutty M.V., Jothilakshmi M and Thayumanavan S. (2005) ‘Groundwater flow modeling of upper Palar Basin’ Indian J. Environmental Protection Vol.25 No.10 pp. 865872.
16 Mondal N.C. and Singh V.S. (2003) ‘Aquifer modeling study in and around Dindigul town, Tamilnadu, India’ The International Conference on Water and Environment, December 1518, 2003 Bhopal, India. pp. 188198

INTERNATIONAL JOURNAL OF ENVIRONMENTAL SCIENCES Volume 1, No1,2010
© Copyright 2010 All rights reserved Integrated Publishing services
Research Article ISSN 0976 – 4402
108
17 Rebecca C. Doble, Craig T., Simmons and Glen R.Walter (2009) ‘Using MODFLOW 2000 to Model ET and Recharge for shallow groundwater problems’ Ground Water Vol. 47 No. 1 pp. 129135.
18 Rosemary W.H. Carroll, Greg M. Pohll, Sam Earman, and Ronald L. Hershey. (2008) ‘A comparison of groundwater fluxes computed with MODFLOW and a mixing model using deuterium: Application to the eastern Nevada test site and vicinity’ Journal of Hydrology Vol. 361 pp. 371385.
19 Scott Painter, Hakan Basagaoglu and Angang Liu (2008) ‘Robust Representation of dry cells in singlelayer MODFLOW models’ Ground Water, Vol. 26 No. 6 pp. 873 881.
20 Stagnitti F, Ling Li and Barry A, Allinson G and Lakshmanan (2001) ‘Modeling solute transport in structured soils: Performance evaluation of the ADR and TRM models’ Mathematical and Computer Modeling 34 (2001) pp 433440.
21 Thangarajan M. (1999) ‘Modeling pollutant migration in the Upper Palar River Basin, Tamil Nadu, India’ Environmental Geology Vol. 38 No.3 pp. 209222
22 Thomas Reimann and Melissa E. Hill (2009) ‘MODFLOWCFP: A new conduit flow process for MODFLOW2005’ Ground Water, Vol. 47 No. 3 pp. 321325.