groundwater brouchure tapi district gujaratcgwb.gov.in/district_profile/gujarat/tapi.pdf · the...
TRANSCRIPT

1
For Official Use
Technical Report Series
GROUNDWATER BROUCHURE
TAPI DISTRICT
GUJARAT
Compiled
By
Sunita Devi
STA (Geophysics)
Government of India
Ministry of Water Resources
Central Ground Water Board
West Central Region
Ahmedabad
AAP Year 13-14

2
TAPI DISTRICT AT A GLANCE
SL
No.
Items Statistics
1 General Information
i) Geographical area as per state territory/as per village papers
(Sq. Km)
3,238.83
ii) Administrative Divisions (As on 3/2011)
Number of Talukas
Number of Villages
5
488
iii) Populations (As on 2011 census) 8,06,489
iv) Average Annual Rainfall (mm) (1982 to 2011)
normal annual rain fall (mm)
1344
2. GEOMORPHOLOGY
Major Physiographic Units: Hilly areas, piedmont slopes and Alluvium
Major Drainages: Perenial rivers-Tapi, Kim, Ver, Mindola, Jhankhari and Purna rivers
3. MAJOR SOIL TYPES : Light coloured soils, Garot soils and black cotton soils
4. NUMBERS OF GROUND WATER MONITORING WELLS OF CGWB (As on 31-3-
2011)
11 Dug wells
5. PREDOMINANT GEOLOGICAL FORMATIONS: Deccan trap basalts with dykes and older
alluvium(Quarternary ) fine, light coloured argillaceous loam with nodular lime concretions (kankar), younger
alluvium river and stream deposits.
6. HYDROGEOLOGY
Major Water Bearing Formation: Deccan trap basalts with dykes and alluvium
Depth to water Level during 2011-12
Period Phreatic Aquifer (DTW) Semi-confined Aquifer (PZ head)
Min Max Min Max
Pre Monsoon 2.76
(Vadalekhord)
14.75
(Nizar)
NA NA
Post Monsoon 0.92
(Vadalikhord)
11.32
(Nizar)
NA NA
Long Term (10 Years) Water Level Trend (2001 to 2010)
Trend Pre-Monsoon Post- Monsoon
Rise (m/Yr) 0.0295 (Jaisinghpura) to
0.1526 (Tawali)
0.0068 (Gandhinagar) to
0.2355 (Kherwa)
Fall (m/Yr) 0.007 (vyara 1) to
0.3414 (Bedchit)
0.0171 (Valod) to
0.162 (Jesingpura)
7. GROUND WATER QUALITY: In general potable and fresh.
8. DYNAMIC GROUND WATER RESOURCES (2009)
Annual Replenishable Ground Water Resources (MCM) 514.96
Net Ground water Availability (MCM) 468.60
Projected Demand for Domestic and industrial Uses upto 2025 (MCM) 18.24
Stage of Ground Water Development (%) 22.94
3
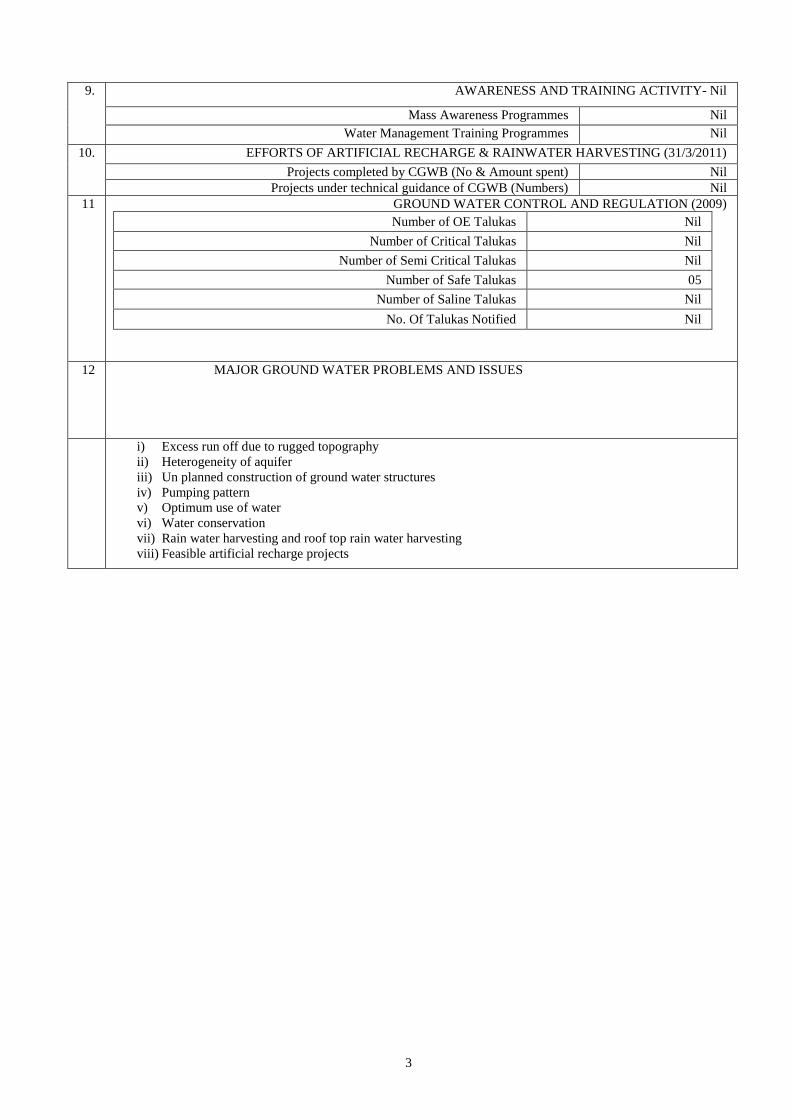
9. AWARENESS AND TRAINING ACTIVITY- Nil
Mass Awareness Programmes Nil
Water Management Training Programmes Nil
10. EFFORTS OF ARTIFICIAL RECHARGE & RAINWATER HARVESTING (31/3/2011)
Projects completed by CGWB (No & Amount spent) Nil
Projects under technical guidance of CGWB (Numbers) Nil
11 GROUND WATER CONTROL AND REGULATION (2009)
Number of OE Talukas Nil
Number of Critical Talukas Nil
Number of Semi Critical Talukas Nil
Number of Safe Talukas 05
Number of Saline Talukas Nil
No. Of Talukas Notified Nil
12 MAJOR GROUND WATER PROBLEMS AND ISSUES
i) Excess run off due to rugged topography
ii) Heterogeneity of aquifer
iii) Un planned construction of ground water structures
iv) Pumping pattern
v) Optimum use of water
vi) Water conservation
vii) Rain water harvesting and roof top rain water harvesting
viii) Feasible artificial recharge projects
4
D I S T R I C T G R O U N D W A T E R B R O C H U R E
T A P I D I S T R I C T
G U J A R A T
INTRODUCTION
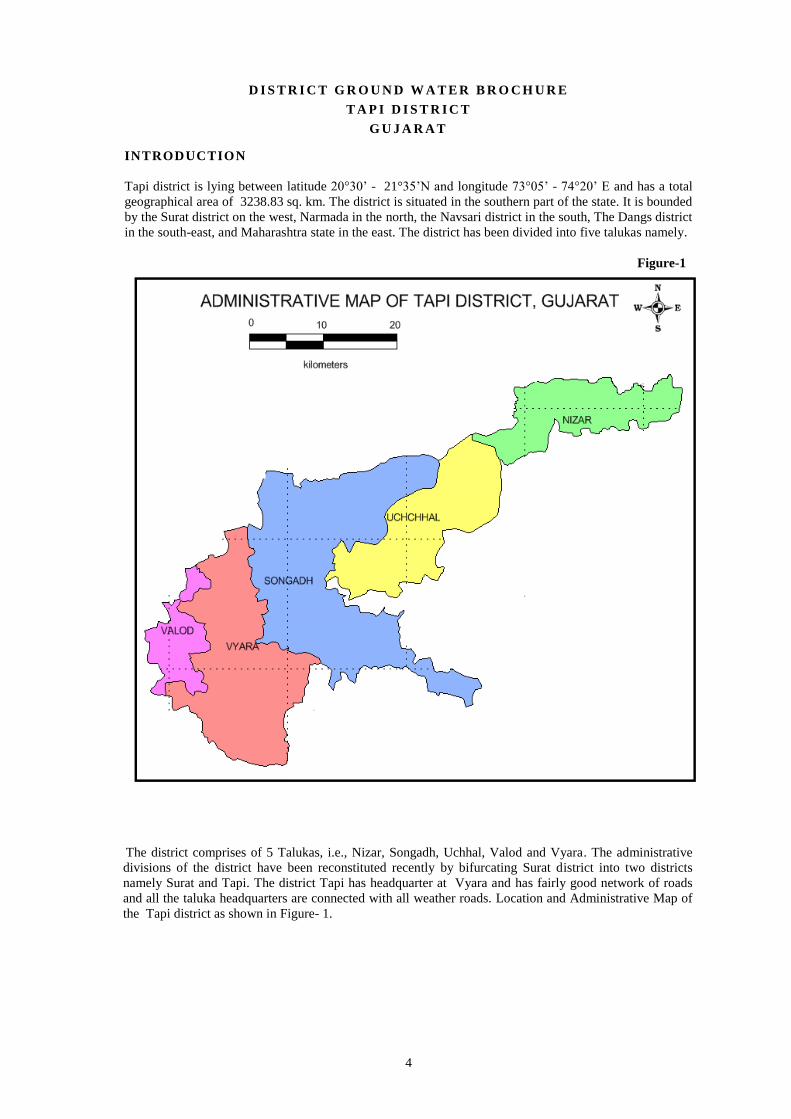
Tapi district is lying between latitude 20°30‟ - 21°35‟N and longitude 73°05‟ - 74°20‟ E and has a total
geographical area of 3238.83 sq. km. The district is situated in the southern part of the state. It is bounded
by the Surat district on the west, Narmada in the north, the Navsari district in the south, The Dangs district
in the south-east, and Maharashtra state in the east. The district has been divided into five talukas namely.
Figure-1
The district comprises of 5 Talukas, i.e., Nizar, Songadh, Uchhal, Valod and Vyara. The administrative
divisions of the district have been reconstituted recently by bifurcating Surat district into two districts
namely Surat and Tapi. The district Tapi has headquarter at Vyara and has fairly good network of roads
and all the taluka headquarters are connected with all weather roads. Location and Administrative Map of
the Tapi district as shown in Figure- 1.

5
Table 1 Geographical Area
Sl. No Taluka Geographical
Area (Sq. Km.)
1 Nizar 395.90
2 Songadh 1206.67
3 Uchhal 621.51
4 Valod 202.26
5 Vyara 812.49
Total Area 3238.83
2.HYDROMETEOROLOGY
The district has been bifurcated from earlier Surat district and its meteorological station is located in Surat
town. Therefore, the climatological data of IMD station located at Surat is discussed here.
There are many rain gauge stations which are being monitored by different state government agencies.
The Water Resources Investigation Circle (WRI) under the department of Narmada Water Resources,
Govt. of Gujarat, monitors most of the rain gauge stations and also collects and compiles the rainfall data
collected by different agencies.
Long term mean monthly climatological parameters (IMD 1951-80) like maximum and minimum
temperatures, relative humidity, wind speed and rainfall are given in Table 2.1 and depicted in Figure- 2
Table -II IMD Climatological Data
Month Max
Temp
Min
Temp
Humidity
Wind
Speed
Sunshine
PET Rainfall
(°C) (°C) (%) Km/h (Hours) (mm/d) (mm)
January 31.5 14.3 52.0 4.70 9.7 3.9 0.0
February 33.5 16.1 47.5 4.83 10.3 4.7 0.4
March 36.2 20.1 48.0 5.10 9.9 5.7 1.5
April 37.7 23.7 52.0 5.65 10.5 6.6 0.3
May 36.4 26.4 61.5 8.10 10.3 6.9 7.3
June 33.8 26.6 74.5 9.19 7.4 5.5 249.3
July 31.0 25.4 83.5 8.58 4.0 3.9 417.7
August 30.6 25.0 84.0 7.48 4.3 3.8 299.4
September 32.2 24.4 78.0 5.38 6.2 4.2 190.7
October 35.9 23.0 60.5 4.22 9.4 4.8 27.2
November 35.3 19.3 52.0 4.49 9.7 4.3 13.0
December 32.9 16.1 54.0 4.90 9.5 3.9 2.6
Total - - - - - 1209.4
Average 33.9 21.7 62.3 6.05 8.4 4.8 -
General climate of the district is sub-tropical and is characterised by three well-defined seasons, i.e.
summer - from April to June, monsoon - from July to September, and winter from October to March.
3.Rainfall
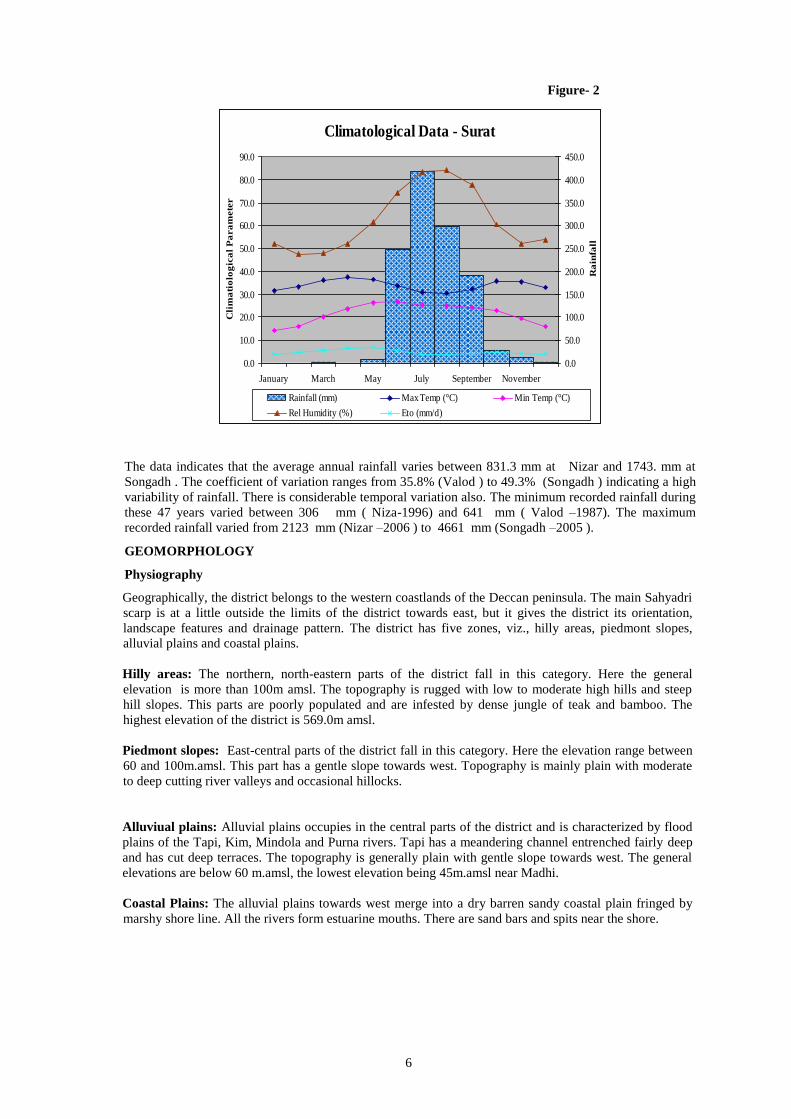
Long term normal rainfall (1951-80) at the Surat IMD station is about 1210 mm. The rainfall data from
various stations in the district is available for the period between 1963-2008.
6
Figure- 2
Climatological Data - Surat
0.0
10.0
20.0
30.0
40.0
50.0
60.0
70.0
80.0
90.0
January March May July September November
Cli
ma
tio
log
ica
l P
ara
mete
rs
0.0
50.0
100.0
150.0
200.0
250.0
300.0
350.0
400.0
450.0
Ra
infa
ll
Rainfall (mm) Max Temp (°C) Min Temp (°C)
Rel Humidity (%) Eto (mm/d)
The data indicates that the average annual rainfall varies between 831.3 mm at Nizar and 1743. mm at
Songadh . The coefficient of variation ranges from 35.8% (Valod ) to 49.3% (Songadh ) indicating a high
variability of rainfall. There is considerable temporal variation also. The minimum recorded rainfall during
these 47 years varied between 306 mm ( Niza-1996) and 641 mm ( Valod –1987). The maximum
recorded rainfall varied from 2123 mm (Nizar –2006 ) to 4661 mm (Songadh –2005 ).
GEOMORPHOLOGY
Physiography
Geographically, the district belongs to the western coastlands of the Deccan peninsula. The main Sahyadri
scarp is at a little outside the limits of the district towards east, but it gives the district its orientation,
landscape features and drainage pattern. The district has five zones, viz., hilly areas, piedmont slopes,
alluvial plains and coastal plains.
Hilly areas: The northern, north-eastern parts of the district fall in this category. Here the general
elevation is more than 100m amsl. The topography is rugged with low to moderate high hills and steep
hill slopes. This parts are poorly populated and are infested by dense jungle of teak and bamboo. The
highest elevation of the district is 569.0m amsl.
Piedmont slopes: East-central parts of the district fall in this category. Here the elevation range between
60 and 100m.amsl. This part has a gentle slope towards west. Topography is mainly plain with moderate
to deep cutting river valleys and occasional hillocks.
Alluviual plains: Alluvial plains occupies in the central parts of the district and is characterized by flood
plains of the Tapi, Kim, Mindola and Purna rivers. Tapi has a meandering channel entrenched fairly deep
and has cut deep terraces. The topography is generally plain with gentle slope towards west. The general
elevations are below 60 m.amsl, the lowest elevation being 45m.amsl near Madhi.
Coastal Plains: The alluvial plains towards west merge into a dry barren sandy coastal plain fringed by
marshy shore line. All the rivers form estuarine mouths. There are sand bars and spits near the shore.

7
Drainage
The Tapi is the major river which passes through the central parts of the district and flows towards the
west. The river is perennial in nature. It originates in Madhya Pradesh near Betul and has about 62225 sq.
Km. of catchment area. The average width of the river in the upstream of Kathor bridge is about 500m.
Downstream of the bridge the average width increases to 700m. Pickup weir was constructed on the Tapi
river in 1954 at Kakarapar about 56km west of Surat. Ukai dam, constructed in 1965, is situated about
25km upstream of Kakarapar weir. Other prominent rivers draining the district are Kim, Ver, Mindola,
Jhankhari and Purna. The Ver flows from north-east to south-west and flows parallel to Tapi and then it
flows towards west. All other rivers are situated toward south of Tapi and flow towards west, parallel to
Tapi.
GEOLOGY
Major geological formations exposed in the district are Quaternary alluvium, Tertiary limestone and
sandstones and deccan trap basalt. Figure -3 shows the geology of the district and the succession of
geological formations in the district, as given by Geological Survey of India in their brochure titled „‟
Know Your District-Surat‟‟ is as follows.The geology of the district is depicted in Figure -3
G e o l o g i c a l S u c c e s s i o n
Era Period Epoch /Series Description
Cenozoic Quaternary Holocene Soil, Younger alluvium Blown and
Fluvio-marine deposits.
Tertiary Pleistocene Older alluvium, conglomerate
Miocene Ferruginous sandstone (Gaj)
Eocene Numulitic limestone
Palaeocene Sub-Numulitic limestone, gypseous
shale,Supra- Trappean sediments
lateritised and having bauxite pockets.
Mesozoic Lower Tertiary to
Upper Cretaceous
Early Eocene To
Upper
Deccan Trap basalt with dykes
The Deccan Trap
The oldest rocks occurring to the north-east and south- east of the district are Deccan traps of lower
Eocene age. These are present in the form of horizontal sheets at places showing gentle dips toward west.
The total thickness of different trap flows aggregates to nearly 200 meters. The traps can be differentiated
into two predominant rock types. One is dark gray to bluish black, hard, compact, massive, fine grained
basalt which is usually found on the higher reaches of the hills. The other variety is greenish to purplish,
soft, medium grained trap which is prone to spheroidal weathering. These flows are characterized by
vesicles and amygdaloidal filled with secondary minerals like quartz, amythst, agate and calcite. These
type of flows are generally found on hill slopes and in the valleys.
Network of dykes varying in thickess from few centimeters to more than ten meters in width are
commonly found intruding the different lava flows and form knife-edge ridges in the „steppe‟ topography.
These dykes are mostly basic in nature but a few of these are also acidic in composition. The usual rock
type of these dykes is dolerite or olivine dolerite.

8
Figure-3
Alluvium
The alluvium occurs in the form of channel fill deposits (124 Sq Km) and flood plain deposits (298 Sq.
Km) in north eastern part of the district.
HYDROGEOLOGY
Aquifer System
The hydrogeological frame work of the area is essentially governed by geological setting, distribution of
rainfall and facilities of circulation and movement of water through inter connected primary and secondary
porosity of the geological units forming the aquifers.The depth to water level in the district ranges between
2m to about 20m during May 2012. Nearly 35 % area of the district is covered by the water level of 2m to
5m bgl . Nearly 60 % of the area of the district has the water levels between 5m to 10m bgl. The remaining
area of the district (isolated patches ) i.e. 5% has the water level ranging between 10m to 20m bgl.
9
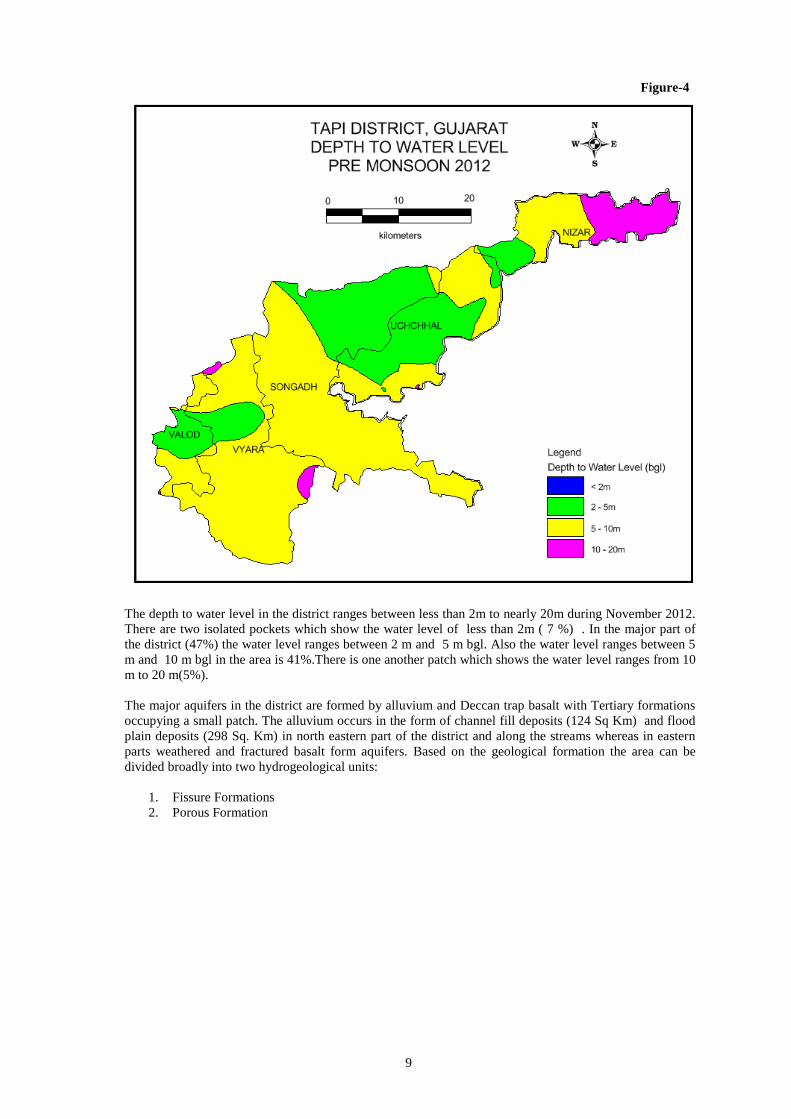
Figure-4
The depth to water level in the district ranges between less than 2m to nearly 20m during November 2012.
There are two isolated pockets which show the water level of less than 2m ( 7 %) . In the major part of
the district (47%) the water level ranges between 2 m and 5 m bgl. Also the water level ranges between 5
m and 10 m bgl in the area is 41%.There is one another patch which shows the water level ranges from 10
m to 20 m(5%).
The major aquifers in the district are formed by alluvium and Deccan trap basalt with Tertiary formations
occupying a small patch. The alluvium occurs in the form of channel fill deposits (124 Sq Km) and flood
plain deposits (298 Sq. Km) in north eastern part of the district and along the streams whereas in eastern
parts weathered and fractured basalt form aquifers. Based on the geological formation the area can be
divided broadly into two hydrogeological units:
1. Fissure Formations
2. Porous Formation

10
Figure- 5
Fissure Formations
Deccan Traps form the aquifers in north-eastern, eastern and south eastern parts of the district comprising
Mangrol, Mandvi, and Mahuva, talukas. The ground water occurs in unconfined to semi-confined
conditions. The occurrence and movement of ground water is governed by the thickness and extent of
weathered zone and the presence of fractures and joints. At places, dykes act as ground water barriers and
restrict the flow of ground water. On the other hand, at places, the dykes themselves form good aquifers
owing to deeper levels of weathering in them.
Depths of dug wells in Deccan traps ranges from less than 2m to 25m with maximum number of wells
about 80%, being 5 to 15m deep. The depths to water levels in the dug wells range from 1 to 20m.
However, in 90% of the wells, the water levels are less than 10m. bgl. Yields of the dug wells are low to
moderate in central parts whereas they are low to very low on the hill slopes. The dug wells generally
sustain pumping for 4 to 5 hours with yields of 50 to 150 m3/day. Recuperation of water levels is generally
slow.
Behaviour of Water Levels
The behaviour of water levels was studied based on the water level data collected from the National
Network of Hydrograph Stations (NNHS) established by CGWB and Observation wells established by
GWRDC in the district. A composite map combining the data of CGWB & GWRDC (depth to water level
map -May -2012) has been prepared .The water level data of May 2012 was used for preparing the depth
to water level maps. The seasonal fluctuation in water levels were calculated between May and November
2012. Historical data of water levels were used for preparing the hydrographs as well as for computing
long term trends.

11
Rise and Fall in Water Levels.
Rise and fall in water levels between May 2012 and November 2012 has been shown in Figure-6. The rise
of water level from 2m to 4m meters is seen in major parts of the district. Nearly 40% to 45 % of the area
in isolated patches shows a rise up to 4 meters. 50% to 55 % of the area in isolated patches shows rise of
2m to 4m in the district There are one isolated pockets in south of the district which shows decline of water
level up to 2m is observed . It covers nearly 5% of the district.
Figure- 6
7.Changes in Ground Water Scenario Over the Years
Long term water level data is available for 12 NNHS since 2001 and data was analysed for the period
between January 2001 to November 2012 and water level trend for various period (pre-monsoon, post-
monsoon period and over all trend ) is shown in table –IV

12
Table –IV Long Term Trend of Water level
( P e r i o d 1S t
J a n u a r y 2 0 0 1 t o 3 0t h
N o v e m b e r 2 0 1 2 )
S.No Location
Pre Monsoon Post Monsoon
Data
Points
Rise
(m/year)
Fall
(m/year)
Data
Points
Rise
(m/year)
Fall
(m/year)
1 Bedchit 16 .0418 10 .0360
2 Valod 19 .0563 20 .0150
3 Vyara1 20 .0003 18 .0446
4 Gandhinagar 19 .1459 20 .0099
5 Jesingpura[sg] 19 .1831 19 .0737
6 Bhurvel (ukai) 20 .1027 20 .0544
7 Vadade-Khurd 19 .0604 19 .0095
8 Tokarwa 12 .1736 14 .0376
9 Tawali 20 0.1705 20 .0139
10 Kherwa 16 .0729 17 .1414
12 Nizar1 20 0.0104 20 .2246
13 Nizar 18 .1796 19 .1509
Max 20 0.1705 .1831 20 .1414 .2246
Min 12 0.0104 .0003 10 .0099 .0095
Pre-monsoon water level trend shows that the hydrograph stations indicate a rise of water level ranging
from 0.0104 m/year to 0.1705 m/year where as a decline of water level ranging from 0.0003m/year to
0.1831 m/year. During post- monsoon period water level trend shows that the hydrograph stations indicate
a rise of water level ranging from 0.0099m/year to 0.1414 m/year where as a decline of water level
ranging from 0.0095m/year to 0.2246 m/year. The details are tabulated above.Pre-monsoon and post-
monsoon long term rising and declining trend of water level of various hydrograph stations established by
CGWB are also studied in graphic form. Majority of the hydrographs are showing rising trend during the
pre and post monsoon period. However , declining trend in few hydrographs is also observed.
GROUND WATER RESOURCES
The Ground Water Resources and Irrigation Potential of the district were calculated as on March 2012 in
collaboration with the Government of Gujarat using the methodology suggested by “Ground Water
Estimation Committee (GEC-97). These resources were computed after reorganisation of the districts. The
ground water resources for different Talukas of the district are given in the Table –V& VI.The annual
ground water recharge varies from 5265.0425 ha m. in Uchchhal Taluka to 11096.15 ha m. in Vyara
Taluka and total gross recharge for the district is 3547.427 ha m. The net available recharge, after leaving
natural discharge for non-monsoon period varies from 263.252 (Ucchchhal ) to 554.808 ha m. ( Vyara ),
the recharge for district is 1773.71 ha m.
13
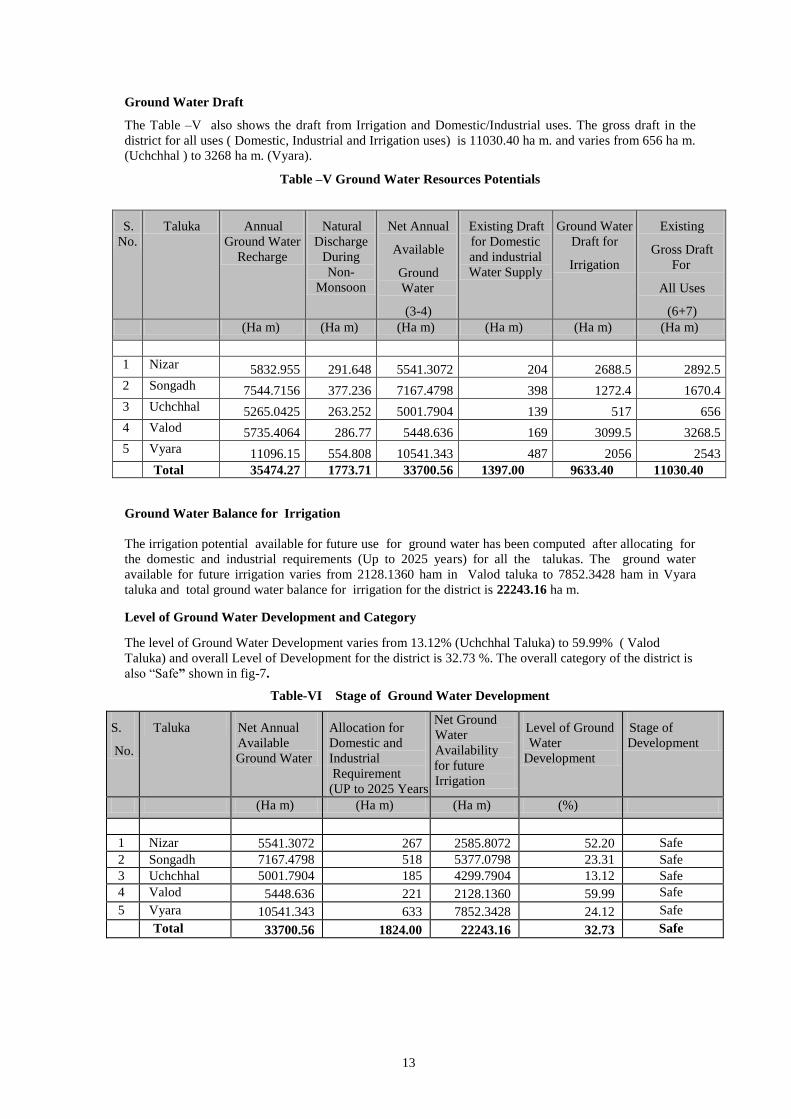
Ground Water Draft
The Table –V also shows the draft from Irrigation and Domestic/Industrial uses. The gross draft in the
district for all uses ( Domestic, Industrial and Irrigation uses) is 11030.40 ha m. and varies from 656 ha m.
(Uchchhal ) to 3268 ha m. (Vyara).
Table –V Ground Water Resources Potentials
S.
No.
Taluka Annual
Ground Water
Recharge
Natural
Discharge
During
Non-
Monsoon
Net Annual
Available
Ground
Water
(3-4)
Existing Draft
for Domestic
and industrial
Water Supply
Ground Water
Draft for
Irrigation
Existing
Gross Draft
For
All Uses
(6+7)
(Ha m) (Ha m) (Ha m) (Ha m) (Ha m) (Ha m)
1 Nizar 5832.955 291.648 5541.3072 204 2688.5 2892.5
2 Songadh 7544.7156 377.236 7167.4798 398 1272.4 1670.4
3 Uchchhal 5265.0425 263.252 5001.7904 139 517 656
4 Valod 5735.4064 286.77 5448.636 169 3099.5 3268.5
5 Vyara 11096.15 554.808 10541.343 487 2056 2543
Total 35474.27 1773.71 33700.56 1397.00 9633.40 11030.40
Ground Water Balance for Irrigation
The irrigation potential available for future use for ground water has been computed after allocating for
the domestic and industrial requirements (Up to 2025 years) for all the talukas. The ground water
available for future irrigation varies from 2128.1360 ham in Valod taluka to 7852.3428 ham in Vyara
taluka and total ground water balance for irrigation for the district is 22243.16 ha m.
Level of Ground Water Development and Category
The level of Ground Water Development varies from 13.12% (Uchchhal Taluka) to 59.99% ( Valod
Taluka) and overall Level of Development for the district is 32.73 %. The overall category of the district is
also “Safe” shown in fig-7.
Table-VI Stage of Ground Water Development
S.
No.
Taluka Net Annual
Available
Ground Water
Allocation for
Domestic and
Industrial
Requirement
(UP to 2025 Years)
Net Ground
Water
Availability
for future
Irrigation
Level of Ground
Water
Development
Stage of
Development
(Ha m) (Ha m) (Ha m) (%)
1 Nizar 5541.3072 267 2585.8072 52.20 Safe
2 Songadh 7167.4798 518 5377.0798 23.31 Safe
3 Uchchhal 5001.7904 185 4299.7904 13.12 Safe
4 Valod 5448.636 221 2128.1360 59.99 Safe
5 Vyara 10541.343 633 7852.3428 24.12 Safe
Total 33700.56 1824.00 22243.16 32.73 Safe

14
GROUND WATER DEVELOPMENT AND MANAGEMENT
Ground Water Development
Primary sources of irrigation in the district is through dug wells and canals. The yield of these well varies
from 50m3/day to 150m
3/day with the maximum sustainable pumping of 4 to 5 hours. No area is irrigated
by tanks and ponds. The annual ground water recharge varies from 5265.0425 ha m. in Uchchhal Taluka to
11096.15 ha m. in Vyara Taluka and total gross recharge for the district is 3547.427 ha m. The net
available recharge, after leaving natural discharge for non-monsoon period varies from 263.252
(Ucchchhal ) to 554.808 ha m. ( Vyara ), the recharge for district is 1773.71 ha m. The gross draft in the
district for all uses ( Domestic, Industrial and Irrigation uses) is 11030.40 ha m. and varies from 656 ha m.
(Uchchhal ) to 3268 ha m. (Vyara).The level of Ground Water Development varies from 13.12%
(Uchchhal Taluka) to 59.99% ( Valod Taluka) and overall Level of Development for the district is 32.73
%. The overall category of the district is also “Safe”
Figure- 7
15
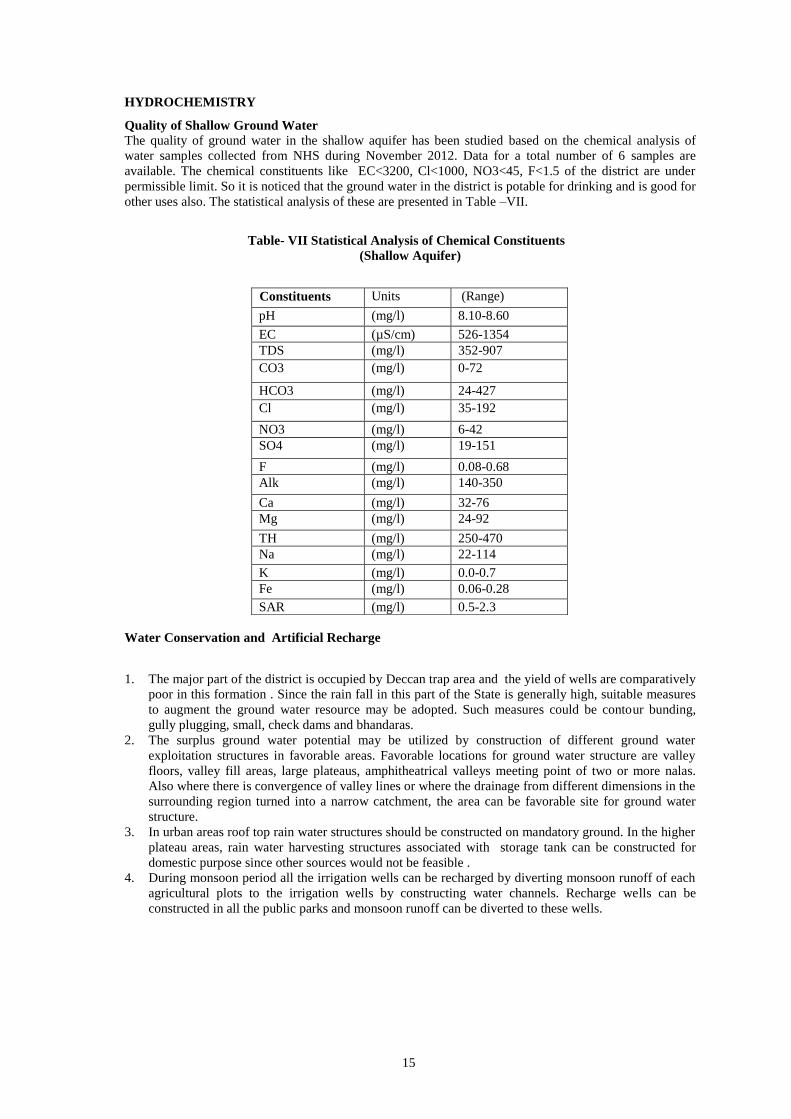
HYDROCHEMISTRY
Quality of Shallow Ground Water
The quality of ground water in the shallow aquifer has been studied based on the chemical analysis of
water samples collected from NHS during November 2012. Data for a total number of 6 samples are
available. The chemical constituents like EC<3200, Cl<1000, NO3<45, F<1.5 of the district are under
permissible limit. So it is noticed that the ground water in the district is potable for drinking and is good for
other uses also. The statistical analysis of these are presented in Table –VII.
Table- VII Statistical Analysis of Chemical Constituents
(Shallow Aquifer)
Water Conservation and Artificial Recharge
1. The major part of the district is occupied by Deccan trap area and the yield of wells are comparatively
poor in this formation . Since the rain fall in this part of the State is generally high, suitable measures
to augment the ground water resource may be adopted. Such measures could be contour bunding,
gully plugging, small, check dams and bhandaras.
2. The surplus ground water potential may be utilized by construction of different ground water
exploitation structures in favorable areas. Favorable locations for ground water structure are valley
floors, valley fill areas, large plateaus, amphitheatrical valleys meeting point of two or more nalas.
Also where there is convergence of valley lines or where the drainage from different dimensions in the
surrounding region turned into a narrow catchment, the area can be favorable site for ground water
structure.
3. In urban areas roof top rain water structures should be constructed on mandatory ground. In the higher
plateau areas, rain water harvesting structures associated with storage tank can be constructed for
domestic purpose since other sources would not be feasible .
4. During monsoon period all the irrigation wells can be recharged by diverting monsoon runoff of each
agricultural plots to the irrigation wells by constructing water channels. Recharge wells can be
constructed in all the public parks and monsoon runoff can be diverted to these wells.
Constituents Units (Range)
pH (mg/l) 8.10-8.60
EC (µS/cm) 526-1354
TDS (mg/l) 352-907
CO3 (mg/l) 0-72
HCO3 (mg/l) 24-427
Cl (mg/l) 35-192
NO3 (mg/l) 6-42
SO4 (mg/l) 19-151
F (mg/l) 0.08-0.68
Alk (mg/l) 140-350
Ca (mg/l) 32-76
Mg (mg/l) 24-92
TH (mg/l) 250-470
Na (mg/l) 22-114
K (mg/l) 0.0-0.7
Fe (mg/l) 0.06-0.28
SAR (mg/l) 0.5-2.3

16
Recommendations
1. In the eastern part of the district, in the Deccan trap area, the yield of wells are comparatively
poor. Since the rain fall in these part is generally high, suitable measures to augment the ground
water resource may be adopted. Such measures could be contour bunding, gully plugging, small,
check dams and bhandaras.
2. The surplus ground water potential may be utilized by construction of different ground water
exploitation structures in favorable areas. Favorable locations for ground water structure are
valley floors, valley fill area, large plateaus, amphitheatrical valleys meeting point of two or more
nalas. Also where there is convergence of valley lines or where the drainage from different
dimensions in the surrounding region tunned into a narrow catchment, the area can be favorable
site for ground water structure.
3. In urban areas roof top rain water structures should be constructed on mandatory ground. In the
higher plateau areas, rain water harvesting structures associated with storage tank can be
constructed for domestic purpose since other sources would not be feasible .
4. During monsoon period all the irrigation wells can be recharged by diverting monsoon runoff of
each agricultural plots to the irrigation wells by constructing water channels. Recharge wells can
be constructed in all the public parks and monsoon runoff can be diverted to these wells.
5. Ground water recharge through dug wells is also be feasible in the eastern part and may be
adopted at local level. This is a cost effective method to enhance the availability of ground water
and improve the ground water quality.