ground waters of the houston-galveston area chemical character and industrial utility
TRANSCRIPT

Ground Waters of the Houston-
H E area in which Houston and Galveston are located is one of notable industrial development. Houston is one of the largest cities in the South, with a population of
318,000 in 1933. It is a leading seaport and manufacturing and railroad center. Galveston, with a population of 54,400 in 1935, also ranks high as a seaport. There are about twelve producing oil fields and eleven oil refineries in the area. Farming is also important. The chief crops are rice, cotton, sugar cane, and garden truck.
Large quantities of water are required for public water supplies, oil refining, paper pulp manufacturing, ice manu- facturing, cooling and other industrial uses, and for the ir- rigation of rice. The industrial plants and a large part of the rice-growing districts are comparatively remote from adequate supplies of surface waters suitable for their varied requirements. With the development of industry and the increase in population, the importance of the quantity and the quality of the available ground water in the area has become, therefore, increasingly apparent. As the continually increasing demand for water has been met by greater and greater withdrawals of ground water, it has become a matter of public concern lest the supply be seriously overdrawn or the wells become contaminated with salt water.
I n response to public request, the United States Geological Survey, in cooperation with the Texas State Board of Water Engineers, started in December, 1930, a survey of the water resources of the area. The chief purpose of the investigation is to obtain data on which to estimate the practicable rate a t which water may be drawn from the underground reser- voir. The survey covers various phases of the ground-water problem, such as quantity and quality of water a t different depths a t different locations, its suitability for municipal and industrial use and for irrigation, and the possibility of contamination by salt water. Some results of the investigation were released in 1932 (1) and in 1933 (d) , and a progress report on the water resources of the mea, based on data ob-
T
MARGARET D. FOSTER United States Geological Survey,
Washington, D. C.
tained from observations during 5 to 6 years, was made in 1937 (3). The present paper is largely a dis- cussion of the findings of the in- vestigation as they relate to the
area.
Geologic Conditions
The area included in the study is shown in Figure 1. It comprises Waller, Harris, Galveston, and parts of Fort Bend and Brazoria Counties. The area, which is Dart of the Gulf
PAPER MILL AT HOUSTON USING 20,000,000 GALLOXS OF GROUND WATER A DAY Coastal Plain, is underlain by beds of permeable sand, sandstone, and gravel, interbedded with layers of
relatively impermeable clay, gumbo, shale, and marl. The structure of these beds and the order in which they occur is brought out graphically in Figure 2, which shows a generalized
The daily use of about 100,000,000 gallons of ground water for industrial purposes in the Houston-Galveston area is illustrative of the possibilities for development of sup- plies from the vast ground-water reser- voirs of the Coastal Plain. In few places have ground waters been utilized so fully for industrial supplies. The ground-water conditions found here, the general chemical character of the water, the change of character with depth, the artesian head, and the possibility, near the coast, of salt water contamination with overpumping, are typical of general conditions through- out the Coastal Plain. The large number of wells in the area affords an unusual opportunity to study these ground-water relations i’n detail.
geologic cross section from a point about 50 miles north of Houston, southward to Galveston. In general, the beds dip to the south or southeast, which is also the general direction of the land slope. However, as Figure 2 shows, the dip of the beds is nearly everywhere steeper than the surface slope, and the
1028
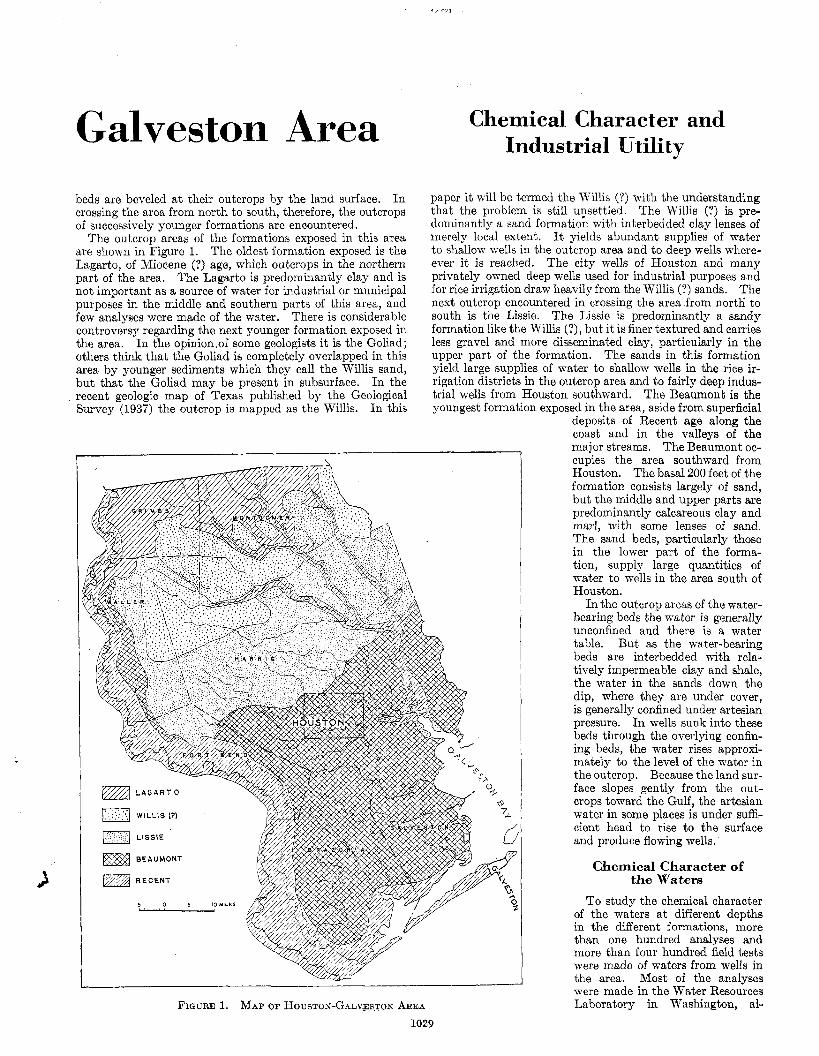
Galveston Area beds are beveled a t their outcrops by the land surface. In crossing the area from north to south, therefore, the outcrops of successively younger formations are encountered.
The outcrop areas of the formations exposed in this area are shown in Figure 1. The oldest formation exposed is the Lagarto, of Miocene (?) age, which outcrops in the northern part of the area. The Lagarto is predominantly clay and is not important as a source of water for industrial or municipal purposes in the middle and southern parts of this area, and few analyses were made of the water. There is considerable controversy regarding the next younger formation exposed in the area. In the opinion.of some geologists it is the Goliad; others think that the Goliad is completely overlapped in this area by younger sediments which they call the Willis sand, but that the Goliad may be present in subsurface. In the recent geologic map of Texas published by the Geological Survey (1937) the outcrop is mapped as the Willis. In this
Chemical Character and Industrial Utility
paper it will be termed the Willis (?) with the understanding that the problem is still uvsettled. The Willis (?) is pre- dominantly a sand formation with interbedded clay lenses of merely local extent. It yields abundant supplies of water to shallow wells in the outcrop area and to deep wells where- ever it is reached. The city wells of Houston and many privately owned deep wells used for industrial purposes and for rice irrigation draw heavily from the Willis (?) sands. The next outcrop encountered in crossing the area from nortli to south is the Lissie. The Lissie is predominantly a sandy formation like the Willis (?), but it is finer textured and carries less gravel and more disseminated clay, particularly in the upper part of the formation. The sands in this formation yield large supplies of water to shallow wells in the rice ir- rigation districts in the outcrop area and to fairly deep indus- trial wells from Houston southward. The Beaumont is the youngest formation exposed in the area, aside from superficial
FIGURE 1. MAP OF HOUSTON-GALVESTON AREA 1029
- deposits of Recent age along the coast and in the valleys of the major streams. The Beaumont oc- cupies the area southward from Houston. The basal 200 feet of the formation consists largely of sand, but the middle and upper parts are predominantly calcareous clay and marl, with some lenses of sand, The sand beds, particularly those in the lower part of the forma- tion, supply large quantities of water to wells in the area south of Houston.
In the outcrop areas of the water- bearing beds the water is generally unconfined and there is a water table. But as the water-bearing beds are interbedded with rela- tively impermeable clay and shale, the water in the sands down the dip, where they are under cover, is generally confined under artesian pressure. In wells sunk into these beds through the overlying confin- ing beds, the water rises approxi- mately to the level of the water in the outcrop. Because the land sur- face slopes gently from the out- crops toward the Gulf, the artesian water in some places is under suffi- cient head to rise to the surface and produce flowing wells.
Chemical Character of the Waters
To study the chemical character of the waters at different depths in the different formations, more than one hundred analyses and more than four hundred field tests were made of waters from wells in the area. Most of the analyses were made in the Water Resources Laboratory in Washington, al-

1030 INDUSTRIAL AND ENGINEERING CHEMISTRY VOL. 31, NO. 8
though a few analyses by commercial laboratories were also I (1 to 4). Below 100 feet, however, the waters in the upper accepted. The field tests which included total hardness, part of the Lissie tend to become more uniform in mineral sulfate, and chloride, were made by Samuel F. Turner in the content and more comparable to those in the lower part course of geologic work in the area. Turner also collected (compare Figure 4, J , K , and L, and Table I, 5 to 7). most of the samples for analysis and collaborated in the early The shallow waters in the Beaumont clay, like those in studies of the data upon which this paper is based. The the upper part of the Lissie, differ greatly in content and
character of dissolved mineral matter (Table I, I 8 to 10). On the whole, however, they are
more highly mineralized and harder than the shallow waters in the upper part of the Lissie. Those analyzed contained from 300 to more than 2000 p. p. m. of dissolved mineral matter and had from about 200 to 750 p. p. m. of hardness. Korth and west of South Houston most of the shallow waters in the Beaumont are low in chlo- ride, but south and east of South Houston many
See Level
14x'
2000 0
I 10 2oMI'Les
FIGURE 2. GENERALIZED GEOLOGIC SECTION FROM A POINT ABOUT 50 MILES are hiah in chloride: the amount of in
25 %-
BEAUMONT
25%.
25 %
WlLLlS (?)
2 5 9 4
NORTH OF HOUSTON SOUTHWARD TO GALVESTOK
- - d I Sandy phase Clayey phase -,
LESE--
.-
analyses indicate that the shallow waters (those from less than a 150-foot depth) of the area are characterized by their content of calcium bicarbonate. The quantity of calcium bicarbonate, or more inclusively, of t#otal hardness, differenti- ates the shallow waters of the different formations. This is brought out in Figure 3, in which the shallow waters of the different formations are plotted according to their content of total hardness. The Willis (?) sand, in its outcrop, yields soft waters of low mineral content. Analyses of typical shallow Willis (1) waters are shown in Figure 4, A and B. Of the fifteen shallow waters analyzed, only three contained more than 150 parts per million of dissolved mineral matter. These three waters were very high in nitrate content, one having more than 300 p. p. m. They had apparently been polluted by household or barnyard wastes and are not typical of the formation. Only four of the fifteen waters had more than 150 p. p. m. of total hardness. Thirty samples tested in the field likewise were low in hardness.
u l l o w waters in the outcrop of the lower or more sandv Dhase of the Lissie formation are lower in content of dissolved mineral matter than those in the outcrop of the upper or more clayey phase. The former generally contain less than 250 p, p. m. of dissolved mineral matter; the latter generally contain more than 275 p. p. m. The analyses of shallow waters from the lower part of the formation indicate a relation between depth and mineral content; there is an apparent increase in bicarbonate content and in hardness with depth to about 150 feet (Figure 4, F , G, H , and I ) . The shallow waters in the upper part of the formation differ considerably in total mineral content and show no relation between mineral content and depth. Analyses of typical waters in the upper part of the formation are given in Table
solution increases with greater proximity to the coast. Some of the'shallow waters contain so
much chloride that this is the predominant acid constituent. The principal soluble material in the sediments is calcium
carbonate, with some magnesium carbonate. The clastic constituents of the sands and clays consist of the weathered residues of older igneous and sedimentary rocks and as such have already been more or less altered by hydrolysis and
leached of their soluble materials. The solution of calcium and magnesium carbonate is, therefore, the primary action when meteoric waters containing in solution carbon dioxide derived from the air and soil pass down through such sedi- mentary deposits. The amount of these carbonates taken
TABLE I. ANALYSES OF GROUND WATERS FROM THE UPPER PART OF THE LISSIE FORMATION AND FROM THE BEAUMONT CLAY I N THE
Total Dissolved Total Hardness
HOUSTON-GALVESTON AREA (IN PARTS PER MILLION)
No. Depth, Feet Si02 Fe Ca, Mg Na + K HC0a 904 C1 NO3 Solids as CaCOa
Upper Part of Lissie Formation
1 28 . . . . .. ... 407 4 18 0 . 3 0 . . . 288
59 0 . 0 49 1 301 3 57 4 94 , . 0 . 9 2 75 9 . 6 30 271 13 39 0 . 3 0 300 227 5 174 . . 0 . 0 4 74 8 . 7 39 262 3 . 8 62 0 . 2 0 317 221 6 340 , . 0 . 1 4 62 14 41 270' 12 48 0 . 0 310 212 7 537 .. 0 . 5 6 32 10 58 234 13 30 0 . 0 258 121
2 41 . . 0:02 57 11 34 200 4 . 4 59 12 276 188 , . 0 . 0 5 73 29 83 462 19
Beaumont Clay
8 35 .. 0 . 0 8 83 29 98 648 14 50 6 . 2 546 9 87 .. 3 . 6 . . . . 476
10 117 . . 0 .89 49 18 274 664 2 . 2 171 4 . 5 846 11 185 0 . 5 9 22 16 223 542 1 . 2 114 0 . 2 5 644
13 843 . . 0 . 1 5 26 8 . 0 356 333 2 . 6 422 0 . 3 8 979
. . . 7 137 1 . 1
12 611 22 0 . 8 2 7 . 7 3 1 Na305 , K 3 . 8 578 1 . 6 162 0 . 1 2 811
326 318 196 121 32 98

AUGUST, 1939 INDUSTRIAL AND ENGINEERING CHEMISTRY 1031
OIL REFINERY NEdR HOUSTON USING 14,500,000 GALLONS OF GROUND WATER A DAY
into solution depends on the carbon dioxide content of the percolating waters as well as on the calcium and magnesium carbonate content of the sedimentary beds.
In deposits that are relatively calcareous, the capacity of the percolating waters to take calcium and magnesium car- bonate into solution by virtue of their content of carbon dioxide is exhausted a t shallow depths. In general, waters from such formations do not increase in mineral content with increasing depth in the formation. Wells 20 to 40 feet deep in these formations yield water containing as much dissolved mineral matter as those several hundred feet deep. This is true of waters in the Beaumont clay and in the upper clayey phase of the Lissie formation. In formations that contain little calcareous material, however, the waters must travel farther to exhaust their capacity to take calcium carbonate into solution. Water from shallow depths in such formations is usually low in dissolved mineral matter. As the waters percolate downward, they continue to dissolve calcium and magnesium carbonates until their carbon dioxide content is exhausted. With greater depth the mineral content then t e n d s to remain relatively constant. The watkrs from the lower part of the Liss ie f o r m a t i o n give an excellent example of t h i s phenomenon (Fig- ure 4, F , G, H, I , and J ) .
As the waters pass down the dip of the water-bearing beds they appear to un- dergo a gradual al- teration in chemical
3 character, changing from calcium bicar- bonate, which char- acterizes the shallow waters, tosodium bi- c a r b o n a t e , which char a c t er ia e s the deeper waters. In
waters in the Willis (?) formation this alteration in type is ac- companied by a continuous increase in total mineral content by the addition of sodium bicarbonate; the hardness, and the content of the other constituents remain practically the same (Figure 4, A , B , C, D, and E ) . But in waters in the Lissie and Beaumont formations there is a gradual decrease in calcium and magnesium accompanied by a gradual increase in sodium equivalent to the decrease in calcium and magnesium, the bicarbonate and total mineral content remaining the same. This phenomenon, which is exhibited particularly well by waters in the lower part of the Lissie formation is shown graphically in Figure 4, I , J , K , and L. The depth a t which softening begins differs in the different formations. In the Willis (?) sand (as has already been shown) the waters are never very hard. In the lower part of the Lissie the waters apparently begin to soften at about 600 feet, in the upper part of the Lissie, at about 500 feet; in the lower part of the Beaumont between 200 and 300 feet, and in the upper part of the Beaumont, a t about 150 feet.
The change of character of the waters appears to be the result of a secondary action between the
I I
FIGURE 4. COMPOSITION OF TYPICAL WATERS FROM DIFFERENT DEPTHS IN THE WILLIS (?) AND LISSIE FORMATIONS IN THE HOUSTOX-GALVESTON AREA
Kumbers above columns refer to depths of wells
waters and the rock m a t e r i a l s - e x - L , ~ change, of calcium i +
and magnesium in 'e
solut ion i n t h e l:, waters for sodium of base-exchange min- erals in the sedi- mentary beds. The depth at which sof- tening begins de- pends upon the rela- tive proportion of calcium and magne- sium carbonates to base-exchange min- erals in the beds through which the water passes. If the base-exchange minerals are present in an amount at

1032 INDUSTRIAL AND ENGINEERING CHEMISTRY VOL. 31, NO. 8
FIGURE 5. SODIUM AND BICARBONATE CONTENT AND HARDNESS OF GROUND WATERS AT DIFFER-
ENT DEPTHS AT HOUSTON
least proportional to the carbonates, the two processes are probably almost simultaneous, the calcium being exchanged almost as soon as it is taken into solution. This seems to explain the increase in sodium bicarbonate content in the Willis (?) waters more reasonably than to assume that sodium bicarbonate is taken into solution as such. If the carbonates are present in the rock materials in amounts more than equiva- lent to the exchange minerals, or if the exchange capacity of the base-exchange minerals has been exhausted in the shallower materials, the ground waters must travel farther before being softened, as in the Lissie formation.
Water Supplies in Houston
Houston is situated a t the landward edge of the Beaumont outcrop. The total hardness, bicarbonate and sodium con- tent of water that would be encountered a t different depths by a well drilled in the Houston district are shown in Figure 5. The first water the well would encounter would be in shallow water-bearing sands in the Beaumont and in the upper part of the Lissie. The waters in these sands differ in mineraliza- tion and in total hardness, but they are, in general, high in dissolved mineral matter and hard. The sodium content is generally fairly low. As the well is drilled deeper into the Lissie formation, the waters encountered are progressively softer with depth in the formation; a t the same time they contain increasing amounts of sodium. The bicarbonate tends to remain fairly uniform. These waters are lower in
total dissolved mineral matter than most of the shallow waters. Still deeper the well enters the Willis (?) sand and encounters waters which are very soft, but are high in sodium and bicarbonate and in total mineral content.
The municipal water supply of Houston is furnished by nineteen wells (in service in November, 1937) 900 to 2040 feet deep, located at seven pumping plants in different parts of the city. The system is only partially interconnected. The wells are not all in service a t one time, and the quality of water delivered to the taps by a pumping plant is depend- ent on the wells in service. All of the wells are screened opposite several water-bearing horizons in order to increase the yield. Consequently the water delivered by a given well is a composite of waters from the several horizons screened. The quality of the water is dependent upon which horizons are cased off and which are screened. For example, one well, 1664 feet deep and screened only below 1080 feet, draws water from the deep Willis (?) strata and yields water with only 4.5 p. p. m. of total hardness. Another well, 1037 feet deep and screened from 513 feet downward, draws from lower Lissie and Willis (1) beds and yields water with 116 p. p. m. of hardness. A third well, 558 feet deep and screened below 114 feet, draws from shallower Lissie strata. The water from this well has a hardness of 215 p. p. m.
The city water is used principally for domestic use and for office buildings. Industrial requirements for water are supplied largely by privately owned wells. It is estimated that altogether there are about two hundred and thirty wells in use in the Houston district. The heaviest consumers are a paper pulp mill, oil refineries, ice plants, railroads, and laundries, but large quantities of water are also used for cooling in connection with the air conditioning of office build- ings and theaters. The availability of different kinds of waters a t different depths enables industrial users to make some selection of the waters best suited to their needs. For some uses all the types of waters are equally suitable, but for others, certain types are distinctly superior. The laun- dries regularly utilize waters from wells in which all but the 1300-1400 foot horizons are cased off, so that only the very soft Willis (?) waters enter the wells. More than half of the water pumped in Houston comes from the deeper beds in the Lissie formation and from beds in the Willis (?) sand that lie below 900 feet.
Salt Water Contamination
Southeastward from Houston to the coast the contamina- tion of the ground waters by sea water from the Gulf becomes a factor of increasing importance in the determination of the chemical character of the waters and their suitability for municipal and industrial use. The chloride content of waters from different depths a t selected locations between Houston and Galveston is shown in Figure 6, in which the chloride content of the waters is plotted against depth and location on a generalized geologic section from Houston to Galveston. The values shown for the chloride content of the shallow waters are averages of all the waters tested from a depth of less than 150 feet a t each location. Some of the values given for the deeper waters are averages, others are single values, depending on the amount of data available for a given depth a t a given location.
The shallow waters at each location differ greatly in chloride content, For example, a t Texas City-Lamarque the chloride in the shallow waters ranged from 65 to 265 p. p. m., a t Webster-League City from 45 to 645, and a t Houston from 36 to 180. IT the c h ~ ~ ~ ~ i ~ ~ ~ o ~ - d i f f u s i o _ n of sea water t h r o u g m e r m e a b l e shallow m a t e r j - ~ a n ~ r ~ r n -ton Bay or f r ~ W e ~ ~ & ~ ~ ~ ~ n n ~ l , the waters a€ any particular locat%-Kwould be expected to show more -- -\- - ---_-I/-----

AUGUST, 1939 INDUSTRIAL AND ENGINEERING CHEMISTRY 1033
uniformity in chldidgcontent anbh&ain-chlo_ride m n l a n d , Some of the shallow waters for which com- pIete analyses were available were high in nitrate as well as chloride. It UKoJeble, therefore, that in scme 01 these- shallow- w z r s high & i a n T e S s to pollutioe; in others it may be derived from some other local source of cop&@nation. Because of the comparatively small number of shallow waters tested at any particular locality, except a t Houston, and because of the liability-cL.&aJlow wells ha. - local pollution, the averages g i v e n c t h e shallow waters may n t t b e representative of the chloride content at any point. In this connection it may be pointed out that the values given for the chloride content of waters at a depth-of 200 to 250 feet a t ea%- uint is lesj-than that given for the shallow w- - d a t e r s at this depth represent a mixture of tlie waters entering the outcrop and are less liable to reflect merely local contamination.
At Houston, where data on the chloride content of the waters are available to a depth of 1750 feet, the chloride decreases from 60 p. p. m. in the upper Lissie to 35 p. p. m. in the middle Lissie, and then gradually increases to 50 in the basal Lissie, and from 45 to 110 p. p. m. in the Willis (?).
In the horizon which is 200-250 feet below the surface a t Houston the water incream-n chloridETC€Fn€ AfiYEi -60 p,-pxn?at Houston to 90 at Webster-League City, 758 a t Texas City-Lamarque, and 3380 a t Galveston. There is definite salt water contamZation in this hohzon4 tJiiEG&,s atvEZ&CZ-azIri I exas City-Lamargue and perhaps a l m x e - & ~ I - t a E t ~ t Y o 5 - a t Webster.,T%e 200-250 foot hm%3in-iXW6T%€Z~Lc~gue- City yYeTds w_ater containing 170 p. p. m. of chloride at__that point~Laf&i&veston, a n d 3 2 & i r t ? ~ f X t ~ ~ L a m ~ u e . This horizon is apparently not contaminze-a water on the mainland but is somewhat. co%aiiiiEata a t Galveston. In an intermediate -e ddori$e--c~Zii-WViiTGater increases from 94 p. p. m. a t Webster-League City to 305 a t Texas City-Lamarque and 830 af-Galveston. Ti&KYiZFizons all belong to the Beau- mont or upper cissie formations. Unfortunately no data are available on the lower Lissie or the Willis (?) formations coastward from Houston. The lack of data is due largely to the custom of stopping drilling and pulling back a well if salt water is encountered while drilling and of abandoning
or plugging a well that goes salty on pumping. This very lack of data is therefore a fairly good indication that these horizons yield salty water southeast of Houston. An analysis published in 1914 showed that a sample of water from a 1020-foot well a t League City contained 870 p. p. m. of chloride.
LV" 186
. -"M F . Ob- [ 400
162
\ 305 a30t I - .
I800 "0 , ; 1800 52 i e 44 40 36 32 28 24 do 16 IZ a 4
MILES INLAND FROM GALVESTON
FIGURE 6. GENERALIZED SECTION FROM GALVESTON TO Hous- TON SHOWING THE CHLORIDE CONTENT OF THE GROUND WATERS
At Galveston all the water below a shallow surface layer 5 to 15 feet deep is salty. The water supply for the city is furnished by seven wells, 828 to 888 feet deep, at Alta Loma on the mainland. An analysis of a tap samp1e;f the wacr is shown in Table I, 13. The water is soft but contains about
--_I -_I
420 p. p. m . w i d g k -- - ----I-- - - __. -__-
Artesian Head The probability of salt water contamination of waters in
a given formation near the coast depends on the relation between the fresh water head in a formation and the salt water head at its possible submarine outcrop. If the head of
OIL REFINERY ON SHIP CANAL AT HOUSTON USINQ 5,000,000 GALLONS OF GROUND WATER A DAY
fresh water in the formatibn is sufficient to balance the head of heavier salt water, which tends to force salt water into the formation up the dip from its submarine outcrop, salt water will not enter the formation. If, how- ever, the fresh water head is not sufficient, sea water will enter the formation to the point where it is balanced by the fresh water head. If this point lies somewhere inland from the coast line, salty waters will be encountered by wells drilled into the formation between this point and the coast. Whether salt water will be encountered in a given formation, therefore, depends on the head of fresh water as determined by the altitude of the outcrop that forms the intake area; on the amount of water entering the intake area to replenish the reservoir; on the permeability of the confining beds, which may permit upward percolation of water, with consequent loss of head; and on the amount of water with- drawn from the formation as opposed to the head of heavier sea water, which is deter- mined by the depth of the submarine out- crop. All these factors are rather definitely fixed for a given formation except the amount of water entering the outcrop, which
1034 INDUSTRIAL AND ENGINEERING CHEMISTRY VOL. 31, NO. 8
varies from year to year and the amount of water withdrawn, which is the only factor under the control of the users. If the amount of water withdrawn lowers the fresh water head sufficiently, salt water will move up the formation.
In the early days of Houston, flowing wells could be ob- tained almost anywhere within the present city limits, and the artesian head in some wells was sufficient to raise the water from 15 to 30 feet above the ground. Kow the ar- tesian head is about 80 feet below the surface in the downtown part of Houston. Between 1920 and 1931 the decline in artesian head averaged about 4 feet a year. Between 1931 and 1936 there was little decline in artesian head in the heavily pumped Houston-Pasadena district. In the area to the south and southeast of Houston, however, the artesian head declined markedly. In 1937 new wells were put down in Pasadena which are reported to have a combined capacity of 20,000,000 gallons a day, an increase of about 40 per cent over the average pumpage for 1931-36. From March, 1937, when these wells were put into operation, to March, 1938, there was a pronounced decline in water levelsh observation wells in the Houston-Pasadena district, particularly in those within 4 miles of the new wells. In two wells, 6/8 and 13/4
miles distant, respectively, the decline in water level was 35 feet in the 12-month period. * yu-ia-lie e a r distant down th-jg-ihe-deeper beds, from which
_I__..----- -------*
a large part of the water in the Houston district is drawn. There is, therefore, a distinct possibility that any large de- cline in artesian head may result in the encroachment of salty water into the wells of the district. Fortunately such an encroachment is likely to be slow, and can be watched and to a degree anticipated if proper observations are made.
The progress report on the ground water resources of the Houston district (S), published in March, 1937, recommends
there sh@d be no increase in pumpingjL&-on IS net , ( b ) a d ~ X i K ~ i T t Z d water- &odd be
o m n e d a t a sufficient distance f i m h e - t o avoid undue inJt=&on--Qf ~ a ~ ~ t h ~ ~ s - ; ‘ ~ ~ I e n i B h i n g the ground water reservoir in the heavily pump$ Hguton-Pasadena area, and (c) p r o d i a and w B f i l 5 i e x water should be eIiEiEated,
” ” - .. .- -I_ --_ - Literature Cited
(1) White, W. N., Livingston, Penn, and Turner, S. F., U. S. Dept.
(2) White, W. N., and Livingston, Penn, Ibid., 79,241 (1933). (3) White, W. N., Turner, 9 F , and Livingston, Penn, U. S. Geol.
Interior, Press Mem. 66,553 (1932).
Survey, mimeographed rept., March 1, 1937
PRESBNTED before the Divlsion of Water, Sewage, and Sanitation at the 95th Meeting of the American Chemical Soaiety, Dallas, Texas. Published by permission of the Director, Geological Survey, United States Department of the Interior.
Mass Transfer between Phases ROLE OF EDDY
DIFFUSION T. K. SHERWOOD AND B. B. WOERTZ
Massachusetts Institute of Technology, Cambridge, Mass.
KTERPHASE transfer of material is a process of con- siderable engineering importance, as illustrated by the unit operations of drying, gas absorption, and humidifica-
tion. In some cases of mass transfer between a solid or liquid and a fluid moving in turbulent motion, much of the resist- ance to diffusion is encountered in a region very near the boundary between phases. According to the simple film concept the entire resistance to interphase transfer of material is represented by a stagnant fluid film a t the interface through which the diffusing substance must pass by the slow process of molecular diffusion.
It is generally recognized that the concept of a single stag- nant film constituting the entire resistance is an oversimpli- fication of the situation, and that much of the resistance may be in the eddy zone or “core” of the turbulent stream. Any analytical treatment of the whole process may be subject to serious error if it does not allow for the resistance to eddy diffusion, which is a process fundamentally different in char- acter from molecular diffusion. A previous paper (IO) re- ported a study of eddy diffusion of carbon dioxide and hydro- gen in a turbulent air stream. The results show that the rate of eddy diffusion is proportional to the concentration gradient, and that the proportionality constant, or “eddy diffusivity,” is independent of the nature of the diffusing gas. The study was made in the central third of a large round duct and shed no light on the nature of eddy diffusion in the vicinity of the wall. The present study is concerned with the
I over-all process of transfer between a liquid surface and a turbulent air stream.
Turbulence and Eddy Diffusion Largely because of its application in aeronautics, the
science of fluid mechanics has been developed materially in recent years. The nature of turbulence has received special attention, and many of the concepts and theories (3) proposed bear directly or indirectly on the question of mass transfer in a turbulent fluid. It is impossible to summarize this work briefly, and the reader is referred to the general papers of vcn Karman (6), Rouse (8), Izakson (4) , and Bakhmeteff (1). A recent paper by Dryden (2) gives an excellent summary, with particular reference to diffusion.
Turbulent motion is characterized by the random motion of the particles constituting the fluid stream. Individual particles move irregularly in all directions with respect to mean flow, and it is convenient to think of a fluid in turbulent flow as having a mean velocity, U , in a direction, x, with a superimposed random motion resulting in instantaneous deviations from U a t any point. This instantaneous deviat- ing velocity a t any point has components u, u, and w in the x, ?J, and z directions. Techniques have been developed for measuring u’, which is the root mean square average u(u’ = dm), and the “per cent turbulence” is u’expressed as a percentage of mean velocity U a t the point.