ground water information solapur …cgwb.gov.in/district_profile/maharashtra/solapur.pdfground water...
TRANSCRIPT
1805/DBR/2013
भारत सरकार
जल संसाधन मंत्रालय
कें द्रीय भुममजल बोर्ड GOVERNMENT OF INDIA
MINISTRY OF WATER RESOURCES
CENTRAL GROUND WATER BOARD
महाराष्ट्र राज्य के अंतर्डत सोलापुर जजले की भूजल विज्ञान जानकारी
GROUND WATER INFORMATION SOLAPUR DISTRICT
MAHARASHTRA
By द्वारा Dr. AGS REDDY र्ा. ए.जी. एस. रेड्र्ी Scientist-D िजै्ञाननक - घ
मध्य क्षेत्र, नार्पुर
CENTRAL REGION, NAGPUR 2013
SOLAPUR DISTRICT AT A GLANCE
1. GENERAL INFORMATION Geographical Area : 14895 sq. km. Administrative Divisions
: Taluka-11; N. Solapur, S.
Solapur, Barshi, Akkalkot, Pandharpur, Malshiras, Sangola, Mangal Wedha, Madha, Moho, Karmala.
Villages : 1158 Population (2001 Census) : 43,15,527 Normal Annual Rainfall 524 mm to 707 mm 2. GEOMORPHOLOGY Major Physiographic unit : Four; Valleys, Denudational
Hills (Sahaydri), Highly Dissected Basaltic Plateau, Moderately Dissected Basaltic Plateau, and Moderately Dissected Basaltic Plateau
Major Drainage : Tributaries of Bhima River 3. LAND USE (2010-11) Forest Area : 342 sq. km. Non Cutivation Area : 788.97 sq. km. Cultivation Area : 11315.22 sq. km. GW Irrigated Area : 1788.09 sq km 4. SOIL TYPE Very Shallow, Shallow, Medium and Deep Soils 5. IRRIGATION BY DIFFERENT SOURCES (2006-07 MI CENSUS) -
Nos./Potential Created /Potential Utilised(ha) Dugwells : 132842/327709 Borewells : 28786/65308 Total GW Potential Created 393017 Surface Flow Schemes : 174/265 Surface Lift Schemes : 37874/98404 Net Potential Created : 494686 ha 6. GROUND WATER MONITORING WELLS (As on Nov 2012) Dugwells : 53 Piezometers : 6 7. GEOLOGY Quarterny to Recent : Alluvium Upper Cretaceous-Lower Eocene: Basalt (Deccan Trap) 8. HYDROGEOLOGY Water Bearing Formation : Deccan Trap: Weathered,
vesicular, fractured and jointed basalt form aquifer. The depth of weathered mantle ranges from 1 to 6m and potential fractures normally are limited to 20 to 50m depth range Alluvium: Fluvial alluvial sediment with calcareous
2
materials occurs in the western part of the district along the coast. The fluvial alluvium occurs along the river drainage. The thickness of alluvium varies from 2m to 12m.
Premonsoon Depth to Water Level (May-2011)
: GL to 12.80 m bgl
Postmonsoon Depth to Water Level (Nov.-2011)
: 1.00 to 19.60 m bgl
Premonsoon Water Level Trend (2001-10)
: Rise: 0.0041 to 4.050 m/year Fall: 0.0037 to 0.78 m/year
Postmonsoon water level trend (2001-10)
: Rise: 0.0157 to 3.53 m/year Fall: 0.0013 to 1.499 m/year
9. GROUND WATER EXPLORATION (As on 31/03/12) Wells Drilled : EW-69, OW-5, Pz- 17 Depth Range : 115 to 200.00 m bgl (To be
checked) Discharge : Traces- 14.88 lps Transmissivity : 0.08 to 130.37.36 m2/day 10. GROUND WATER QUALITY The groundwater present in Solapur district is mainly affected by Nitrate
concentration above MPL. High concentration of TH values are also recorded in some areas.
Type of Water : Ca-Cl and Ca-HCO3 11. DYNAMIC GROUND WATER RESOURCES- (As on 31/03/2009) Net Annual GW availability : 1507.84 MCM Total Draft (Irrigation + Domestic) : 49.36 MCM Projected Demand (Domestic +
Industrial) : 89.30 MCM
Stage of Ground Water Development
: 78.23%
Categorisatiom Malshiras Taluk - OE Other Talukas - SAFE
13. AWARENESS AND TRAINING ACTIVITY Mass Awareness Programme : One a. Date : 29/03/05 b. Place : Pandharpur c. Participants : 300 Water Management Training
Programme : NIL
14. ARTIFICIAL RECHARGE & RAINWATER HARVESTING Projects Completed : Nil Projects under Technical
Guidance: : NIL
15. GROUND WATER CONTROL & REGULATION Over Exploited Taluka : Malshiras Critical Taluka : None
Notified Taluka : None

3
16. MAJOR GROUND WATER PROBLEMS AND ISSUES The Basaltic rocks due to poor storage and transmission capability get fully saturated during monsoon but a situation of rejected recharge results in post-monsoon and early summer months. These aquifers also drain naturally due to high water table gradient formed by sloping and undulating topography. The available groundwater resources can better augmented by adopting scientific and multi-sectoral approach for making the future plan. The aspect related to conjunctive use, ground water legislation, involvement of NGO’S, woman and community participation, mass awareness, adoption of advanced Irrigation system etc will play an important role in conserving and developing the precious water resources
4
Ground Water Information
Solapur District
Contents
1.0 Introduction .......................................................................... 1
2.0 Climate and Rainfall ............................................................ 3
3.0 Geomorphology and Soil Types ........................................ 4
4.0 Ground Water Scenario ....................................................... 6
4.1 Hydrogeology ........................................................................................ 6 4.2 Water Level Scenario ............................................................................ 7 4.3 Yield of Wells ....................................................................................... 10 4.4 Findings of Sina Man Project ............................................................. 10 4.5 Ground Water Resources ................................................................... 11 4.6 Ground Water Quality ......................................................................... 12
5.0 Status of Ground water Development .............................. 14
5.1 Rural Water Supply ............................................................................. 15
6.0 Water Conservation Practices .......................................... 15
7.0 Mass Awareness and Training Activities ......................... 16
7.1 MAP and WMTP ................................................................................... 16 7.2 Area Notified ........................................................................................ 16
8.0 Reccomendations .............................................................. 16
List of Figures 1. Administrative Divisions 2. Hydrogeology 3. Premonsoon Depth to Water Level (May 2011) 4. Postmonsoon Depth to Water Level (Nov. 2011)
List of Tables 1. Salient Features of Rainfall Analysis 2. Aquifer Characteristics 3. Taluka wise Ground Water Resources (2008-2009). 4. Classification of Ground Water Samples for Drinking based on BIS
Drinking Water Standards (IS-10500-91, Revised 2003), (May 2011). 5. Classification of Ground Water for Irrigation based on EC (May 2011).

5
GROUND WATER INFORMATION
SOLAPUR DISTRICT
1. Introduction
Solapur district is one of the four districts that form the region of Western Maharashtra.
It is the fourth largest district in Maharashtra in terms of land area and seventh largest in terms
of population. It is an important junction on the Central railway line. Solapur is a city with an
array of small and medium scale industries. The district is well known for its textile industries
and Solapur chadars and towels are famous around the globe. The district has the largest
industry in Maharashtra for Beedi production. Solapur is also known for its oilseed-market.
Solapur is situated on Deccan plateau. It has an average elevation of 458 metres. The district is
spread over an area of around 14,895 square kilometers. It is located on the south east edge of
the state and lies entirely in the Bhima and Seena basins. The entire district is drained by
the Bhima River. Revenue Sub-divisions are Solapur, Madha (Kurduwadi), Pandharpur. The
district is divided into 11 talukas viz Akkalkot, Barshi, Karmala, Madha, Malshiras,
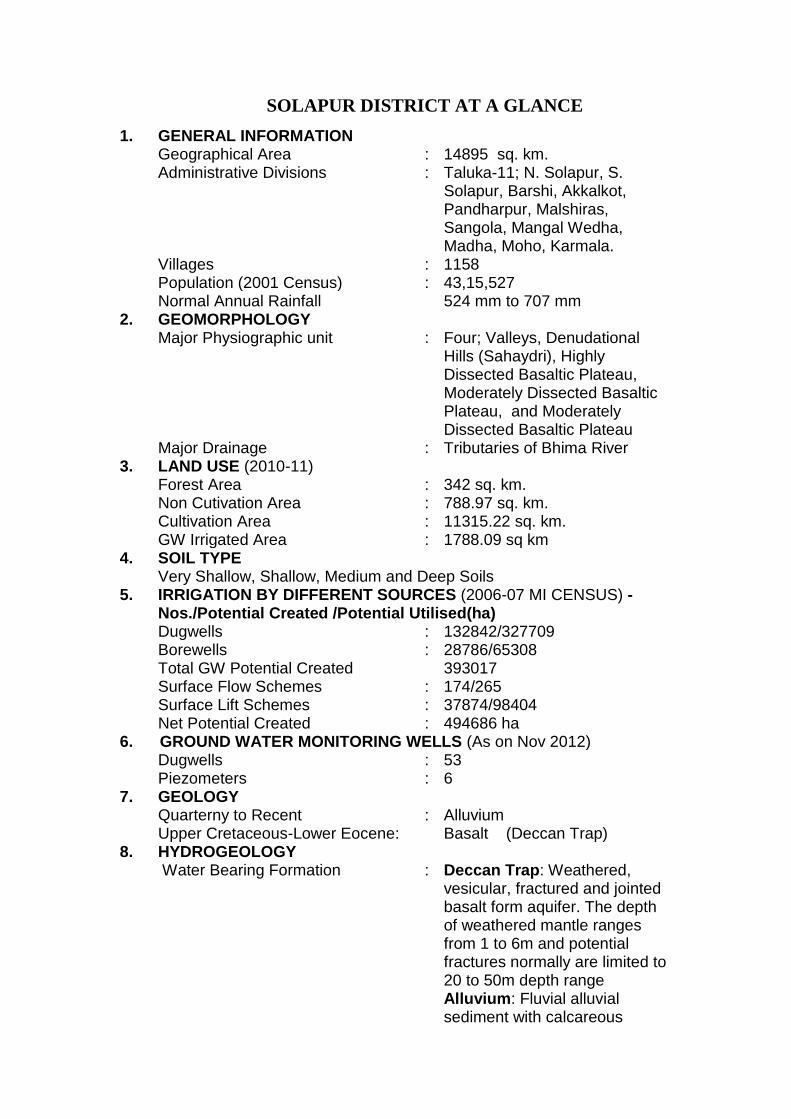
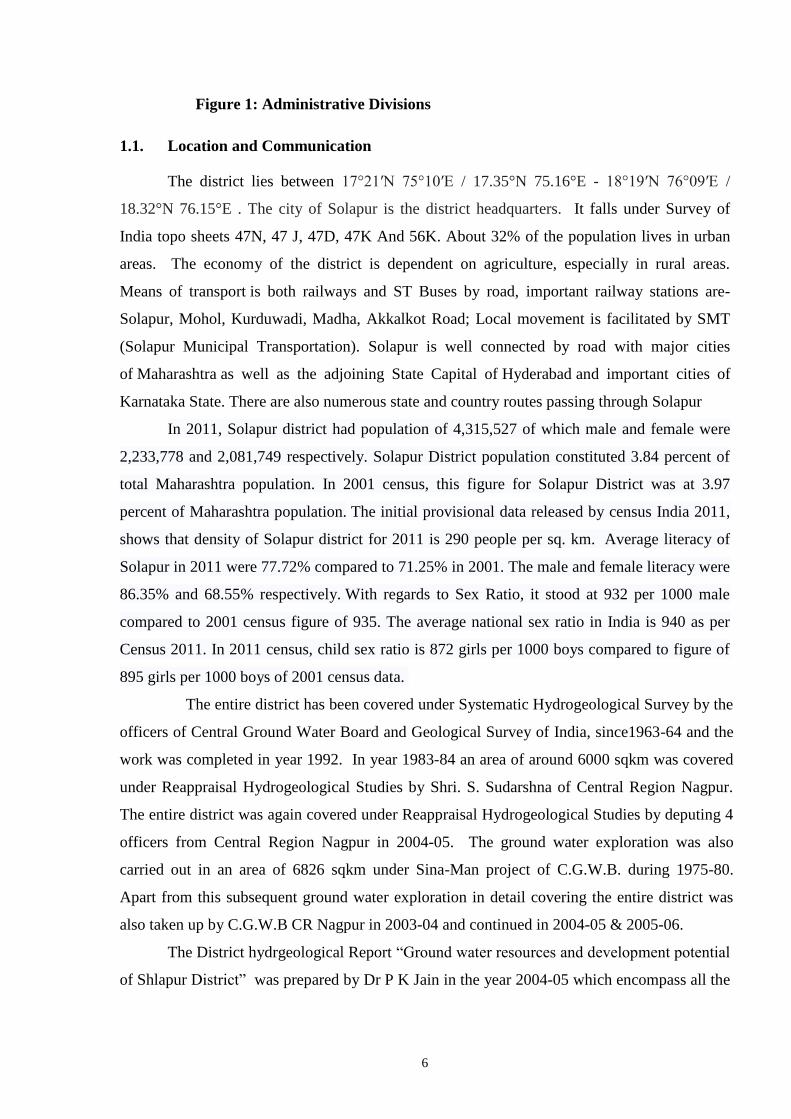
Mangalwedhe, Mohol, Pandharpur, Solapur North and Solapu South. A location map taluka
boundaries, taluka head quarters, ground water monitoring stations and physical features is
shown in fig 1.
6
Figure 1: Administrative Divisions
1.1. Location and Communication
The district lies between 17°21′N 75°10′E / 17.35°N 75.16°E - 18°19′N 76°09′E /
18.32°N 76.15°E . The city of Solapur is the district headquarters. It falls under Survey of
India topo sheets 47N, 47 J, 47D, 47K And 56K. About 32% of the population lives in urban
areas. The economy of the district is dependent on agriculture, especially in rural areas.
Means of transport is both railways and ST Buses by road, important railway stations are-
Solapur, Mohol, Kurduwadi, Madha, Akkalkot Road; Local movement is facilitated by SMT
(Solapur Municipal Transportation). Solapur is well connected by road with major cities
of Maharashtra as well as the adjoining State Capital of Hyderabad and important cities of
Karnataka State. There are also numerous state and country routes passing through Solapur
In 2011, Solapur district had population of 4,315,527 of which male and female were
2,233,778 and 2,081,749 respectively. Solapur District population constituted 3.84 percent of
total Maharashtra population. In 2001 census, this figure for Solapur District was at 3.97
percent of Maharashtra population. The initial provisional data released by census India 2011,
shows that density of Solapur district for 2011 is 290 people per sq. km. Average literacy of
Solapur in 2011 were 77.72% compared to 71.25% in 2001. The male and female literacy were
86.35% and 68.55% respectively. With regards to Sex Ratio, it stood at 932 per 1000 male
compared to 2001 census figure of 935. The average national sex ratio in India is 940 as per
Census 2011. In 2011 census, child sex ratio is 872 girls per 1000 boys compared to figure of
895 girls per 1000 boys of 2001 census data.
The entire district has been covered under Systematic Hydrogeological Survey by the
officers of Central Ground Water Board and Geological Survey of India, since1963-64 and the
work was completed in year 1992. In year 1983-84 an area of around 6000 sqkm was covered
under Reappraisal Hydrogeological Studies by Shri. S. Sudarshna of Central Region Nagpur.
The entire district was again covered under Reappraisal Hydrogeological Studies by deputing 4
officers from Central Region Nagpur in 2004-05. The ground water exploration was also
carried out in an area of 6826 sqkm under Sina-Man project of C.G.W.B. during 1975-80.
Apart from this subsequent ground water exploration in detail covering the entire district was
also taken up by C.G.W.B CR Nagpur in 2003-04 and continued in 2004-05 & 2005-06.
The District hydrgeological Report “Ground water resources and development potential
of Shlapur District” was prepared by Dr P K Jain in the year 2004-05 which encompass all the
7
data information regarding water resources, irrigation, agriculture along with guidelines for
better management of available water resources in the district.
The detailed ground water exploration was undertaken in the district between the period
of 2003 to 2005 to ascertain the presence/ absence of productive aquifer zones, quality of
ground water of different depth, yield of aquifer zones and to determine aquifer parameter.
During present exploratory drilling programme 69 exploratory wells were drilled in the district
up to targeted depth of 200 mbgl. In additions to this, 5 Observation wells and 17 piezometers
were also drilled. The depth of the wells ranges from 115 to 200 mbgl and discharge was
ranging between <0.14 lps (Vairag) and 14.88lps. Out of these 69 EW, 11 EW’s have the
yield of >3 lps. At 10 sites, the discharge was recorded between 1 and 3 lps and the discharge
of 21 exploratory wells was less than 1 lps, and one EW (Singadgaon) was found dry. The
discharge recorded in the observation wells ranges between 0.14 and 4.47 lps. The
transmissivity value is ranging between 0.08 and 130.37m2/day.
2.0 Climate and Rainfall
Solapur falls under the category of dry (arid and semiarid) climate according to
the Köppen climate classification. Climate of the district is characterized by high humidity
throughout the year, an oppressive summer followed by well distributed and heavy rainfall
during the southwest monsoon season. The cold season starts from December to February
followed by summer from March to May. The mean daily maximum temperature is 40°C
and mean daily minimum temperature is 13°C. The highest temperature ever recorded is
48°C in April 1988. The southwest monsoon season is from June to September while
October and November constitute the post monsoon season. Broadly speaking, the district
can be divided into three natural zones. The eastern zone, comprising Barshi, North
Sholapur, South Sholapur and Akkalkot talukas, has assured rainfall; the central or the
traditional zone, comprising Mohol, Mangalwedha, eastern part of Pandharpur and Madha
talukas has uncertain rainfall and the western zone which comprises the scarcity areas of
Karmala, Sangola and Malshiras talukas and the western parts of the Madha and
Pandharpur talukas has also uncertain rainfall.
Rainfall all over the district is uncertain and scanty with an annual average of 625
mm. Only in Barshi taluka which is nearer to Balaghat range it averages to 725 mm. The
district gets rain from south-west as well as from north-east monsoon. The main precipitation
during June to August is rather precarious. The normal rainfall for the monsoon

8
period, i.e.. June-September is 425.9 mm. which is 73.6 per cent of the total annual rainfall.
The farming practices are adjusted according to the normal character of the rainy season. It is
the minimum in the North – Western part of the district around Malsiras (524mm). It
increases towards southeast and attains a maximum around Akkalkot (707 mm). The co-
efficient of variation of the annual rainfall from the normal ranges from 30% at Barshi to
42% at Malsiras. This suggests a high fluctuation in annual rainfall over the district.
The percentage probability of receiving excess rainfall (that is 25% or more in excess
of the normal) varies from 19% to 23% . It is the minimum around Malsiras, Pandharpur
and Solapur (19%) and maximum around Akkalkot (23%). the probabilities of occurrence
of moderate drought ranges from 15% at Karmala to 22% at Madha and Akkalkot (Table
1). Severe drought conditions were experienced at all station for 1% to 11% of the years.
Acute drought condition was experienced for 1% of the years only at Pardharpur, Malsiras
and Madha. As every station of the district experienced moderate, severe and acute
drought condition for more than 20% of the years, the entire district can be classified as
“Drought Area”.
3.0 Geomorphology and Soil Type
The district is comprised of Bhima sub-basin and has undulating topogragraphy. The
elevation in the district is ranges from 400 to 600m amsl. The district is typically characterized
by the morphology of Deccan basaltic flows. The major Rivers flowing in the district are the
Bhima, The Sina, The Man, and The Bhargavati Rivers. The Sina and the Man River’s are the
tributaries of the Bhima and the Bhogawati River is tributary of Sina. Dendritic drainage has
been observed only in the vicinity of major Rivers where alluvial deposits or thick soil cover is
present. However all the streams and Rivers which flow in the district are effluent in nature.
The soil prevailing in Solapur district is mainly derived forms Deccan basalts. The
soil of the district is underlain by partially decomposed basaltic rock locally known as
“Murum” which overlies parent rock. Due to more of less complete absence of leaching, the
soils are base-saturated. The lime reserve in the soil is fairly high (3.5 to10%). The soils
exhibit varying degrees of erosion and truncated profile is a common occurrence. The soils can
be broadly classified in the four main categories on the basis of depth and structure.
Vary shallow with depth less than 7.5cm.
Shallow soils between 7.5-to22.5cm depths.

9
Medium deep soils between 22.5 and 90cm depths.
Deep soils with depth more than 90cm.

10
Table-1. Salient Features of Rainfall Analysis in Solapur District
S.N Station No. of
years
data
Normal
Annual
Rainfall
(mm)
Co-
efficient of
variation
(%)
Less
than
normal
RF
(Y/%)
Moderate
drought
(Y/%)
Severe
Drought
(Y/%)
Acute
Drought
(Y/%)
More than
normal RF
(Y/%)
Excess RF
(Y/%)
RF trend
(mm/Yr.)
1 Solapur 103 704.0 31 53/51 21/20 3/3 0/0 50/49 20/19 0.6
2 Pandhar
pur
101 619.9 34 52/51 21/21 3/3 1/1 49/49 19/19 0.4
3 Akkalkot 93 706.6 33 47/51 20/22 3/3 0/0 46/49 21/23 -0.5
4 Malsiras 99 524.4 42 52/53 19/19 7/7 1/1 47/47 19/19 0.9
5 Madha 90 592.3 32 47/52 20/22 1/1 1/1 43/48 18/20 0.3
6 Barshi 101 653.7 30 49/49 19/19 5/5 0/0 52/51 21/21 -0.5
7 Karmala 102 574.0 37 48/47 15/15 11/11 0/0 54/53 21/21 0.7
11
4.0 Ground Water Scenario
4.1 Hydrogeology
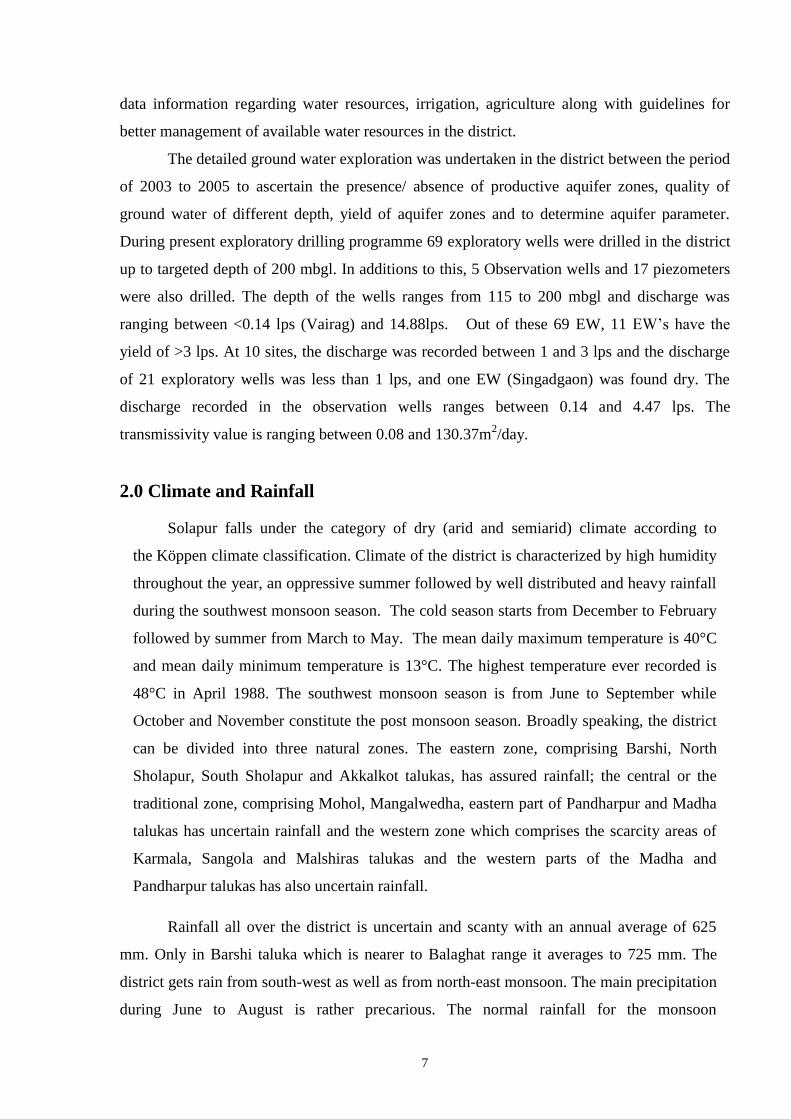
The entire Solapur district is occupied by lava flows of the Deccan Basalt formation,
which constitute the main rock formation of the district. The important water bearing
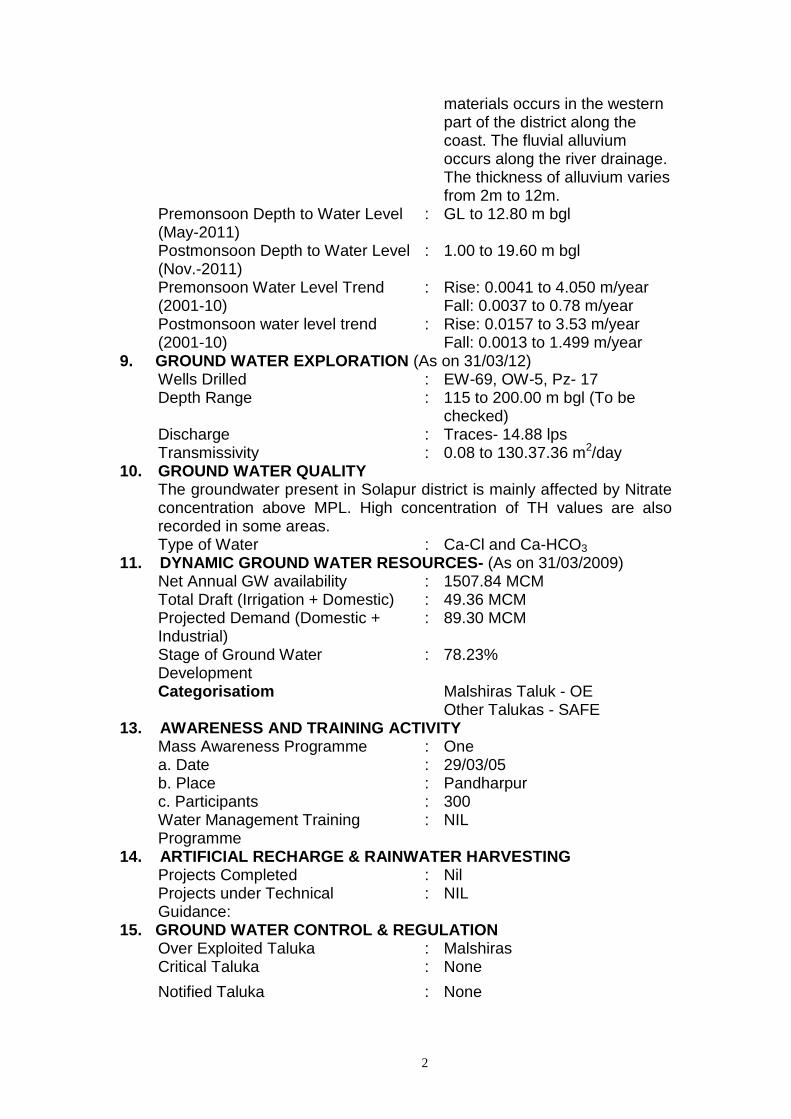
formations of the district are discussed below. A map depicting hydrogeological feature is
shown in figure 2.
4.1.1 Deccan Trap Basalt
Ground water in Deccan Traps mostly occurs in the weathered and fractured
parts down to 10-15m depth. At places potential zones are encountered at deeper levels in the
form of fractures and inter-flow zones which are generally confined down to 60-80m in the
district. The weathered portions of both vesicular and massive units have better porosity and
permeability. Intensity of weathering is less in hilly region of the district while it is higher in
plain area. The yield of dug wells tapping phreatic aquifer ranges between 18 to 152cum/day,
which have 5-12m depth range. The bore wells are generally drilled down to 40 to 60m tapping
weathered and fracture/vesicular zones, these wells have a discharge of 2 to 4lps. It is noticed
and reported that the yields of the wells drastically get reduced in summer months beginning
form March up June end.
4.1.2 Alluvium
Ground water in this formation occurs under water table condition in the district as it
is very shallow in depth and spreads over a very limited area. It is observed that the saturated
thickness of alluvial material comprises of silt, clay, sand and gravel. The detrital material
consisting of sand and gravel occurring as lenses in the alluvial piles sometimes form good
aquifer but on other hand these deposit do not constitute potential aquifer in the district as
compared to hard rock due to its limited area extent.
The yield of dug wells developed closer to river course ranges between 122 to
172cum/day, which have 8-16m depth range. The bore wells are generally drilled down to 20
tapping alluvium and part of weathered and fracture/vesicular zones, these wells have a
discharge of 4 to 6lps.

12
BHIMA R
NIRA R
BHIM
A R
SINA R
MAN R
BHIMA R
SINA R
BO
R R
22
50
5
2250 2250
10
10
1250
1250
2250
5
1250
1250
5
2250
1250
10
1250
1250
750
5
5
10
10
2250
10
5
1250
1250
10
1250
750
5
10
10
1250
2250
750
2250
5
750
750
1250
750
750
10
1250
10
1250
2250
1250
1250
SATA
RA D
ISTR
ICT
S A
N G
L I
PUNE DISTRICT
AHMADNAGAR DIS
TRICT
D I S T R I C T
O S M A N A B A D
K A R N A T A K A
S T
A
T
E
D I S
T R
I C T
MALSHIRAS
SANGOLA
KARMALA
MANGALWEDHA
MOHOL
PANDHARPUR
MADHA
BARSI
SOLAPUR
SOUTH SOLAPUR
AKKALKOT
FRESH WATER YEAR - 2003FRESH WATER YEAR - 2003
MINISTRY OF WATER RESOURCES
CENTRAL GROUND WATER BOARD
GROUND WATER USER MAPGROUND WATER USER MAP
DISTRICT SOLAPUR, MAHARASHTRADISTRICT SOLAPUR, MAHARASHTRA
14
Figure 2: Hydrogeology
4.2 Water Level Scenario
Central Ground Water Board monitors ground water level 53 National Hydrograph
Network monitoring Stations (NHNS) established in the district four times a year ie during
January, May (Pre-monsoon), August and November (Post-monsoon).
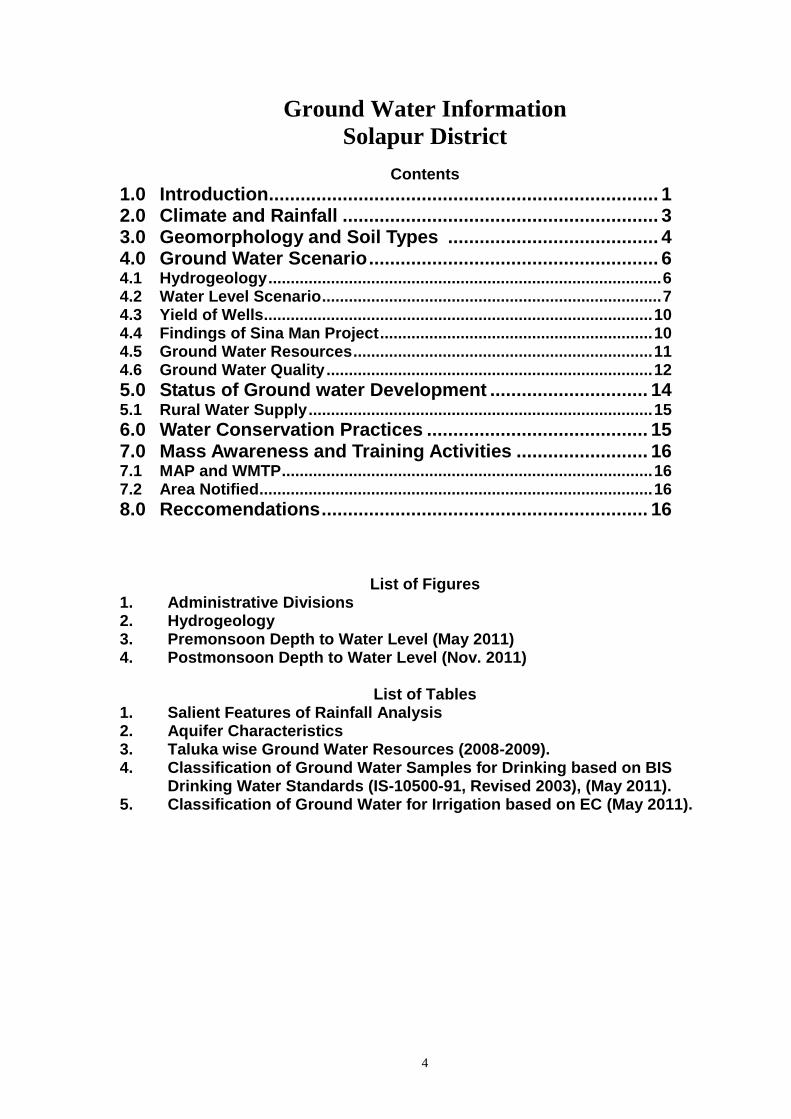
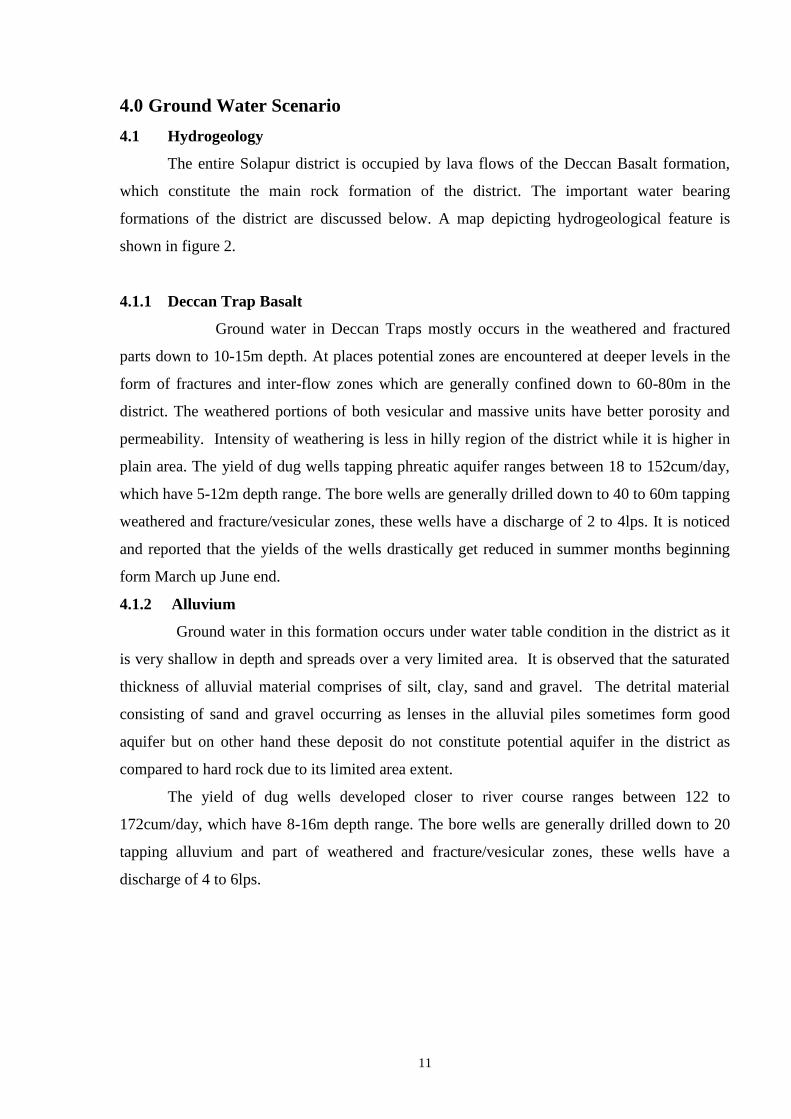
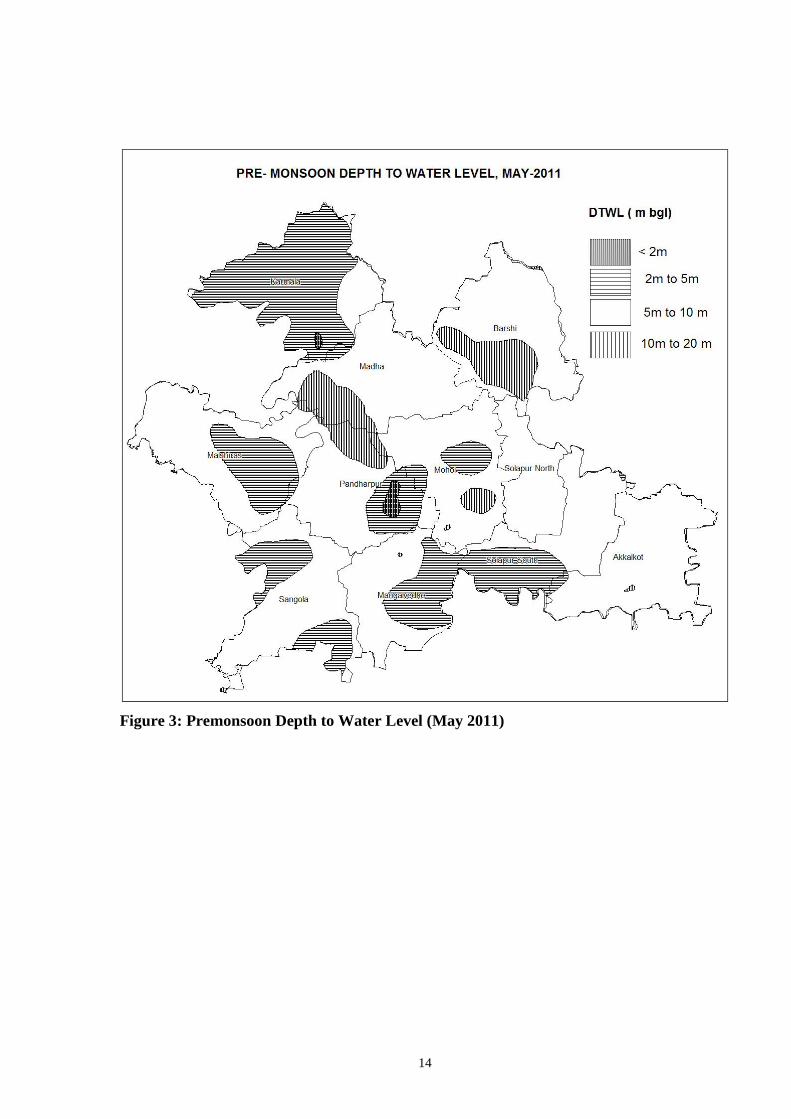
4.2.1 Pre monsoon Depth to Water Level (May-2011)
The pre-monsoon depth to water level ranges from ground level to 12.80. It is observed
that most of the stations were dry during pre-monsoon season indicating roughly the water
level has gone below 9 mbgl as majority of the wells are having a depth range between 8 and
16 mbgl except at few observation wells where it is more than 16 mbgl. Depth to water level
range of 5-10 mbgl are observed in major part of the district. Water level in the range of 2-5
mbgl are observed in northern part of the district and also in isolated pached spread over the
district. Water Level >10 mbgl is observed in very small ara in two isolated patches as shown
in figure 3.
x
x
x
x
x
x
x
x
x
x
x
x
x
x
x
x
x
x
x x
x x
Hilly Area x
x
x
x
x
x
x
x
x
x
x x
x x
x
x
x
x
x
x
x
x
x
x
x x
x x
Hard
Rock
13
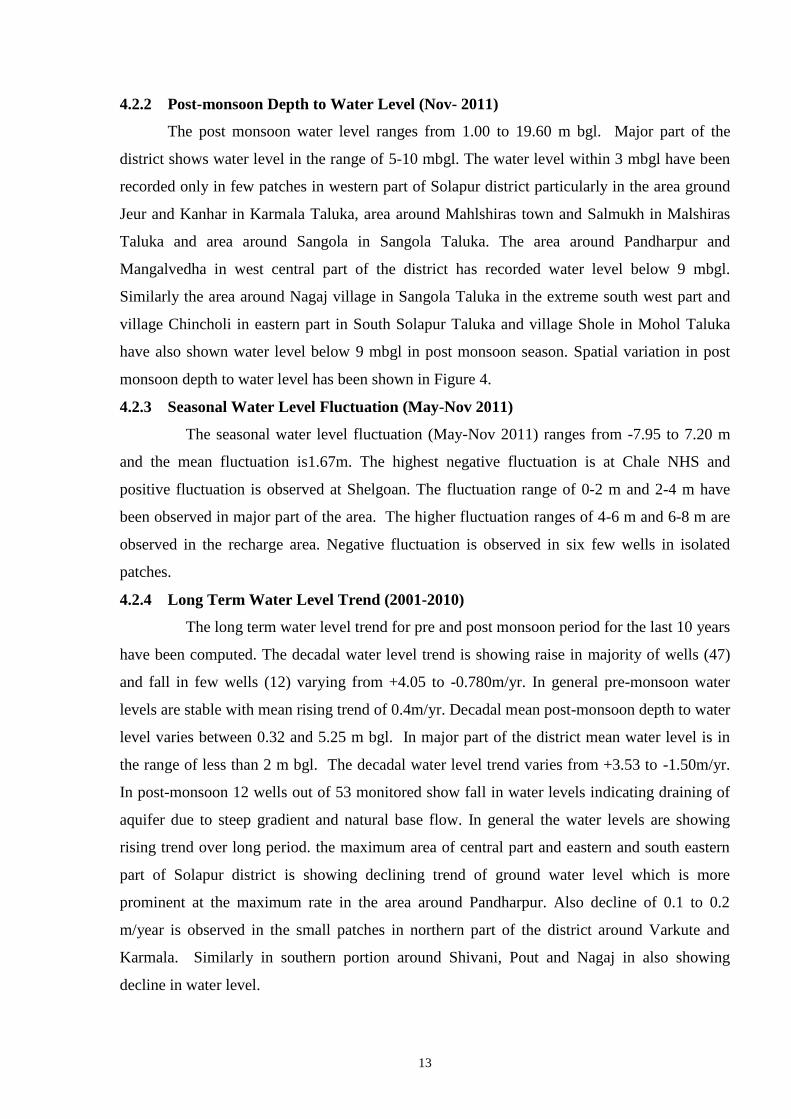
4.2.2 Post-monsoon Depth to Water Level (Nov- 2011)
The post monsoon water level ranges from 1.00 to 19.60 m bgl. Major part of the
district shows water level in the range of 5-10 mbgl. The water level within 3 mbgl have been
recorded only in few patches in western part of Solapur district particularly in the area ground
Jeur and Kanhar in Karmala Taluka, area around Mahlshiras town and Salmukh in Malshiras
Taluka and area around Sangola in Sangola Taluka. The area around Pandharpur and
Mangalvedha in west central part of the district has recorded water level below 9 mbgl.
Similarly the area around Nagaj village in Sangola Taluka in the extreme south west part and
village Chincholi in eastern part in South Solapur Taluka and village Shole in Mohol Taluka
have also shown water level below 9 mbgl in post monsoon season. Spatial variation in post
monsoon depth to water level has been shown in Figure 4.
4.2.3 Seasonal Water Level Fluctuation (May-Nov 2011)
The seasonal water level fluctuation (May-Nov 2011) ranges from -7.95 to 7.20 m
and the mean fluctuation is1.67m. The highest negative fluctuation is at Chale NHS and
positive fluctuation is observed at Shelgoan. The fluctuation range of 0-2 m and 2-4 m have
been observed in major part of the area. The higher fluctuation ranges of 4-6 m and 6-8 m are
observed in the recharge area. Negative fluctuation is observed in six few wells in isolated
patches.
4.2.4 Long Term Water Level Trend (2001-2010)
The long term water level trend for pre and post monsoon period for the last 10 years
have been computed. The decadal water level trend is showing raise in majority of wells (47)
and fall in few wells (12) varying from +4.05 to -0.780m/yr. In general pre-monsoon water
levels are stable with mean rising trend of 0.4m/yr. Decadal mean post-monsoon depth to water
level varies between 0.32 and 5.25 m bgl. In major part of the district mean water level is in
the range of less than 2 m bgl. The decadal water level trend varies from +3.53 to -1.50m/yr.
In post-monsoon 12 wells out of 53 monitored show fall in water levels indicating draining of
aquifer due to steep gradient and natural base flow. In general the water levels are showing
rising trend over long period. the maximum area of central part and eastern and south eastern
part of Solapur district is showing declining trend of ground water level which is more
prominent at the maximum rate in the area around Pandharpur. Also decline of 0.1 to 0.2
m/year is observed in the small patches in northern part of the district around Varkute and
Karmala. Similarly in southern portion around Shivani, Pout and Nagaj in also showing
decline in water level.
14
Figure 3: Premonsoon Depth to Water Level (May 2011)

15
Figure 4: Postmonsoon Depth to Water Level (May 2011)
4.3. Yield of Bore Wells
A wide variation in yield of bore wells has been recorded in the district. The Ground
Water Surveys and Development Agency (GSDA) and Zilla Parishad had drilled 19,936
borewells in the district for rural water supply till the ends of March 2004 out of which17439
borewells are successful. Out of these 17439 successful wells, 15914 have been fitted with
hand pumps and 938 borewells, where the discharge was recorded more than 5000 liters/hour,
have been fitted with power pumps.
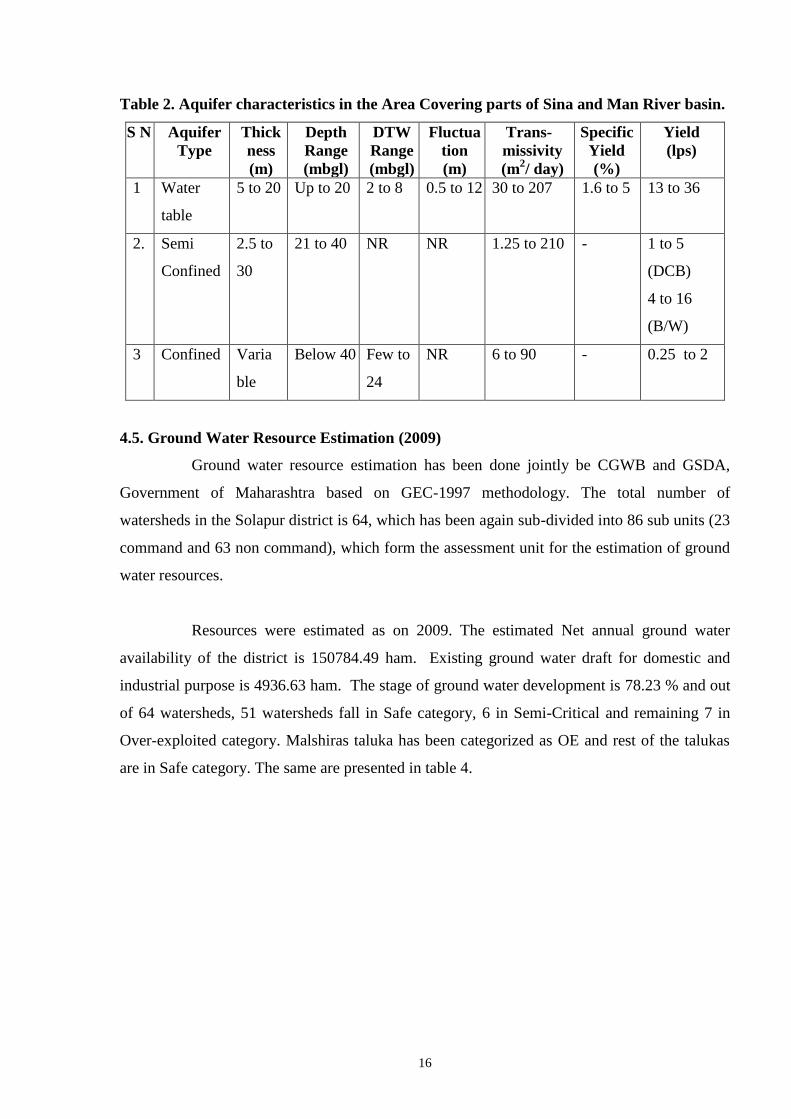
4.4 Findings of Sina-Man Project
Hydrogeological studies under Sina-Man project of the CGWB covering 6826 sq km
of the district revealed variation in the well performance and aquifer characteristics. Area was
explored up to depth of 205 mbgl and three distinct aquifer systems were observed as shown in
Table 2.
16
Table 2. Aquifer characteristics in the Area Covering parts of Sina and Man River basin.
S N Aquifer
Type
Thick
ness
(m)
Depth
Range
(mbgl)
DTW
Range
(mbgl)
Fluctua
tion
(m)
Trans-
missivity
(m2/ day)
Specific
Yield
(%)
Yield
(lps)
1 Water
table
5 to 20 Up to 20 2 to 8 0.5 to 12 30 to 207 1.6 to 5 13 to 36
2. Semi
Confined
2.5 to
30
21 to 40 NR NR 1.25 to 210 - 1 to 5
(DCB)
4 to 16
(B/W)
3 Confined Varia
ble
Below 40 Few to
24
NR 6 to 90 - 0.25 to 2
4.5. Ground Water Resource Estimation (2009)
Ground water resource estimation has been done jointly be CGWB and GSDA,
Government of Maharashtra based on GEC-1997 methodology. The total number of
watersheds in the Solapur district is 64, which has been again sub-divided into 86 sub units (23
command and 63 non command), which form the assessment unit for the estimation of ground
water resources.
Resources were estimated as on 2009. The estimated Net annual ground water
availability of the district is 150784.49 ham. Existing ground water draft for domestic and
industrial purpose is 4936.63 ham. The stage of ground water development is 78.23 % and out
of 64 watersheds, 51 watersheds fall in Safe category, 6 in Semi-Critical and remaining 7 in
Over-exploited category. Malshiras taluka has been categorized as OE and rest of the talukas
are in Safe category. The same are presented in table 4.

17
Table 3: DYNAMIC GROUND WATER RESOURCES OF THE SOLAPUR DISTRICT, MAHARASHTRA - 2008-2009
(in ham)
Sl
No.
Administrative
Unit
Command
/ Non-
Command
/ Total
Net Annual
Ground
Water
Availability
Existing
Gross
Ground
Water
Draft for
Irrigation
Existing
Gross
Ground
Water
Draft for
Domestic
and
Industrial
water
Supply
Existing
Gross
Ground
Water
Draft for
All uses
Provision
for
Domestic
and
Industrial
water
Supply to
2025
Net Ground
Water
Availability
for Future
Irrigation
Development
Sta
ge
of
Gro
un
d W
ate
r
Dev
elo
pm
en
t (%
)
Ca
tego
ry
1 Akkalkot Total 14783.17 7496.74 499.89 7996.63 999.78 6286.65 54.09 SAFE
2 Barshi Total 11600.15 8684.92 497.83 9182.74 919.31 1995.93 79.16 SAFE
3 Karmala Total 12653.18 9421.39 397.70 9819.09 705.08 2703.97 77.60 SAFE
4 Madha Total 17294.39 13056.60 524.17 13580.76 887.71 4166.65 78.53 SAFE
5 Malshiras Total 21141.50 20851.03 613.74 21464.77 890.63 2452.44 101.53 OE
6 Mangalwedha Total 9449.14 7628.17 344.12 7972.29 654.35 1166.63 84.37 SAFE
7 Mohol Total 13362.63 11243.48 474.11 11717.58 763.93 2227.92 87.69 SAFE
8 N.Solapur Total 7067.28 4324.25 210.91 4535.16 418.39 2338.10 64.17 SAFE
9 Pandharpur Total 14899.90 11075.76 382.99 11458.76 707.31 3441.74 76.90 SAFE
10 S.Solapur Total 12481.59 7351.55 365.73 7717.27 718.33 4480.43 61.83 SAFE
11 Sangola Total 16051.53 11891.79 625.44 12517.23 1266.13 2897.93 77.98 SAFE
Total 150784.49 113025.66 4936.63 117962.29 8930.95 34158.39 78.23 SAFE
4.6 Ground Water Quality
CGWB monitors the ground water quality of the Solapur district since the last four
decades through its established monitoring wells. The objectives behind the monitoring are to
develop an overall picture of the ground water quality of the district. During the year 2011, the
Board has carried out the ground water quality monitoring of 44 monitoring wells. These wells
mainly consist of the dug wells representing the shallow aquifer. The sampling of ground water
from these wells was carried out in the month of May 2011 (pre-monsoon period). The water
samples, after collection, were immediately subjected to the analysis of various parameters in
the Regional Chemical Laboratory of the Board at Nagpur. The parameters analyzed, include
pH, Electrical Conductivity (EC), Total Alkalinity (TA), Total Hardness (TH), Nitrate (NO3)
and Fluoride (F). The sample collection, preservation, storage, transportation and analysis were
carried out as per the standard methods suggested in the manual of American Public Health
Association for the Examination of Water and Waste water (APHA, 1998). The ground water
quality data thus generated was first checked for completeness and then the validation of data
was carried out using standard checks. Subsequently, the interpretation of data was carried out
to develop the overall picture of ground water quality in the district in the year 2011.

18
Suitability of Ground Water for Drinking Purpose
The suitability of ground water for drinking purpose is determined keeping in view the
effects of various chemical constituents in water on the biological system of human being.
Though many ions are very essential for the growth of human, but when present in excess,
have an adverse effect on human body. The standards proposed by the Bureau of Indian
Standards (BIS) for drinking water (IS-10500-91, Revised 2003) were used to decide the
suitability of ground water. The classification of ground water samples was carried out based
on the desirable and maximum permissible limits for the parameters viz., TH, NO3 and F
prescribed in the standards and is given in Table-4.
Table-4: Classification of Ground Water Samples for Drinking based on BIS Drinking
Water Standards (IS-10500-91, Revised 2003)
Parameters DL MPL Samples with
conc. < DL
Samples with
conc. in DL-
MPL
Samples
with conc.
>MPL
TH (mg/L) 300 600 2 21 13
NO3 (mg/L) 45 No relaxation 17 - 27
F (mg/L) 1.0 1.5 42 2 0
(Here, DL- Desirable Limit, MPL- Maximum Permissible Limit)
The perusal of Table-4 shows that the concentrations of all the parameters except nitrate
in most of the samples are within the maximum permissible limit of the BIS standards. It is
also seen from the Table-4 that the potability of ground water in the wells is mainly affected
due to the Nitrate (NO3) as its concentration exceeds more than MPL in 60% of samples.
Overall, it can be concluded that the ground water quality in the wells monitored in the district
is affected because of high NO3 concentrations.
Suitability of Ground Water for Irrigation Purpose
The water used for irrigation is an important factor in productivity of crops, their yield
and quality of irrigated crops. The quality of irrigation water depends primarily on the presence
of dissolved salts and their concentrations. Electrical Conductivity (EC) and Residual Sodium
Carbonate (RSC) are the most important quality criteria, which influence the water quality and
its suitability for irrigation.
19
Electrical Conductivity (EC)
The amount of dissolved ions in the water is best represented by the parameter electrical
conductivity. The classification of water for irrigation based on the EC values is as follows.
Low Salinity Water (EC: 100-250 µS/cm): This water can be used for irrigation with
most crops on most soils with little likelihood that salinity will develop.
Medium Salinity Water (EC: 250 – 750 µS/cm): This water can be used if moderate
amount of leaching occurs. Plants with moderate salt tolerance can be grown in most cases
without special practices for salinity control.
High Salinity Water (EC: 750 – 2250 µS/cm): This water cannot be used on soils with
restricted drainage. Even with adequate drainage, special management for salinity control may
be required and plants with good salt tolerance should be selected.
Very High Salinity Water (EC: >2250 µS/cm): This water is not suitable for
irrigation under ordinary condition. The soils must be permeable, drainage must be adequate,
irrigation water must be applied in excess to provide considerable leaching and very salt
tolerant crops should be selected.
The classification of ground water samples collected from monitoring wells for was
carried out irrigation purpose and given below in Table-5.
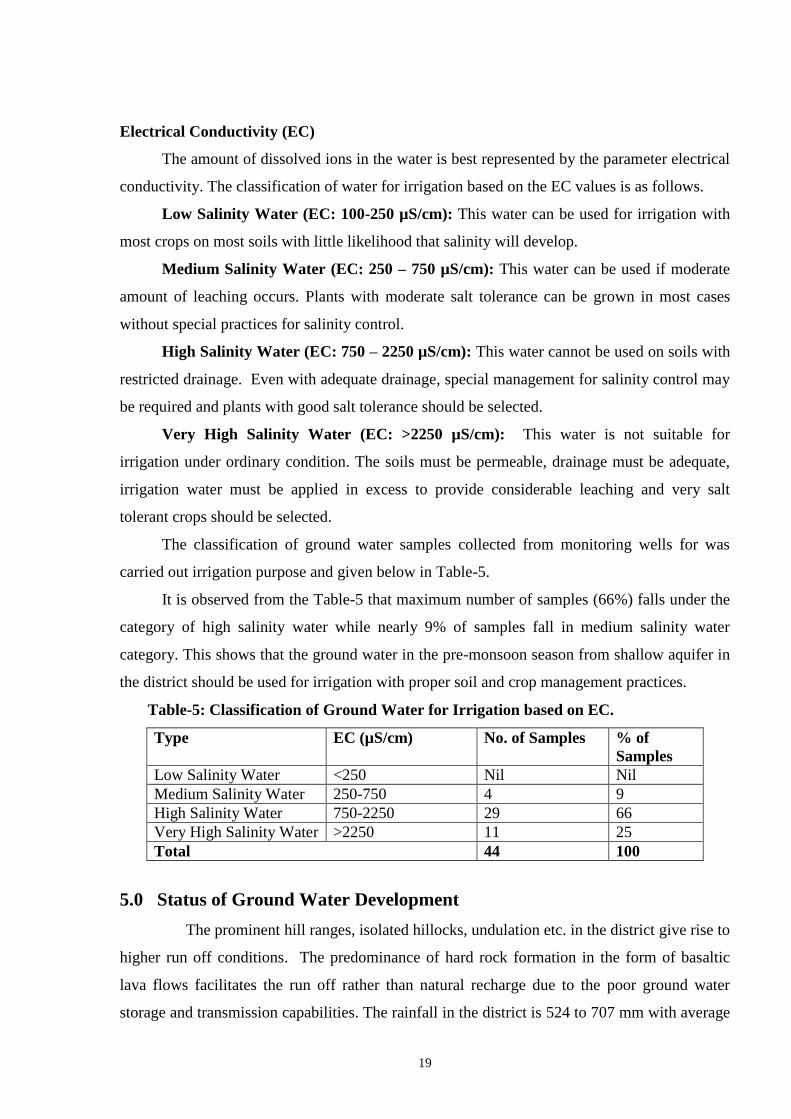
It is observed from the Table-5 that maximum number of samples (66%) falls under the
category of high salinity water while nearly 9% of samples fall in medium salinity water
category. This shows that the ground water in the pre-monsoon season from shallow aquifer in
the district should be used for irrigation with proper soil and crop management practices.
Table-5: Classification of Ground Water for Irrigation based on EC.
Type EC (µS/cm) No. of Samples % of
Samples
Low Salinity Water <250 Nil Nil
Medium Salinity Water 250-750 4 9
High Salinity Water 750-2250 29 66
Very High Salinity Water >2250 11 25
Total 44 100
5.0 Status of Ground Water Development
The prominent hill ranges, isolated hillocks, undulation etc. in the district give rise to
higher run off conditions. The predominance of hard rock formation in the form of basaltic
lava flows facilitates the run off rather than natural recharge due to the poor ground water
storage and transmission capabilities. The rainfall in the district is 524 to 707 mm with average
20
rainy days of 40 which flows out as surface runoff and the heavy rainfall leads to flash flood.
As such ground water development in the region is low to moderate. Most of the dug wells
become dry during peak summer. The bore wells range in depth from 45 to 90 m bgl and have
been drilled in most of the difficult village.
The district has a stage of ground water development of 78.23 %. All talukas are in safe
category where as Malshira is Over Exploited. Out of 64 watersheds, 51 watersheds fall in Safe
category as per the ground water resource assessment (2009) thus there is scope for further
ground water development at feasible locations so as to bring more cultivable land under
irrigation. The prime objective should be to achieve the development in scientific manner and
multi-sectoral approach by adopting latest ground water management techniques. However
even today in many part of the district where the water level is deep during post monsoon
season and the long term trend is also showing declining trend, the ground water augmentation
measures should be immediately taken up by artificial recharge methods.
The major part of the area constitutes hilly and rugged terrain where ground water
conditions are highly localized, any further ground water development to meet drinking water
requirement can be implemented on village to village basis. There exists scope for tapping the
deep aquifer through bore well in the depth range of 45-100 m bgl for drinking water supply.
Dug wells may be constructed down to the depth of 15 m, so as to tap the weathered, vesicular/
fractured and jointed basalt, normally available down the depth of 15 m bgl. The diameter of
the well can be 3.5 to 6.5 m, so that the storage in the well can also be made use of in addition
to the ground water seeping in. Dry dug wells existing in the trap area are shallow and these
can be revitalized by converting them to dug-cum-bore wells.
5.1 Rural Water Supply
Under rural water supply schemes all the 1134 villages and 3263 wadis are covered and
all the villages and wadis are having bore wells. Out of 17439 successful bore wells 15914 are
fitted with hand pumps and 938 are provided with electric motors.
6.0 Water Conservation Practices
The entire area of Solapur district is occupied by hard rocks of Deccan basaltic group
and receives rainfall varying from 524 to 707 mm/year. The availability of surface water is
limited to monsoon period. The state government has taken small schemes of water
conservation in the district to conserve monsoon water and run off generated thereof.

21
Total 278 percolation tanks have been constructed in the district with storage capacity
of 82.9 MCM with irrigation potential of 4256 ha. Kolhapur types (KT Weirs) are constructed
at 93 locations in the district having storage capacity of 246.68 MCM with irrigation potential
of 78843.5 ha. Apart from this there are 40 village tanks constructed in the district, which have
59.91 MCM of gross storage.
Ground Water Surveys and Development agency (GSDA) Government of Maharashtra has
under taken ground water conservation effort by adopting unconventional techniques in the
district. Fracture Seal Cementation (FSC), 23 jacket well, 223 hydro fracturing and 1 bore
blasting technique schemes have been completed till the end of 2001 in 154 villages of the
district.
The work of soil, land and water conservation in the state is done by the department
like Agriculture and Soil etc. The State Agriculture department has constructed 2495-brush
wood dams, 26896 loose boulder structures, 38136 Earthen structures, 329 Gabian structures,
7223 Farm ponds, 22884 Earthen nala bandh, 1173 Cement nala bandhs, 462 Under ground
bandharas, and 197 Gulley plugging. Apart from this 99.78 km of continuous contour
trenching and 50.24 km of line trenching has also been done.
7.0 Mass Awareness and Training Programme
7.1 MAP and WMTP
Till March 2009 one Mas Awareness Programme has been organized at Pandharpur on
29/03/2011 which was attended by 300 participants
7.2 Area Notified by CGWA/SGWA
Though Malshiras Taluka has been categorized as Over Exploited, it has not been notified by
either CGWB/SGWA till March 2011.
7.0 Recommendations
To develop the available ground water resources in Solapur district, the necessary
care should be taken so that the agriculture, which is the main activity for lively hood in the
area, is boosted up. Solapur district, from recommendation point of view for ground water
development and augmentation, is divided into three categories. These are hill ranges, Deccan
pedeplain and urban area.
22
Hilly areas and foot hills are suitable for soil and water conservation activities such as
continuous contour trenching (CCT), Nala bunds, Gabion structure, Vegetative bunds,
Loose boulder bunds, Terracing etc. The construction of medium and minor irrigation
project at foot hills are also feasible with lined or pipe canal system.
Ground water development in the district is to be done very judiciously in Deccan
peneplains. With declining water level trends particularly in post monsoon season, future
ground water development should be taken very carefully particularly in scarcity villages/
areas. This area requires ground water augmentation by constructing percolation tanks,
cement plugs and K.T.Weirs, at appropriate and need based locations on scientific lines.
The area showing rising water level trend and having shallow water level ranging <3m and
3 to 6 mbgl during pre monsoon needs ground water development at favorable locations.
It has been estimated that Net annual ground water availability is 1507.84 MCM. Malshira
Taluk has be categorized as Over Exploited and rest of the talukas are in Safe Category.
The stage of ground water development is 78.23 % and out of 64 watersheds, 51
watersheds fall in Safe category, 6 in Semi-Critical and remaining 7 in Over-exploited
category. Thus 51 watersheds are safe for ground water development. However while
developing ground water or making new structure for ground water abstraction, the dual
strategy for ground water development and augmentation is required that would be
beneficial for future ground water management. Whereas, in Semi critical and Over
exploited watersheds intensive site specific artificial recharge measures coupled with
public awareness at every level is the need of the hour
In the City/Urban areas, the roof top rainwater harvesting for artificial recharge should be
made mandatory. So that the available resources for drinking water supply should remain
sustainable.
The issue related with ground water development, augmentation and management indicates
that there is need of scientific and multi-sectoral approach for making the future plan.
However all the aspect related to conjunctive use, ground water legislation, involvement of
NGO’S, women and community participation, mass awareness, adoption of advanced
irrigation system etc will play an important role in conserving and developing the precious
water resources.
Ground water quality is adversely affected by nitrate contamination in 60% of the samples.
Hence all the used for water supply should be checked for nitrate content and if the nitrate
content is found beyond permissible limits for drinking water purposes, adequate sanitary
protection may be provided to well to control it.