gross domestic 2019 product - monaco statistics
TRANSCRIPT

Gross Domestic Product
November 2020
2019

Gross Domestic Poduct 20199 – November 202020 2

Gross Domestic Poduct 20199 – November 202020 3
CONTENTS
INTRODUCTION ........................................................................................................................................................ 4
1. Gross Domestic Product.................................................................................................................... 5
1.1 International economic situation ................................................................................................................... 5
1.2 National GDP figures ..................................................................................................................................... 6 1.2.1 Summary of results ....................................................................................................................................... 6 1.2.2 GDP aggregate.............................................................................................................................................. 7 1.2.3 GDP Structure ............................................................................................................................................... 8 1.2.4 GDP distribution ............................................................................................................................................ 9
1.1 GDP per capita ............................................................................................................................................................. 11
1.1.1 GDP per capita: presence on the economic territory ................................................................................. 11 1.1.1 GDP per employee ...................................................................................................................................... 12 1.1.1 GDP per employee in Monaco and in France ............................................................................................. 12
2. GDP calculation methodology and procedure ................................................................ 14
2.1 Regulatory framework and methodology used ........................................................................................................ 14
2.1.1 The 1995 European System of Accounts (ESA 1995) ................................................................................ 14 2.1.2 The 2010 European System of Accounts (ESA 2010) ................................................................................ 14 2.1.3 GDP at the core of economic rationale ....................................................................................................... 14 2.1.4 Determination of GDP ................................................................................................................................. 15
2.2 Procedure implemented in the Principality ............................................................................................................... 16
2.2.1 Determining the calculation algorithms ...................................................................................................... 16 2.2.2 Extrapolation method used for the GDP results ......................................................................................... 16 2.2.3 Determining GDP per sector ....................................................................................................................... 17 2.2.4 GDP in current euros and in constant euros .............................................................................................. 18
2.3 GDP calculation algorithm .......................................................................................................................................... 18
2.3.1 Gross Domestic Product ............................................................................................................................. 18 2.3.2 Compensation and social charges (D1) ...................................................................................................... 18 2.3.3 Gross Operating Surplus and mixed income .............................................................................................. 18 2.3.4 Taxes on production (D2) ............................................................................................................................ 18 2.3.5 Subsidies (D3) ............................................................................................................................................. 19

Gross Domestic Poduct 20199 – November 202020 4
INTRODUCTION
This document presents the results of the calculation of the Gross Domestic Product (GDP) for the year 2019 and restates the methodological principles and choices used for the calculations.
The Gross Domestic Product (GDP) summarises economic activity and constitutes an essential information in the current economic debates. It makes it possible to monitor and assess the effectiveness of economic policies implemented and to make comparisons with other countries, particularly EU countries.
The Principality's GDP, which is calculated since 2005, is published in an annual report. Since 2006, the figures are broken down by sectors and are also presented in constant euros, correcting for inflation. In 2018, "Base 100 in 2014" replaced "Base 100 in 2010". This changed the GDP figures in real terms, thus changing the growth rates.
Moreover, GDP N-1 data are updated with the responses received after the deadline. A new extrapolation is thus calculated and included.

Gross Domestic Poduct 20199 – November 202020 5
1. Gross Domestic Product
1.1 International economic situation
The global economy has recorded its weakest growth for a decade, falling to 2.3% in 2019. The volume of global trade in goods, crippled by continuing trade tensions, particularly between China and the US, fell by 0.1% in 2019, the first contraction since the global financial crisis in 2008–2009.
In the euro zone and in the wider European Union, there was a slowdown in economic activity during the fourth quarter of 2019, when GDP increased by just 0.1%. These are the lowest quarterly rates since the beginning of 2013, according to Eurostat. Growth is much weaker than it was in 2018.
While linked to trends in the global economy, the successive figures for GDP since it was introduced in Monaco in 2005 illustrate that the national economy is highly dependent on the performance of several major local economic players.
From one year to the next, the closing or not of specific and one-off transactions by economic agents has direct consequences, both positive and negative, on the performance of a small economy such as Monaco’s. This is particularly the case in sectors such as construction (dependent on real estate developments) and other service activities, where results can vary widely from year to year.
Monaco’s GDP for 2019 was €6.63 billion, compared with €6.09 billion in 2018, an increase of 7.5% in real terms, adjusted for inflation.
FIGURE 1 : Change in GDP growth rates by geographical area
Sources : World Bank, IMSEE

Gross Domestic Poduct 20199 – November 202020 6
1.2 National GDP figures
1.2.1 Summary of results
After a fall in 2017 (-3.5%), the Principality’s GDP continued its recovery (+7.5% in 2019, following a rise of +6.0% in 2018).
Monaco’s GDP for 2019 was €6.63 billion, compared with €6.09 billion in 2018 (see Table 1), an increase of +7.5% in real terms, adjusted for inflation (see Table 2).
All components of GDP rose in 2019, with gross operating surplus seeing the largest increase (+13.8%, see Table 3), as during the previous year.
Employment continued to increase in 2019 across both the private and public sectors. There were 1,564 employees (+2.8%) in December. The amount of wages paid rose by 4.6%, accounting for almost half of GDP (44.8%), excluding subsidies. This corresponds to the share of annually created wealth, which is redistributed in the form of salaries and social security contributions.
Taxes paid on products rose relatively sharply (+5.8%), contributing 12.4% of wealth produced. This was primarily due to an increase in VAT collected, but also, to a lesser extent, to a rise in transfer duties.
The amount of subsidies continued to increase (+1.5%) at a very similar rate to that seen in 2018 (+1.7%).
As is the case every year, economic performance by sector highlighted significant differences depending on the activity (see Table 4). Eight of the 12 major economic sectors (MES) that make up the Monegasque economy saw an increase in sectoral GDP, but growth was particularly concentrated in two sectors: administration, education, health and social work activities as well as financial and insurance activities.
The three most important economic sectors in the Principality in terms of GDP are scientific and technical activities, administrative and support services; financial and insurance activities; and construction. Together, these account for almost half (44.4%) of the wealth produced.
GDP per capita was €75,942, an increase of +5.8% in real terms (see Table 6). GDP per employee, an indicator of productivity, also rose by +4.6% to €114,600 (see Table 7).

Gross Domestic Poduct 20199 – November 202020 7
1.2.2 GDP aggregate
The 2005 GDP is the base year for this aggregate. It is valued in "nominal" terms, i.e. in current euros. Growth is calculated as the change in GDP in nominal terms corrected for inflation (GDP in real terms). The index used for this correction is calculated every year by INSEE. The base year (base 100) is updated every five years. In 2018, the year 2014 replaced the year 2010 as base year. This change marginally impacted the GDP amounts in real terms and their growth.
TABLE 1: GDP in nominal terms 1
Source: IMSEE Unit: million of euros
TABLE 2: GDP in real terms 2
Sources: INSEE, IMSEE Unit: million of euros
The Principality’s GDP was €6.63 billion in 2019. After a fall in 2017 (-3.5%), Monaco’s GDP continued its recovery (+7.5% in 2019, following a rise of +6.0% in 2018).
FIGURE 2 : Change in GDP in millions of current euros
Source: IMSEE Unit: million of euros
1 GDP in nominal terms is expressed in "current euros". 2 GDP in real terms is expressed in " constant euros", base 100 in 2014. It is corrected for inflation by the price index of gross domestic product and its components published by INSEE.
Gross Domestic Poduct 20199 – November 202020 8
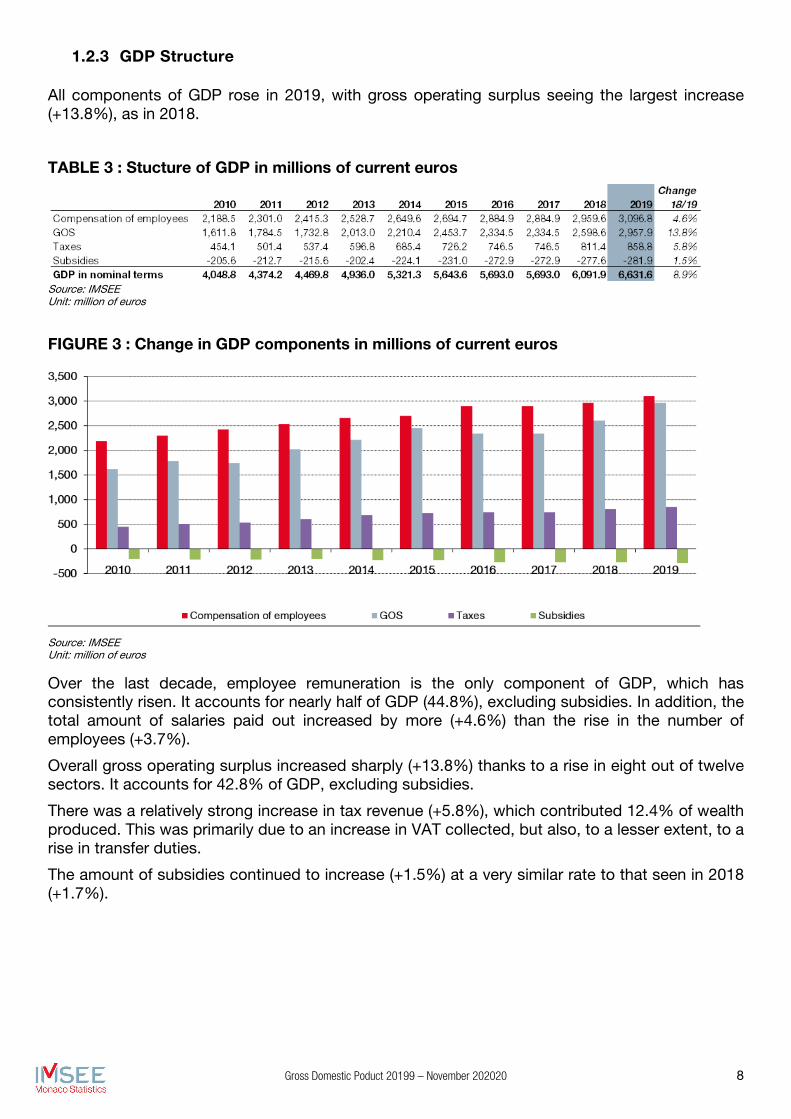
1.2.3 GDP Structure
All components of GDP rose in 2019, with gross operating surplus seeing the largest increase (+13.8%), as in 2018.
TABLE 3 : Stucture of GDP in millions of current euros
Source: IMSEE Unit: million of euros
FIGURE 3 : Change in GDP components in millions of current euros
Source: IMSEE Unit: million of euros
Over the last decade, employee remuneration is the only component of GDP, which has consistently risen. It accounts for nearly half of GDP (44.8%), excluding subsidies. In addition, the total amount of salaries paid out increased by more (+4.6%) than the rise in the number of employees (+3.7%).
Overall gross operating surplus increased sharply (+13.8%) thanks to a rise in eight out of twelve sectors. It accounts for 42.8% of GDP, excluding subsidies.
There was a relatively strong increase in tax revenue (+5.8%), which contributed 12.4% of wealth produced. This was primarily due to an increase in VAT collected, but also, to a lesser extent, to a rise in transfer duties.
The amount of subsidies continued to increase (+1.5%) at a very similar rate to that seen in 2018 (+1.7%).

Gross Domestic Poduct 20199 – November 202020 9
1.2.4 GDP distribution
Eight out of twelve sectors saw an increase in GDP compared with 2018.
FIGURE 4 : GDP by sector in 2018 and 2019 in millions of current euros
Source: IMSEE Unit: million of euros
TABLE 4: GDP in nominal terms by sector expressed in millions of current euros
Source: IMSEE Unit: million of euros
Scientific and technical activities, administrative and support services continued to be the leading sector in terms of contribution to Monaco’s GDP. Despite strong growth (14.2%), financial and insurance activities remained in second place. These two sectors account for more than a third of GDP.
Construction returned to its status as the third-largest contributor, benefiting from a sharp rise in sectoral GDP (13.9%) and a slight dip in the GDP of real estate activities (-0.8%).
Industry’s GDP continued contract (-9.0%) to reach its lowest ever level.
Gross Domestic Poduct 20199 – November 202020 10
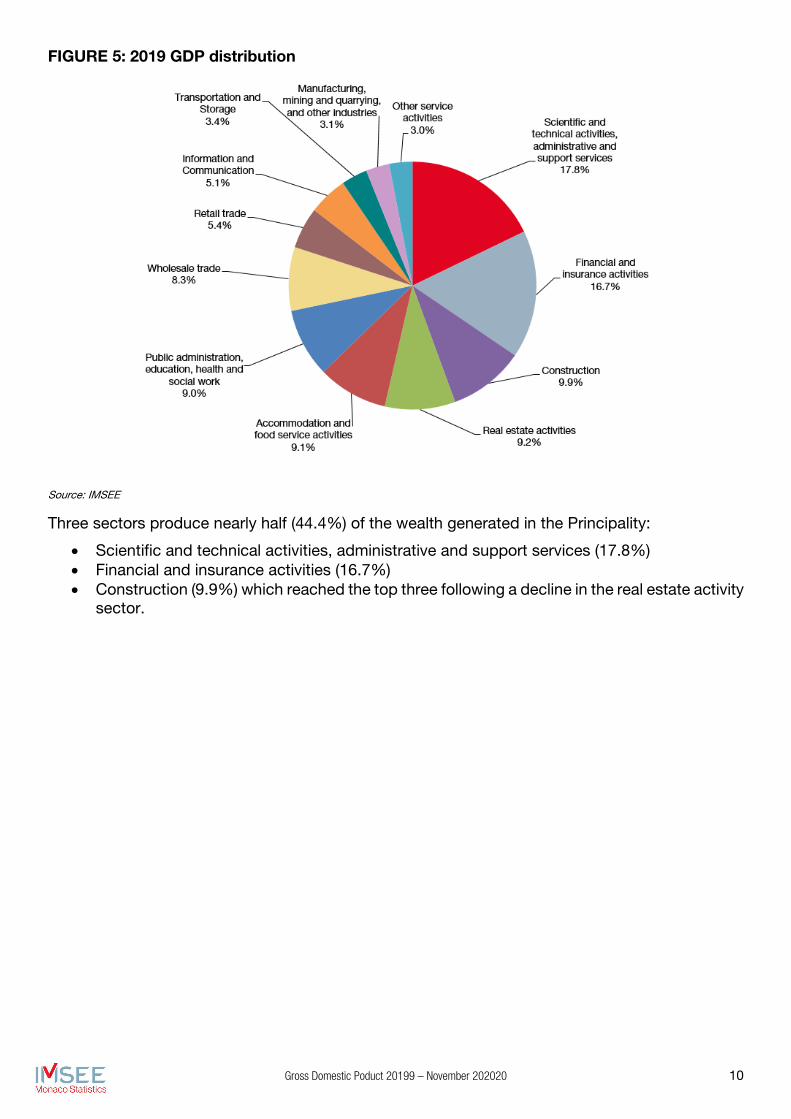
FIGURE 5: 2019 GDP distribution
Source: IMSEE
Three sectors produce nearly half (44.4%) of the wealth generated in the Principality:
• Scientific and technical activities, administrative and support services (17.8%) • Financial and insurance activities (16.7%) • Construction (9.9%) which reached the top three following a decline in the real estate activity
sector.

Gross Domestic Poduct 20199 – November 202020 11
1.1 GDP per capita
The situation in the Principality of Monaco is quite unique in many respects, in particular as regards, firstly, its resident population and, secondly, its wage-earning population.
In 2019, for 38,100 residents, there were 57,867 employees, of whom 85% domiciled outside Monaco. This very uncommon situation, unique in the world, makes international comparisons tricky and the use of certain conventional international indicators inappropriate. This is true in particular for GDP per capita, a usual indicator.
However, in order to be able to place the Principality in its environment and in an international context, two types of "ad hoc" GDP per person are calculated.
Firstly, GDP per capita calculated since 2005 and, secondly, GDP per employee.
1.1.1 GDP per capita: presence on the economic territory
For the calculation of GDP per capita, the European system of accounts (ESA) uses the resident population on the economic territory. However, it is important to take into account specific local economic features.
In the case of the Principality, the wage-earning population consists of "daily workers" who do not reside on the Monegasque territory. Considering their economic weight and their daily contribution to wealth creation, it seemed appropriate to create a reference population for the calculation of GDP per capita.
The reference population used consists of two components: the resident population and the non-resident population employed in the economic territory.
TABLE 5: Reference population for the calculation of GDP per capita
Source: IMSEE
Previous population estimates have been updated following the 2016 population census. The total reference population in 2019 was 87,324 (+1,448).

Gross Domestic Poduct 20199 – November 202020 12
TABLE 6: PIB « per capita »
Sources: INSEE, IMSEE
GDP per capita was EUR 75,942, up +5.8% in real terms. With the increase (+1.7%) in the reference population, the change in GDP per capita is less than the change in GDP.
1.1.1 GDP per employee
It can be used as a means of productivity measurement and comparison.
TABLE 7: GDP per employee
Sources: INSEE, IMSEE
GDP per employee was EUR 114,600, up +4.6% in real terms.
1.1.1 GDP per employee in Monaco and in France
French data for 2018 and 2019 are provisional.
TABLE 8: France - GDP per employee in real terms
Sources: INSEE, IMSEE Units: thousand, billion euros 2014

Gross Domestic Poduct 20199 – November 202020 13
TABLE 9: Change in the GDP gap per employee between Monaco and France in constant euros
Sources: INSEE, IMSEE Unit: euros 2014
The GDP per employee in Monaco has always been higher than in France. The maximum difference was reached in 2016.
FIGURE 6: Change in GDP “per employee” in constant euros
Sources: INSEE, IMSEE Unit: euros 2014

Gross Domestic Poduct 20199 – November 202020 14
2. GDP calculation methodology and procedure
2.1 Regulatory framework and methodology used
2.1.1 The 1995 European System of Accounts (ESA 1995)
The European system of national and regional accounts (ESA 1995), effective since 1999, broadly consistent with the System of National Accounts of the United Nations (1993 SNA), defines a framework for ensuring the consistency of measurements in the European Union.
For the sake of comparability and transparency with regard to the international community and where information is available, the Principality used ESA 1995 as the basis to design its tools for measuring national wealth, i.e Gross Domestic Product (GDP) and Gross National Income (GNI)3.
2.1.2 The 2010 European System of Accounts (ESA 2010)
ESA 1995 is gradually being replaced by ESA 2010. For many countries (including France and Switzerland), 2014 is the year of revision of the national accounts and of publication of the first aggregates in accordance with ESA 2010.
The main changes made lie in the recognition of research and development expenditure and military expenditure.
In ESA 1995, research and development expenditure are considered as current expenditure and recorded as intermediate consumption. As a result, it reduces a country's GDP. However, this expenditure has a long-term impact that can be measured over several years. This is the reason why, according to 2010, it must be considered as investments. This increases the GDP figure.
As regards military expenditure, in ESA 1995, it is treated as the government's intermediate consumption if the military equipment cannot be used for civilian purposes (e.g. fighter planes). In ESA 2010, it was decided to record all weapons expenditure as an investment if the service life is more than one year.
Other methodological or conceptual changes have also been brought by the new European system of accounts. They have not all been completed in terms of methodology, such as the estimate of production of services by non-life insurers and reinsurers.
Given the particular situation of the Principality of Monaco (customs and monetary union with France, no national accounting system), certain economic information is not available.
This is the reason why GDP calculation in the Principality does not take certain data into account. In particular, this is the true for imputed rentals for housing (estimate of rentals which residents of an accommodation would have paid if they had been tenants and not owners of their accommodation), which is included in GDP according to ESA 2010 but never estimated in Monaco.
This also explains why the changes brought about by ESA 2010 are not taken into account for the calculation of GDP in Monaco, which continues to use ESA 1995 as reference.
The GDP estimate in the Principality is understated as certain components of GDP are not taken into account.
2.1.3 GDP at the core of economic rationale
3 The Gross National Income represents total primary income (gross) receivable by resident institutional units (gross operating surplus, gross mixed income, compensation of employees, taxes on production and imports less subsidies, property income (receivable less payable).
It is equal to Gross Domestic Product (GDP) minus primary income payable by resident units to non-resident units, plus primary income receivable by resident units from the rest of the world.
It provides a measurement of the primary income received by all resident institutional units and allows international comparisons.
Source INSEE

Gross Domestic Poduct 20199 – November 202020 15
GDP is one of the aggregates that determines national wealth and how it increases, in other words "economic growth".
Along with the Gross National Income (GNI) it is a summary of the theoretical considerations of macro-economics and the practical considerations of the European framework of national accounts.
2.1.4 Determination of GDP GDP can be approached in three ways, all equivalent in terms of results: as an indicator of economic activity (production approach)
GDP is the sum of gross values added (VA) by different institutional sectors or industries, less subsidies on products:
GDP = sum of gross VA + Taxes on products
- Subsidies on products as an indicator of production (expenditure approach)
GDP is the value of goods and services produced by resident units and available for final uses. It is calculated as the sum of final uses of goods and services by resident institutional units.
as an indicator of income (income approach) GDP is equal to the sum of primary incomes distributed by resident producer units less subsidies.
GDP = Compensation of employees + Gross operating surplus and mixed income + Taxes on production - Subsidies The Principality's approach is that of GDP as an indicator of income insofar as this approach does not imply the immediate creation of national accounts. The key macro-economic aggregates show that this is a coherent choice.
GDP measured in nominal terms
GDP calculated in this manner is measured in "nominal" terms, i.e. in current euros.
To measure the "real" growth of the aggregates, the price effect must be separated from the volume effect. To do this, the GDP in "nominal" terms is deflated by the average price variation over the year ended. This gives the GDP in "real" terms.
The price index used for these calculations is France's price index published by INSEE. The GDP in real terms will be calculated based on the change in the consumer price index taking 2014 as the base year.
Scope of calculation: residence The scope of calculation is the national economy. This includes all resident units, i.e. units having a centre of economic interest on the economic territory. Determining the coverage area implies defining an economic territory that includes the
following: o The country's geographic territory; o Any free zones, including bonded warehouses and factories under customs control; o The national air-space, territorial waters and the continental shelf lying in international
waters, over which the country enjoys exclusive rights; o Territorial enclaves; o Deposits in international waters worked by resident units.
Coverage period: one year
Gross Domestic Poduct 20199 – November 202020 16
o A unit is recognised as having a centre of economic interest on the economic territory when it engages for an extended period (one year or more) in economic activities on this territory. Nationality is not a criterion considered. Any other unit is classified as non-resident.
The subdivision of the economic territory into different classifications: economic agents, economic transactions, accounts.
2.2 Procedure implemented in the Principality
In order to meet the objectives set out above, the Government set up a working group on this matter in 2005. The objectives were to define the given territory and to carry out a census of economic agents. The aim is to determine the statistical elements necessary for producing financial aggregates, in particular through a national statistical survey, which is essential for constructing the GDP.
IMSEE (Monegasque Institute of Statistics and Economic Studies), established by Sovereign Ordinance no. 3.095 of 24/01/2011 and a spin-off of the Statistics and Economic Studies Division, is today responsible for calculating the Principality's GDP.
2.2.1 Determining the calculation algorithms
The main objective of this large-scale project was to define the algorithms for calculating economic aggregates (see 2.3) and to ensure the consistency of all information collected.
2.2.2 Extrapolation method used for the GDP results
Since the calculation of GDP in 2005, data on the Gross Operating Surplus (GOS) of Monegasque economic agents have been compiled through a survey.
Of the 10,015 economic agents concerned in 2019, the percentage of files processed was 72.4% (88.6 % in 2018).To understand the overall GOS, and address the percentage of non-responses, statistical extrapolation procedures are used (with the same methodology applied since the beginning). It was nevertheless possible to use certain data pertaining to non-responding companies, in particular the legal form, the sector and sub-sector of activity and the workforce for some of them.
Initially, discriminant variables of the GOS were determined based on the data provided by the responding companies. Based on statistical analyses, five discriminant variables were determined:
1. Size of the business: the top 100 businesses in terms of turnover were processed differently. The aim is not to reproduce the atypical nature of these companies across all non-responding companies;
2. Legal form;
3. Sector of activity;
4. The company's workforce;
5. The wage bill.
However, with the data available on the non-responding companies it was not possible to exploit all of these explanatory variables. For example, statistical analyses show that the number of employees seems to be a discriminant variable of the GOS. However, it was not possible to use this information insofar as the number of employees is rarely available for non-responding companies. The work was thus refocused on known variables of these entities, namely the legal form, the sector and sub-sector of activity.

Gross Domestic Poduct 20199 – November 202020 17
Subsequently, the results obtained from the discriminant analyses were corrected for the bias caused by the existence of outliers. Thus, for a legal form and sub-sector of activity, 90% of the data were kept for extrapolation. The objective was to have a less volatile estimate of the GOS, not biased by outlier businesses of the class under consideration. After correcting the average GOS estimates per class, the extrapolation was possible using the data available on non-responding companies.
2.2.3 Determining GDP per sector
As part of the analyses conducted by most Monegasque authorities, 12 sectors of activity were identified across the Principality's economic fabric.
Key assumptions for calculating GDP per sector:
As regards salaries, IMSEE uses the data provided by the Social Security offices (Caisses Sociales) in Monaco.
The GOS of each sector was then extrapolated using the same method as that used for calculating total GDP (see above).
Subsidies were allocated to and weighted for each sector based on their nature and purpose.
As regards the allocation of taxes per sector of activity, several analyses were carried out.
Based on these, the following apportionment rules were decided:
• For VAT collected, a small part consists of an account "Non-apportioned by sector". It was accepted that it is possible to apply to this item a distribution key corresponding to that of the known part of VAT collected per sector.
• Similarly, it was accepted that this distribution key could apply to all the other items listed below:
o French repayment in respect of the VAT-sharing account; o Import duties; o Annual vessel flag fees; o Domestic tax on petroleum products (TIPP) and excise duty on tobacco products; o Profits of the Tobacco Monopoly; o Leasehold rights; o Stamp duties; o Tax on insurance contracts; o Alcohol excise duties; o Duties levied on company cars.
However, it was agreed to allocate the budgetary items "VAT on property" and "Transfer duties" to the real estate sector.
Gross Domestic Poduct 20199 – November 202020 18
2.2.4 GDP in current euros and in constant euros
To measure GDP in constant euros, an inflation/revaluation index was applied to the 2014 aggregates. Considering the characteristics and the geographical location of the territory of the Principality of Monaco, it was agreed to rely on the data and assumptions made to measure the French GDP, provided by INSEE.
The annual accounts at constant prices (also called "in real terms") of the 2014 base are presented "at the price of the previous year, chain-linked, 2014 base" (1.03 Price index of supply and use of goods and services).
The objective of this presentation is to provide users of aggregates with the best time series at constant prices. The change of an aggregate at constant prices is easier to interpret when the year of constant prices is close enough to the year of the prices under review.
This is why changes in aggregates at constant prices of the annual national accounts for a given year are systematically calculated taking as basis the aggregates at constant prices of the previous year, to which are applied the price changes of the previous year. These series are then called 100 in 2014, then multiplied by the value at current prices of the aggregate in 2014, in such a way that users have at their disposal at the same time the order of magnitude of the aggregate.
2.3 GDP calculation algorithm
2.3.1 Gross Domestic Product GDP = Compensation and social charges (D1) + Gross operating surplus and Mixed income
+ Taxes on production (D2) - Subsidies (D3)
2.3.2 Compensation and social charges (D1) D1 = Gross wages and salaries in cash
+ Effective social contributions payable by employers + Imputed social contributions payable by employers
2.3.3 Gross Operating Surplus and mixed income If the respondent fills in the detailed Q1 questionnaire: GOS = Turnover, net of taxes
+ Capitalised production costs - Amount of purchases ± Changes in inventories - Consumption for the year + Operating subsidies - Taxes and similar levies - Gross Salaries & Compensation
- Total social contributions If the respondent fills in the Q2 questionnaire: GOS = TO / Fees and/or Treatments charged
- Purchases and expenses for the year ± Changes in inventories + Operating subsidies - Gross Salaries and Compensation
- Total social contributions
2.3.4 Taxes on production (D2)
Gross Domestic Poduct 20199 – November 202020 19
D2 = VAT + Taxes on imports (D212) + Other taxes on products (D214) + Other taxes on production
VAT VAT = D211
+ net VAT collected in the Principality (excluding VAT on property) ± French repayment in respect of the sharing account. Taxes on imports D212 = Import duties
+ Annual vessel flag fees Other taxes on products D214 = Domestic tax on petroleum products (TIPP) and excise duty on tobacco
products + Profits of the tobacco monopoly + Transfer duties
+ Leasehold rights + Stamp duty + Tax on insurance contracts + VAT on property
+ Alcohol excise duties
Other taxes on production
D29 = Taxes related to property or to the use of real estate, machines, vehicles and equipment. Taxes on the wage bill and payroll, on authorisation to carry out a professional activity, on harmful emissions.
2.3.5 Subsidies (D3) D3 (D393 + D399) = Operating grant from the Municipality
+ Operating grant from the CHPG + Operating grant from other public institutions + Subsidies in the educational and cultural field + Subsidies for public policies + Subsidies in the social and humanitarian field + Funding for sports
+ Organisation of events in the Principality
To access IMSEE publications: http://www.imsee.mc/Publications
To follow IMSEE news: http://www.imsee.mc/Publications
To subscribe to IMSEE newsletters: http://www.imsee.mc/Newsletters
MONEGASQUE INSTITUTE OF STATISTICS AND ECONOMIC STUDIES
9 rue du Gabian
98000 MONACO
www.imsee.mc
Gross Domestic Product 2019
November 2020
ISSN-L 2311-5386