grocery universe 2012 - nielsen · to 605 stores in 2015. • f2 has increased its market share up...
TRANSCRIPT

Any reproduction, representation or use of one or various elements of this report must show the full mention: Source: Nielsen
GROCERY UNIVERSE 2016
RESULTS OF THE 54TH INVENTORY OF RETAIL GROCERY IN BELGIUM, DRAWN UP BY NIELSEN.

2 Nielsen Grocery Universe 2016 │ Copyright ©2016 The Nielsen Company. Confidential and proprietary.
TABLE OF CONTENTS
1. Nielsen in brief
2. Belgian Economy & Retail in 2015
3. The Nielsen Grocery Universe
3.1 Turnover and inflation
3.2 Number of stores
3.3 Market share by Shop Type
3.4 Sales surface
3.5 Discounters in Belgium
3.6 Regional characteristics
3.7 Private labels
4. Retailing in Europe
4.1 International Shop Types
4.2 Discounters in Europe
5. The Nielsen Services

1. NIELSEN IN BRIEF

4 Nielsen Grocery Universe 2016 │ Copyright ©2016 The Nielsen Company. Confidential and proprietary.
THE NIELSEN COMPANY
For 92 years Nielsen services have been making the FMCG (Fast Moving Consumer Goods) market visible and comprehensible for manufacturers and retailers. Nielsen is the world’s leading provider of information and market analysis in the consumer and service sectors thanks to the quality of its data, the accessibility of its analyses, the expertise it has built up over more than 92 years of practical experience and the rapidity with which it communicates its findings.
• Established in the United States in 1923 by Arthur C. Nielsen
• Operates in over a hundred countries
• Active in Belgium since 1954
‒ Over 200 regular clients
‒ Studies more than 400 product categories
This overview represents the results of the 54th inventory of the world of retail grocery sector, drawn up every year by Nielsen.

2. THE ECONOMY & RETAIL IN 2015

Nie
lsen
Gro
cery
Un
iver
se 2
016
│ C
op
yrig
ht ©
2016
Th
e N
iels
en C
om
pan
y. C
on
fid
enti
al a
nd
pro
pri
etar
y.
6
Refugee crisis roils EU
EEU : Eurasian Economic Union
Flowing liquid water found on Mars
Ahold – Delhaize merger announcement
Microsoft introduces Windows10
Greek debt drama
Terrorism strikes on
Global climate change agreement

Nie
lsen
Gro
cery
Un
iver
se 2
016
│ C
op
yrig
ht ©
2016
Th
e N
iels
en C
om
pan
y. C
on
fid
enti
al a
nd
pro
pri
etar
y.
7
The turnover has grown by +1.2% thanks to the price inflation. The volume remained steady.
BELGIUM: THE NIELSEN BAROMETER EVOLUTION
(*) The Nielsen Barometer shows the trend as a percentage of sales of a representative group of FMCG products in the retail sector in Belgium
FMCG: Food & Non Food
Sales Value Sales Volume Price of Package Sold
% 2015 vs 2014 +1.2% +0.0% +1.2%
% 2014 vs 2013 +2.4% +1.2% +1.2%
% 2013 vs 2012 +2.2% +0.0% +2.2%
% 2012 vs 2011 +2.2% +0.1% +2.1%
% 2011 vs 2010 +3.2% +0.8% +2.4%

Nie
lsen
Gro
cery
Un
iver
se 2
016
│ C
op
yrig
ht ©
2016
Th
e N
iels
en C
om
pan
y. C
on
fid
enti
al a
nd
pro
pri
etar
y.
8
Q1 and Q3 2015 show a volume increase. The price mix drives the performance on Q2 and Q4.
BELGIUM: FMCG TRENDS PER YEAR AND PER QUARTER
2.2%1.2% 1.2% 1.0%
2.0%1.4%
0.3% 0.3% 0.4% 1.5% 2.3%1.2% 1.7%
3.7%
-0.6%-0.1%
1.4%
-0.1%
0.2%
-0.8%
2.2% 2.4%
1.2%
2.7%
5.7%
0.8%0.2%
1.7%
0.3%
1.7% 1.5%
-2%
-1%
0%
1%
2%
3%
4%
5%
6%
2013 2014 2015 Q1'14 Q2'14 Q3'14 Q4'14 Q1'15 Q2'15 Q3'15 Q4'15
Average price change Volume change Nominal growth
Source: Nielsen Growth Reporter

3. NIELSEN GROCERY UNIVERSE 2015

10 Nielsen Grocery Universe 2016 │ Copyright ©2016 The Nielsen Company. Confidential and proprietary.
DEFINITION OF THE GROCERY UNIVERSE
The grocery sector includes the following:
1. Retail stores in Belgium selling at least four of the following food categories:
• Edible fats • Canned goods • Bottled drinks • Drinks in the form of solid substances (e.g. coffee and tea) • Pasta • Confectionery
2. ‘Food’ sales also have to represent at least 40% of total turnover
Are excluded:
1. Stores that generate more than 50% of their turnover through the sale of meat products or fish and shellfish.
2. Stores specialising in diet foods.
3. Stores that are part of petrol stations (e.g. Yelloh, Shop ‘n Go, etc…)
Turnover
We take into account the total turnover generated during the course of the past year.
For stores that only opened during the course of the year, sales are extrapolated for a full year. For stores that closed during the course of the year, Nielsen assumes that no sales at all were made in that year.
For hypermarkets, only the turnover for the food, paper products, care products and cleaning products departments is taken into account.

11 Nielsen Grocery Universe 2016 │ Copyright ©2016 The Nielsen Company. Confidential and proprietary.
DEVELOPMENTS IN 2015
• Domestic consumption increased slightly (+ 1.6%) while the importance of the Grocery Universe increased by+0.1 pt. Households have spent relatively more in the Grocery Universe compared to their total expenditure.
• The turnover of the Grocery Universe rose to EUR 25.5 billion in 2015. This means a +2.4% increase compared to the year before. In 2015, the inflation rate was 0.6%, which is higher than in 2014. This means that the turnover in constant has grown by 1.9%.
• There were 7 161 stores in the universe in 2015. This is 42 stores less than 2014. Between 2005 and 2015, the number of points of sale fell on average by 116 stores per year. Between 1995 and 2015, on the other hand, an average of 290 stores closed per year.
• The share of F1 declined slightly by -0.4pt to 49.9% with the closing of 4 stores, bringing their total to 605 stores in 2015.
• F2 has increased its market share up to 29.6% which represents an increase of +0.8pt versus 2014. F2 opened 24 new shops (1344 in total)
• Hard Discount lost -0.4pt to a 15.7% market share in Belgium. Its number of shops has decreased as well to 735 shops (-2 stores versus 2014).
• The market share of F3 keeps on declining. In 2015 they lost -0.1 points to 4.7%. The number of stores also decreased to 4 477 stores (-60 stores vs 2014).

3.1 TURNOVER AND INFLATION

Nie
lsen
Gro
cery
Un
iver
se 2
016
│ C
op
yrig
ht ©
2016
Th
e N
iels
en C
om
pan
y. C
on
fid
enti
al a
nd
pro
pri
etar
y.
13
12 12.5 13 13.1 13.5 14 14.3 14.8 15.3 15.6 1616.7
17.418.2
18.9 19.520.3 20.9
21.722.4 22.8 23.2
23.924.5 25 25.6
12 12.1 12.3 12.1 12.2 12.5 12.5 12.7 13.0 13.2 13.1 13.4 13.7 14.2 14.3 14.4 14.7 14.9 14.8 15.3 15.2 15.0 15.0 15.2 15.5 15.8
'90 '91 '92 '93 '94 '95 '96 '97 '98 '99 '00 '01 '02 '03 '04 '05 '06 '07 '08 '09 '10 '11 '12 13 14 15
Current Prices Constant Prices (1981 = 100)
Current Prices: Prices including inflation Constant Prices: Prices excluding inflation
Turnover of the Grocery Universe increased by +2.4% to 25.6 billion euro in 2015. When eliminating the effect of the inflation, evolution turnover at constant price remains positive.
TURNOVER GROCERY UNIVERSE IN BILLIONS OF EURO

Nie
lsen
Gro
cery
Un
iver
se 2
016
│ C
op
yrig
ht ©
2016
Th
e N
iels
en C
om
pan
y. C
on
fid
enti
al a
nd
pro
pri
etar
y.
14
8.2%
7.7%
6.3%
4.9%
1.3%
1.6%
1.2%
3.1%
3.5%3.2%
2.4%2.7%
2.0%1.5%
2.1%1.6%
1.0%
1.1%
2.6%2.5%
1.6%
1.6%
2.1%
2.8%
1.8% 1.8%
4.5%
0.0%
2.2%
3.5%
2.9%
1.1%
0.3%0.6%
'82 '83 '84 '85 '86 '87 '88 '89 '90 '91 '92 '93 '94 '95 '96 '97 '98 '99 '00 '01 '02 '03 '04 '05 '06 '07 '08 '09 '10 '11 '12 13 14 15
The inflation rate has globally decreased over the past years and reached 0.6% in 2015.
INFLATION PER YEAR
Source: Federal Public Service for the Economy, SME’s, Self-employed and Energy

Nie
lsen
Gro
cery
Un
iver
se 2
016
│ C
op
yrig
ht ©
2016
Th
e N
iels
en C
om
pan
y. C
on
fid
enti
al a
nd
pro
pri
etar
y.
15
1.9
1.10.6
1.0
0.3 0.3 0.4
-0.7-1.1 -1.2
-0.9 -0.7
-0.2
0.2 0.3
1.9 1.61.8
1.31.0 0.9
1.8 1.9 1.7
-0.5-0.3 -0.2
-1.4-1.2 -1.1 -1.2
-1.4 -1.5-1.3
-1.5
-2.0
-3.1-2.8
-2.2-2.6
-2.1-1.9
-2.1 -2.0-1.5 -1.6
-1.4-1.7
2.8 2.4 2.3
3.0
2.0 2.1
2.8 2.5 2.5 2.7
2.3
2.6 3.0
3.6 3.2
3.7 3.9
4.3
4.9 5.1
4.7
5.4
5.4
5.5
2.0 2.2 2.2 2.0
2.0 2.1 2.2 2.2 2.3 2.5
2.6
2.6 2.8 2.9 2.9 3.0 2.9 3.1
3.7
3.1 3.1 3.2
3.4
3.4
Jan
-14
Feb-
14
Mar
-14
Ap
r-14
May
-14
Jun
-14
Jul-
14
Au
g-1
4
Sep-
14
Oct
-14
No
v-1
4
Dec
-14
Jan
-15
Feb-
15
Mar
-15
Ap
r-15
May
-15
Jun
-15
Jul-
15
Au
g-1
5
Sep-
15
Oct
-15
No
v-1
5
Dec
-15
Food
Non Food
Services
Rent
Highest inflation rate is noticed in Services in 2015. Food inflation recovered over 2015.On the other hand, Non-Food inflation has been decreasing and negative.
INFLATION PER TYPE OF PRODUCT/SERVICE
Source: Federal Public Service for the Economy, SME’s, Self-employed and Energy

Nie
lsen
Gro
cery
Un
iver
se 2
016
│ C
op
yrig
ht ©
2016
Th
e N
iels
en C
om
pan
y. C
on
fid
enti
al a
nd
pro
pri
etar
y.
16
Even without the effect of the inflation, turnover at constant prices has increased by 1.9%.
EVOLUTION TURNOVER GROCERY UNIVERSE VERSUS YEAR BEFORE
Current Prices: Prices including inflation Fixed Prices: Prices excluding inflation
'96 '97 '98 '99 '00 '01 '02 '03 '04 '05 '06 '07 '08 '09 '10 '11 '12 '13 '14 '15
2.3
3.23.8
2.1 2.0
4.8
4.0
4.9
3.4 3.34.0
3.0
3.83.2
1.8 2.12.7 2.7
2.02.4
0.2
1.6
2.8
1.0
-0.6
2.3 2.4
3.3
1.3
0.5
2.2
1.2
-0.7
3.2
-0.4
-1.4
-0.1
1.6 1.7 1.9
Current Prices
Fixed Prices

Nie
lsen
Gro
cery
Un
iver
se 2
016
│ C
op
yrig
ht ©
2016
Th
e N
iels
en C
om
pan
y. C
on
fid
enti
al a
nd
pro
pri
etar
y.
17
Over the past 3 years, the grocery universe has slightly become more important in our total expenditure.
FOOD UNIVERSE MARKET SHARES IN TOTAL PRIVATE CONSUMPTION
Source: National Bank of Belgium - Nielsen Food Universe
48.3
88.6
141.3 144.6150.5
156.2163.6
171.1
180.2 179.8188.1
195.1200.9 204.0 207.3 210.7
14.7
13.5
12.3
12.612.5 12.5
12.4
12.2
12.0
12.4
12.111.9 11.9
12.0 12.112.2
11
12
13
14
15
0
50
100
150
200
80 90 '02 '03 '04 '05 '06 '07 '08 '09 '10 '11 '12 '13 '14 15
Private Consumption (in milj. EUR) MS Food Universe in Private Consumption (%)

3.2 NUMBER OF STORES

19
F1 : LARGE DISTRIBUTION, HYPERMARKET (Limited Panel)
• CARREFOUR GROUP BELGIUM : Carrefour Hyper, Carrefour Market, Mestdagh Group • COLRUYT GROUP : Colruyt • DELHAIZE GROUP : Delhaize Supermarket • LOUIS DELHAIZE GROUP : Match, Cora*
F2 : AVERAGE SIZE DISTRIBUTION, SUPERMARKET
• CARREFOUR GROUP BELGIUM: Carrefour Market (Franchise) • COLRUYT GROUP : Spar Retail (Retail Partners Colruyt Group), Okay • DELHAIZE GROUP : AD Delhaize, Proxy Delhaize, Red Market • INTERMARCHE GROUP : Intermarché • LOUIS DELHAIZE GROUP : Smatch
• Other Supermarkets from 400m²
F3 : SMALL DISTRIBUTION
All self service shops with a selling surface of less than 400m² (e.g. Spar (Retail Partners Colruyt
Group), Carrefour Express, Supra et Spar (Lambrechts), Louis Delhaize (Louis Delhaize Group)
not included above), and all shops with a “traditional service” (e.g. night-shops”).
HD : HARD DISCOUNTERS Aldi & Lidl
Definition Shop Types
BELGIUM | RETAIL UNIVERSE
Open Market
=
F1 + F2 + F3
© N
iels
en F
ood U
niv
ers
e 2
015
* CORA is included in F1 in the Food Universe and in F0 in scanning !

Nie
lsen
Gro
cery
Un
iver
se 2
016
│ C
op
yrig
ht ©
2016
Th
e N
iels
en C
om
pan
y. C
on
fid
enti
al a
nd
pro
pri
etar
y.
20
'90 '95 '00 '01 '02 '03 '04 '05 '06 '07 '08 '09 '10 '11 '12 13 14 15
13.813.0
9.9 9.2 8.8 8.6 8.5 8.3 8.1 8.0 7.9 7.8 7.7 7.6 7.4 7.3 7.2 7.2
There are 7 161 grocery stores in Belgium (-42 stores). The number has (steadily) decreased over the last decades because of a more intense and centralized organisation of the universe.
NUMBER OF STORES IN THE GROCERY UNIVERSE
Evolution vs previous year (%): -2% -1% -2% -2% -1% -1% -1% -2% -1% -3% -1% -1%

Nie
lsen
Gro
cery
Un
iver
se 2
016
│ C
op
yrig
ht ©
2016
Th
e N
iels
en C
om
pan
y. C
on
fid
enti
al a
nd
pro
pri
etar
y.
21
487 497 507 511 519 517 515 523 534555
571 583598
582 592 586 590 592 597 609 605
'95 '96 '97 '98 '99 '00 '01 '02 '03 '04 '05 '06 '07 '08 '09 '10 '11 '12 '13 '14 '15
The large scaled distribution consists of 605 stores and, after having opened more and more shops over the past few years, has closed 4 stores in 2015.
NUMBER OF F1 STORES: LARGE SCALE DISTRIBUTION

Nie
lsen
Gro
cery
Un
iver
se 2
016
│ C
op
yrig
ht ©
2016
Th
e N
iels
en C
om
pan
y. C
on
fid
enti
al a
nd
pro
pri
etar
y.
22
157015391500
14301385
1305127312491169116611741196117912061228123912501277
131213201344
'95 '96 '97 '98 '99 '00 '01 '02 '03 '04 '05 '06 '07 '08 '09 '10 '11 '12 '13 '14 '15
After the closing of less profitable shops from 1996 to 2004, the number of F2 stores (mostly franchised) has increased over the past years bringing the total to 1 344 stores in 2015 (+24).
NUMBER OF F2 STORES: MEDIUM-SIZED DISTRIBUTION

Nie
lsen
Gro
cery
Un
iver
se 2
016
│ C
op
yrig
ht ©
2016
Th
e N
iels
en C
om
pan
y. C
on
fid
enti
al a
nd
pro
pri
etar
y.
23
310333
378401
429450
510536
588607
662693
711 719734 735 741 735 739 737 735
'95 '96 '97 '98 '99 '00 '01 '02 '03 '04 '05 '06 '07 '08 '09 '10 '11 '12 '13 '14 '15
The number of Hard Discount stores has increased sharply over the beginning of years 2000. Since 2010, the growth rate has slowed down and slightly declined over 2015. Today Hard Discounters have 735 stores in Belgium. They have lost 2 shops compared to 2014.
NUMBER OF HARD DISCOUNT STORES

Nie
lsen
Gro
cery
Un
iver
se 2
016
│ C
op
yrig
ht ©
2016
Th
e N
iels
en C
om
pan
y. C
on
fid
enti
al a
nd
pro
pri
etar
y.
24
1058510325
9859
9178
8343
7619
6894646263386206
59195667552954145266510049884781464145374477
'95 '96 '97 '98 '99 '00 '01 '02 '03 '04 '05 '06 '07 '08 '09 '10 '11 '12 '13 '14 '15
The small retailers are the first reason to explain the declining number of grocery stores in Belgium. F3 stores tend to close down because they are less profitable. They amounted to 4 477 stores in 2015. Reasons for the decline in F3 : increasing competition from organized supermarkets, inadequate sales and profit, no funds to invest.
NUMBER OF F3 STORES

Nie
lsen
Gro
cery
Un
iver
se 2
016
│ C
op
yrig
ht ©
2016
Th
e N
iels
en C
om
pan
y. C
on
fid
enti
al a
nd
pro
pri
etar
y.
25
8193 7833 73266633
5841 5252 4715 4375 4205 4129 3972 3780 3590 3479 3342 3217 3168 3148 3117 3054 3009
23922492
25332545
25022367
21792087 2133 2077 1947 1887 1939 1935 1924 1883 1820 1633 1524 1483 1468
'95 '96 '97 '98 '99 '00 '01 '02 '03 '04 '05 '06 '07 '08 '09 '10 '11 '12 '13 14 15
Superettes
Traditional Service
In 2015 more traditional stores (-40) than superettes (-15) closed down. The increasing competition of supermarkets, inadequate sales and profit and the lack of funds to invest explain the F3 decline.
NUMBER OF F3 STORES: SUPERETTES AND TRADITIONAL STORES

3.3 MARKET SHARE BY SHOP TYPE

Nie
lsen
Gro
cery
Un
iver
se 2
016
│ C
op
yrig
ht ©
2016
Th
e N
iels
en C
om
pan
y. C
on
fid
enti
al a
nd
pro
pri
etar
y.
27
'85 '90 '95 '00 '01 '02 '03 '04 '05 '06 '07 '08 '09 '10 '11 '12 '13 '14 '15
18.9 14.2 11.4 8.7 7.9 7.3 7.0 6.6 6.3 5.9 6.1 6.2 6 5.9 5.7 5.3 5 4.8 4.7
5.57.6 9.8 11.2 12.4 12.4 12.8 12.9 14.1 14.0 14.6 15.2 15.1 14.8 15 15.3 15.5 16.1 15.7
29.7 31.4 29.7 27.9 27.6 27.6 26.9 26.5 26.1 26.7 26.0 26.4 26.6 27.5 27.4 27.8 28 28.8 29.6
45.9 46.8 49.1 52.2 52.0 52.8 53.3 54.0 53.5 53.4 53.3 52.2 52.3 51.8 51.9 51.6 51.5 50.3 49.9
F3 HD F2 F1
Even if they only own 605 stores (8.4% of the number of stores in the Grocery Universe) F1 has a 49.9% market share and remained relatively steady compared to 2014. F3 and HD have lost MS to the benefit of F2 that has increased over the last decade.
MARKET SHARES BY SHOP TYPE

Nie
lsen
Gro
cery
Un
iver
se 2
016
│ C
op
yrig
ht ©
2016
Th
e N
iels
en C
om
pan
y. C
on
fid
enti
al a
nd
pro
pri
etar
y.
28
The market share per store indicates the importance of one average store. So the effect of openings is neutralised and it is possible to examine whether a given store remains equally important over time.
The F1 market share per 100 stores has been declining over the past 4 years, especially over 2014. The MS per 100 stores loss in 2015 is less important than it was in 2014.
F1: MARKET SHARES PER 100 STORES
'94 '95 '96 '97 '98 '99 '00 '01 '02 '03 '04 '05 '06 '07 '08 '09 '10 '11 '12 '13 '14 '15
10.1 10.1 10 9.9 10 9.9 10.1 10.1 10.1 10 9.7 9.4 9.2 8.9 9 8.8 8.8 8.8 8.7 8.6 8.3 8.2

Nie
lsen
Gro
cery
Un
iver
se 2
016
│ C
op
yrig
ht ©
2016
Th
e N
iels
en C
om
pan
y. C
on
fid
enti
al a
nd
pro
pri
etar
y.
29
The market share per store indicates the importance of one average store. So the effect of openings is neutralised and it is possible to examine whether a given store remains equally important over time.
Despite a MS loss in 2013, the F2 MS for 100 stores has remained steady over the past 10 years.
F2: MARKET SHARES PER 100 STORES
'94 '95 '96 '97 '98 '99 '00 '01 '02 '03 '04 '05 '06 '07 '08 '09 '10 '11 '12 '13 '14 '15
1.9 1.9 1.9 1.9 2.0 2.0 2.1 2.2 2.2 2.3 2.3 2.2 2.2 2.2 2.2 2.2 2.2 2.2 2.2 2.1 2.2 2.2

Nie
lsen
Gro
cery
Un
iver
se 2
016
│ C
op
yrig
ht ©
2016
Th
e N
iels
en C
om
pan
y. C
on
fid
enti
al a
nd
pro
pri
etar
y.
30
The market share per store indicates the importance of one average store. So the effect of openings is neutralised and it is possible to examine whether a given store remains equally important over time.
The Hard Discount MS per 100 stores declined until 2006 but has remained rather steady since then.
MARKET SHARES PER 100 HARD DISCOUNTERS
'94 '95 '96 '97 '98 '99 '00 '01 '02 '03 '04 '05 '06 '07 '08 '09 '10 '11 '12 '13 '14 '15
3.3 3.2 3.1 2.8 2.7 2.5 2.5 2.4 2.3 2.2 2.1 2.1 2.0 2.1 2.1 2.1 2.0 2.0 2.1 2.1 2.2 2.1

Nie
lsen
Gro
cery
Un
iver
se 2
016
│ C
op
yrig
ht ©
2016
Th
e N
iels
en C
om
pan
y. C
on
fid
enti
al a
nd
pro
pri
etar
y.
31
The market share per store indicates the importance of one average store. So the effect of openings is neutralised and it is possible to examine whether a given store remains equally important over time.
The F3 market share per 100 stores remains low but stable over time.
MARKET SHARES PER 100 F3 STORES
'95 '96 '97 '98 '99 '00 '01 '02 '03 '04 '05 '06 '07 '08 '09 '10 '11 '12 '13 '14 '15
0.1 0.1 0.1 0.1 0.1 0.1 0.1 0.1 0.1 0.1 0.1 0.1 0.1 0.1 0.1 0.1 0.1 0.1 0.1 0.1 0.1

Nie
lsen
Gro
cery
Un
iver
se 2
016
│ C
op
yrig
ht ©
2016
Th
e N
iels
en C
om
pan
y. C
on
fid
enti
al a
nd
pro
pri
etar
y.
32
In average a F1 shop generates four times the turnover generated by a F2 shop or by Hard Discount. F3 shops have an average turnover of 270 000 EUR only. They often have to close down because of loss-making. Only stores that offer specific advantages (Sunday openings, etc.) are able to create added value and keep up with the competition.
TURNOVER PER STORE IN 1000 EUR
Average Store
F1 F2 HD F3
2005 2 340 18 249 4 340 4 148 207
2006 2 489 18 572 4 519 4 098 210
2007 2 604 18 638 4 594 4 299 229
2008 2 736 19 440 4 744 4 576 249
2009 2 860 19 775 4 845 4 585 255
2010 2 971 20 122 5 045 4 595 263
2011 3 069 20 442 5 086 4 698 267
2012 3 232 20 820 5 194 4 973 263
2013 3 365 21 139 5 242 5 139 266
2014 3 474 20 659 5 459 5 458 267
2015 3 579 21 137 5 654 5 489 270

3.4 SALES SURFACE

Nie
lsen
Gro
cery
Un
iver
se 2
016
│ C
op
yrig
ht ©
2016
Th
e N
iels
en C
om
pan
y. C
on
fid
enti
al a
nd
pro
pri
etar
y.
34
The total sales surface in the grocery universe reaches 3.56 million m². F1 and F2 store types have the largest total sales surface. However, the sale surface per store is bigger for the F1 shops than for F2.
SALES SURFACE IN 2015
Sales surface area (m²)
Number of stores Average sales surface
(m²) per store
F1 Stores 1 221 705 605 2 019
F2 Stores 1 150 381 1 344 860
Hard Discount 441 000 735 600
F3 Stores 752 948 4 477 168
Total 3 556 034 7 161

Nie
lsen
Gro
cery
Un
iver
se 2
016
│ C
op
yrig
ht ©
2016
Th
e N
iels
en C
om
pan
y. C
on
fid
enti
al a
nd
pro
pri
etar
y.
35
The F1 share sales surface is significantly smaller than the share of total turnover. F2 and Hard Discounters have a comparable share of total sales surface and total turnover. On the contrary, F3 has a far bigger share in selling surface than in turnover.
F1 owns the biggest turnover per m², closely followed by Hard Discounters.
SALES SURFACE IN 2015
Share of sales surface area (%)
Share of total turnover (%)
Turnover per m² (in euro)
F1 Stores 34% 50% 10 467
F2 Stores 32% 29% 6 605
Hard Discount 12% 16% 9 148
F3 21% 5% 1 604

3.5 DISCOUNTERS IN BELGIUM

Nie
lsen
Gro
cery
Un
iver
se 2
016
│ C
op
yrig
ht ©
2016
Th
e N
iels
en C
om
pan
y. C
on
fid
enti
al a
nd
pro
pri
etar
y.
37
TYPES OF DISCOUNTERS IN BELGIUM
DISCOUNTERS
Chains: • Colruyt • Profi/Smatch • Intermarché • Aldi • Lidl Features: – Low prices – Low prices communication

Nie
lsen
Gro
cery
Un
iver
se 2
016
│ C
op
yrig
ht ©
2016
Th
e N
iels
en C
om
pan
y. C
on
fid
enti
al a
nd
pro
pri
etar
y.
38
'02 '03 '04 '05 '06 '07 '08 '09 '10 '11 '12 '13 '14 '15
891 881 911981
10201051 1064 1086 1101 1117 1114 1132 1138 1130
Number of Discount Stores
Market Share Discount Stores
'02 '03 '04 '05 '06 '07 '08 '09 '10 '11 '12 '13 '14 '15
30.5% 31.2% 32.4% 34.4% 35.2% 36.6% 38.4% 39.3% 40.2% 41.0% 41.7% 42.6% 43.2% 43.1%
The Discount performance increased over the past years but has remained rather stable over 2015 . The number of shops went down to 1 130 shops. Their market share remained rather stable in 2015 (43.1%).
DISCOUNT STORES

3.6 REGIONAL CHARACTERISTICS

40
NIELSEN AREA’S
I North West: Provinces of East & West Flanders
II North East: Provinces of Antwerp, Limburg & Flemish Brabant
III Brussels Conurbation:
IV South West: Provinces of Hainaut & Walloon-Brabant
V South East: Provinces of Namur, Liège & Luxembourg
St-Joost-ten-Node St-Lambrechts-Woluwe St-Pieters-Woluwe Tervuren Ukkel Vilvoorde Vorst Watermaal-Bosvoorde Wemmel Wezembeek-Oppem Zaventem
Kraainem Laken Linkebeek Machelen Neder Over Heembeek Oudergem Schaarbeek St-Agatha-Berchem St-Genesius-Rode St-Gillis St-Jans-Molenbeek
Anderlecht Brussel Drogenbos Elsene Etterbeek Evere Ganshoren Grimbergen Haren Jette Koekelberg
I II III
IV V

Nie
lsen
Gro
cery
Un
iver
se 2
016
│ C
op
yrig
ht ©
2016
Th
e N
iels
en C
om
pan
y. C
on
fid
enti
al a
nd
pro
pri
etar
y.
41
Current Prices: Prices including inflation Fixed Prices: Prices excluding inflation
The turnover is growing in all the regions ; the growth rate is the lowest in the South West part of the country.
EVOLUTION TURNOVER FOOD UNIVERSE PER AREA IN 2015 VS 2014
2.4%3.0%
2.6%
1.3%
2.6%
1.8%2.4%
2.1%
0.8%
2.0%
area 1 area 2 area 3 area 4 area 5
Current prices Fixed prices

Nie
lsen
Gro
cery
Un
iver
se 2
016
│ C
op
yrig
ht ©
2016
Th
e N
iels
en C
om
pan
y. C
on
fid
enti
al a
nd
pro
pri
etar
y.
42
The South of the country (area 4 and 5) is the only place where the share of turnover is higher than the share of the population. In the South, consumers shop mainly in stores included in the grocery universe. In the North, there are far more independent and specialist businesses (fishmongers, bakeries, etc.) and consumers shop more often in stores outside of Nielsen grocery universe.
EVOLUTION IN TURNOVER, NUMBER OF STORES AND POPULATION IN 2015
Turnover (mio €)
% Number of stores % Population in 000 %
Total Belgium 25 629 100.0% 7 161 100.0% 11 209 100.0%
Area 1 5 987 23.4% 1 990 27.8% 2 657 23.7%
Area 2 7 769 30.3% 2 160 30.2% 3 564 31.8%
Area 3 2 875 11.2% 736 10.3% 1 390 12.4%
Area 4 4 447 17.4% 1 172 16.4% 1 737 15.5%
Area 5 4 550 17.8% 1 103 15.4% 1 861 16.6%

Nie
lsen
Gro
cery
Un
iver
se 2
016
│ C
op
yrig
ht ©
2016
Th
e N
iels
en C
om
pan
y. C
on
fid
enti
al a
nd
pro
pri
etar
y.
43
The North of the country has more stores than the South. Areas 1 & 2 have the most F2, F3 and HD shops. The biggest shop type (F1) is mainly located in the North-East and South-West of the country (areas 2 and 4). 1/3 of the HD shops are located in area 2. There is an increase in the number of stores in area 5.
NUMBER OF STORES AND EVOLUTION PER AREA
Total Belgium Area 1 Area 2 Area 3 Area 4 Area 5
Total universe
7 161 1 990 2 160 736 1 172 1 103
-42 -28 -17 -5 -4 11
F1
605 104 150 79 152 120
-4 -3 -3 0 0 2
F2
1 344 415 434 75 162 258
24 2 13 0 2 7
HD
735 187 250 46 117 135
-2 1 0 1 -4 0
F3
4 477 1 284 1 326 536 741 590
-60 -28 -27 -6 -2 2
Nie
lsen
Gro
cery
Un
iver
se 2
016
│ C
op
yrig
ht ©
2016
Th
e N
iels
en C
om
pan
y. C
on
fid
enti
al a
nd
pro
pri
etar
y.
44
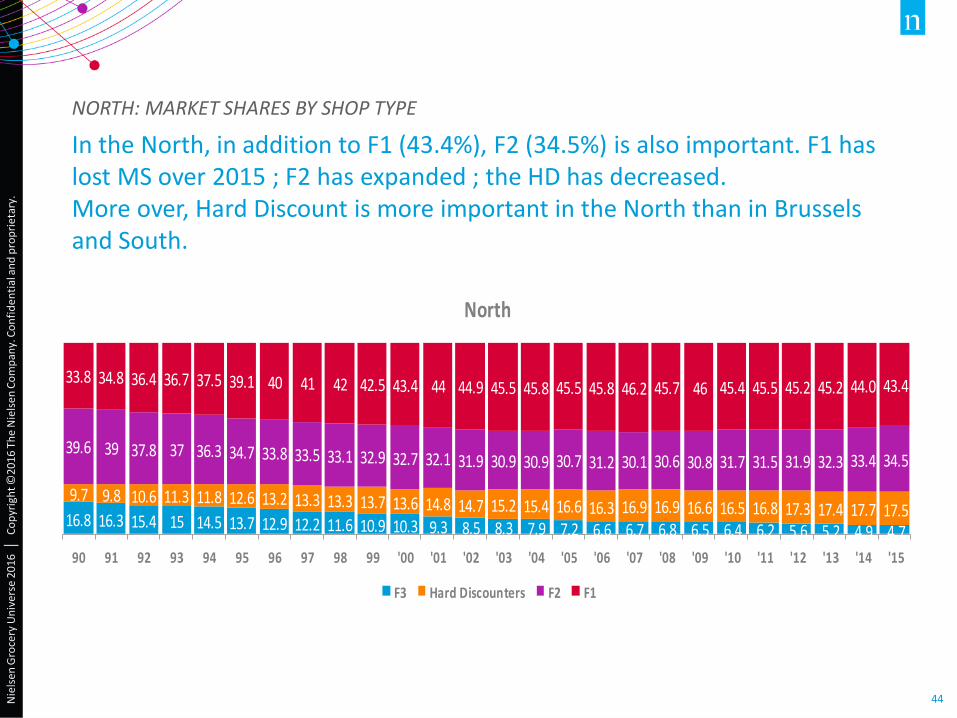
In the North, in addition to F1 (43.4%), F2 (34.5%) is also important. F1 has lost MS over 2015 ; F2 has expanded ; the HD has decreased. More over, Hard Discount is more important in the North than in Brussels and South.
NORTH: MARKET SHARES BY SHOP TYPE
16.8 16.3 15.4 15 14.5 13.7 12.9 12.2 11.6 10.9 10.3 9.3 8.5 8.3 7.9 7.2 6.6 6.7 6.8 6.5 6.4 6.2 5.6 5.2 4.9 4.7
9.7 9.8 10.6 11.3 11.8 12.6 13.2 13.3 13.3 13.7 13.6 14.8 14.7 15.2 15.4 16.6 16.3 16.9 16.9 16.6 16.5 16.8 17.3 17.4 17.7 17.5
39.6 39 37.8 37 36.3 34.7 33.8 33.5 33.1 32.9 32.7 32.1 31.9 30.9 30.9 30.7 31.2 30.1 30.6 30.8 31.7 31.5 31.9 32.3 33.4 34.5
33.8 34.8 36.4 36.7 37.5 39.1 40 41 42 42.5 43.4 44 44.9 45.5 45.8 45.5 45.8 46.2 45.7 46 45.4 45.5 45.2 45.2 44.0 43.4
90 91 92 93 94 95 96 97 98 99 '00 '01 '02 '03 '04 '05 '06 '07 '08 '09 '10 '11 '12 '13 '14 '15
North
F3 Hard Discounters F2 F1

Nie
lsen
Gro
cery
Un
iver
se 2
016
│ C
op
yrig
ht ©
2016
Th
e N
iels
en C
om
pan
y. C
on
fid
enti
al a
nd
pro
pri
etar
y.
45
Although the share has been decreasing over the past 3 years, Brussels remains broadly dominated by F1 (67.3%). HD weight is the smallest, closely followed by F3 shops. The HD share has increased lately in Brussels.
BRUSSELS: MARKET SHARES BY SHOP TYPE
14.8 14.1 13.7 12.5 12.3 11.9 11.3 10.5 10.1 9.8 8.9 8.3 7.5 7.3 6.7 6.9 7.0 8.0 8.3 7.8 7.9 8.1 8.1 8.5 8.6 8.6
3.6 3.4 4.0 3.6 3.6 4.0 3.9 5.0 5.0 5.0 5.3 6.1 6.7 7.0 7.4 8.1 8.0 7.8 7.6 8.0 8.0 7.1 6.9 7.3 7.8 8.2
12.1 11.5 11.4 12.3 12.4 11.9 11.6 11.1 9.7 10.2 10.6 10.9 11.0 12.0 12.4 12.3 12.9 12.7 12.9 13.4 14.1 14.5 15.3 15.2 15.3 15.9
69.5 70.9 70.8 71.5 71.7 72.2 73.2 73.4 75.1 75.0 75.2 74.7 74.7 73.8 73.5 72.6 72.1 71.5 71.2 70.8 70.0 70.3 69.7 69.0 68.3 67.3
'90 '91 '92 '93 '94 '95 '96 '97 '98 '99 '00 '01 '02 '03 '04 '05 '06 '07 '08 '09 '10 '11 '12 '13 '14 '15
Brussels
F3 Hard Discounters F2 F1

Nie
lsen
Gro
cery
Un
iver
se 2
016
│ C
op
yrig
ht ©
2016
Th
e N
iels
en C
om
pan
y. C
on
fid
enti
al a
nd
pro
pri
etar
y.
46
In the South F1 shops (54.3%) are more important than in the North and have gained MS. F2 has gained MS as well. Hard Discount (15.5%) and F3 (3.5%) have lost MS.
SOUTH: MARKET SHARES BY SHOP TYPE
10.3 9.6 8.9 8.9 8.6 8.1 7.7 7.4 7.2 7.0 6.5 5.9 5.5 5.1 4.8 4.7 4.4 4.5 4.8 4.6 4.5 4.4 3.9 3.7 3.6 3.5
6.2 6.5 6.7 7.5 7.8 8.1 8.3 9.2 9.1 9.0 9.7 11.3 11.1 11.4 11.2 12.6 12.7 13.6 15.1 15.0 14.7 14.8 15.0 15.3 16.2 15.5
27.6 28.2 28.4 28.1 28.6 29.3 29.1 28.1 28.2 27.8 27.3 27.3 27.1 26.4 25.2 24.3 24.7 24.3 24.7 24.8 25.6 25.4 25.6 25.8 26.1 26.7
55.9 55.8 55.9 55.5 55.1 54.6 54.8 55.3 55.5 56.2 56.5 55.6 56.4 57.1 58.8 58.3 58.3 57.6 55.4 55.6 55.3 55.4 55.5 55.3 54.1 54.3
90 91 92 93 94 95 96 97 98 99 '00 '01 '02 '03 '04 '05 '06 '07 '08 '09 '10 '11 '12 '13 '14 '15
South
F3 Hard Discounters F2 F1

Nie
lsen
Gro
cery
Un
iver
se 2
016
│ C
op
yrig
ht ©
2016
Th
e N
iels
en C
om
pan
y. C
on
fid
enti
al a
nd
pro
pri
etar
y.
47
F1 HD F2 F3
North 23 496 5 503 5 584 246
Brussels 24 492 5 096 6 103 462
South 17 959 5 538 5 715 238
In Brussels, F1, F2 and F3 have the highest turnover per store. The results of F3 can be explained by superettes that are highly successful thanks to their early and late opening hours, Sunday openings and ready-to-eat meals. HD has the highest turnover per store in the South.
AVERAGE TURNOVER PER STORE (IN 1000 EUR)

3.7 PRIVATE LABELS

Nie
lsen
Gro
cery
Un
iver
se 2
016
│ C
op
yrig
ht ©
2016
Th
e N
iels
en C
om
pan
y. C
on
fid
enti
al a
nd
pro
pri
etar
y.
49
13.314.314.7
15.816.216.817.8
19.220.3
21.9
24.325.5
26.827.927.728.2
29.229.129.229.730.429.830.131.231.231.7
33.033.734.435.335.5
'85 '86 '87 '88 '89 '90 '91 '92 '93 '94 '95 '96 '97 '98 '99 '00 '01 '02 '03 '04 '05 '06 '07 '08 '09 '10 '11 '12 '13 '14 '15
Definition private labels = Generic brands, exclusive brands (sold at Aldi and Lidl), brands that bear the name of the store or the retailer
Private labels have seen their value share triple since 1985. Especially in the last three years PL is gaining share again. In 2015 more than 35% of the turnover in FMCG was realized by private label.
SHARE OF PRIVATE LABEL IN BELGIUM

Nie
lsen
Gro
cery
Un
iver
se 2
016
│ C
op
yrig
ht ©
2016
Th
e N
iels
en C
om
pan
y. C
on
fid
enti
al a
nd
pro
pri
etar
y.
50
Two-thirds of the turnover on fresh products comes from private labels. In bakery & toast and frozen products, private labels also have a high share. On the contrary on alcoholic beverages and confectionery, the share of private label is relatively low.
SHARE OF PRIVATE LABEL PER PRODUCT CATEGORY
FRESH
PRO
DU
CTS
BA
KERY & TO
AST
FRO
ZEN
PETS PRO
DU
CTS
SALTED
SNA
CKS
DA
IRY
SWEET SN
AC
KS
GRO
CERY
HO
T BEV
ERA
GES
HEA
LTH &
BEAU
TY
HO
USEKEEPIN
G
NO
N A
LCOH
OLIC BEV
ERAG
ES
CON
FECTION
ERY
ALCO
HO
LIC B
EVER
AG
ES
69.8
58.6 56.8
43.1 41.1 41.0 39.7 37.7 35.9
27.7 27.6 25.221.9
9.7

51 Nielsen Grocery Universe 2016 │ Copyright ©2016 The Nielsen Company. Confidential and proprietary.
Frozen Frozen goods
(ice cream, frozen fish, meals, vegetables, …)
Grocery Sugar, pasta, rize, canned food, jam,
babyfood, cereals, … Housekeeping
Household products and cleaning products
Fresh Products
Fresh products (soup, fruit juices, prepacked
fine meat (charcuterie), fresh meals, ready to
use salads, …)
Alcoholic Beverages Wine, spirits, beers,
premix, port, … Health & Beauty
Hair care, body care, shaving, dental care,
face care, make-up, …
Dairy Dairy products (butter,
margarine, cheese, milk, yoghurt, desserts, …)
Non Alcoholic Beverages
Waters, juices, lemonades, ice tea,
energy drinks, … Pet Food Dog and Cat food
Bakery & Toast Prepacked bakery,
bread & toast Hot Beverages
Coffee, tea, hot chocolate, …
Confectionery Chocolates and Sweets
Salted Snacks Salted Snacks ( biscuits,
crisps) Sweet Snacks
Sweet biscuits, waffles, cakes,
industrial pastry, ,…
DEFINITIONS PRODUCT CATEGORIES

4. RETAILING IN EUROPE

4.1 INTERNATIONAL SHOP TYPES

54 Nielsen Grocery Universe 2016 │ Copyright ©2016 The Nielsen Company. Confidential and proprietary.
AUS = Austria FRA = France NOR = Norway SWI= Switzerland
BEL = Belgium GER = Germany POL = Poland UK = Great Britain
DEN = Denmark GRE = Greece POR = Portugal CZE = Czech Republic
EIR = Ireland ITA = Italy SPA = Spain HUN = Hungary
FIN = Finland NED = Netherlands SWE = Sweden SLK = Slovakia
DEFINITIONS
• Hypermarkets selling surface over 2500m²
• Large Supermarkets selling surface 1000m² - 2500m²
• Small Supermarkets selling surface 400m² - 1000m²
• Superettes & Traditional selling surface under 400m²
COUNTRIES
SHOP TYPES

Nie
lsen
Gro
cery
Un
iver
se 2
016
│ C
op
yrig
ht ©
2016
Th
e N
iels
en C
om
pan
y. C
on
fid
enti
al a
nd
pro
pri
etar
y.
55
In 2015 the value index keeps on increasing, like the years before. After having remained stable for a few years, the volume registers a slight increase.
EUROPE: FMCG DEVELOPMENT INDEX (BASE 100 = 2006)

Nie
lsen
Gro
cery
Un
iver
se 2
016
│ C
op
yrig
ht ©
2016
Th
e N
iels
en C
om
pan
y. C
on
fid
enti
al a
nd
pro
pri
etar
y.
56
Contrary to 2013, the volume keeps growing over 2015. The price mix remained stable over the three first quarters of 2015.
FMCG TRENDS PER YEAR AND PER QUARTER IN EUROPE
2.6%1.8% 1.3%
2.3% 2.3% 2.2%1.7% 1.6% 1.7% 1.7% 1.7% 1.3%
-0.1%
0.7%1.1%
-0.6% -0.6%
1.6%
0.3%
1.5%1.9%
0.7% 1.3%0.8%
2.5% 2.6% 2.4%1.7% 1.7%
3.8%
2.0%
3.1%3.6%
2.4%3.0%
2.1%
-1%
0%
1%
2%
3%
4%
5%
6%
2013 2014 2015 Q4'13 Q1'14 Q2'14 Q3'14 Q4'14 Q1'15 Q2'15 Q3'15 Q4'15
Average price change Volume change Nominal growth
Source: Nielsen Growth Reporter

Nie
lsen
Gro
cery
Un
iver
se 2
016
│ C
op
yrig
ht ©
2016
Th
e N
iels
en C
om
pan
y. C
on
fid
enti
al a
nd
pro
pri
etar
y.
57
-2.2%-1.0%
-0.9% -0.2%0.1%
1.2% 1.2%-0.3%
0.5% 1.0%0.3% 0.4% 0.5%
1.3%-0.2% 0.9% 1.3%
2.0% 2.5% 2.5%
0.2%
-0.3%
0.1% -0.3%
0.7%0.0%
0.0%1.8% 1.0%
0.6% 1.7% 1.7% 1.7% 0.8% 2.7% 1.6%1.7%
1.7%1.4%
2.3%
-2.0%
-1.3%-0.8%
-0.5%
0.8%1.2% 1.2% 1.4% 1.5% 1.6%
2.0% 2.1% 2.3% 2.4% 2.4% 2.4%3.0%
3.7%3.9%
4.8%
Price change Volume growth Nominal Value Growth
Source: Nielsen Growth Reporter
Belgium increases equally in volume and prices.
FMCG TRENDS PER COUNTRY IN 2015 VS 2014

Nie
lsen
Gro
cery
Un
iver
se 2
016
│ C
op
yrig
ht ©
2016
Th
e N
iels
en C
om
pan
y. C
on
fid
enti
al a
nd
pro
pri
etar
y.
58
Retail landscape in Europe remained stable over the past years. Since 1980 the smallest Superettes and Traditional stores are declining especially in favour of the Hypermarkets and Large Supermarkets. The Small Supermarkets have managed to maintain their market share over time. The Hard Discounters (which belong to this segment) have accounted for this maintaining of the market share.
MARKET SHARES BY SHOP TYPE IN EUROPE
1980 1985 1990 1995 2000 2001 2002 2003 2004 2005 2006 2007 2008 2009 2010 2011 2012 2013 2014
48%39%
29%21% 16% 16% 15% 14% 13% 13% 12% 12% 11% 11% 11% 11% 11% 10% 9%
26%
26%
25%
26%26% 27% 27% 28% 28% 28% 28% 28% 28% 28% 28% 28% 28% 28% 29%
12%
16%
20%
21%23% 23% 22% 23% 23% 23% 23% 24% 24% 24% 25% 25% 25% 25% 26%
14%19%
26%32% 34% 35% 35% 35% 36% 36% 37% 37% 36% 36% 36% 36% 37% 37% 37%
Superettes & Traditional Small Supermarket Large Supermarket Hypermarket

Nie
lsen
Gro
cery
Un
iver
se 2
016
│ C
op
yrig
ht ©
2016
Th
e N
iels
en C
om
pan
y. C
on
fid
enti
al a
nd
pro
pri
etar
y.
59
2% 3% 5% 5% 7% 7% 8% 11% 11% 13% 17% 18% 20% 20% 20% 20% 21%
33% 37% 41%
52%43%
17%
36%22%
54%
67%
9%
53%
26% 20%28%
12%23% 25%
32% 30%
22%
28%
46%18%
50%
20%
51%
34%
24%
15%
20%
28%
34% 40% 24%
38%
32%35%
5%
35%17%
28%
4%
58%
8%
37%
15%10%
60%
8%
27% 23%30% 30%
25%20%
43%
14%
28%35%
13%
Ger Ned Fra Bel Swe Den Aus UK Nor Por Spa Ita Fin Swi Eir Cze Gre Hun Slva Pol
Superette & Traditional Small Supermarket Large Supermarket Hypermarket
France and the UK have been dominated by hypermarkets for years. Belgium and the Netherlands have the highest share in Large Supermarkets.
MARKET SHARES BY SHOP TYPES PER COUNTRY IN 2014

Nie
lsen
Gro
cery
Un
iver
se 2
016
│ C
op
yrig
ht ©
2016
Th
e N
iels
en C
om
pan
y. C
on
fid
enti
al a
nd
pro
pri
etar
y.
60
53
91
46
83
104
165
118
125
128
115
80
131
179
168
181
251
363
412
433
32
61
46
10
54
49
63
67
70
117
88
45
84
101
63
71
38
118
28
24
17
9
31
5
7
34
22
19
38
29
11
15
5
3
25
18
10
11
113
115
124
137
162
163
172
201
210
214
223
226
230
239
257
285
339
452
460
562
UK
Slk
Hun
Por
Cze
Gre
Pol
Fra
Swi
Eir
Swe
Fin
Spa
Ita
Bel
Ned
Ger
Den
Aus
Nor
SSM LSM HM
Norway, Denmark, Austria and Germany have the highest number of stores per million habitants and a very large number of small supermarkets. Belgium holds the 7th place in total number of stores per habitant
NUMBER OF STORES PER MILLION HABITANTS IN 2014

Nie
lsen
Gro
cery
Un
iver
se 2
016
│ C
op
yrig
ht ©
2016
Th
e N
iels
en C
om
pan
y. C
on
fid
enti
al a
nd
pro
pri
etar
y.
61
Wal-Mart remains the world’s biggest grocery retailer. The Kroger Co. moved up from the 6th place to the 2d place. Carrefour moved down from the 3d to the 5th place.
TOP GLOBAL FOOD RETAILERS 2014 (1)
The table constitutes a league table of the top international grocery retailers, based on the turnover they achieved in 2014.
Source: Deloitte “2016 Global Powers of Retailing”
Retailer Country of
Origin
Retail Turnover in US $ billion (2014)
Number of countries of operation
1 Wal-Mart Stores, Inc. U.S. 485.7 28
2 The Kroger Co. U.S. 108.5 1
3 Schwarz Unternehmens Truehand KG Germany 102.7 26
4 Tesco plc U.K. 99.7 13
5 Carrefour SA France 98.5 34
6 Aldi Einkauf GmbH & Co. oHG Germany 86.5 17
7 Metro AG Germany 85.6 32
8 Target Corp. U.S. 72.6 1
9 Groupe Auchan SA France 69.6 13
10 Casino Guichard-Perrachon S.A. France 64.5 29
Nie
lsen
Gro
cery
Un
iver
se 2
016
│ C
op
yrig
ht ©
2016
Th
e N
iels
en C
om
pan
y. C
on
fid
enti
al a
nd
pro
pri
etar
y.
62
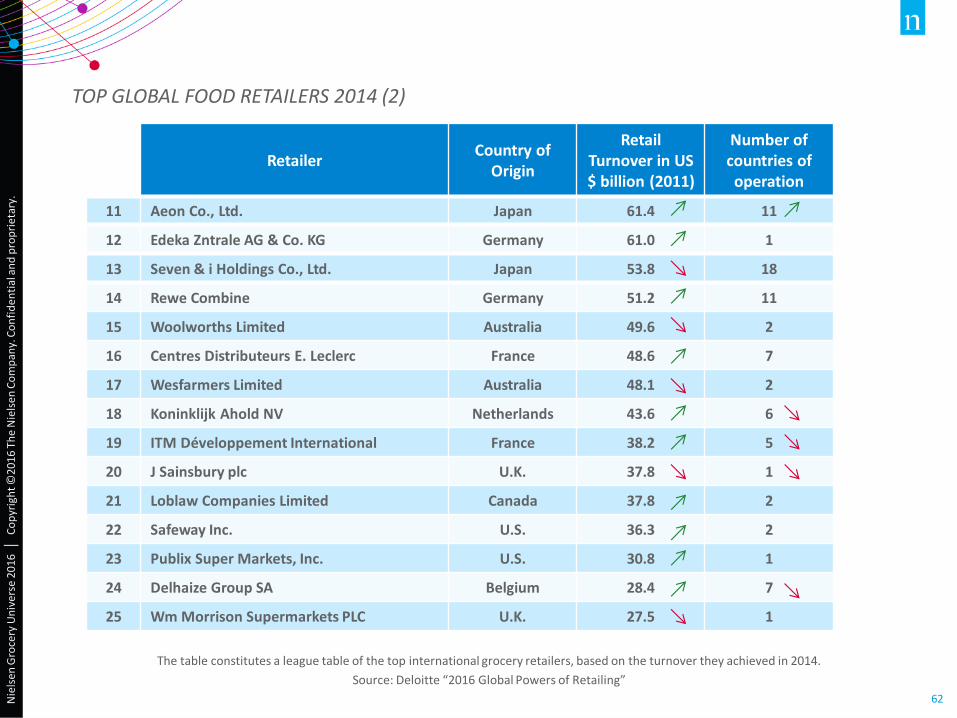
The table constitutes a league table of the top international grocery retailers, based on the turnover they achieved in 2014.
Source: Deloitte “2016 Global Powers of Retailing”
TOP GLOBAL FOOD RETAILERS 2014 (2)
Retailer Country of
Origin
Retail Turnover in US $ billion (2011)
Number of countries of operation
11 Aeon Co., Ltd. Japan 61.4 11
12 Edeka Zntrale AG & Co. KG Germany 61.0 1
13 Seven & i Holdings Co., Ltd. Japan 53.8 18
14 Rewe Combine Germany 51.2 11
15 Woolworths Limited Australia 49.6 2
16 Centres Distributeurs E. Leclerc France 48.6 7
17 Wesfarmers Limited Australia 48.1 2
18 Koninklijk Ahold NV Netherlands 43.6 6
19 ITM Développement International France 38.2 5
20 J Sainsbury plc U.K. 37.8 1
21 Loblaw Companies Limited Canada 37.8 2
22 Safeway Inc. U.S. 36.3 2
23 Publix Super Markets, Inc. U.S. 30.8 1
24 Delhaize Group SA Belgium 28.4 7
25 Wm Morrison Supermarkets PLC U.K. 27.5 1

4.2 DISCOUNTERS IN EUROPE

Nie
lsen
Gro
cery
Un
iver
se 2
016
│ C
op
yrig
ht ©
2016
Th
e N
iels
en C
om
pan
y. C
on
fid
enti
al a
nd
pro
pri
etar
y.
64
The market share of discount stores in Europe reached 21% in 2015. Moreover Discounters are very strong in Belgium as well where they represent 17.3% of the turnover.
MARKET SHARE DISCOUNTERS IN EUROPE
9.7%10.9%
11.8%13.1%
14.1%14.6%15.1%15.4%15.4%15.2%15.0%16.0%16.6%17.1%17.1%17.4%17.8%18.5%18.5%18.8%19.2%19.4%20.0%20.6%20.9%
1991 1992 1993 1994 1995 1996 1997 1998 1999 2000 2001 2002 2003 2004 2005 2006 2007 2008 2009 2010 2011 2012 2013 2014 2015
Discounters

Nie
lsen
Gro
cery
Un
iver
se 2
016
│ C
op
yrig
ht ©
2016
Th
e N
iels
en C
om
pan
y. C
on
fid
enti
al a
nd
pro
pri
etar
y.
65
DISCOUNT SHARE BY COUNTRY
Growing
Stable
Decline
62% 8 % 16%
17.0%
10%
13%
15%
13%
17%
10%
11%
22%
43%
41%
42%
20%
27%
20%
26%
24%

5. THE NIELSEN SERVICES

67
RETAIL MEASUREMENT SERVICES
NIELSEN RETAIL INDEX This service is available for the Food (ScanTrack) and Tobacco sectors. The Nielsen Retail Index offers to clients a continuous monitoring of the distribution of products to consumers. These sales results are combined with an analysis of the factors which explain their situation, as well as that of their competitors (price, distribution, promotional support, etc.). SCANTRACK EXPRESS ScanTrack Express is a “mini” version of the normal ScanTrack, developed to offer a quick, flexible and ad-hoc supplement for the regular data. Within this weekly delivered database, clients will be able to temporarily broaden the scope of their current tracking with extra products, extra markets and/or extra facts in order to quickly react on market changes. BACK DATA When clients launch a new product, they need information on the size, development, concentration, etc. of their specific market. The Nielsen databases contain information about more than 400 markets to answer these information needs. TOOLS Nielsen | i-sights and Answers Desktop are tools available via Nielsen Answers. Nielsen | i-sights provide an easy access to information and are easily used by professionals of the client service management for instance. They are dynamic graphs and tables which analyze contents and all other information related to the Nielsen databases. Answers Desktop is together with Nitro the tool to analyze in depth the databases content.
Nielsen Grocery Universe 2016 │ Copyright ©2016 The Nielsen Company. Confidential and proprietary.

68
SALES EFFECTIVENESS: ANALYTIC SERVICES
Nielsen services offer a wide range of ad-hoc solutions; starting from special tracking, in depth analysis to complete marketing models. They are a perfect supplement to clients’ ScanTrack data, enabling them to extend their analysis to another level and providing them with the necessary input to make solid marketing decisions. • Weekend Out-Of-Stock: surveys executed during a number of key weekends (both on Friday and Saturday) and provide a view of the stock-status, the refill percentage and facings of products at retailers. • Store observations: service to verify or track a certain parameter (e.g. special promotion, extra shelf space, type of displays, …) within a predefined number of retailers). • On Trade: information about products in pubs and dancings. • Store Explorer: study based on re-clustering of stores based on assortment, introduction, type of promotion,… • Store Testing: evaluation of the impact of changing one of the marketing mix elements in a real life environment (a limited number of test stores).
Nielsen Grocery Universe 2016 │ Copyright ©2016 The Nielsen Company. Confidential and proprietary.

69
SALES EFFECTIVENESS: ANALYTIC CONSULTING SERVICES
Nielsen modelling explains and quantifies the impact of the various elements that constitute clients’ sales (promotions, prices, range, weather, advertising etc.). In order to do this, an econometric model combines ScanTrack shop-by-shop data with other observations (such as media investments, non standard promotional information, etc.)
• Assortman identifies saturated/expansion segments of a category, products that maximise performance of the category and simulates future scenarios in terms of assortment, in line with clients’ needs and wishes.
• Assortman Promo conducts an in-depth study of promotional pressure and analyses the optimal spread of this pressure over the various categories and segments.
• Scan*Pro Promo conducts an in-depth study of promotions and gives clients crucial information on promotional impact and effectiveness, and on loss of market share etc., both from a reference point of view, and from a brand and category point of view.
• Scan*Pro Price calculates the price elasticity's at the absolute price level and the price differences between competitor’s products and a client’s products.
• Market Forecast forecasts clients’ future sales at category and at total market level.
• Out of Stock Diagnosis conducts an in-depth study of the out of stock issue and calculates the lost sales volume.
• Due to analysis provides marketers with a strategic understanding of the factors which drive sales (distribution, weather and seasonality, macro-economic changes,…)
Nielsen Grocery Universe 2016 │ Copyright ©2016 The Nielsen Company. Confidential and proprietary.

70
REVENUE MANAGEMENT OPTIMIZATION (RMO)
Consumer product companies spend extensively on trade promotions. The disappointing part is that about 40 percent of that spending doesn’t drive the desired results.
Nielsen’s end-to-end revenue management optimization boosts the effectiveness of trade promotions by aligning information-rich, analytic-driven decision making with the complete selling process. In short, we help companies connect revealing sales data with the right technology and proven processes. With a comprehensive vision across these areas, we can help you improve pricing decisions, enhance the efficiency of trade spending and ensure product availability. Strategic planning: Make more confident annual price and promotion strategies based on extensive scenario planning, driven by using predictive analytics to drive precise promotion strategies and execution-oriented sales plans. Tactical planning: Deliver execution-oriented sales plans aligned to your greatest opportunities verified through event-level scenario planning and predictive analytics. Integrated promotion management: Create promotion programs that effectively integrate execution, management and program fulfillment. Ongoing retail execution: Monitor trade promotion performance in real time to maximize retail promotion compliance, product distribution and inventory availability. Post-event analytics: Perform comprehensive profit and loss analyses after each event to guide future program decisions
Nielsen Grocery Universe 2016 │ Copyright ©2016 The Nielsen Company. Confidential and proprietary.

71
CONSUMER RESEARCH SERVICES
Nielsen offers a wide range of studies that answer some of clients’ questions regarding their consumers, their motivation to buy, their satisfaction level about their brands, product, new packaging, … Nielsen uses mostly the “on-line” methodology to conduct these studies.
• The Consumeter on-line study enables clients to assess the penetration of their categories and the positioning of their brands and brand awareness on the Belgian market.
• The Shopper Research study helps to better understand the consumer behaviour in the Shop (behaviour in front of the shelf, …)
• The Trade eQ satisfaction study measures the satisfaction of retailers about products or the way clients manage certain daily issues.
• The ShopperTrends study measures how loyal a shopper is to a store, how often he visits the store, how he perceives the Belgian retailers, … This study also provides a global vision of the shopper of today and his preference criteria for one or more chains
• The Winning Brands study analyses the factors that drive the consumer to buy and defines the strengths and weaknesses of a brand versus its competitors.
• Concepts@work - Packs@work - Ads@work: These three tools will help to know how a consumer perceives a new concept, a packaging or various themes for an advertisement.
• The Price-it-Right study analyses the price perception of an existing or a new product
Nielsen Grocery Universe 2016 │ Copyright ©2016 The Nielsen Company. Confidential and proprietary.

72
MERCHANDISING SERVICES
MERCHANDISING Merchandising is one part of the Category Management process. It is the visual translation of the results of these analyses, including the rational implementation, the financial optimisation, expressed in optimal stock control, turnover or maximum profit. Nielsen provides companies with tools to conduct these studies but also the expertise of its consultants. MY.SPACEMAN my.spaceman is a software that integrates all the below merchandising applications with a unified user interface. It works on a centralized database and enables to manage users’ profiles more easily.
•Shelf space optimization with Spaceman Suite
• Assortment analysis with Product Planner
• Floor planning analysis with Spaceman Store Planner
Nielsen Grocery Universe 2016 │ Copyright ©2016 The Nielsen Company. Confidential and proprietary.

73
•NRPS offers an audit of all FMCG SKUs for all categories, in all the requested stores, at every period required. Retail clients use it for pricing strategy and tactics; it can be based from in-store, online, or EPOS data.
•On a regular basis, Nielsen captures, validates and processes the price of every FMCG item in each store you request, and delivers reports that help you:
• Evaluate your price position versus other retailers
• Plan your pricing strategy and monitor its execution
• Implement store-level precision pricing matched to the customers and competitors in each market
• Manage pricing for your store brands compared to other retailers’ brands
• Pinpoint your most distributed and most price sensitive items
• Identify gaps in your product range
NIELSEN RETAILER PRICE SOLUTION (NRPS)
Nielsen Grocery Universe 2016 │ Copyright ©2016 The Nielsen Company. Confidential and proprietary.
BRANDBANK
Brandbank stands between retailers (typically the e-commerce sites) and manufacturers and is a world leader specialized in the process of digitally creating, managing and distributing FMCG product and brand image content for retail syndication across in-store, print promotional and e-commerce platforms. Thanks to Brandbank, you will benefit from databases including high quality pictures and product descriptions maintained, centralised and useful to your whole organization.
.

74
NIELSEN EYE TRACKING
Eye tracking analyzes the shopper behavior, how the consumer looks at the shelves (or feature) and come to an understanding of the total shopper journey in store by measuring the eye movement of the consumer during his shopping trip.
Mirrow customer intelligence platform helps consumer goods companies improve account planning, trade terms optimization, maximizing trade-promotion effectiveness. Intuitive user interfaces for a superior user experience. A flexible and modular architecture that enables companies to effectively integrate specific modules or the complete suite. Mirrow shopper marketing solution: covers all the functions for category managers from creating the strategy and building the plan to monitoring real situation in the stores. Drives enormous productivity to merchandising departments in manufactures and retailers allowing them to manage store specific assortment, planograms and realograms
MIRROW
Nielsen Grocery Universe 2016 │ Copyright ©2016 The Nielsen Company. Confidential and proprietary.

75 Nielsen Grocery Universe 2016 │ Copyright ©2016 The Nielsen Company. Confidential and proprietary.
NIELSEN CUSTOMER EXPERIENCE
The Nielsen Customer Experience solution is a full-fledged, omni channel and end-to-end Customer Experience Management (CEM) framework designed to: • Ensure the Customer Experience (CX) is designed to deliver on the brand promise and meets customers’
expectations • Consistently and systematically measure the CX delivery on key touchpoints and act on the voice of the
customer (NPS, satisfaction, complaints) in real-time. • Enable businesses to convert customer insights into concrete operational improvements and generate
analytics that drive business outcomes (e.g. retention) By merging an omni channel and real-time CEM software platform, based on a unique Alliance with ResponseTek, with advanced analytics and key business insights, Nielsen Customer Experience (NCX) enables organisations to manage performance at an individual consumer level and for all touch points, channels and for both offline and online. For the first time, businesses can link attitudes on customer experiences with actual purchase behaviour and actionable analytics (e.g. churn prediction models) – transforming static CEM reporting into business improvement that strengthens customer relationships and drives improved commercial results.

76
GLOBAL SERVICES
International solutions The Global Services team works together with the local Nielsen offices in more than 100 countries to offer clear and consistent data to its clients about specific markets and categories. Nielsen can answer the following questions relating to the sales opportunities abroad:
· Which markets offer the biggest sales opportunities? · How will entering other markets enhance overall performance? · Are existing market strategies appropriate for new markets? · How do adjacent markets influence my turnover? · How different are market mechanisms and structures between countries? Knowledge and Information for Decision-Making Information is easily accessible to marketing en sales managers through the Answers technology. Our team can also help companies to integrate solutions or data from different data sources : e.g. ex-factory data, financial information and external market researches. Innovation Analytics In order to achieve breakthrough innovation success, you need to know which aspects of your products work and which don’t, before you launch. We can help you determine through a consultative approach that illuminates how to capitalize on features that are outstanding and fix those that aren’t.
Nielsen Grocery Universe 2016 │ Copyright ©2016 The Nielsen Company. Confidential and proprietary.

77
DIRECT DATA SOLUTIONS
Nielsen On Shelf Availability (OSA) Manufacturers and retailers need to manage an ever wider amount of information. Our experts can offer them a solution for all their Direct Data issues (efficient management of the point of sale or the product availability in the shelves)
NIELSEN STORE
In the Nielsen store clients find essential and accessible market information 24/7 to support their fast decisions in order to let their business grow and prosper. It includes European country by country information by category, manufacturer or cross category summaries. www.store.nielsen.com
Nielsen Grocery Universe 2016 │ Copyright ©2016 The Nielsen Company. Confidential and proprietary.

78
ADVERTISING INFORMATION SERVICES (AIS)
MDB ADEX
Provides clients with the software tools and data for comprehensive reliable media and marketing analysis to help them optimize their business. Generates competitive advertising data (both creative and quantitative) and auditing services using our own state-of-the-art capturing and monitoring systems, algorithms and databases.
MDB ADEX provide a wide coverage of the media-mix, whilst offering personalized services tailored to exact requirements:
• Advertising Expenditure Monitoring (ADEX)
• Media Monitoring & Auditing solutions
• Media Audience Measurements & Analysis
Nielsen Grocery Universe 2016 │ Copyright ©2016 The Nielsen Company. Confidential and proprietary.

79
ARIANNA / RATING POINT / VIEWTIME
Today’s increasingly complex television environment is driving a need for more advanced software to process, manage and interpret the growing amounts of audience data. Arianna, Rating Point and Viewtime are three softwares that help our clients transform local overnight ratings data into a marketplace advantage and more efficiently meet the daily needs of Management, Research and Sales.
TV EVENTS MONITORING SYSTEM
Nielsen’s system operates as a fully integrated solution encapsulating all the stages of the TV Events data production process:
• Capture of the broadcast content
• Automatic search and identification of the commercial spots
• Assists the operator to input accurate program details
• Runs the quality control
• Generates output files that can be integrated in different analysis software applications
TELEVISION AUDIENCE MEASUREMENT (TAM)
Nielsen Grocery Universe 2016 │ Copyright ©2016 The Nielsen Company. Confidential and proprietary.
The Nielsen Company Belgium
Avenue de Pléiades / Plejadenlaan 73 1200 Brussels Belgium
Tel 32 (0)2 778 70 11 Fax 32 (0)2 778 70 78
www.nielsen.com