grit characterization study · grit settles to the bottom of the tank, and wastewater exits through...
TRANSCRIPT
GRIT CHARACTERIZATION
STUDY
SOUTH VALLEY
WATER RECLAMATION FACILITY
- WEST JORDAN, UTAH
STU DY P REPARED F OR SOU TH VAL L EY WRF
7495 S. 1300 W. WEST J ORDAN, U T 840 8 4
B L A C K D O G A N A L Y T I C A L , L L C
2 4 0 2 E . 2 6 5 9 T H R D .
M A R S E I L L E S , I L 6 1 3 4 1

2
Table of Contents
Section Title Page List of Figures 3 List of Tables 4 Definitions/Abbreviations 5 Introduction 6 Objectives 6 Part 1: South Valley WRF 7 Part 2: Jordan Basin WRF 26 Part 3: Settler Comparison Study 33 Conclusions 39 Bibliography 40 Appendix A – Raw Data 41 A-1 Concentration Calculation Spreadsheet 42 A-2 Solids Analysis Bench Sheets 43 A-3 Grit Concentration Calculation Bench Sheet 46 A-4 SES Data Analysis 47 A-5 SES Charts 53 A-6 SES Chart Analysis 56 A-7 Median SES versus Median Physical Size 59 Appendix B - Calculations 60

3
List of Figures
1. Influent Sampler/Sampling Site 2. Grit Settlers 3. PVC Splitter and Valve 4. West Grit Chamber Sampling Site 5. East Grit Chamber Sampling Site 6. Modified Imhoff Cone for SES Measurements 7. South Valley WRF Flow Trend Chart: March 11, 2014 8. South Valley WRF Flow Trend Chart: March 12, 2014 9. Fractional Distribution of Influent Grit at the South Valley WRF
10. Cumulative Distribution of Influent Grit at the South Valley WRF 11. Concentrations of Influent Grit at the South Valley WRF 12. Comparison of the South Valley WRF Influent Grit Physical Size and Sand Equivalent Size
on March 11, 2014 13. Comparison of the South Valley WRF Influent Grit Physical Size and Sand Equivalent Size
on March 12, 2014 14. Median Size Distribution of Grit at the South Valley WRF vs. a Clean Sand Distribution 15. Fractional Distribution of Grit at the South Valley WRF: March 11, 2014 16. Fractional Distribution of Grit at the South Valley WRF: March 12, 2014 17. Cumulative Distribution of Grit at the South Valley WRF: March 11, 2014 18. Cumulative Distribution of Grit at the South Valley WRF: March 12, 2014 19. Concentrations of Grit at the South Valley WRF: March 11, 2014 20. Concentrations of Grit at the South Valley WRF: March 12, 2014 21. Comparison of the South Valley WRF West Grit Chamber Effluent Physical Size and Sand
Equivalent Size on March 11, 2014 22. Comparison of the South Valley WRF West Grit Chamber Effluent Physical Size and Sand
Equivalent Size on March 12, 2014 23. Median Size Distribution of Grit at the South Valley WRF vs. a Clean Sand Distribution on
March 11, 2014 24. Median Size Distribution of Grit at the South Valley WRF vs. a Clean Sand Distribution on
March 12, 2014 25. Influent Sampler/Sampling Site: Jordan Basin 26. Grit Chamber Effluent Sampling Site: Jordan Basin 27. Jordan Basin Grit Settlers 28. Jordan Basin WRF Flow Trend Chart: March 14, 2014 29. Fractional Distribution of Grit at the Jordan Basin WRF: March 14, 2014 30. Cumulative Distribution of Grit at the Jordan Basin WRF: March 14, 2014 31. Concentrations of Grit at the Jordan Basin WRF: March 14, 2014 32. Comparison of the West Jordan WRF Influent Grit Physical Size and Sand Equivalent Size
on March 14, 2014 33. Comparison of the West Jordan WRF Grit Chamber Effluent Grit Physical Size and Sand
Equivalent Size on March 14, 2014 34. Median Size Distribution of Grit at the West Jordan WRF vs. a Clean Sand Distribution on
March 14, 2014 35. Typical sampling setup 36. Grit Settler and Sample Splitter 37. Fractional Distribution of Grit at the South Valley WRF: March 11, 2014 Settler Study 38. Fractional Distribution of Grit at the South Valley WRF: March 12, 2014 Settler Study 39. Cumulative Distribution of Grit at the South Valley WRF: March 11, 2014 Settler Study

4
List of Figures Continued… 40. Cumulative Distribution of Grit at the South Valley WRF: March 12, 2014 Settler Study 41. Concentrations of Grit at the South Valley WRF: March 11, 2014 Settler Study 42. Concentrations of Grit at the South Valley WRF: March 12, 2014 Settler Study
List of Tables
1. Sieve Size Equivalents 2. South Valley WRF Grit Evaluation Sampling Period 3. Predicted Removal Efficiencies (%) of a System Designed To Remove Grit of a Specific
SES at the South Valley WRF 4. Fractional Removal Efficiencies of the South Valley West Grit Chamber: March 11, 2014 5. Fractional Removal Efficiencies of the South Valley West Grit Chamber: March 12, 2014 6. Jordan Basin WRF Grit Evaluation Sampling Period 7. Fractional Removal Efficiencies of the Jordan Basin Grit Chamber: March 14, 2014 8. Influent Settler Comparison at the South Valley WRF

5
Definitions/Abbreviations gpm - gallons per minute. Grit – A settleable inorganic kernel with attached organics larger than 50 microns and characterized by physical size and settling velocity. Grit Concentration – the amount of grit present in the wastestream based on the fixed solids measurements Grit Fixed Solids (FS) – also expressed as “fixed solids” - the inorganic portion of sample remaining after organics are removed by ashing in a muffle furnace at 550oC. lbs./MG – Pounds per Million Gallons MG - Million Gallons MGD – Million Gallons per Day NR1 – the Reynolds number for the trial SES NR2 – the Revised Reynolds number SAA – Surface Active Agents – material affixed to the grit particle, such as organics, fats, oils, and greases that may affect the settling velocity of municipal grit. Sample – All material accumulated in the bottom of the grit settler which includes settleable organics. Sand Equivalent Size (SES) - The sand particle size, measured in microns, having the same settling velocity as the selected grit particle. Sed h, cm – The height of water in the Imhoff cone through which the sediment passed to reach the surface of accumulated material during SES determination Sed Time, sec – The time required for sediment to reach the recorded volume during SES determination Sed vel, cm/s – the settling velocity (v) of the sediment reaching a particular settled volume Sed. Vol., cc – Sedimentation Volume (cc or ml) – The amount of material that settles in the Imhoff Cone during SES determinations SES, d1, u – Trial Sand Equivalent Size, in microns SES, d2, u – Revised Reynolds Number based on NR2 and d1 VIS – Vertically Integrated Sampler Vol Frac, % - the cumulative sedimentation percentage occurring during SES determination

6
Introduction
The South Valley Water Reclamation Facility (WRF) in West Jordan, UT is assessing the quantities and characteristics of grit entering their treatment facility. Data collected during this study will contribute to future headworks improvements. Additionally, a newly installed grit chamber will be assessed at the Jordan Basin WRF. In conventional grit removal system design, grit has commonly been treated as clean sand with a specific gravity of 2.65. Metcalf and Eddy’s Wastewater Engineering: Treatment and Reuse (standard textbook) says “Grit consists of sand, gravel, cinders, or other heavy materials that have specific gravities or settling velocities considerably greater than those of organic particles”. These inorganic solids are often associated with Surface Active Agents (SAA) that include fats, oils, greases, and other organic materials can lower their effective specific gravity to 1.3 (Tchobanoglous, 2003). The shape and composition of grit and inert solids also greatly affects settling velocities. Material with similar specific gravities may have very different settling velocities due to the shape of the particle. When determining quantities of grit during this study, grit will be defined as settleable inorganic material larger than 50 microns. Settling velocities, attached organics and SAA has been considered during the on-site laboratory analyses. The settling velocity is expressed as the Sand Equivalent Size (SES), which is the sand particle size having the same settling velocity as the more buoyant grit particle. Materials less than 50 microns in size have been considered silt or clay and thus excluded from the data.
Study Objectives
1. Determine the quantities and characteristics of grit entering the facility 2. Determine the performance of existing aerated grit chambers 3. Determine the performance of a newly installed grit chamber at the Jordan Basin WRF

7
PART 1: SOUTH VALLEY WRF
Methods/Materials: Obtaining Representative Grit Fixed Solids (FS) Sample The volume and characteristics of grit received at wastewater treatment facilities can vary widely depending on the characteristics of the collection system, weather conditions, septic waste haulers, and industrial activities. The analytical procedures used in compiling these data take into account and compensate for the non-homogeneity of the grit. The influent sample was collected from the channel prior to screening. A single-point sampler was secured in the channel and positioned to face the flow (Figure 1). The shallow depth and high velocities present in the wastestream insured a homogenous sample was collected. A suction hose plumbed to a trash pump was affixed to the sampler. The sampler was moved laterally in one-foot increments every twenty minutes during the sampling event to collect grit from the entire width of the channel.
Figure 1. Influent Sampler/Sampling Site
The influent sample collected by the trash pump was diverted to two grit settlers (Figure 2). One settler was fabricated from lumber and pressboard, and lined with a 6-mm poly tarp. Its measurements were six feet wide, ten feet long and approximately 30-inches deep, with a weir cut in the back for discharge into the channel. The discharge hose from the sample pump was secured in the front corner of the settler, and flow was diverted downward and laterally to reduce velocities. The second settler was constructed from a 55-gallon drum with an influent port and a discharge weir. Flow enters the tank and is diverted to the side with a 90o elbow to reduce the velocity and turbulence. Grit settles to the bottom of the tank, and wastewater exits through the discharge fitting at the top of the tank. In order to settle 50-micron grit with a specific gravity of 2.65, the overflow rate must be less than 3 gpm/ft2 of surface area. The settler has a diameter of 24-inches, or a surface area of 3.14 ft2. At 10 gpm, the overflow rate is 3.18 gpm/ft2. The settler feed rate is adjusted to less than 8 gpm to insure settling of fine grit and this is checked by timing the overflow rate of the settler. This is repeated every 30 minutes to insure stability. The excess flow provided by the pump is bypassed back into the wastestream.

8
Figure 2. Grit Settlers
The purpose of using two settlers was to determine if splitting a small fraction of the collected sample is representative of the entire sample. A PVC wye was used to split the flow (Figure 3), and a valve following the wye is used to increase flow to the settler if necessary. A one-inch hose supplied the grit settler with a portion diverted from the pumped flow feeding the large settler.
Figure 3. PVC Splitter and Valve
Samples were collected in a similar manner from the discharge weir of the west grit chamber. A single-point sampler was secured at the weir and moved laterally once per hour. Three sampling points along the weir were used: left, middle and right (Figure 4). Two settlers identical to those used at the influent site were used to separate and retain the collected grit.

9
Figure 4. West Grit Chamber Sampling Site
It was assumed that flows were evenly split between the East and West aerated grit chambers. However, a sample was collected from the East grit chamber to confirm accurate determination of performance for the West grit chamber. The sample was collected using the same protocol as the West grit chamber, but a single 55-gallon grit settle was used (Figure 5).
Figure 5. East Grit Chamber Sampling Site
At the end of the sampling period, the settler contents are allowed to stand for 10 minutes. The supernatant is discarded and grit that has accumulated in the bottom of the settler is rinsed into buckets. The liquid portions of the grit samples are gradually poured off until the remaining grit/sludge samples are thick enough to obtain a homogenous mixture without grit settling out of the slurry. The entire volume of each sample is recorded before being split, if necessary, for analysis. Since bacteria will reduce the organics that are attached to the grit particles, it is important to perform the analyses on fresh grit immediately after collection. If immediate analysis is not possible, samples may be stored at 4OC for no longer than 12 hrs.

10
Methods/Materials: Determination of Grit Particle Distribution A maximum 200-gram portion of the sample collected by the Grit Settler is immediately classified through a series of sieves. Wet sieving for size fractions and the SES settling tests are conducted on fresh grit from the sewer waste stream samples as the Surface Active Agents (SAA) attached to the grit kernel may substantially reduce its effective specific gravity and consequently it’s settling velocity. If the total sample size exceeds 200-grams, the sample is split and the fraction is recorded on the field bench sheet. Sieve sizes used are listed below in Table 1.
Table 1. Sieve Size Equivalents Opening
U.S. Sieve Size Tyler
Equivalent microns inches 1/4 3.25 mesh 6300 0.2500 1/8 6.5 mesh 3180 0.1250 #12 10 mesh 1680 0.0661 #20 20 mesh 841 0.0331 #50 48 mesh 297 0.0117 #70 65 mesh 210 0.0083
#100 100 mesh 149 0.0059 #140 150 mesh 105 0.0041 #200 200 mesh 74 0.0029 #270 270 mesh 53 0.0021 Pan
Methods/Materials: Determination of Sand Equivalent Size (SES) distribution
Settling tests were conducted immediately on solids passing the 1/8” sieve and sequentially retained on the #12, #20, #50, #70, #100, #150, #200, and #270 sieves. A portion of the retained material is placed into a modified Imhoff cone filled with water (See Figure 6). The column is inverted and as the grit settles in the cone corresponding time and volume measurements are recorded. The objective of these measurements is to determine the size of a sand sphere having the same settling velocity as the collected grit fraction.

11
Figure 6. Modified Imhoff Cone for SES Measurements
Sand Equivalent Size Description
The settling velocity of a grit particle depends on several factors that may include surface active agents affixed to the grit particle, the composition, and the shape of the grit particle. Particles with slow settling velocities are said to be “light” and may have low specific gravity or be angular in shape. Conversely, fast settling particles are said to be “heavy” and may have high specific gravities and a rounder shape. Clean, round silica sand is known to have a Specific Gravity of 2.65. However, because grit is seldom clean or round, and may not be made of silica, settling velocities are often much slower. Like Specific Gravity, Sand Equivalent Size is a way of describing the settling characteristics of municipal grit. By definition, Sand Equivalent Size (SES) is “the clean sand particle size, measured in microns, having the same settling velocity of the collected grit particle”. For example, a 300-micron silica sand particle with a specific gravity of 2.65 will settle at a known velocity. A 300-micron grit particle composed of a different material (i.e., limestone), or a silica sand particle (2.65 SG) with a shape that is not round, will settle slower, perhaps with a settling velocity similar to that of a 150-micron sand particle. Therefore, we say that the 300-micron grit particle has a Sand Equivalent Size of 150-microns. Additionally, sieve analyses are a “two-dimensional” test, and ignore the thickness of the grit particle. Therefore, a visually “coarse” distribution may in fact behave like a much finer one. By comparing the physical size and the SES of the grit, the effects of shape and composition can be demonstrated. The following is an example of a “companion plot” that charts physical size and SES of municipal grit.

12
Physical Size versus Sand Equivalent Size: Cumulative Distributions
The preceding chart compares cumulative distributions. For example, from the chart, 87% of the influent grit has a physical size of 150-microns and larger, while only 43% of the grit has a Sand Equivalent Size of 150-microns and larger. This difference is a result of the composition and shape previously discussed, and this grit is “light”. As particles become smaller, they attain a more rounded shape, resulting from larger, flat particles breaking up into smaller pieces. Grit chamber design must consider the settling velocity of the grit, as specific gravity and physical size distributions alone fail to provide enough information on grit behavior. Methods/Materials: Solids Analysis The weight measurements of the grit particles retained on each of the ten sieves were determined according to methods SM2540B and SM2540E as outlined in Standard Methods for the Examination of Water and Wastewater, 1998 APHA, AWWA, WEF, 20th edition. Fixed solids fractions were arranged into fractional and cumulative distributions. From this data a cumulative curve factoring physical size and weight of fixed solids is generated. All solids data are listed in Appendix A-1 “Fractional Solids Analysis” Data from the settling tests are entered into a spreadsheet for each size fraction that converts the settling velocities and volumes into Sand Equivalent Size. The SES value generated is plotted against the corresponding volume fraction to generate a series of SES charts. Each chart is divided into 25-micron SES intervals and the percentages of grit falling within each interval are entered into a spreadsheet for analysis. From this data, a cumulative curve factoring SES and weight of fixed solids per size fraction is generated. By comparing the “SES” curve with the “Physical Size” curve,
13
we can determine the amount of grit that can bypass a grit removal system designed around a known sand particle size. The SES charts are also used to compare the average SES within a sieve fraction with the average physical size of clean, round silica sand for that same sieve fraction. To calculate the concentration of grit present in the sewer during normal flow conditions, the volume of wastewater sampled each day is compared to the measured volume of wastewater passing through the sewer during the sampling periods. The total amount of grit collected during each sampling period is applied to the total volume of wastewater to determine the lbs/MG of grit present in the sewer.
14
Discussion of Results
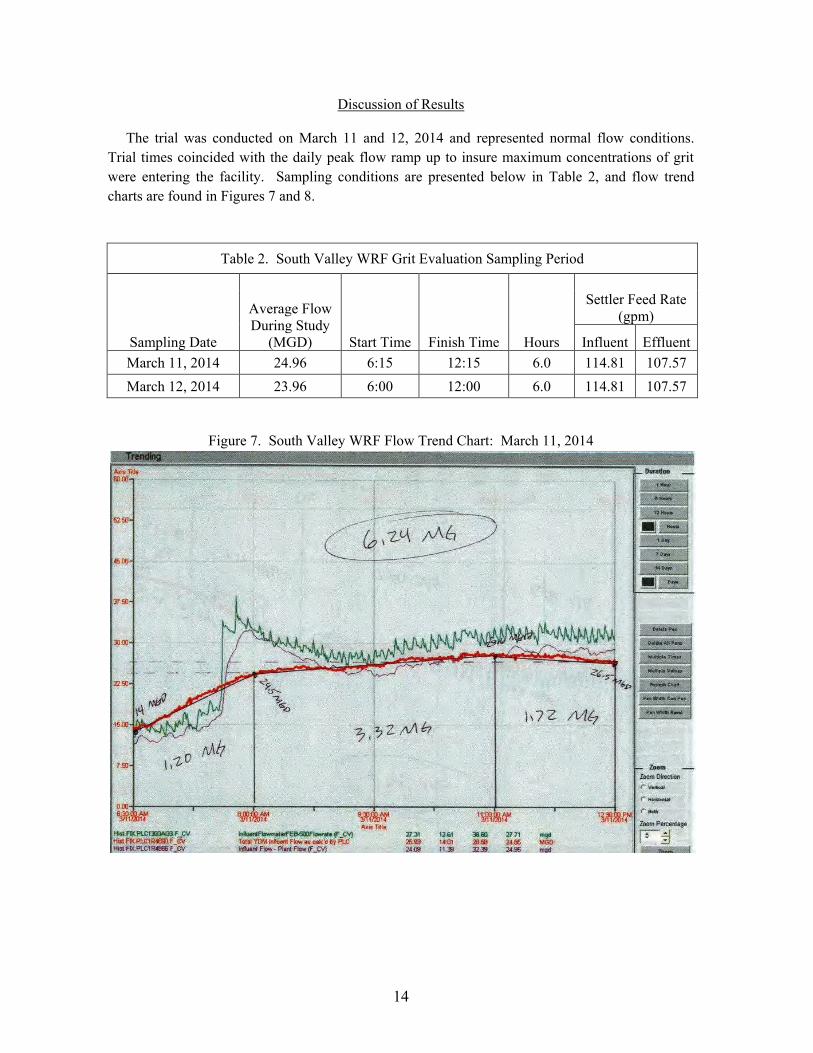
The trial was conducted on March 11 and 12, 2014 and represented normal flow conditions. Trial times coincided with the daily peak flow ramp up to insure maximum concentrations of grit were entering the facility. Sampling conditions are presented below in Table 2, and flow trend charts are found in Figures 7 and 8.
Figure 7. South Valley WRF Flow Trend Chart: March 11, 2014
Table 2. South Valley WRF Grit Evaluation Sampling Period
Sampling Date
Average Flow During Study
(MGD) Start Time Finish Time Hours
Settler Feed Rate
(gpm)
Influent Effluent March 11, 2014 24.96 6:15 12:15 6.0 114.81 107.57 March 12, 2014 23.96 6:00 12:00 6.0 114.81 107.57

15
Figure 8. South Valley WRF Flow Trend Chart: March 12, 2014
16
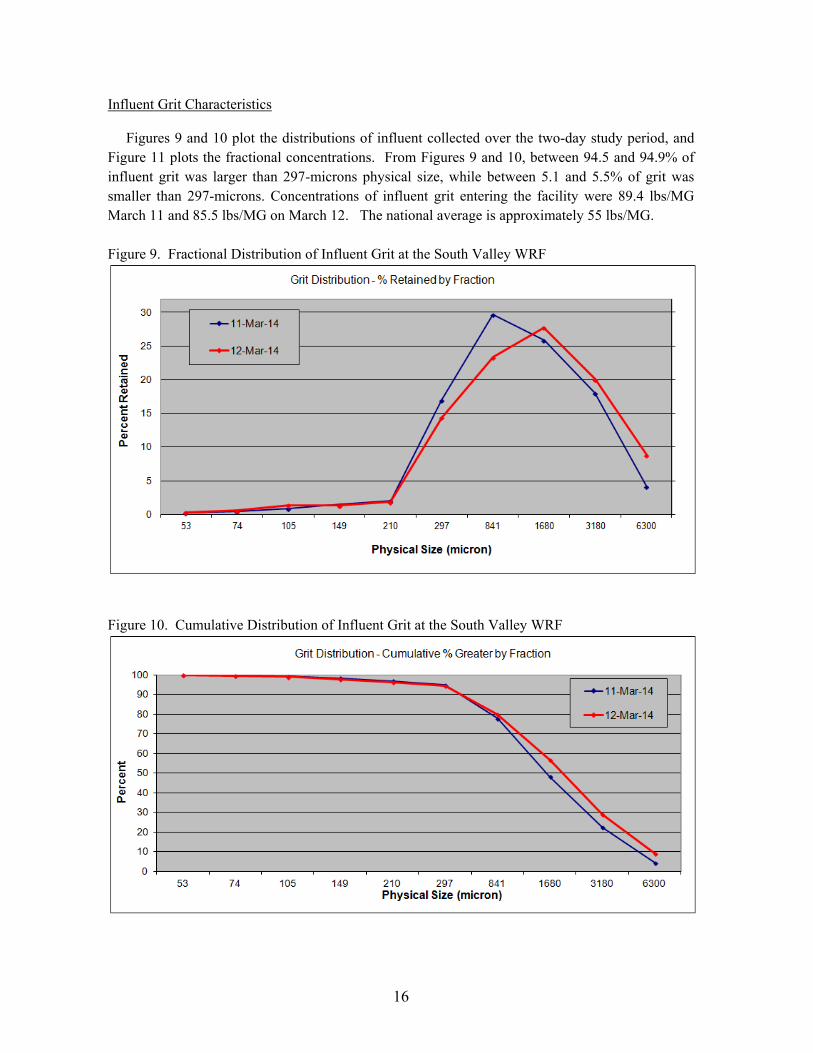
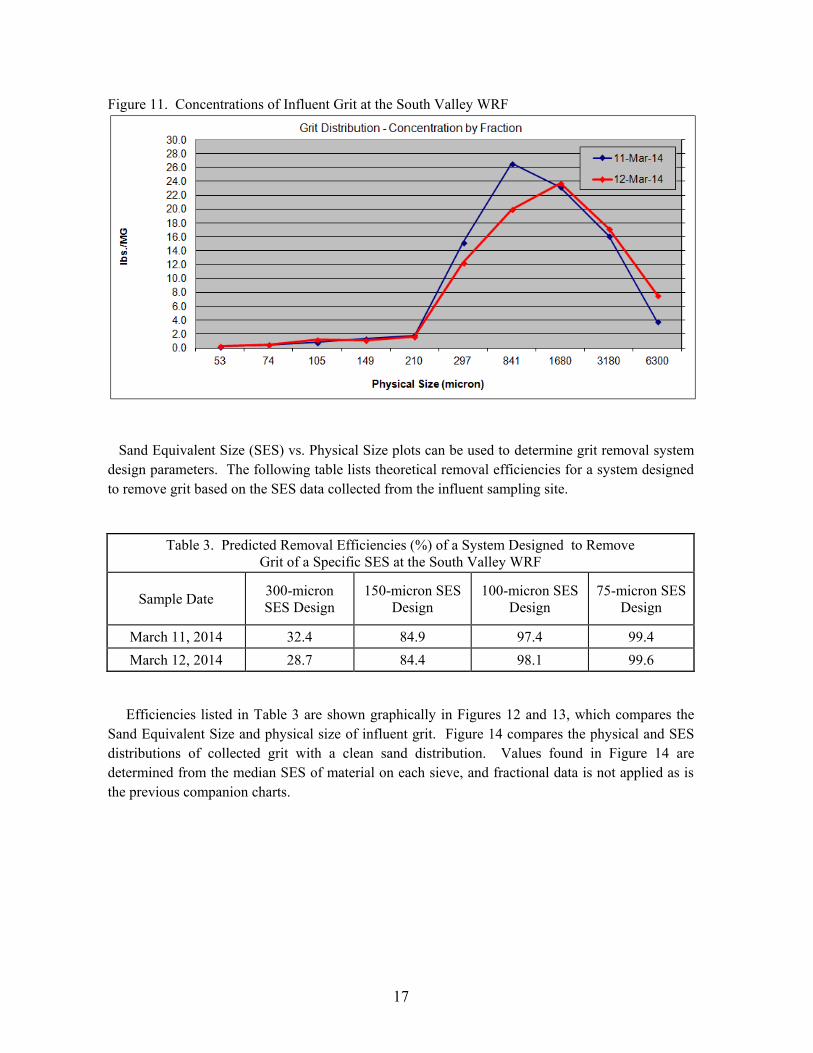
Influent Grit Characteristics Figures 9 and 10 plot the distributions of influent collected over the two-day study period, and Figure 11 plots the fractional concentrations. From Figures 9 and 10, between 94.5 and 94.9% of influent grit was larger than 297-microns physical size, while between 5.1 and 5.5% of grit was smaller than 297-microns. Concentrations of influent grit entering the facility were 89.4 lbs/MG March 11 and 85.5 lbs/MG on March 12. The national average is approximately 55 lbs/MG. Figure 9. Fractional Distribution of Influent Grit at the South Valley WRF
Figure 10. Cumulative Distribution of Influent Grit at the South Valley WRF
17
Figure 11. Concentrations of Influent Grit at the South Valley WRF
Sand Equivalent Size (SES) vs. Physical Size plots can be used to determine grit removal system design parameters. The following table lists theoretical removal efficiencies for a system designed to remove grit based on the SES data collected from the influent sampling site.
Table 3. Predicted Removal Efficiencies (%) of a System Designed to Remove Grit of a Specific SES at the South Valley WRF
Sample Date 300-micron SES Design
150-micron SES Design
100-micron SES Design
75-micron SES Design
March 11, 2014 32.4 84.9 97.4 99.4 March 12, 2014 28.7 84.4 98.1 99.6
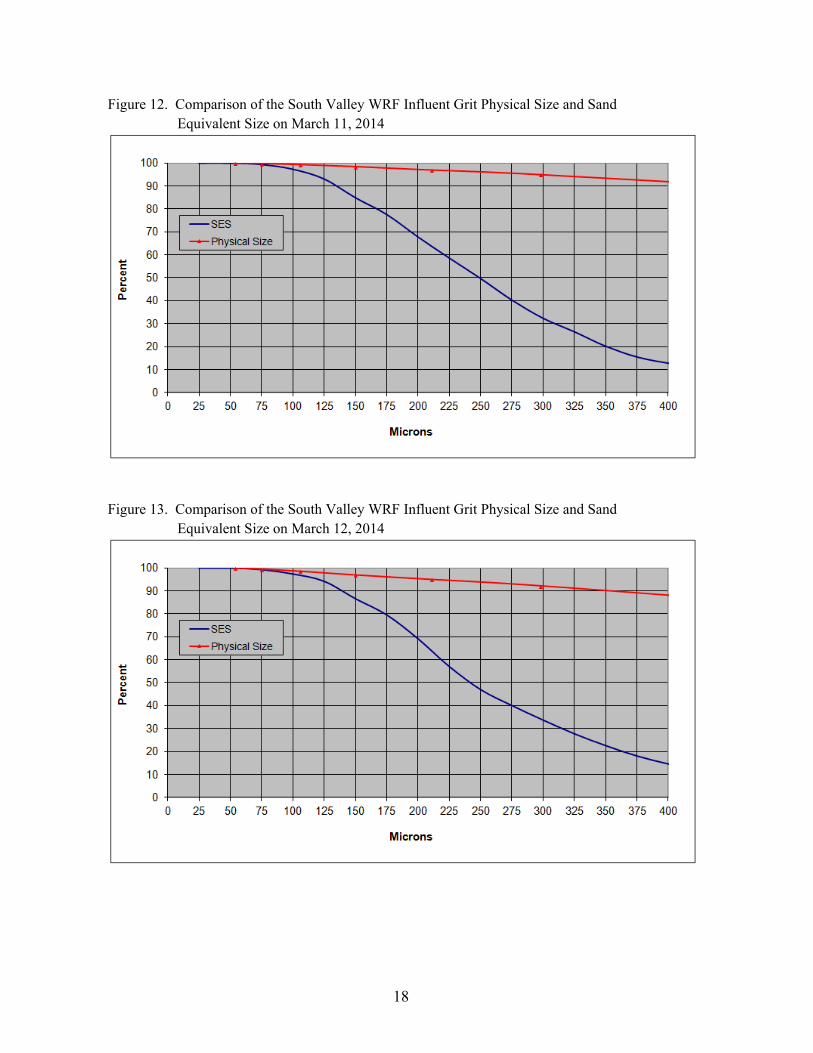
Efficiencies listed in Table 3 are shown graphically in Figures 12 and 13, which compares the Sand Equivalent Size and physical size of influent grit. Figure 14 compares the physical and SES distributions of collected grit with a clean sand distribution. Values found in Figure 14 are determined from the median SES of material on each sieve, and fractional data is not applied as is the previous companion charts.
18
Figure 12. Comparison of the South Valley WRF Influent Grit Physical Size and Sand Equivalent Size on March 11, 2014
Figure 13. Comparison of the South Valley WRF Influent Grit Physical Size and Sand Equivalent Size on March 12, 2014

19
Figure 14. Median Size Distribution of Influent Grit at the South Valley WRF vs. a Clean Sand Distribution
Although large, the settling velocities were extremely slow, with median SES values between 265 and 268-microns for grit as large as 3,180 microns.

20
West Grit Chamber Performance Evaluation Performance was determined by comparing fractional concentrations of grit entering and exiting the grit chamber. Figures 15 and 16 plot the daily influent and effluent fractional distributions. Figures 17 and 18 plot the cumulative distributions, and Figures 19 and 20 plot fractional concentrations. Tables 4 and 5 list fractional removal efficiencies for the West Grit Chamber. Figure 15. Fractional Distribution of Grit at the South Valley WRF: March 11, 2014
Figure 16. Fractional Distribution of Grit at the South Valley WRF: March 12, 2014

21
Figure 17. Cumulative Distribution of Grit at the South Valley WRF: March 11, 2014
Figure 18. Cumulative Distribution of Grit at the South Valley WRF: March 12, 2014

22
Figure 19. Concentrations of Grit at the South Valley WRF: March 11, 2014
Figure 20. Concentrations of Grit at the South Valley WRF: March 12, 2014

23
Table 4. Fractional Removal Efficiencies of the South Valley West Grit Chamber
- March 11, 2014
Size Fraction Concentration of Influent Grit FS
(lbs/MG)
Concentration of Effluent Grit FS
(lbs/MG)
Removal Efficiency
(%) >297-microns 84.85 2.93 96.6
<297-microns >210-microns 1.81 1.93 -6.8
<210-microns >149-microns 1.32 2.54 -92.4
<149-microns >105-microns 0.79 1.49 -89.0
<105-microns >74-microns 0.44 0.58 -29.6
<74-microns >53-microns 0.20 0.16 21.7
Total 89.40 9.61 89.2
Table 5. Fractional Removal Efficiencies of the South Valley West Grit Chamber
- March 12, 2014
Size Fraction Concentration of Influent Grit FS
(lbs/MG)
Concentration of Effluent Grit FS
(lbs/MG)
Removal Efficiency
(%) >297-microns 80.73 2.15 97.3
<297-microns >210-microns 1.61 0.87 45.8
<210-microns >149-microns 1.14 0.95 16.4
<149-microns >105-microns 1.19 0.72 39.2
<105-microns >74-microns 0.49 0.33 32.6
<74-microns >53-microns 0.30 0.18 39.3
Total 85.46 5.21 93.9
The West Grit Chamber performed well over the two-day study, with total removal efficiencies of 89.2% and 93.9%. From Table 4, values in red are negative performance values resulting from higher concentrations of material in the effluent sample. There are two likely causes for this. First, the concentrations are low for fractions smaller than 297-microns. Small differences in flows and positioning of samplers can become magnified by the small amounts of grit collected. Second, some material in the grit chamber may be neutrally buoyant, and remain in the grit chamber longer than material that settles quickly or pass through the unit. This material can concentrate and result in higher concentrations leaving the unit. These results were repeated in the duplicate sample collected by a second settler, which is discussed later in the report.

24
Sand Equivalent Size was determined for the West Grit Chamber effluent samples and are charted in Figures 21 and 22. Figures 23 and 24 compare the daily SES values with a clean sand distribution. Figure 21. Comparison of the South Valley WRF West Grit Chamber Effluent Physical Size and Sand Equivalent Size on March 11, 2014
Figure 22. Comparison of the South Valley WRF West Grit Chamber Effluent Physical Size and Sand Equivalent Size on March 12, 2014

25
Figure 23. Median Size Distribution of Grit at the South Valley WRF vs. a Clean Sand Distribution on March 11, 2014
Figure 24. Median Size Distribution of Grit at the South Valley WRF vs. a Clean Sand Distribution on March 12, 2014
26
PART 2: JORDAN BASIN WRF
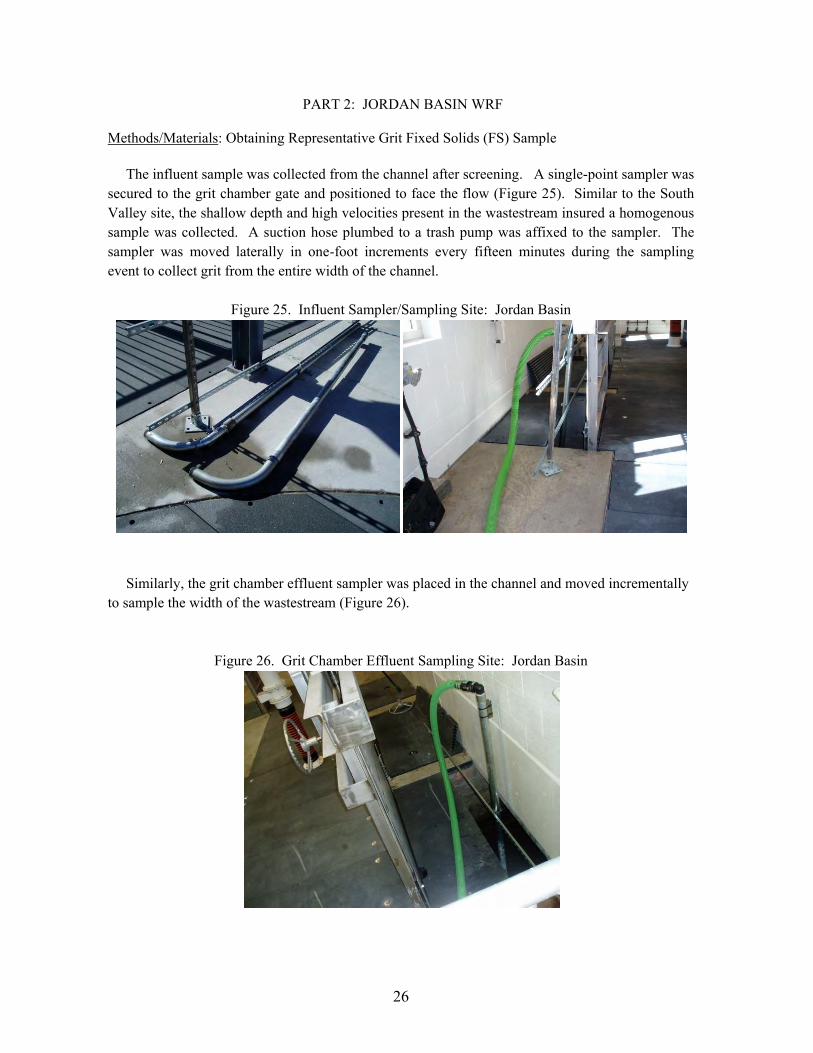
Methods/Materials: Obtaining Representative Grit Fixed Solids (FS) Sample The influent sample was collected from the channel after screening. A single-point sampler was secured to the grit chamber gate and positioned to face the flow (Figure 25). Similar to the South Valley site, the shallow depth and high velocities present in the wastestream insured a homogenous sample was collected. A suction hose plumbed to a trash pump was affixed to the sampler. The sampler was moved laterally in one-foot increments every fifteen minutes during the sampling event to collect grit from the entire width of the channel.
Figure 25. Influent Sampler/Sampling Site: Jordan Basin
Similarly, the grit chamber effluent sampler was placed in the channel and moved incrementally to sample the width of the wastestream (Figure 26).
Figure 26. Grit Chamber Effluent Sampling Site: Jordan Basin
27
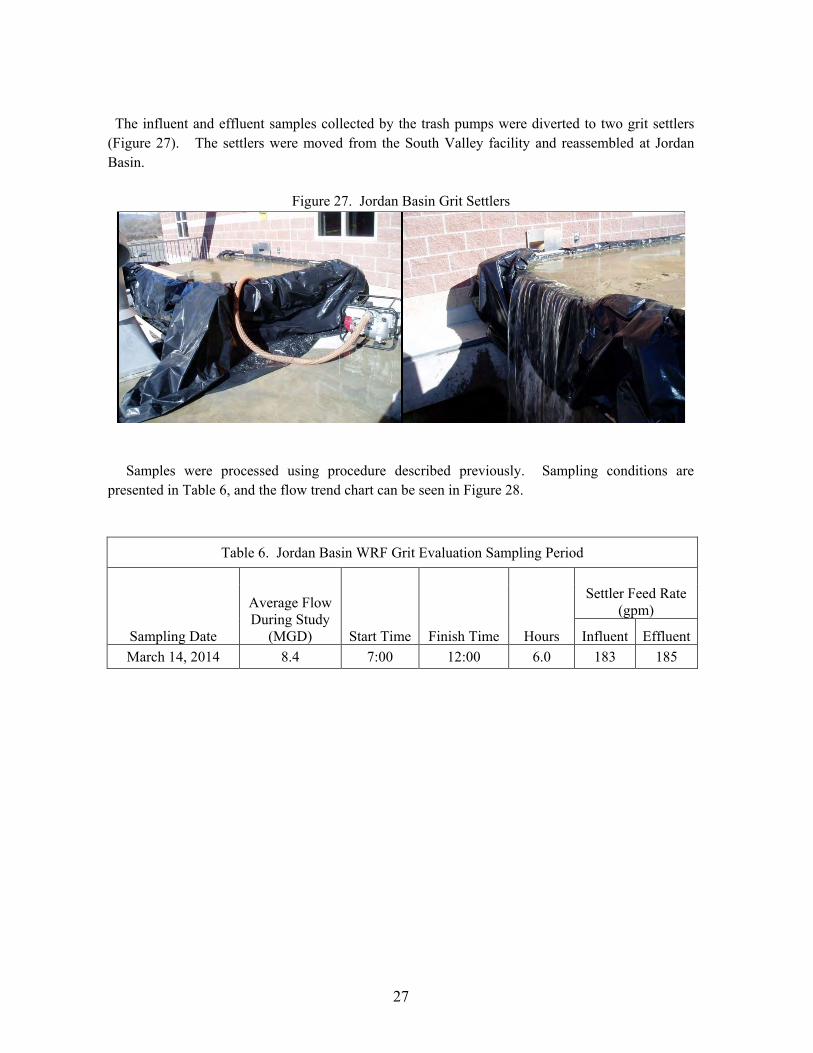
The influent and effluent samples collected by the trash pumps were diverted to two grit settlers (Figure 27). The settlers were moved from the South Valley facility and reassembled at Jordan Basin.
Figure 27. Jordan Basin Grit Settlers
Samples were processed using procedure described previously. Sampling conditions are presented in Table 6, and the flow trend chart can be seen in Figure 28.
Table 6. Jordan Basin WRF Grit Evaluation Sampling Period
Sampling Date
Average Flow During Study
(MGD) Start Time Finish Time Hours
Settler Feed Rate
(gpm)
Influent Effluent March 14, 2014 8.4 7:00 12:00 6.0 183 185

28
Figure 28. Jordan Basin WRF Flow Trend Chart: March 14, 2014
.

29
Jordan Basin Grit Chamber Performance Evaluation Performance was determined by comparing fractional concentrations of grit entering and exiting the grit chamber. Figures 29 and 30 plot the daily fractional and cumulative distributions, and Figure 31 plots fractional concentrations. From Figures 29 and 30, 86.2% of influent grit was larger than 297-microns physical size, while 13.8% of grit was smaller than 297-microns. Concentrations of influent grit were 28.7 lbs/MG. Figure 29. Fractional Distribution of Grit at the Jordan Basin WRF: March 14, 2014
Figure 30. Cumulative Distribution of Grit at the Jordan Basin WRF: March 14, 2014

30
Figure 31. Concentrations of Grit at the Jordan Basin WRF: March 14, 2014
Table 7. Fractional Removal Efficiencies of the Jordan Basin Grit Chamber
- March 14, 2014
Size Fraction Concentration of Influent Grit FS
(lbs/MG)
Concentration of Effluent Grit FS
(lbs/MG)
Removal Efficiency
(%) >297-microns 24.72 3.74 84.9
<297-microns >210-microns 1.90 1.41 25.6
<210-microns >149-microns 0.99 0.48 51.2
<149-microns >105-microns 0.47 0.12 74.0
<105-microns >74-microns 0.27 0.06 79.2
<74-microns >53-microns 0.32 0.03 89.7
Total 28.67 5.85 79.6
Total performance for the unit was 79.6%, and 79.5% for material 105-microns and larger.
31
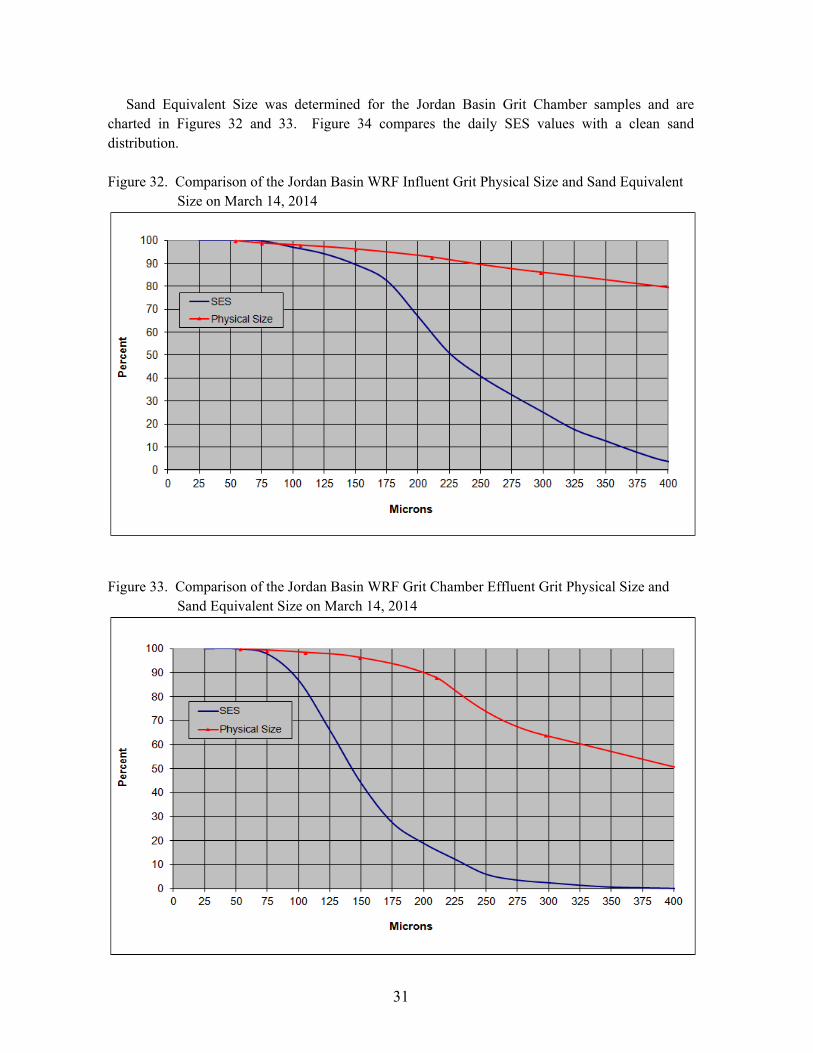
Sand Equivalent Size was determined for the Jordan Basin Grit Chamber samples and are charted in Figures 32 and 33. Figure 34 compares the daily SES values with a clean sand distribution. Figure 32. Comparison of the Jordan Basin WRF Influent Grit Physical Size and Sand Equivalent Size on March 14, 2014
Figure 33. Comparison of the Jordan Basin WRF Grit Chamber Effluent Grit Physical Size and Sand Equivalent Size on March 14, 2014

32
Figure 34. Median Size Distribution of Grit at the Jordan Basin WRF vs. a Clean Sand Distribution on March 14, 2014

33
PART 3: SETTLER COMPARISON STUDY A typical grit study requires an eight-gpm portion of the collected sample to be split from the full pump discharge. This smaller portion is sent to a 55-gallon grit settler with a one-inch hose. The objective of this portion of the grit study was to compare the distributions and quantities of grit collected from the complete flow with the split flow. Figure 35 shows a typical sampling layout, with water collected by a sampler and trash pump, and flow split to provide sample to the grit settler. The remainder is bypassed back into the wastestream. Figure 35. Typical sampling setup
Figure 36 shows the 55-gallon settler and sample splitter previously seen in Section Part 1. Rather than bypassing the excess flow, the pump bypass was collected in the large 6-foot by ten-food settlers as described in Parts 1 and 2. At the client’s request, these large settlers served as the primary settlers, and the 55-gallon settlers were used as duplicate checks. Figure 36. Grit Settler and Sample Splitter

34
The settler comparison study was conducted at the South Valley WRF and samples were processed using methods as previously described. Samples were sieved, and distributions generated for each of the settler’s contents. The large settlers were designated “Inf-Full” and “GC West-Full”. The 55-gallon settlers were designated “Inf-55”, “GC West-55”, and “GC East-55”. The East grit chamber was sampled as a check between the East and West grit chambers, and only the smaller settler was used. Distributional data is plotted below in Figures 37-40, and fractional concentrations are plotted in Figures 41 and 42. Figure 37. Fractional Distribution of Grit at the South Valley WRF: March 11, 2014 Settler Study
Figure 38. Fractional Distribution of Grit at the South Valley WRF: March 12, 2014 Settler Study

35
Figure 39. Cumulative Distribution of Grit at the South Valley WRF: March 11, 2014 Settler Study
Figure 40. Cumulative Distribution of Grit at the South Valley WRF: March 12, 2014 Settler Study

36
Figure 41. Concentrations of Grit at the South Valley WRF: March 11, 2014 Settler Study
Figure 42. Concentrations of Grit at the South Valley WRF: March 12, 2014 Settler Study
Physical size distributions were similar for influent and effluent samples. However, concentrations of grit were higher for influent samples collected by the large settler. Feed rates for the large settlers were significantly lower than the 55-gallon settlers, which resulted in more material in the final decanted samples. This was opposite for west grit chamber effluent samples, but may not be significant due to low concentrations. Tables 8 and 9 compare the influent and west grit chamber effluent settler characteristics. Feed rates listed for the large settlers are given in gpm and an “equated feed rate” in parentheses for comparison with the 55-gallon settles.

37
Table 8. Influent Settler Comparison at the South Valley WRF
March 11, 2014 March 12, 2014
Influent – Full
Influent – 55 gallon
Influent – Full
Influent – 55 gallon
Feed Rate (gpm) 114.81 (6.01) 8.34 114.81 (6.01) 7.86
Concentration (lbs/MG) 89.40 72.23 85.46 63.45
Table 9. West Grit Chamber Effluent Settler Comparison at the South Valley WRF
March 11, 2014 March 12, 2014
Effluent – Full
Effluent – 55 gallon
Effluent – Full
Effluent – 55 gallon
Feed Rate (gpm) 107.57 (5.63) 8.01 107.57 (5.63) 8.13
Concentration (lbs/MG) 9.61 13.40 5.21 10.64
DISCUSSION OF SETTLER COMPARISON STUDY Grit Distribution – The distributions produced by both settler designs were similar and fall within an acceptable range of error. Grit Concentration – Concentrations of influent grit were significantly higher for the larger settler. This may be a result of lower feed rates allowing more material to settle in the tank. Another possibility is the sample splitter design. From Figure 36, the splitter is not a true wye, but rather an offset stream. The majority of flow is allowed to travel a straight line to the large settler, while the split portion is reduced to a one-inch line. This may cause enough resistance to divert more material towards the larger settler. This was not observed with the grit chamber effluent samples, possibly due to smaller material offering less resistance to the flow. Thirdly, the randomness of collecting large material is eliminated by the larger settlers retaining all of the material rather than only a small portion. Settler Design – While the large settlers offer the advantage of collecting grit from the entire sample, they have several limitations. First, they require a large area to assemble and may not fit in every sampling site. The area must also possess a channel to receive the settler discharge. The large size also places limits on the sample pump, with settler feed rates relying on the volume produced by the pump. There is no way to adjust feed rates at the settler, and determining overflow rates by measuring flow over the weir may be subjective. The smaller 55-gallon settler with
38
adjustable flow operates at a consistent flow rate regardless of pump speed. Additionally, the sample entry points of the large settle can be improved by affixing a bulkhead fitting and elbow to divert sample to the side of the tank opposite the weir to reduce the possibility of short-circuiting of grit across the settler. Because the settlers collected the entire sample, removing and processing the sample became very labor intensive. A two-inch drain was added to the large settlers prior to the Jordan Basin study, which decreased processing time. However, collecting the large volume of sample required lifting one end of the poly tarp to divert the sample to the opposite end where it was manually decanted. Future designs may include a fixed bottom and an improved method of decanting/handling of sample. The large volume of sample was also difficult to process. Processing requires rinsing of organics from the sample until only heavy organics and grit remain. Samples at the South Valley WRF were extremely heavy with organics, and processing time was significantly longer that normal. Other Considerations – The settler comparison study needs to be repeated at other locations to determine if the findings of this study are significant. The observed organic contents of samples during the South Valley trial were not typical, and adversely affected sample processing efforts. Sites with lower organic content may require less effort and subsequently less error. Additionally, different splitter configurations need to be assessed to determine if accuracy and homogeneity can be improved. Samples collected by the large settlers were extremely large, yet only a small portion of the sample was passed through the sieves. In most cases, when using a 55-gallon settler, the entire collected sample is passed through the sieves. Only occasionally is the sieved portion split from the collected sample, and this is generally the result of a high proportion of heavy organics that cannot be rinsed from the sample. When using the large settlers, splitting of the samples will be a requirement. Future studies are needed to determine the accuracy of splitting samples, and may require sieving the entire sample to determine if sieving only a single split sample is representative.

39
Conclusions South Valley WRF
1. At the South Valley WRF between 94.5 and 94.9% of influent grit was larger than 297-microns physical size, while between 5.1 and 5.5% of grit was smaller than 297-microns. (Figures 9 and 10)
2. The total influent grit concentrations were 89.4 lbs/MG March 11 and 85.5 lbs/MG on
March 12. (Figure 11)
3. Based on settling velocity data collected from the influent grit, a grit removal system design based on 150-micron Sand Equivalent Size would collect between 84.4 and 84.9% of influent grit while a 100-micron SES system would improve to between 97.4 and 98.1% efficiency. (See Table 3)
4. Total removal efficiencies for the West Grit Chamber were 89.2% and 93.9%. (Tables 4 and 5)
Jordan Basin WRF
1. At the South Valley WRF 86.2% of influent grit was larger than 297-microns physical size, while 13.8% of grit was smaller than 297-microns (Figures 29 and 30)
2. The total influent grit concentration was 28.7 lbs/MG entering the facility on March 14.
(Figure 31)
3. Based on settling velocity data collected from the influent grit, a grit removal system design based on 150-micron Sand Equivalent Size would collect 44.1% of influent grit while a 100-micron SES system would improve to 87.1% efficiency. (Figure 31)
4. Total performance for the unit was 79.6%, and 79.5% for material 105-microns and larger as specified by the manufacturer. (Table 7).
Settler Comparison
1. Distributions of samples were similar between the large settlers and the 55-gallon settlers (Figures 37-40).
2. Concentrations of influent grit were higher for samples collected by the large settlers, but differences were insignificant for grit chamber effluent samples (Figures 41 and 42).
3. Future studies are needed to determine whether using the large settler to collect grit from
the entire sample is more accurate than supplying only a portion to a smaller 55-gallon settler.

40
4. Bibliography
Clesceri, L., Greenberg, A. and Eaton, A., “Standard Methods for the Examination of Water and Wastewater”, 20th Edition, 1998, American Public Health Association, Washington, DC
Tchobanoglous, G., Burton, F.L. and Stensel, H.D., “Wastewater Engineering: Treatment and Reuse”, 4th Edition, 2003. TATA McGraw-Hill
41
Appendix A – Raw Data A-1 Concentration Calculation Spreadsheet 42 A-2 Solids Analysis Bench Sheets 43 A-3 Grit Concentration Calculation Bench Sheet 46 A-4 SES Data Analysis 47 A-5 SES Charts 53 A-6 SES Chart Analysis 56 A-7 Median SES versus Median Physical Size 59
42
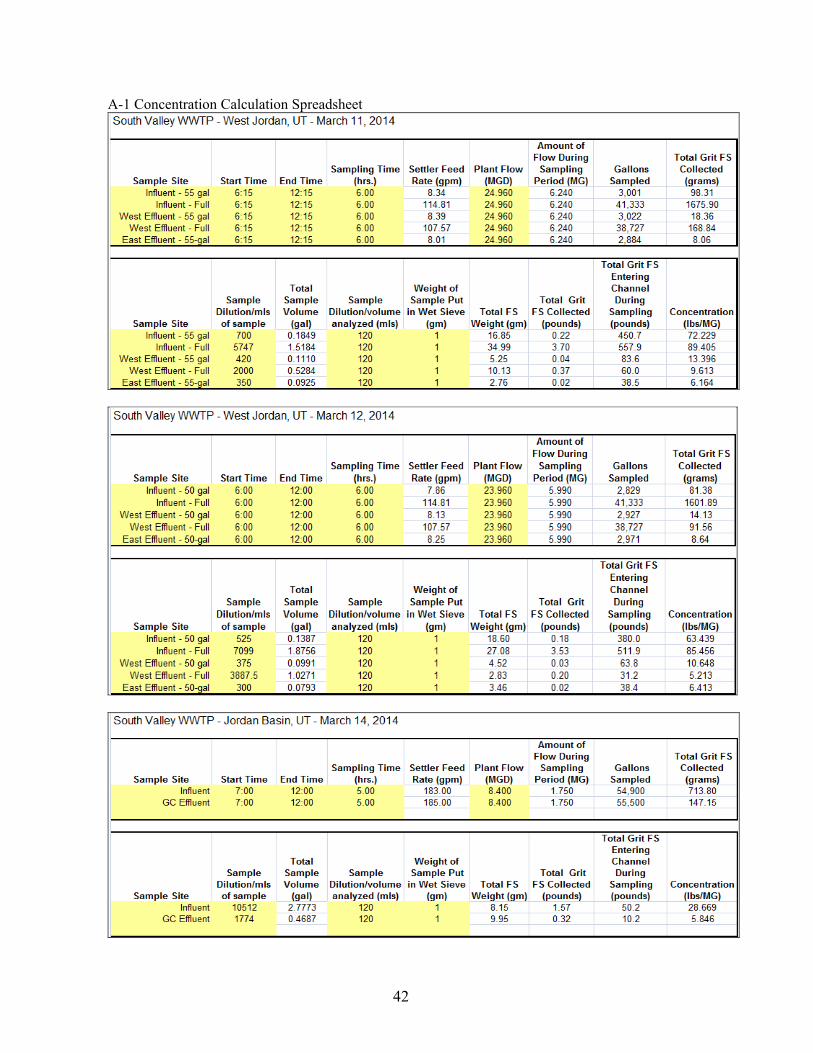
A-1 Concentration Calculation Spreadsheet

43
A-2 Solids Analysis Bench Sheets
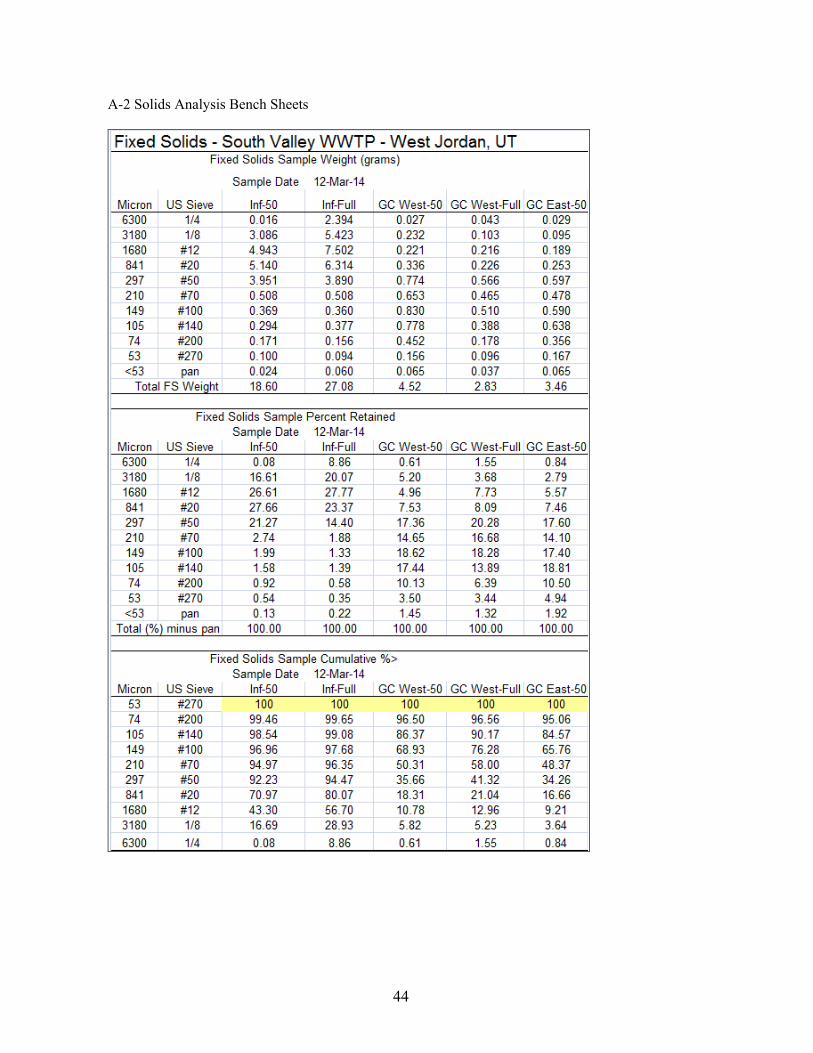
44
A-2 Solids Analysis Bench Sheets

45
A-2 Solids Analysis Bench Sheets

46
A-3 Fractional Grit Concentration Calculation Bench Sheet

47
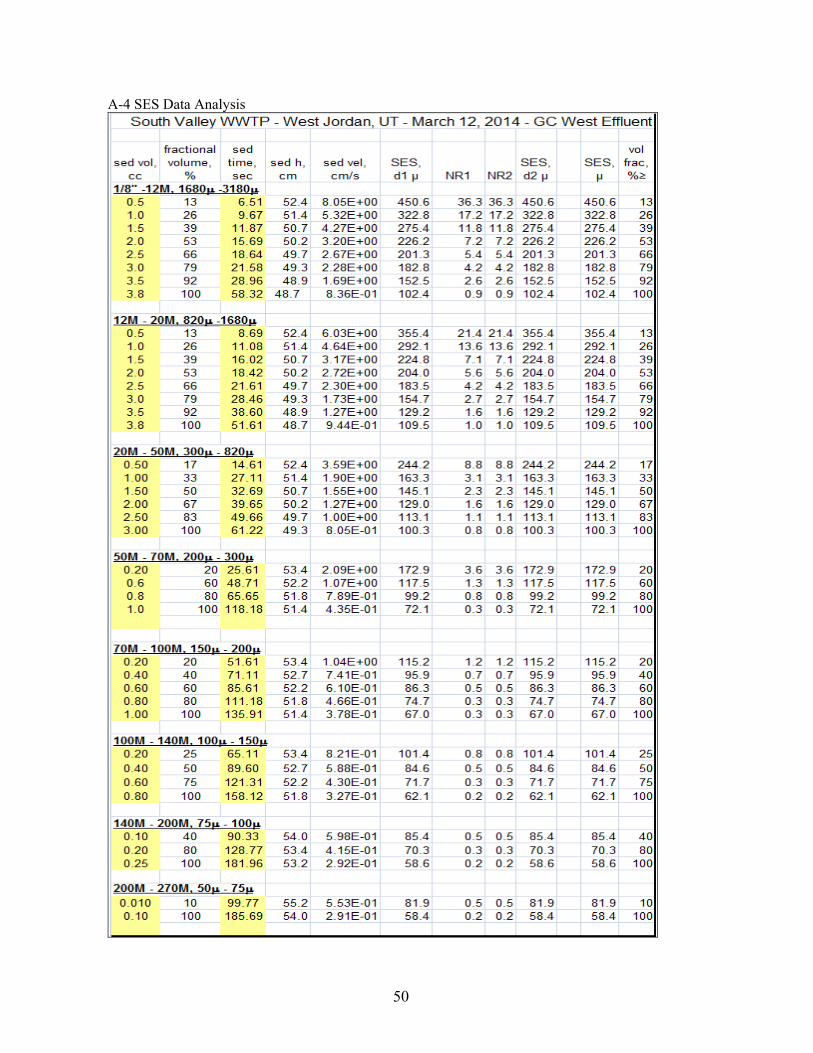
A-4 SES Data Analysis

48
A-4 SES Data Analysis

49
A-4 SES Data Analysis
50
A-4 SES Data Analysis

51
A-4 SES Data Analysis
52
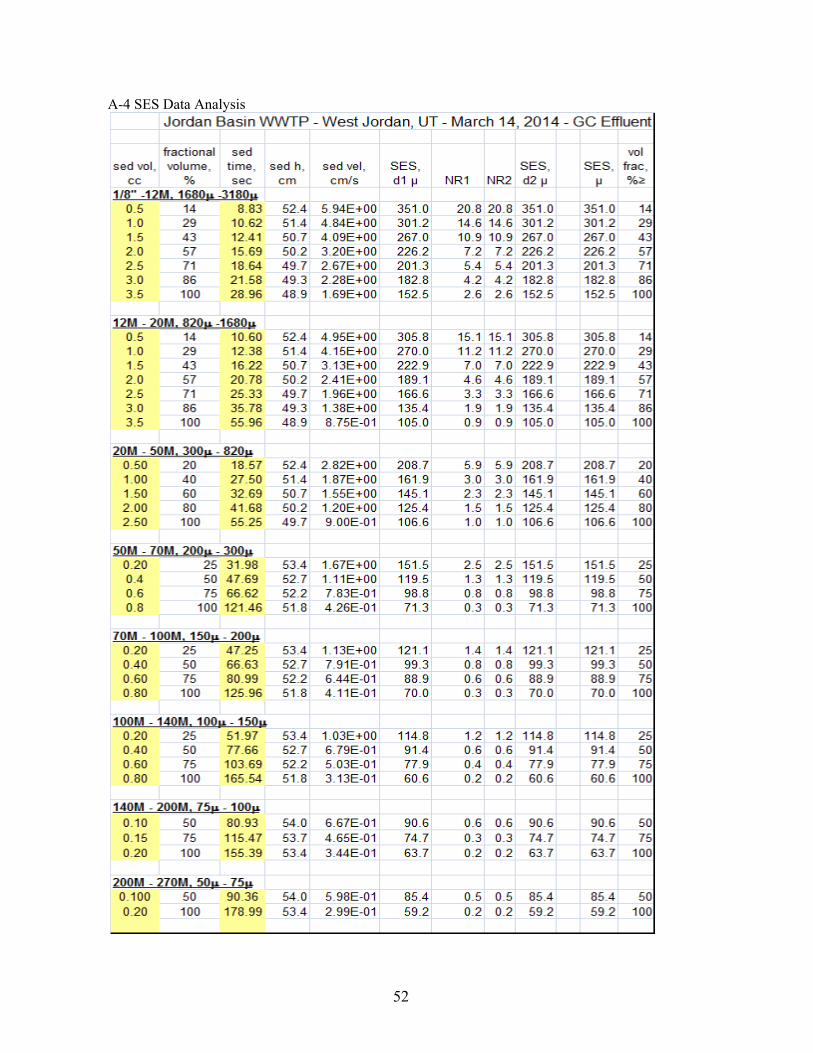
A-4 SES Data Analysis
53
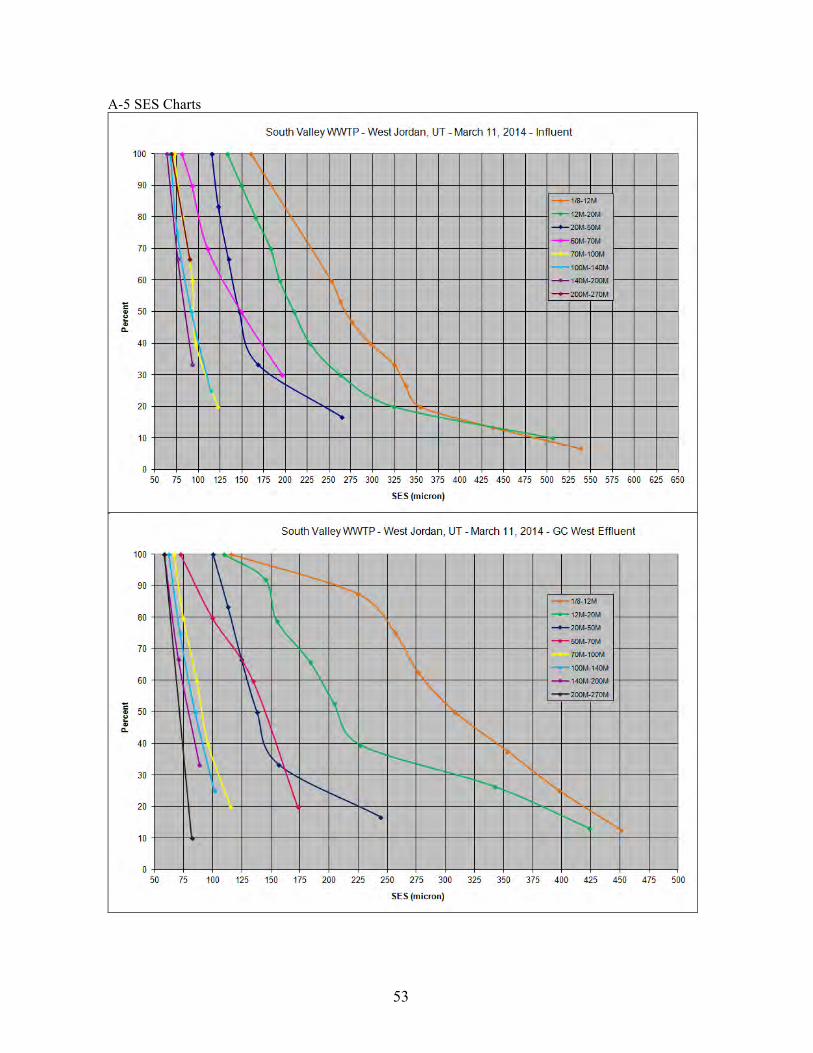
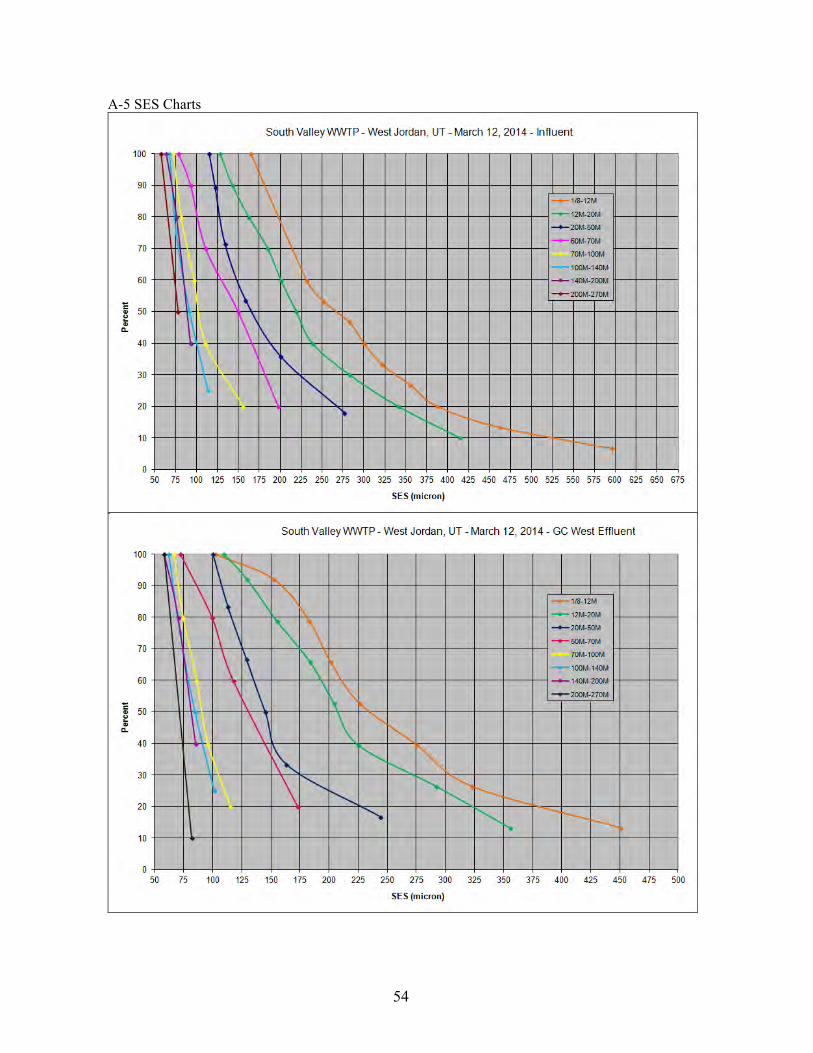
A-5 SES Charts
54
A-5 SES Charts

55
A-5 SES Charts
56
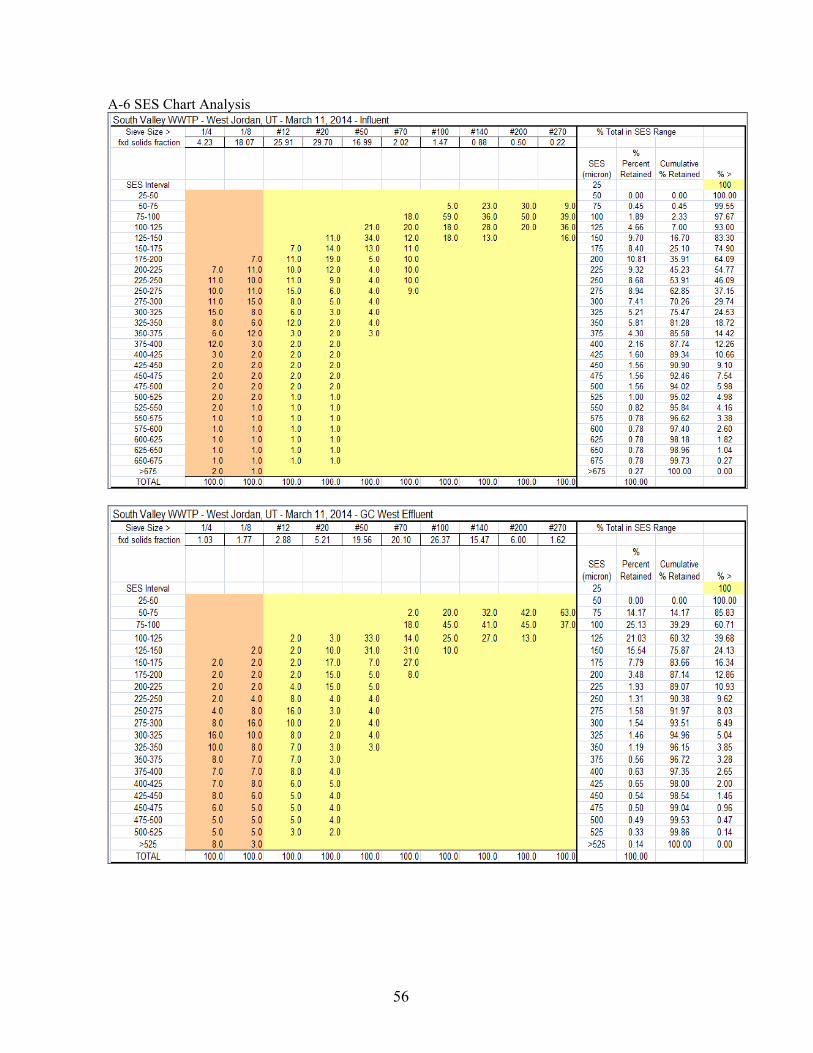
A-6 SES Chart Analysis

57
A-6 SES Chart Analysis

58
A-6 SES Chart Analysis

59
A-7 Median SES Versus Median Physical Size Data

60
Appendix B – Calculations
Drag Coefficient (Cd) 24/NR + 3/sqrt NR + 0.34 Reynolds number (NR) (settling velocity of particle)(diameter of particle)/kinematic viscosity Stoke’s Law Settling velocity (m/s) = g(sgp – 1)d2
p/18v Where g = acceleration due to gravity (9.81 m/s2) sgp = specific gravity of particle
dp = diameter of particle v = kinematic viscosity (m2/s) % Total Solids (grams dry weight/grams wet weight)*100 % Total Volatile Solids [(grams dry weight - grams ash weight)/ grams dry weight]*100

APPENDIXB
SVWRFGRITTESTINGPROTOCOL(1)

Page 1 of 3
REQUEST FOR PROPOSAL
South Valley Water Reclamation Facility Grit Sampling and Testing Program
February 27, 2014
BACKGROUND The South Valley Water Reclamation Facility located in West Jordan, Utah is considering upgrades to its raw sewage grit removal, handling and disposal systems to reduce accumulation of these materials in the bioreactors. This accumulation negatively impacts the aeration, mixing and hydraulic and biological performance of the bioreactors and requires expensive periodic downtime for cleaning of these basins to remove the grit. The proposed grit sampling and analysis program has the following goals:
1. Characterize and quantify the raw sewage grit load entering the plant headworks and exiting with the effluent from the aerated grit chambers at SVWRF.
2. Determine the corresponding grit removal performance of the aerated grit chambers. 3. Characterize and quantify the raw sewage grit load entering the Jordan Basin Water
Reclamation Facility headworks and exiting with the effluent from the Pista™ grit unit at JBWRF.
4. Determine the corresponding grit removal performance of the existing Pista™ unit. Results from Items 1 and 2 will reveal the removal performance of the SVWRF aerated grit basins and should help justify continuing efforts to improve operations by installing new technologies and/or applying other upgrades to the basins. Results from Items 3 and 4 will indicate the grit removal performance of the Pista™ system at JBWRF and help determine the suitability of this technology as a potential retrofit at SVWRF. PROTOCOL Schedule Written proposals to perform the work must be received electronically by SVWRF no later than 5:00 PM MST, Thursday, March 6, 2014.
Page 2 of 3
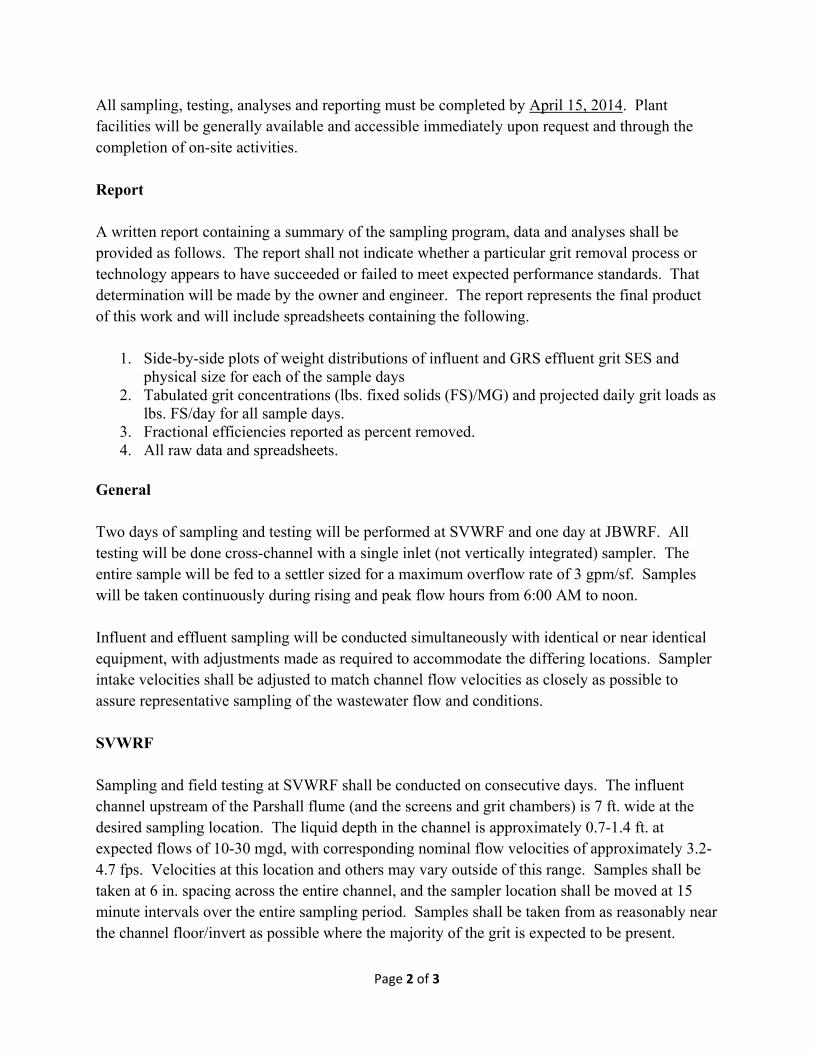
All sampling, testing, analyses and reporting must be completed by April 15, 2014. Plant facilities will be generally available and accessible immediately upon request and through the completion of on-site activities. Report A written report containing a summary of the sampling program, data and analyses shall be provided as follows. The report shall not indicate whether a particular grit removal process or technology appears to have succeeded or failed to meet expected performance standards. That determination will be made by the owner and engineer. The report represents the final product of this work and will include spreadsheets containing the following.
1. Side-by-side plots of weight distributions of influent and GRS effluent grit SES and physical size for each of the sample days
2. Tabulated grit concentrations (lbs. fixed solids (FS)/MG) and projected daily grit loads as lbs. FS/day for all sample days.
3. Fractional efficiencies reported as percent removed. 4. All raw data and spreadsheets.
General Two days of sampling and testing will be performed at SVWRF and one day at JBWRF. All testing will be done cross-channel with a single inlet (not vertically integrated) sampler. The entire sample will be fed to a settler sized for a maximum overflow rate of 3 gpm/sf. Samples will be taken continuously during rising and peak flow hours from 6:00 AM to noon. Influent and effluent sampling will be conducted simultaneously with identical or near identical equipment, with adjustments made as required to accommodate the differing locations. Sampler intake velocities shall be adjusted to match channel flow velocities as closely as possible to assure representative sampling of the wastewater flow and conditions. SVWRF Sampling and field testing at SVWRF shall be conducted on consecutive days. The influent channel upstream of the Parshall flume (and the screens and grit chambers) is 7 ft. wide at the desired sampling location. The liquid depth in the channel is approximately 0.7-1.4 ft. at expected flows of 10-30 mgd, with corresponding nominal flow velocities of approximately 3.2-4.7 fps. Velocities at this location and others may vary outside of this range. Samples shall be taken at 6 in. spacing across the entire channel, and the sampler location shall be moved at 15 minute intervals over the entire sampling period. Samples shall be taken from as reasonably near the channel floor/invert as possible where the majority of the grit is expected to be present.

Page 3 of 3
The flow is subsequently divided between two parallel aerated grit chambers, each equipped with a 7 ft. wide rectangular contracted effluent weir. The depth of flow across both weirs, assuming a 50:50 split, is approximately 0.8-1.6 ft. at 10-30 mgd total flowrate, at nominal horizontal overflow velocities of approximately 1.4-2.1 fps. Sampling shall take place approximately 12 in. upstream and 6 in. below the water surface at the center and quarter points of each weir for a total of six sample locations, for an hour at each location over the entire sampling period. JBWRF The influent and effluent channels for the Pista™ unit at SVWRF are both 5 ft. wide with an approximate flow depth of 1.25 ft. and nominal velocity of approximately 2.1 fps at a flowrate of approximately 8.5 mgd. The flowrate at this plant ranges diurnally at 5-10 mgd with corresponding depth and velocity variations. Influent and effluent samples shall be taken at 6 in. spacing across both channels, and the sampler location shall be moved at 15 minute intervals over the entire sampling period. Samples shall be taken from as reasonably near the channel floor/invert as possible where the majority of the grit is expected to be present. Testing Grit characterization testing shall include wet sieving, settling velocity determinations and SES determinations on site. The settling velocities of all identified particle sizes shall be determined. Dry sieving shall be performed at on offsite location on the previously wet-sieved material after is has been collected and dried. SVWRF grit contains significant amounts of food and other organic and inorganic wastes including egg shells, seeds, kernels, grounds, etc. that have relatively low specific gravities and which vary in size and shape. It is desired to characterize these particles as well as heavier and/or smaller ones, and to ultimately remove them from the process flow in the grit basins before they enter the bioreactor (since there are no primary clarifiers to capture them). The sampling methodology should capture and not dispose of these particles. The following approach shall be utilized for both wet and dry sieving.
1. Screen all grit using and US #3 mesh sieve and dispose of all retained material. 2. Screen all remaining grit on the following sieves: US #8 mesh, US #16 mesh, US #30
mesh, US #50 mesh, US #100 mesh, US #140 mesh and US #200 mesh Respective particles for the above mesh sizes are 6,730 (0.265 in.), microns, 2,380 microns 1,190 microns, 595 microns, 297 microns, 149 microns, 105 microns, 74 microns.
3. Measure and report the weight retained on each sieve size.

APPENDIXC
MARCH2015BDAREPORT(PUMPSUMPANDCLASSIFIERRETURNS)
Grit Characterization Study South Valley Water Reclamation Facility
West Jordan, UT
Prepared for:
South Valley WRF
7495 S. 1300 W.
West Jordan, UT 84084
Prepared by:
Black Dog Analytical, LLC
2402 E. 2659th Road
Marseilles, IL 61341
March 2015

GRIT CHARACTERIZATION STUDY – SOUTH VALLEY WRF MARCH 2015
ii
TABLE OF CONTENTS
1.0 INTRODUCTION AND OBJECTIVES ............................................................... 1-1
2.0 METHODS AND MATERIALS .......................................................................... 2-2
2.1 Obtaining Representative Grit Fixed Solids (FS) Sample ............................. 2-2
2.2 Determination of Grit Particle Distribution .................................................... 2-5
2.3 Determination of Sand Equivalent Size (SES) Distribution .......................... 2-6
2.4 Sand Equivalent Size Description ................................................................... 2-6
2.5 Solids Analysis ................................................................................................. 2-7
3.0 DISCUSSION OF RESULTS: GRIT SUMP PIT ............................................... 3-8
3.1 Distributional Data ........................................................................................... 3-8
3.2 Settling Velocity Data ..................................................................................... 3-10
4.0 DISCUSSION OF RESULTS: CLASSIFIER EFFLUENT .............................. 4-13
4.1 Distributional Data ......................................................................................... 4-13
4.2 Settling Velocity Data ..................................................................................... 4-15
5.0 DISCUSSION OF RESULTS: DAILY CHARTS ............................................. 5-17
5.1 Distributional Data ......................................................................................... 5-17
5.2 Settling Velocity Data ..................................................................................... 5-21
6.0 CONCLUSIONS .............................................................................................. 6-22
7.0 BIBLIOGRAPHY ............................................................................................. 7-23
LIST OF FIGURES
Figure 2.1 Grit Sump Pit Sampling Site .............................................………………………………... 2-2 Figure 2.2 Classifier Effluent Sampling Site…………………………………….…………….………....…… 2-3 Figure 2.3 Classifier Effluent Sampling Pump ………………………………………………………….….... 2-3

GRIT CHARACTERIZATION STUDY – SOUTH VALLEY WRF MARCH 2015
iii
Figure 2.4 PVC Splitter and Valve …………………………….…………………………………………...….….. 2-4 Figure 2.5 Grit Settler………………. ……………………………………………………………………………….… 2-4 Figure 2.6 Modified Imhoff Cone for SES Measurements …..………………………………………….. 2-6 Figure 2.7 Physical Size versus Sand Equivalent Size: Cumulative Distributions ………….… 2-7 Figure 3.1 Fractional Distribution of Grit at the South Valley WRF: Grit Sump Pit Site …….. 3-8 Figure 3.2 Cumulative Distribution of Grit at the South Valley WRF: Grit Sump Pit Site ….. 3-9 Figure 3.3 Concentrations of Grit at the South Valley WRF: Grit Sump Pit Site ……..…..…..… 3-9 Figure 3.4 Comparison of the South Valley WRF Grit Sump Pit Physical Size and Sand Equivalent Size: 3 Mar 2015 …..……………………………………………………………….. 3-11 Figure 3.5 Comparison of the South Valley WRF Grit Sump Pit Physical Size and Sand Equivalent Size: 4 Mar 2015 …………………………………………………………..……….. 3-11 Figure 3.6 Median Size Distribution of South Valley WRF Nancy Creek PS Grit vs. a Clean Sand Distribution ..……………………………………………………………………………………. 3-12 Figure 4.1 Fractional Distribution of Grit at the South Valley WRF: Classifier Effluent ..... 4-13 Figure 4.2 Cumulative Distribution of Grit at the South Valley WRF: Classifier Effluent .. 4-14 Figure 4.3 Concentrations of Grit at the South Valley WRF: Classifier Effluent ……………. 4-14 Figure 4.4 Comparison of the South Valley WRF Classifier Effluent Grit Physical Size and Sand Equivalent Size: 3 Mar 2015 …………………..………….…………………………… 4-15 Figure 4.5 Comparison of the South Valley WRF Classifier Effluent Grit Physical Size and Sand Equivalent Size: 4 Mar 2015 …………………………..……………..……………….. 4-16 Figure 4.6 Median Size Distribution of South Valley WRF Classifier Effluent Grit vs. a Clean Sand Distribution ..………………………………………………………………………..………….. 4-16 Figure 5.1 Fractional Distribution of Grit at the South Valley WRF: 3 March 2015 .….….. 5-17 Figure 5.2 Fractional Distribution of Grit at the South Valley WRF: 4 March 2015 .….….. 5-18 Figure 5.3 Cumulative Distribution of Grit at the South Valley WRF: 3 March 2015 …..… 5-18 Figure 5.4 Cumulative Distribution of Grit at the South Valley WRF: 4 March 2015 …..… 5-19 Figure 5.5 Concentrations of Influent Grit at the South Valley WRF: 3 March 2015 ..…… 5-19 Figure 5.6 Concentrations of Influent Grit at the South Valley WRF: 4 March 2015 ..…… 5-20 Figure 5.7 Median Size Distribution of Grit at the South Valley WRF vs. a Clean Sand Distribution: 3 Mar 2015 .……………………………………………………………..……….…. 5-21 Figure 5.8 Median Size Distribution of Grit at the South Valley WRF vs. a Clean Sand Distribution: 4 Mar 2015 .……………………………………………………………..……….…. 5-21

GRIT CHARACTERIZATION STUDY – SOUTH VALLEY WRF MARCH 2015
iv
LIST OF TABLES
Table 2.1 Sieve Size Equivalents ……………………………………………………………………………….… 2-5 Table 3.1 South Valley WRF Sampling Period: Grit Sump Pit ……….………..………………….….. 3-8 Table 3.2 Predicted Removal Efficiencies (%) of a System Designed to Remove Grit of a Specific SES at the South Valley WRF: Grit Sump Pit Site ………………………….… 3-10 Table 4.1 South Valley WRF Sampling Period: Classifier Effluent …………………………..…… 4-13
LIST OF APPENDICES
Appendix A Raw Data A-1 Concentration Calculation Spreadsheet A-2 Solids Analysis Bench Sheets A-3 Grit Concentration Calculation Bench Sheet A-4 SES Data Analysis A-5 SES Charts A-6 Median SES versus Median Physical Size
Appendix B Calculations
GRIT CHARACTERIZATION STUDY – SOUTH VALLEY WRF MARCH 2015
v
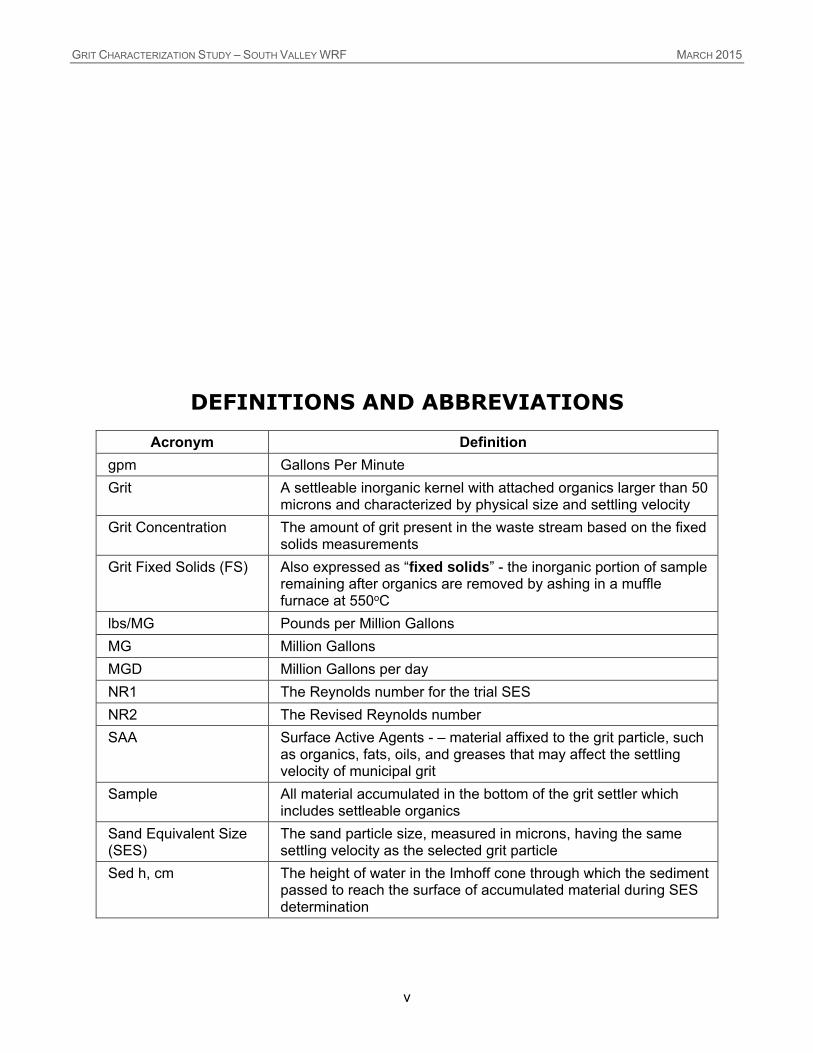
DEFINITIONS AND ABBREVIATIONS
Acronym Definition
gpm Gallons Per Minute Grit A settleable inorganic kernel with attached organics larger than 50
microns and characterized by physical size and settling velocity Grit Concentration The amount of grit present in the waste stream based on the fixed
solids measurements Grit Fixed Solids (FS) Also expressed as “fixed solids” - the inorganic portion of sample
remaining after organics are removed by ashing in a muffle furnace at 550oC
lbs/MG Pounds per Million Gallons MG Million Gallons MGD Million Gallons per day NR1 The Reynolds number for the trial SES NR2 The Revised Reynolds number SAA Surface Active Agents - – material affixed to the grit particle, such
as organics, fats, oils, and greases that may affect the settling velocity of municipal grit
Sample All material accumulated in the bottom of the grit settler which includes settleable organics
Sand Equivalent Size (SES)
The sand particle size, measured in microns, having the same settling velocity as the selected grit particle
Sed h, cm The height of water in the Imhoff cone through which the sediment passed to reach the surface of accumulated material during SES determination

GRIT CHARACTERIZATION STUDY – SOUTH VALLEY WRF MARCH 2015
vi
Sed Time, sec The time required for sediment to reach the recorded volume during SES determination
Sed. Vol., cc Sedimentation Volume (cc or ml) – The amount of material that settles in the Imhoff Cone during SES determinations
SES, dl, u Trial Sand Equivalent Size, in microns VIS Vertically Integrated Sampler Vol Frac, % The cumulative sedimentation percentage occurring during SES
determination WRF Water Reclamation Facility

GRIT CHARACTERIZATION STUDY – SOUTH VALLEY WRF MARCH 2015
1-1
1.0 INTRODUCTION AND OBJECTIVES
The South Valley Water Reclamation Facility (WRF) in West Jordan, UT is assessing the quantities and characteristics of grit and large settleable organic material entering the bioreactors. Data collected during this study will identify the source of material settling in the bioreactors, and help determine future remedies for reducing deposition.
In conventional grit removal system design, grit has commonly been treated as clean sand with a specific gravity of 2.65. Metcalf and Eddy’s Wastewater Engineering: Treatment and Reuse (standard textbook) says “Grit consists of sand, gravel, cinders, or other heavy materials that have specific gravities or settling velocities considerably greater than those of organic particles”. These inorganic solids are often associated with Surface Active Agents (SAA) that include fats, oils, greases, and other organic materials can lower their effective specific gravity to 1.3 (Tchobanoglous 2003). The shape and composition of grit and inert solids also greatly affects settling velocities. Material with similar specific gravities may have very different settling velocities due to the shape of the particle.
When determining quantities of grit during this study, grit will be defined as settleable inorganic material larger than 50 microns. Settling velocities, attached organics and SAA has been considered during the on-site laboratory analyses. The settling velocity is expressed as the Sand Equivalent Size (SES), which is the sand particle size having the same settling velocity as the more buoyant grit particle. Materials less than 50 microns in size have been considered silt or clay and thus excluded from the data.
Objectives
The purpose of this study was to determine the amounts and characteristics of grit from:
- Grit sump pit
- Combined classifier effluent/weir overflow

GRIT CHARACTERIZATION STUDY – SOUTH VALLEY WRF MARCH 2015
2-2
2.0 METHODS AND MATERIALS
2.1 Obtaining Representative Grit Fixed Solids (FS) Sample
The volume and characteristics of grit received at wastewater treatment facilities can vary widely depending on the characteristics of the collection system, weather conditions, septic waste haulers, and industrial activities. The analytical procedures used in compiling these data take into account and compensate for the non-homogeneity of the grit.
The Grit Sump Pit sample was collected by securing a single-point sampler in the wastestream (Figure 2.1). Due to the shallow, turbulent condition present in the wastestream, it was determined that a single-point sampler was sufficient to collect a homogenous portion. The sampler was plumbed to a two-inch gas powered trash pump and wastewater was drawn continuously by the pump throughout the study period. Flow exiting the trash pump was returned through an adjacent channel cover.
Figure 2.1 Grit Sump Pit Sampling Site
Classifier Effluent samples were collected by placing a plastic garbage receptacle under the discharge piping prior to returning to the influent Channel. A bucket was secured to the inside of the receptacle to reduce turbulence. A six-inch hole was cut in the bottom of the vessel to return the discharge to the wastestream. (Figure 2.2) A small electric peristaltic pump was used to collect a homogenous sample from the bottom of the receptacle in a location that provided sufficient mixing without producing an abundance of air (Figure 2.3). On March 3, the classifiers were operated under their normal sequence, running for 30 minutes and off for 90 minutes. Classifiers were run continuously starting at 8 am on March 4 after the first sequence had occurred.

GRIT CHARACTERIZATION STUDY – SOUTH VALLEY WRF MARCH 2015
2-3
Figure 2.2 Classifier Effluent Sampling Site
Figure 2.3 Classifier Effluent Sampling pump
A portion of the samples collected by the trash pumps was diverted to grit settlers. A PVC wye was used to split the flow (Figure 2.4), and a valve following the wye was used to increase flow to the settler if necessary. A one-inch hose supplied flow to the grit settler, while a single two-inch hose returned the majority of flow back to the waste stream.

GRIT CHARACTERIZATION STUDY – SOUTH VALLEY WRF MARCH 2015
2-4
Figure 2.4 PVC Splitter and Valve
Grit settlers (Figure 2.5) were constructed from 55-gallon plastic drums with an influent port and a discharge weir. Flow enters the tank and is diverted to the side with a 90o elbow to reduce the velocity and turbulence. Grit settles to the bottom of the tank, and processed wastewater exits through the discharge fitting at the top of the tank and is returned to the waste stream. 50-micron grit with a Specific Gravity of 2.65 settles at a rate of 5.02 in/min. ((g(sgp – 1)d2p/18v)*196.850 = inches/minute). In order to settle this grit, the overflow rate must be less than 3 gpm/ft2 of surface area. The settler has a diameter of 24-inches, or a surface area of 3.14 ft2 (𝐴 = 𝜋𝑟2). At 10 gpm, the overflow rate (Q/A) is 3.18 gpm/ft2, satisfying the design requirements for the settler (10gpm/3.14ft2 = 3.18 gpm/ft2). The actual settler feed rate is adjusted to between 7.5 and 8.0 gpm to insure settling of fine grit, and this is checked by timing the overflow rate of the settler with a 5-gallon bucket and stopwatch. Feed rates were checked periodically and adjusted when necessary.
Figure 2.5 Grit Settler

GRIT CHARACTERIZATION STUDY – SOUTH VALLEY WRF MARCH 2015
2-5
At the end of the sampling period, the settler contents are allowed to stand for 5 minutes. The supernatant is discarded and grit that has accumulated in the bottom of the settler is rinsed into buckets. The liquid portions of the grit samples are gradually poured off until the remaining grit/sludge samples are thick enough to obtain a homogenous mixture without grit settling out of the slurry. The entire volume of each sample is recorded before being split, if necessary, for analysis. Since bacteria will reduce the organics that are attached to the grit particles, it is important to perform the analyses on fresh grit immediately after collection. If immediate analysis is not possible, samples may be stored at 4OC for no longer than 12 hrs.
2.2 Determination of Grit Particle Distribution
A maximum 200-gram portion of the sample collected by the Grit Settler is immediately classified through a series of sieves. Wet sieving for size fractions and the SES settling tests are conducted on fresh grit from the sewer waste stream samples as the Surface Active Agents (SAA) attached to the grit kernel may substantially reduce its effective specific gravity and consequently it’s settling velocity. If the total sample size exceeds 200-grams, the sample is split and the fraction is recorded on the field bench sheet. Sieve sizes used are listed below in Table 2.1.
Table 2.1 Sieve Size Equivalents
Opening
U.S. Sieve Size
Tyler Equivalent Microns Inches
1/4 3.25 mesh 6300 0.2500 1/8 6.5 mesh 3180 0.1250 #12 10 mesh 1680 0.0661 #20 20 mesh 841 0.0331 #50 48 mesh 297 0.0117 #70 65 mesh 210 0.0083
#100 100 mesh 149 0.0059 #140 150 mesh 106 0.0041 #200 200 mesh 74 0.0029 #270 270 mesh 53 0.0021 Pan

GRIT CHARACTERIZATION STUDY – SOUTH VALLEY WRF MARCH 2015
2-6
2.3 Determination of Sand Equivalent Size (SES) Distribution
Settling tests were conducted immediately on solids passing the U.S. #20 sieve and sequentially retained on the #50, #70, #100, #140, #200, and #270 sieves. Large organics often interfere with the settling of grit on screens larger than #50. A portion of the retained material is placed into a modified Imhoff cone and filled with water (see Figure 2.6). The column is inverted and as the grit settles in the cone corresponding time and volume measurements are recorded. The objective of these measurements is to determine the size of a sand sphere having the same settling velocity as the collected grit fraction.
Figure 2.6 Modified Imhoff Cone for SES Measurements
2.4 Sand Equivalent Size Description
The settling velocity of a grit particle depends on several factors that may include surface active agents affixed to the grit particle, the composition, and the shape of the grit particle. Particles with slow settling velocities are said to be “light” and may have low specific gravity or be angular in shape. Conversely, fast settling particles are said to be “heavy” and may have high specific gravities and a rounder shape. Clean, round silica sand is known to have a Specific Gravity of 2.65. However, because grit is seldom clean or round, and may not be made of silica, settling velocities are often much slower. Like Specific Gravity, Sand Equivalent Size is a way of describing the settling characteristics of municipal grit. By definition, Sand Equivalent Size (SES) is “the clean sand particle size, measured in microns, having the same settling velocity of the collected grit particle”. For example, a 300-micron silica sand particle with a specific gravity of 2.65 will settle at a known velocity. A 300-micron grit particle composed of a different material (i.e., limestone), or a silica sand particle (2.65 SG) with a shape that is not round, will settle slower, perhaps with a
GRIT CHARACTERIZATION STUDY – SOUTH VALLEY WRF MARCH 2015
2-7
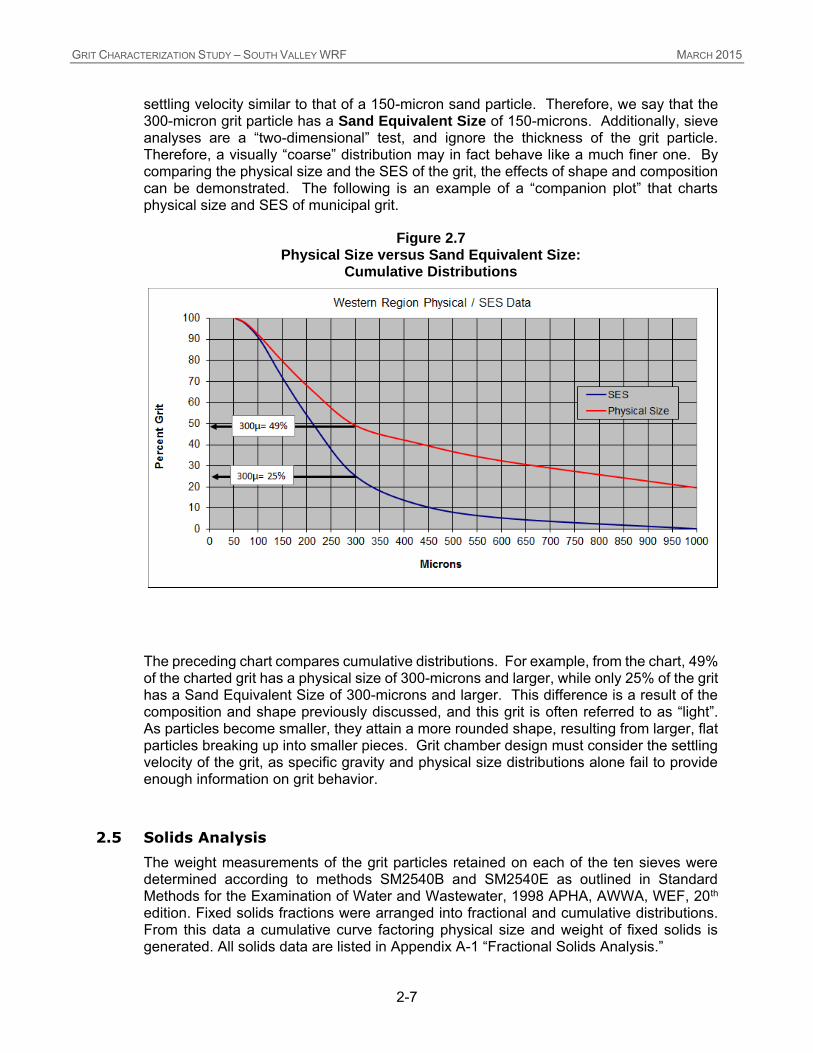
settling velocity similar to that of a 150-micron sand particle. Therefore, we say that the 300-micron grit particle has a Sand Equivalent Size of 150-microns. Additionally, sieve analyses are a “two-dimensional” test, and ignore the thickness of the grit particle. Therefore, a visually “coarse” distribution may in fact behave like a much finer one. By comparing the physical size and the SES of the grit, the effects of shape and composition can be demonstrated. The following is an example of a “companion plot” that charts physical size and SES of municipal grit.
Figure 2.7 Physical Size versus Sand Equivalent Size:
Cumulative Distributions
The preceding chart compares cumulative distributions. For example, from the chart, 49% of the charted grit has a physical size of 300-microns and larger, while only 25% of the grit has a Sand Equivalent Size of 300-microns and larger. This difference is a result of the composition and shape previously discussed, and this grit is often referred to as “light”. As particles become smaller, they attain a more rounded shape, resulting from larger, flat particles breaking up into smaller pieces. Grit chamber design must consider the settling velocity of the grit, as specific gravity and physical size distributions alone fail to provide enough information on grit behavior.
2.5 Solids Analysis
The weight measurements of the grit particles retained on each of the ten sieves were determined according to methods SM2540B and SM2540E as outlined in Standard Methods for the Examination of Water and Wastewater, 1998 APHA, AWWA, WEF, 20th edition. Fixed solids fractions were arranged into fractional and cumulative distributions. From this data a cumulative curve factoring physical size and weight of fixed solids is generated. All solids data are listed in Appendix A-1 “Fractional Solids Analysis.”

GRIT CHARACTERIZATION STUDY – SOUTH VALLEY WRF MARCH 2015
3-8
3.0 DISCUSSION OF RESULTS: GRIT SUMP PIT
Samples were collected on March 3 and 4, 2015. Sampling conditions are listed below in Table 3.1. The combined air lift pump total flow is 1400 gpm, with a reduction of 310-gpm when classifiers are in operation. Flows listed in Table 3.1 are adjusted to account for classifier operation.
Table 3.1 South Valley WRF Sampling Period: Grit Sump Pit
Sampling Date
Flow During Study
(MG) Start Time
Finish Time Hours
Settler Feed Rate
(gpm)
March 3, 2015 0.467 7:10 13:10 6.0 8.27 March 4, 2015 0.425 6:15 12:15 6.0 8.20
3.1 Distributional Data
Figures 3.1 and 3.2 plot the fractional and cumulative distributions, and 3.3 plots the fractional concentrations of grit collected from the Grit Sump Pit site.
Figure 3.1 Fractional Distribution of Grit at the South Valley WRF:
Grit Sump Pit Site

GRIT CHARACTERIZATION STUDY – SOUTH VALLEY WRF MARCH 2015
3-9
Figure 3.2 Cumulative Distribution of Grit at the South Valley WRF:
Grit Sump Pit Site
Figure 3.3 Concentrations of Influent Grit at the South Valley WRF:
Grit Sump Pit Site
GRIT CHARACTERIZATION STUDY – SOUTH VALLEY WRF MARCH 2015
3-10
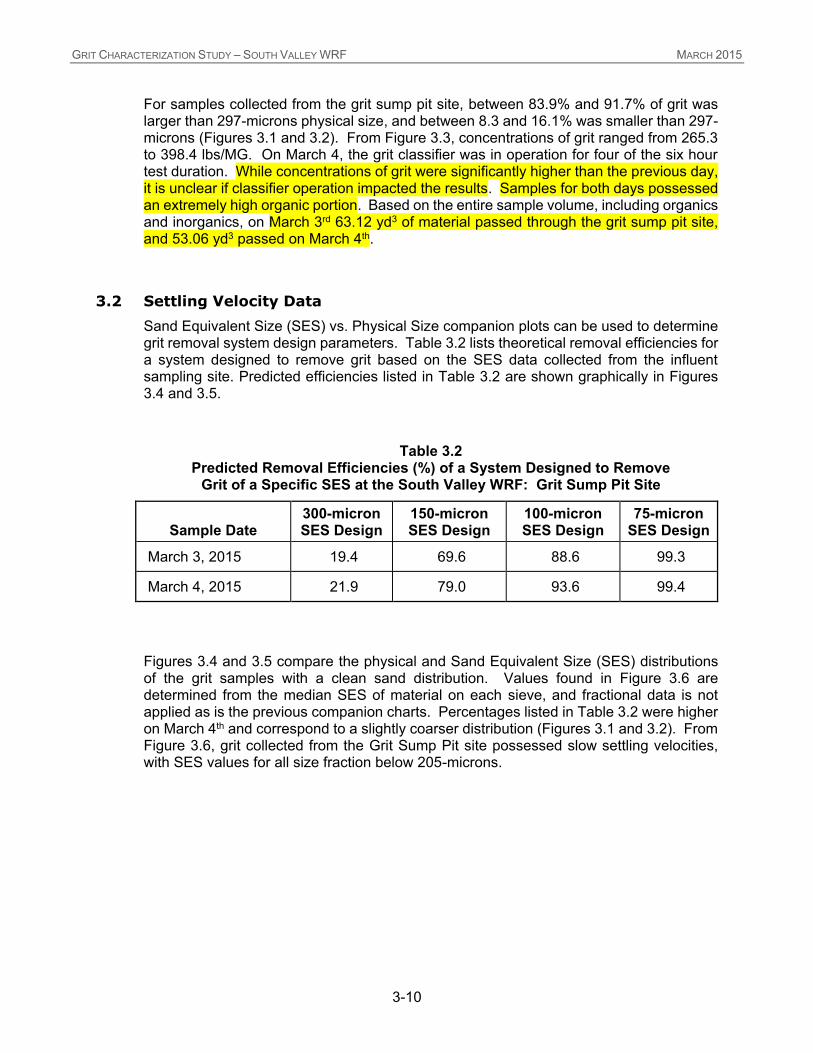
For samples collected from the grit sump pit site, between 83.9% and 91.7% of grit was larger than 297-microns physical size, and between 8.3 and 16.1% was smaller than 297-microns (Figures 3.1 and 3.2). From Figure 3.3, concentrations of grit ranged from 265.3 to 398.4 lbs/MG. On March 4, the grit classifier was in operation for four of the six hour test duration. While concentrations of grit were significantly higher than the previous day, it is unclear if classifier operation impacted the results. Samples for both days possessed an extremely high organic portion. Based on the entire sample volume, including organics and inorganics, on March 3rd 63.12 yd3 of material passed through the grit sump pit site, and 53.06 yd3 passed on March 4th.
3.2 Settling Velocity Data
Sand Equivalent Size (SES) vs. Physical Size companion plots can be used to determine grit removal system design parameters. Table 3.2 lists theoretical removal efficiencies for a system designed to remove grit based on the SES data collected from the influent sampling site. Predicted efficiencies listed in Table 3.2 are shown graphically in Figures 3.4 and 3.5.
Table 3.2 Predicted Removal Efficiencies (%) of a System Designed to Remove
Grit of a Specific SES at the South Valley WRF: Grit Sump Pit Site
Sample Date 300-micron SES Design
150-micron SES Design
100-micron SES Design
75-micron SES Design
March 3, 2015 19.4 69.6 88.6 99.3
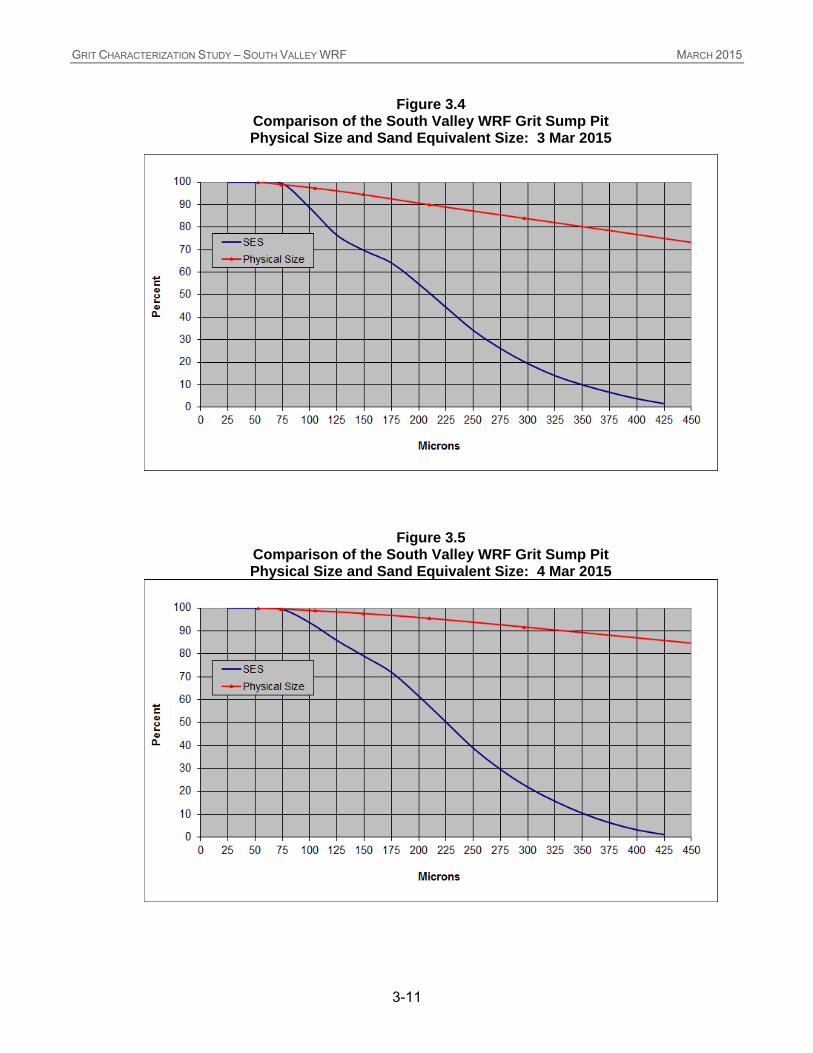
March 4, 2015 21.9 79.0 93.6 99.4 Figures 3.4 and 3.5 compare the physical and Sand Equivalent Size (SES) distributions of the grit samples with a clean sand distribution. Values found in Figure 3.6 are determined from the median SES of material on each sieve, and fractional data is not applied as is the previous companion charts. Percentages listed in Table 3.2 were higher on March 4th and correspond to a slightly coarser distribution (Figures 3.1 and 3.2). From Figure 3.6, grit collected from the Grit Sump Pit site possessed slow settling velocities, with SES values for all size fraction below 205-microns.
GRIT CHARACTERIZATION STUDY – SOUTH VALLEY WRF MARCH 2015
3-11
Figure 3.4 Comparison of the South Valley WRF Grit Sump Pit Physical Size and Sand Equivalent Size: 3 Mar 2015
Figure 3.5 Comparison of the South Valley WRF Grit Sump Pit Physical Size and Sand Equivalent Size: 4 Mar 2015

GRIT CHARACTERIZATION STUDY – SOUTH VALLEY WRF MARCH 2015
3-12
Figure 3.6 Median Size Distribution of South Valley WRF Grit Sump Pit
Grit vs. a Clean Sand Distribution
GRIT CHARACTERIZATION STUDY – SOUTH VALLEY WRF MARCH 2015
4-13
4.0 DISCUSSION OF RESULTS: CLASSIFIER EFFLUENT
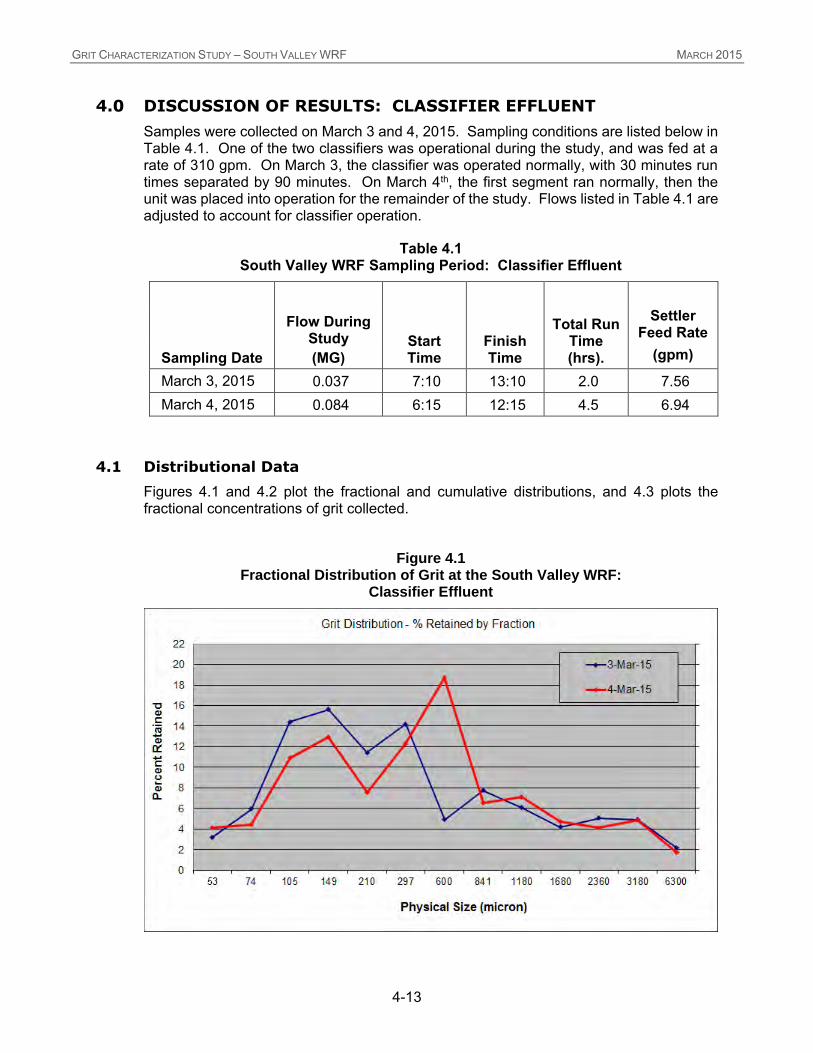
Samples were collected on March 3 and 4, 2015. Sampling conditions are listed below in Table 4.1. One of the two classifiers was operational during the study, and was fed at a rate of 310 gpm. On March 3, the classifier was operated normally, with 30 minutes run times separated by 90 minutes. On March 4th, the first segment ran normally, then the unit was placed into operation for the remainder of the study. Flows listed in Table 4.1 are adjusted to account for classifier operation.
Table 4.1 South Valley WRF Sampling Period: Classifier Effluent
Sampling Date
Flow During Study
(MG) Start Time
Finish Time
Total Run Time (hrs).
Settler Feed Rate
(gpm)
March 3, 2015 0.037 7:10 13:10 2.0 7.56 March 4, 2015 0.084 6:15 12:15 4.5 6.94
4.1 Distributional Data
Figures 4.1 and 4.2 plot the fractional and cumulative distributions, and 4.3 plots the fractional concentrations of grit collected.
Figure 4.1 Fractional Distribution of Grit at the South Valley WRF:
Classifier Effluent

GRIT CHARACTERIZATION STUDY – SOUTH VALLEY WRF MARCH 2015
4-14
Figure 4.2 Cumulative Distribution of Grit at the South Valley WRF:
Classifier Effluent
Figure 4.3 Concentrations of Influent Grit at the South Valley WRF:
Classifier Effluent

GRIT CHARACTERIZATION STUDY – SOUTH VALLEY WRF MARCH 2015
4-15
For the classifier effluent samples, between 49.3 and 60.1% of grit was larger than 297-microns physical size, and between 50.7 and 39.9% was smaller than 297-microns (Figures 4.1 and 4.2). From Figure 4.3, concentrations of grit ranged from 12.7 to 43.4 lbs/MG. While these values appear high when reported in lbs/MG, the total poundage returned by the classifier during the study was only 0.5 lbs. on March 3rd and 3.6 lbs. on March 4th.
4.2 Settling Velocity Data
Figures 4.4 and 4.5 compare the physical and Sand Equivalent Size (SES) distributions of the grit samples with a clean sand distribution. Values found in Figure 4.6 are determined from the median SES of material on each sieve, and fractional data is not applied as is the previous companion charts. Settling velocities were similar to Grit Sump Pit samples, with SES values below 200-microns for all size fractions.
Figure 4.4 Comparison of the South Valley WRF Classifier Effluent Grit
Physical Size and Sand Equivalent Size: 3 March 2015

GRIT CHARACTERIZATION STUDY – SOUTH VALLEY WRF MARCH 2015
4-16
Figure 4.5 Comparison of the South Valley WRF Classifier Effluent Grit
Physical Size and Sand Equivalent Size: 4 March 2015
Figure 4.6 Median Size Distribution of South Valley WRF Classifier Effluent
Grit vs. a Clean Sand Distribution

GRIT CHARACTERIZATION STUDY – SOUTH VALLEY WRF MARCH 2015
5-17
5.0 DISCUSSION OF RESULTS: DAILY CHARTS
5.1 Distributional Data
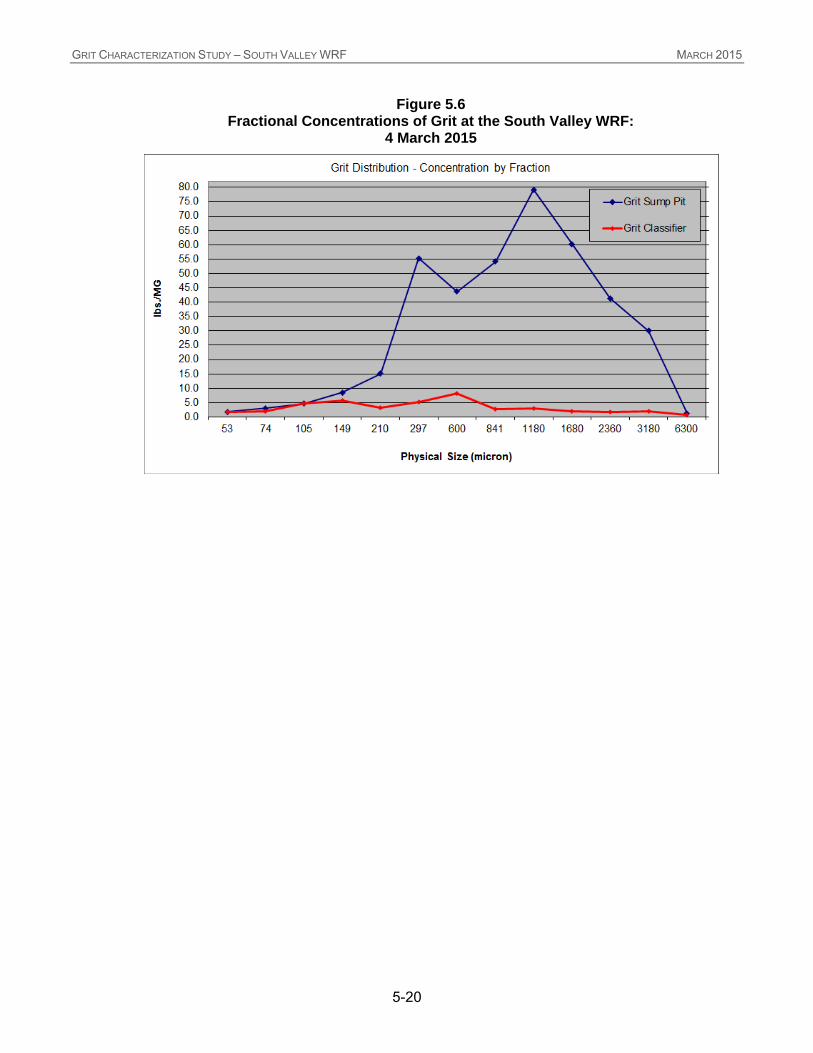
Figures 5.1 and 5.2 plot the fractional distributions, Figures 5.3 and 5.4 plot cumulative distributions, and Figures 5.5 and 5.6 plot the fractional concentrations of grit collected during the study. Median SES values are found in Figures 5.7 and 5.8.
Figure 5.1 Fractional Distribution of Grit at the South Valley WRF:
3 March 2015

GRIT CHARACTERIZATION STUDY – SOUTH VALLEY WRF MARCH 2015
5-18
Figure 5.2 Fractional Distribution of Grit at the South Valley WRF:
4 March 2015
Figure 5.3 Cumulative Distribution of Grit at the South Valley WRF:
3 March 2015

GRIT CHARACTERIZATION STUDY – SOUTH VALLEY WRF MARCH 2015
5-19
Figure 5.4 Cumulative Distribution of Grit at the South Valley WRF:
4 March 2015
Figure 5.5 Fractional Concentrations of Grit at the South Valley WRF:
3 March 2015
GRIT CHARACTERIZATION STUDY – SOUTH VALLEY WRF MARCH 2015
5-20
Figure 5.6 Fractional Concentrations of Grit at the South Valley WRF:
4 March 2015

GRIT CHARACTERIZATION STUDY – SOUTH VALLEY WRF MARCH 2015
5-21
5.2 Settling Velocity Data
Figure 5.7
Median Size Distribution of Grit at the South Valley WRF vs. a Clean Sand Distribution: 3 Mar 2015
Figure 5.8 Median Size Distribution of Grit at the South Valley WRF
vs. a Clean Sand Distribution: 4 Mar 2015
GRIT CHARACTERIZATION STUDY – SOUTH VALLEY WRF MARCH 2015
6-22
6.0 CONCLUSIONS
Grit Sump Pit
1. At the South Valley WRF, between 83.9% and 91.7% of grit collected from the Grit Sump Pit site was larger than 297-microns physical size, and between 8.3 and 16.1% was smaller than 297-microns (Figures 3.1 and 3.2).
2. Concentrations of grit ranged from 265.3 to 398.4 lbs./MG. On March 4, the grit classifier was in operation for four of the six hour test duration. (Figure 3.3).
3. A system designed to remove 150-micron SES grit based on the Grit Sump Pit data would have an efficiency between 69.6 and 79.0%. This would improve to between 88.6 and 93.6% for a 100-micron unit, and over 99% for a 75-micron SES unit (Table 3.2).
4. Based on the entire sample volume that includes both organics and inorganics, on March 3rd an estimated 63.12 yd3 of material passed through the grit sump pit site, and 53.06 yd3 passed on March 4th
Classifier Effluent
1. For the classifier effluent samples, between 49.3 and 60.1% of grit was larger than 297-microns physical size, and between 50.7 and 39.9% was smaller than 297-microns (Figures 4.1 and 4.2).
2. Concentrations of grit ranged from 12.7 to 43.4 lbs./MG. While these values appear high when reported in lbs/MG, the total poundage returned by the classifier during the study was only 0.5 lbs. on March 3rd and 3.6 lbs. on March 4th (Figure 4.3).
3. Settling velocities were similar to Grit Sump Pit samples, with SES values below 200-microns for all size fractions (Figure 4.6).

GRIT CHARACTERIZATION STUDY – SOUTH VALLEY WRF MARCH 2015
7-23
7.0 BIBLIOGRAPHY
Clesceri, L., Greenberg, A. and Eaton, A., “Standard Methods for the Examination of Water and Wastewater”, 20th Edition, 1998, American Public Health Association, Washington, DC
Tchobanoglous, G., Burton, F.L. and Stensel, H.D., “Wastewater Engineering: Treatment and Reuse”, 4th Edition, 2003. TATA McGraw-Hill
GRIT CHARACTERIZATION STUDY – SOUTH VALLEY WRF MARCH 2015
APPENDIX A
RAW DATA
A-1 Concentration Calculation Spreadsheet A-2 Solids Analysis Bench Sheets A-3 Grit Concentration Calculation Bench Sheet A-4 SES Data Analysis A-5 SES Charts A-6 SES Chart Analysis A-7 Median SES versus Median Physical Size

GRIT CHARACTERIZATION STUDY – SOUTH VALLEY WRF MARCH 2015
A-1 Concentration Calculation Spreadsheet

GRIT CHARACTERIZATION STUDY – SOUTH VALLEY WRF MARCH 2015
A-2 Solids Analysis Bench Sheets

GRIT CHARACTERIZATION STUDY – SOUTH VALLEY WRF MARCH 2015

GRIT CHARACTERIZATION STUDY – SOUTH VALLEY WRF MARCH 2015
A-3 Grit Concentration Calculation Bench Sheet

GRIT CHARACTERIZATION STUDY – SOUTH VALLEY WRF MARCH 2015
A-4 SES Data Analysis

GRIT CHARACTERIZATION STUDY – SOUTH VALLEY WRF MARCH 2015
GRIT CHARACTERIZATION STUDY – SOUTH VALLEY WRF MARCH 2015

GRIT CHARACTERIZATION STUDY – SOUTH VALLEY WRF MARCH 2015
GRIT CHARACTERIZATION STUDY – SOUTH VALLEY WRF MARCH 2015
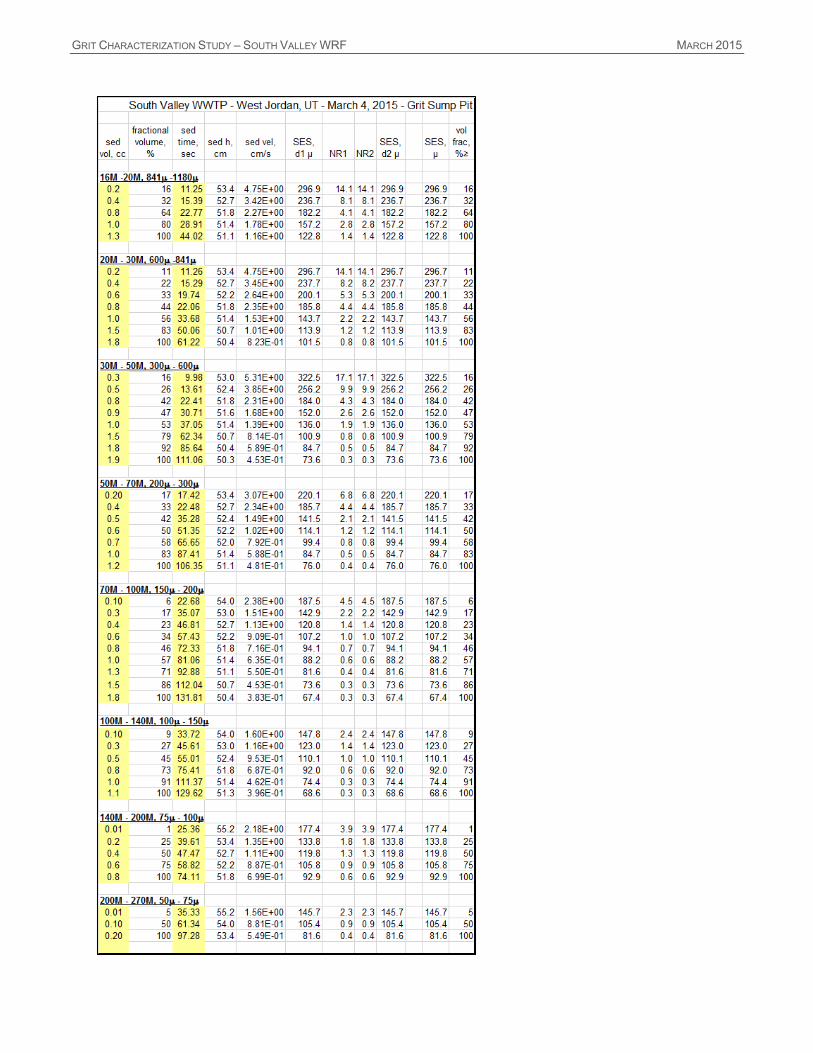
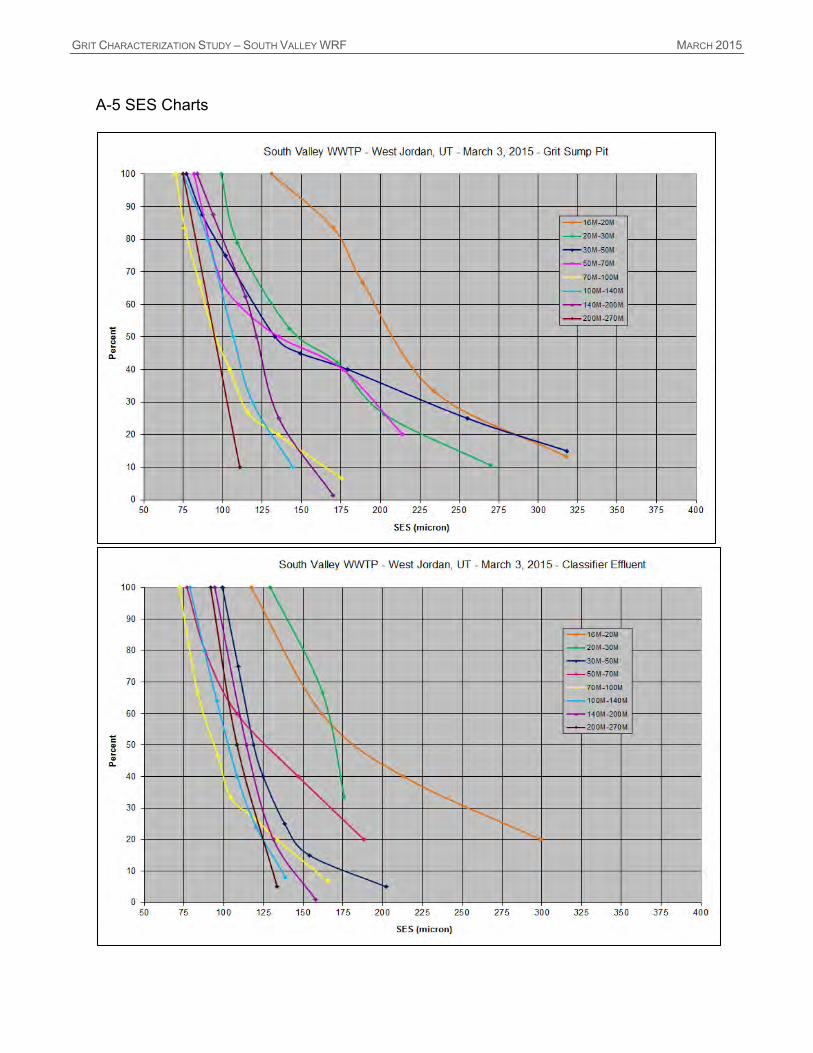
A-5 SES Charts

GRIT CHARACTERIZATION STUDY – SOUTH VALLEY WRF MARCH 2015
GRIT CHARACTERIZATION STUDY – SOUTH VALLEY WRF MARCH 2015
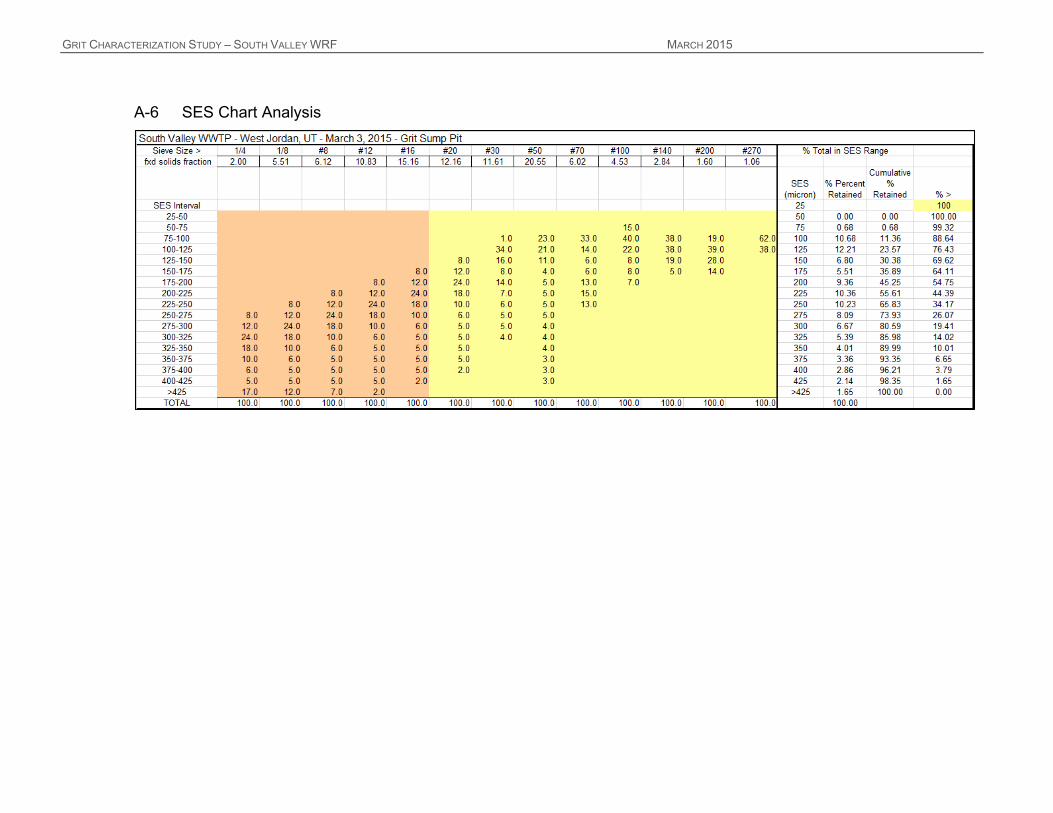
A-6 SES Chart Analysis

GRIT CHARACTERIZATION STUDY – SOUTH VALLEY WRF MARCH 2015

GRIT CHARACTERIZATION STUDY – SOUTH VALLEY WRF MARCH 2015

GRIT CHARACTERIZATION STUDY – SOUTH VALLEY WRF MARCH 2015
A-7 Median SES versus Median Physical Size

GRIT CHARACTERIZATION STUDY – SOUTH VALLEY WRF MARCH 2015
APPENDIX B
CALCULATIONS

GRIT CHARACTERIZATION STUDY – SOUTH VALLEY WRF MARCH 2015
Drag Coefficient (Cd) 24/NR + 3/sqrt NR + 0.34 Reynolds number (NR) (settling velocity of particle)(diameter of particle)/kinematic viscosity Stoke’s Law Settling velocity (m/s) = g(sgp – 1)d2p/18v Where g = acceleration due to gravity (9.81 m/s2) sgp = specific gravity of particle
dp = diameter of particle v = kinematic viscosity (m2/s) % Total Solids (grams dry weight/grams wet weight)*100 % Total Volatile Solids [(grams dry weight - grams ash weight)/ grams dry weight]*100

APPENDIXD
SVWRFGRITTESTINGPROTOCOL(2)

Page 1 of 4
REQUEST FOR PROPOSAL
South Valley Water Reclamation Facility Captured Grit Sampling and Retention Testing Program
August 21, 2014
BACKGROUND The South Valley Water Reclamation Facility located in West Jordan, Utah is considering upgrades to its raw sewage grit removal, handling and disposal systems to reduce accumulation of these materials in the bioreactors. This accumulation negatively impacts the aeration, mixing and hydraulic and biological performance of the bioreactors and requires expensive periodic downtime for cleaning of these basins to remove the grit. The SVWRF has completed an initial grit sampling and analysis effort which:
1. Characterized and quantified the raw sewage grit load entering the plant headworks and exiting with the effluent from the aerated grit chambers at SVWRF.
2. Determined the corresponding grit removal performance of the aerated grit chambers. Results from the initial effort revealed that the removal performance of the SVWRF aerated grit basins appeared to be higher than expected. This data did not appear to correlate with the observed accumulation of grit in the SVWRF bioreactor basins. The SVWRF determined that the intermediate grit pumping basins were overflowing into the bioreactors and thus could be an unintentional source of grit. The SVWRF further believes that the existing classifiers may be returning captured grit into the influent flow, thus possibly creating an undesirable recycled grit flow back into the head of the plant. The SVWRF desires to investigate this situation in more detail. The goals of this effort are as follows:
A. Characterize and quantify the grit load from the grit pumping basin overflows. B. Characterize and quantify the captured grit load from the grit pumping basins to
the classifier cyclones. C. Characterize and quantify the grit load from the classifier cyclone discharge.

Page 2 of 4
PROTOCOL Schedule Written proposals to perform the work must be received electronically by SVWRF no later than 5:00 PM MST, Thursday, September 11, 2014. All sampling, testing, analyses and reporting must be completed by October 30, 2014. Plant facilities will be generally available and accessible immediately upon request and through the completion of on-site activities. Report A written report containing a summary of the sampling program, data and analyses shall be provided as follows. The report shall not indicate whether a particular grit removal process or technology appears to have succeeded or failed to meet expected performance standards. That determination will be made by the owner and engineer. The report represents the final product of this work and will include spreadsheets containing the following. Grit Pumping Basin Overflow
1. Side-by-side plots of weight distributions for sand equivalent size and actual physical size
for overflow grit. 2. Tabulated grit concentrations (lbs of fixed solids/MG) and projected daily grit load (lbs
of fixed solids/day) that is getting pass the grit pumps. 3. All raw data and spreadsheets.
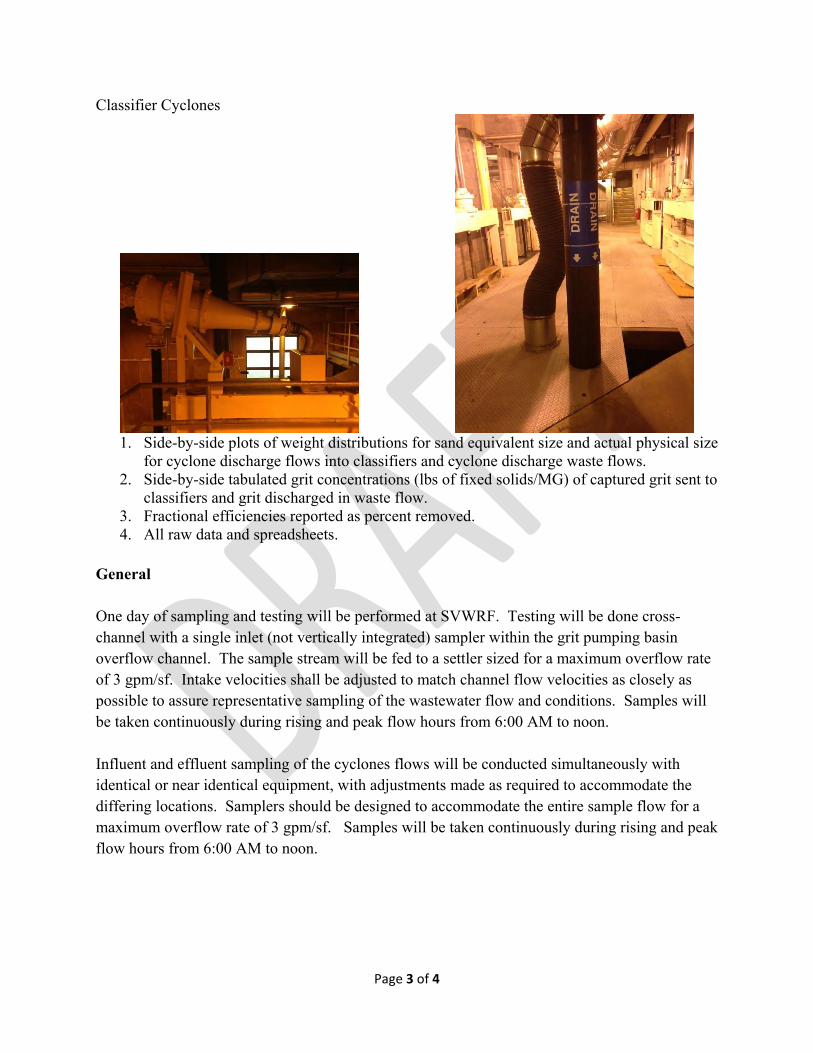
Page 3 of 4
Classifier Cyclones
1. Side-by-side plots of weight distributions for sand equivalent size and actual physical size
for cyclone discharge flows into classifiers and cyclone discharge waste flows. 2. Side-by-side tabulated grit concentrations (lbs of fixed solids/MG) of captured grit sent to
classifiers and grit discharged in waste flow. 3. Fractional efficiencies reported as percent removed. 4. All raw data and spreadsheets.
General One day of sampling and testing will be performed at SVWRF. Testing will be done cross-channel with a single inlet (not vertically integrated) sampler within the grit pumping basin overflow channel. The sample stream will be fed to a settler sized for a maximum overflow rate of 3 gpm/sf. Intake velocities shall be adjusted to match channel flow velocities as closely as possible to assure representative sampling of the wastewater flow and conditions. Samples will be taken continuously during rising and peak flow hours from 6:00 AM to noon. Influent and effluent sampling of the cyclones flows will be conducted simultaneously with identical or near identical equipment, with adjustments made as required to accommodate the differing locations. Samplers should be designed to accommodate the entire sample flow for a maximum overflow rate of 3 gpm/sf. Samples will be taken continuously during rising and peak flow hours from 6:00 AM to noon.

Page 4 of 4
SVWRF The grit pumping basin overflow channel is narrow and deep with a fairly shallow flow depth. The SVWRF will provide channel dimensions as requested. The flow in this channel is dependent upon the cycling of airlift pumps within the aerated grit chambers. The SVWRF intends to run the air lift pumps during the sampling as is normally done each day. Velocities at this location may vary. Samples shall be taken at no more than 6 in. spacing across the entire channel, and the sampler location shall be moved at 15 minute intervals over the entire sampling period. Samples shall be taken from as reasonably near the channel floor/invert as possible where the majority of the grit is expected to be present. The flow to and from the classifier cyclones are intermittent and depend upon the cycling on and off of the submersible grit pumps located in the grit pumping basins. These pumps typically turn on for short periods of time and then rest based on a programmable timer. The SVWRF intends to run the submersible pumps during the sampling as is normally done each day. Pump information can be provided as requested. It is anticipated that in order for samples to be adequately analyzed and captured that the grit settling equipment should be adequate to deal with the maximum pumped flow rates from the submersible pumps. Testing Grit characterization testing shall include wet sieving, settling velocity determinations and SES determinations on site. The settling velocities of all identified particle sizes shall be determined. Dry sieving shall be performed at on offsite location on the previously wet-sieved material after is has been collected and dried. SVWRF grit contains significant amounts of food and other organic and inorganic wastes including egg shells, seeds, kernels, grounds, etc. that have relatively low specific gravities and which vary in size and shape. It is desired to characterize these particles as well as heavier and/or smaller ones, and to ultimately remove them from the process flow in the grit basins before they enter the bioreactor (since there are no primary clarifiers to capture them). The sampling methodology should capture and not dispose of these particles. The following approach shall be utilized for both wet and dry sieving.
1. Screen all grit using and US #3 mesh sieve and dispose of all retained material. 2. Screen all remaining grit on the following sieves: US #8 mesh, US #16 mesh, US #30
mesh, US #50 mesh, US #100 mesh, US #140 mesh and US #200 mesh Respective particles for the above mesh sizes are 6,730 (0.265 in.), microns, 2,380 microns 1,190 microns, 595 microns, 297 microns, 149 microns, 105 microns, 74 microns.
3. Measure and report the weight retained on each sieve size.
APPENDIXE
SEPTEMBER2015BDAREPORT(HYDROPILOTPLANT)

Headcell Pilot Study West Jordan, UT
Prepared for:
South Valley WRF 7495 S. 1300 W.
West Jordan, UT 84084
Prepared by:
Black Dog Analytical, LLC
2401 E. 2659th Road
Marseilles, IL 61341
September 2015

HEADCELL/SLURRY CUP PILOT STUDY SEPTEMBER 2015
ii
TABLE OF CONTENTS
1.0 INTRODUCTION AND OBJECTIVES ............................................................... 1-1
2.0 METHODS AND MATERIALS .......................................................................... 2-2
2.1 Obtaining Representative Grit Fixed Solids (FS) Sample ............................. 2-2
2.2 Determination of Grit Particle Distribution .................................................... 2-5
2.3 Determination of Sand Equivalent Size (SES) Distribution .......................... 2-6
2.4 Sand Equivalent Size Description ................................................................... 2-7
2.5 Solids Analysis ................................................................................................. 2-8
3.0 DISCUSSION OF RESULTS: SAMPLE ANALYSIS ....................................... 3-9
3.1 Distributional Data ........................................................................................... 3-9
3.2 Settling Velocity Data ..................................................................................... 3-11
4.0 DISCUSSION OF RESULTS: PERFORMANCE EVALUATION ................... 4-17
5.0 ORGANIC CONTENT ..................................................................................... 5-21
6.0 CONCLUSIONS .............................................................................................. 6-22
7.0 BIBLIOGRAPHY ............................................................................................. 7-23
LIST OF FIGURES
Figure 2.1 Headcell Influent/Effluent Sampling Sites ............................................................ 2-2

HEADCELL/SLURRY CUP PILOT STUDY SEPTEMBER 2015
iii
... 2-2
Figure 2.3 PVC Splitter and Valve .......................................................................................... 2-4
Figure 2.4 Grit Settler ........................................................................................................... 2-5
Figure 2.5.............................................................................................................................. 2-6
Modified Imhoff Cone for SES Measurements ....................................................................... 2-6
Figure 2.6 Physical Size versus Sand Equivalent Size: Cumulative Distributions .................... 2-7
Figure 3.1 Fractional Distribution of Grit at the South Valley WRF: 17-Aug-2015 ................... 3-9
Figure 3.2 Fractional Distribution of Grit at the South Valley WRF: 18-Aug-2015 ................. 3-10
Figure 3.3 Cumulative Distribution of Grit at the South Valley WRF: 17-Aug-2015 ................ 3-10
Figure 3.4 Cumulative Distribution of Grit at the South Valley WRF: 18-Aug-2015 ............... 3-11
South Valley WRF vs. a Clean Sand Distribution: August 17, 2015 ........................................ 3-16

HEADCELL/SLURRY CUP PILOT STUDY SEPTEMBER 2015
iv
.... 3-16
Figure 4.2 Concentrations of Headcell Influent and Effluent Grit at the ............................... 4-18
South Valley WRF: 18-Aug-2015 ......................................................................................... 4-18
. 4-18
Figure 4.4 Concentrations of Headcell Underflow and Slurry Cup Effluent Grit .................... 4-20
at the South Valley WRF: 18-Aug-2015 ............................................................................... 4-20
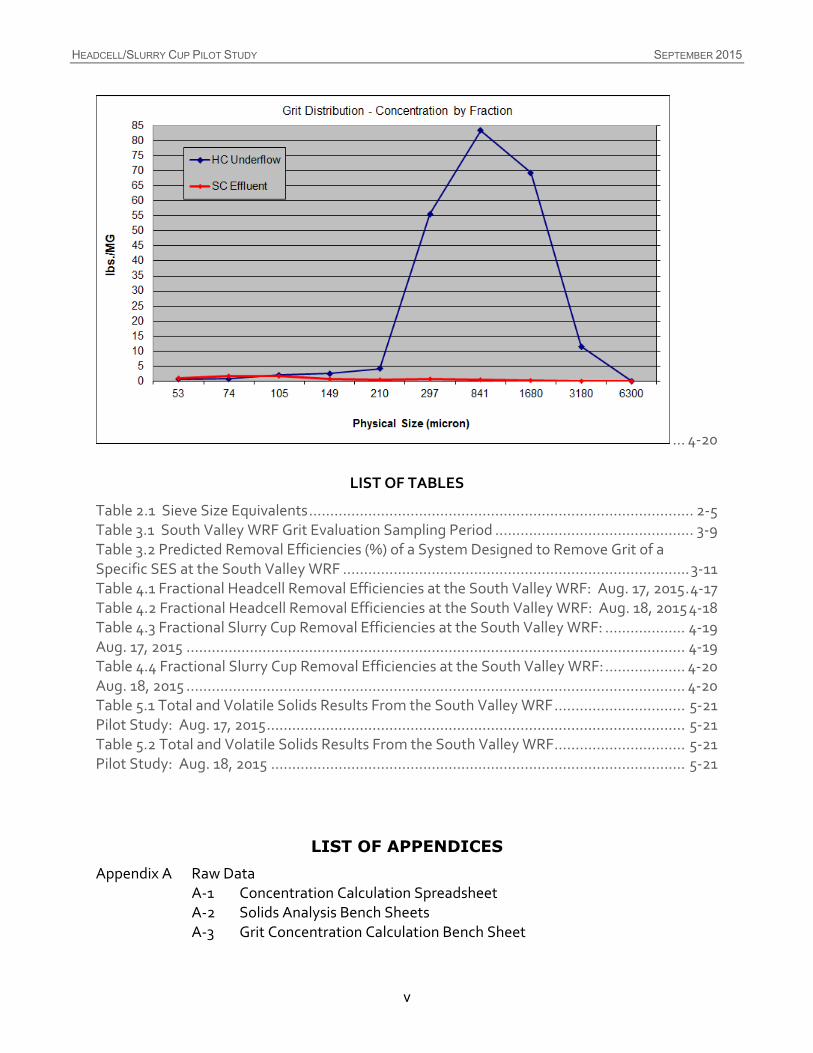
HEADCELL/SLURRY CUP PILOT STUDY SEPTEMBER 2015
v
... 4-20
LIST OF TABLES
Table 2.1 Sieve Size Equivalents ........................................................................................... 2-5
Table 3.1 South Valley WRF Grit Evaluation Sampling Period ............................................... 3-9
Table 3.2 Predicted Removal Efficiencies (%) of a System Designed to Remove Grit of a Specific SES at the South Valley WRF .................................................................................. 3-11
Table 4.1 Fractional Headcell Removal Efficiencies at the South Valley WRF: Aug. 17, 2015 . 4-17
Table 4.2 Fractional Headcell Removal Efficiencies at the South Valley WRF: Aug. 18, 2015 4-18
Table 4.3 Fractional Slurry Cup Removal Efficiencies at the South Valley WRF: ................... 4-19
Aug. 17, 2015 ...................................................................................................................... 4-19
Table 4.4 Fractional Slurry Cup Removal Efficiencies at the South Valley WRF: ................... 4-20
Aug. 18, 2015 ...................................................................................................................... 4-20
Table 5.1 Total and Volatile Solids Results From the South Valley WRF ............................... 5-21
Pilot Study: Aug. 17, 2015 ................................................................................................... 5-21
Table 5.2 Total and Volatile Solids Results From the South Valley WRF ............................... 5-21
Pilot Study: Aug. 18, 2015 .................................................................................................. 5-21
LIST OF APPENDICES
Appendix A Raw Data A-1 Concentration Calculation Spreadsheet A-2 Solids Analysis Bench Sheets A-3 Grit Concentration Calculation Bench Sheet
HEADCELL/SLURRY CUP PILOT STUDY SEPTEMBER 2015
vi
A-4 SES Data Analysis A-5 SES Charts A-6 Median SES versus Median Physical Size
Appendix B Calculations
DEFINITIONS AND ABBREVIATIONS
Acronym Definition
gpm Gallon(s) per minute Grit A settleable inorganic kernel with attached organics larger than 50
microns and characterized by physical size and settling velocity Grit Concentration The amount of grit present in the waste stream based on the fixed
solids measurements
Grit Fixed Solids (FS) Also expressed as “fixed solids” - the inorganic portion of sample remaining after organics are removed by ashing in a muffle furnace at 550oC
lbs/MG Pounds per million gallons MG Million gallons MGD Million gallons per day NR1 The Reynolds number for the trial SES NR2 The Revised Reynolds number SAA Surface Active Agents - – material affixed to the grit particle, such
as organics, fats, oils, and greases that may affect the settling velocity of municipal grit
Sample All material accumulated in the bottom of the grit settler which includes settleable organics
Sand Equivalent Size (SES)
The sand particle size, measured in microns, having the same settling velocity as the selected grit particle
Sed h, cm The height of water in the Imhoff cone through which the sediment passed to reach the surface of accumulated material during SES determination
Sed Time, sec The time required for sediment to reach the recorded volume

HEADCELL/SLURRY CUP PILOT STUDY SEPTEMBER 2015
vii
during SES determination Sed. Vol., cc Sedimentation Volume (cc or ml) – The amount of material that
settles in the Imhoff Cone during SES determinations SES, dl, u Trial Sand Equivalent Size, in microns VIS Vertically Integrated Sampler Vol Frac, % The cumulative sedimentation percentage occurring during SES
determination WRF Water Reclamation Facility

HEADCELL/SLURRY CUP PILOT STUDY SEPTEMBER 2015
1-1
1.0 INTRODUCTION AND OBJECTIVES
The City of West Jordan, UT is assessing the performance of the Hydro International Headcell grit collector and Slurry Cup grit washer pilot units at their South Valley Water Reclamation Facility (WRF).
In conventional grit removal system design, grit has commonly been treated as clean sand with a specific gravity of 2.65. Metcalf and Eddy’s Wastewater Engineering: Treatment and Reuse (standard textbook) says “Grit consists of sand, gravel, cinders, or other heavy materials that have specific gravities or settling velocities considerably greater than those of organic particles”. These inorganic solids are often associated with Surface Active Agents (SAA) that include fats, oils, greases, and other organic materials can lower their effective specific gravity to 1.3 (Tchobanoglous 2003). The shape and composition of grit and inert solids also greatly affects settling velocities. Material with similar effective specific gravities may have very different settling velocities due to the shape of the particle.
When determining quantities of grit during this study, grit will be defined as settleable inorganic material larger than 50 microns. Settling velocities, attached organics and SAA have been considered during the on-site laboratory analyses. The settling velocity is expressed as the Sand Equivalent Size (SES), which is the sand particle size having the same settling velocity as the more buoyant grit particle. Materials less than 50 microns in size have been considered silt or clay and thus excluded from the data.
Objectives
The purpose of this study was to determine the removal efficiency of the Headcell and Slurry Cup.

HEADCELL/SLURRY CUP PILOT STUDY SEPTEMBER 2015
2-2
2.0 METHODS AND MATERIALS
2.1 Obtaining Representative Grit Fixed Solids (FS) Sample
Headcell Influent and Effluent samples were collected by securing a two-inch hose to a fitting located on the Headcell influent and discharge piping (Figure 2.1). Headcell underflow samples were collected from a sampling port located near the Slurry Cup, and Slurry Cup effluent samples were collected from the discharge line prior to returning to the wastetream (Figure 2.2).
Figure 2.1 Headcell Influent/Effluent Sampling Sites
Headcell Effluent
Headcell Influent

HEADCELL/SLURRY CUP PILOT STUDY SEPTEMBER 2015
2-3
Figure 2.2 Headcell Underflow/Slurry Cup Effluent Sampling Sites
A portion of the samples collected from each location were diverted to grit settlers. A PVC wye was used to split the flow (Figure 2.3), and a valve following the wye was used to increase flow to the settler if necessary. A one-inch hose supplied the grit settlers, while a single two-inch hose returned the majority of flow back to the waste stream.
Headcell Underflow
Slurry Cup Effluent

HEADCELL/SLURRY CUP PILOT STUDY SEPTEMBER 2015
2-4
Figure 2.3 PVC Splitter and Valve
Grit settlers (Figure 2.4) were constructed from 55-gallon plastic drums with an influent port and a discharge weir. Flow enters the tank and is diverted to the side with a 90o elbow to reduce the velocity and turbulence. Grit settles to the bottom of the tank, and wastewater exits through the discharge fitting at the top of the tank and is returned to the waste stream. 50-micron grit with a Specific Gravity of 2.65 settles at a rate of 5.02 in/min. ((g(sgp – 1)d2p/18v)*196.850 = inches/minute). In order to settle this grit, the overflow rate must be less than 3 gpm/ft2 of surface area. The settler has a diameter of 24-inches, or a surface area of 3.14 ft2 (𝐴 = 𝜋𝑟2). At 10 gpm, the overflow rate (Q/A) is 3.18 gpm/ft2, satisfying the design requirements for the settler (10gpm/3.14ft2 = 3.18 gpm/ft2). The actual settler feed rate is adjusted to between 7.5 and 8.0 gpm to insure settling of fine grit, and this is checked by timing the overflow rate of the settler with a 5-gallon bucket and stopwatch. Feed rates were checked periodically and adjusted when necessary.

HEADCELL/SLURRY CUP PILOT STUDY SEPTEMBER 2015
2-5
Figure 2.4 Grit Settler
2.2 Determination of Grit Particle Distribution
A maximum 200-gram portion of the sample collected by the Grit Settler is immediately classified through a series of sieves. Wet sieving for size fractions and the SES settling tests are conducted on fresh grit from the sewer waste stream samples as the Surface Active Agents (SAA) attached to the grit kernel may substantially reduce its effective specific gravity and consequently it’s settling velocity. If the total sample size exceeds 200-grams, the sample is split and the fraction is recorded on the field bench sheet. Sieve sizes used are listed below in Table 2.1.
Table 2.1 Sieve Size Equivalents
Opening
U.S. Sieve Size
Tyler Equivalent Microns Inches
1/4 3.25 mesh 6300 0.2500 1/8 6.5 mesh 3180 0.1250 #12 10 mesh 1680 0.0661 #20 20 mesh 841 0.0331 #50 48 mesh 297 0.0117 #70 65 mesh 210 0.0083
#100 100 mesh 149 0.0059 #140 150 mesh 106 0.0041

HEADCELL/SLURRY CUP PILOT STUDY SEPTEMBER 2015
2-6
#200 200 mesh 74 0.0029 #270 270 mesh 53 0.0021 Pan
2.3 Determination of Sand Equivalent Size (SES) Distribution
Settling tests were conducted immediately on solids passing the U.S. #20 sieve and sequentially retained on the #50, #70, #100, #150, #200, and #270 sieves. Large organics often interfere with the settling of grit on screens larger than #50. A portion of the retained material is placed into a modified Imhoff cone and filled with water (see Figure 2.5). The column is inverted, and as the grit settles in the cone corresponding time and volume measurements are recorded. The objective of these measurements is to determine the size of a sand sphere having the same settling velocity as the collected grit fraction.
Figure 2.5 Modified Imhoff Cone for SES Measurements
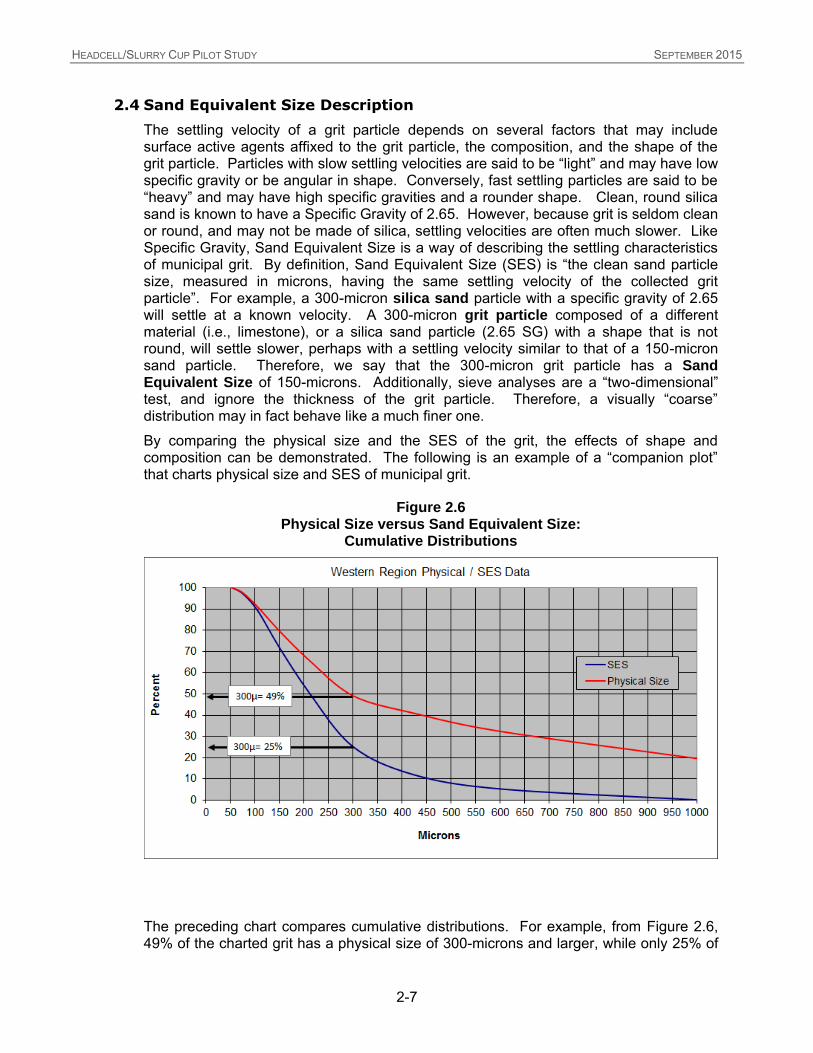
HEADCELL/SLURRY CUP PILOT STUDY SEPTEMBER 2015
2-7
2.4 Sand Equivalent Size Description
The settling velocity of a grit particle depends on several factors that may include surface active agents affixed to the grit particle, the composition, and the shape of the grit particle. Particles with slow settling velocities are said to be “light” and may have low specific gravity or be angular in shape. Conversely, fast settling particles are said to be “heavy” and may have high specific gravities and a rounder shape. Clean, round silica sand is known to have a Specific Gravity of 2.65. However, because grit is seldom clean or round, and may not be made of silica, settling velocities are often much slower. Like Specific Gravity, Sand Equivalent Size is a way of describing the settling characteristics of municipal grit. By definition, Sand Equivalent Size (SES) is “the clean sand particle size, measured in microns, having the same settling velocity of the collected grit particle”. For example, a 300-micron silica sand particle with a specific gravity of 2.65 will settle at a known velocity. A 300-micron grit particle composed of a different material (i.e., limestone), or a silica sand particle (2.65 SG) with a shape that is not round, will settle slower, perhaps with a settling velocity similar to that of a 150-micron sand particle. Therefore, we say that the 300-micron grit particle has a Sand Equivalent Size of 150-microns. Additionally, sieve analyses are a “two-dimensional” test, and ignore the thickness of the grit particle. Therefore, a visually “coarse” distribution may in fact behave like a much finer one.
By comparing the physical size and the SES of the grit, the effects of shape and composition can be demonstrated. The following is an example of a “companion plot” that charts physical size and SES of municipal grit.
Figure 2.6 Physical Size versus Sand Equivalent Size:
Cumulative Distributions
The preceding chart compares cumulative distributions. For example, from Figure 2.6, 49% of the charted grit has a physical size of 300-microns and larger, while only 25% of
HEADCELL/SLURRY CUP PILOT STUDY SEPTEMBER 2015
2-8
the grit has a Sand Equivalent Size of 300-microns and larger. This difference is a result of the composition and shape previously discussed, and this grit is “light”. As particles become smaller, they attain a more rounded shape, resulting from larger, flat particles breaking up into smaller pieces. Grit chamber design must consider the settling velocity of the grit, as specific gravity and physical size distributions alone fail to provide enough information on grit behavior.
2.5 Solids Analysis
The weight measurements of the grit particles retained on each of the ten sieves were determined according to methods SM2540B and SM2540E as outlined in Standard Methods for the Examination of Water and Wastewater, 1998 APHA, AWWA, WEF, 20th edition. Fixed solids fractions were arranged into fractional and cumulative distributions. From this data a cumulative curve factoring physical size and weight of fixed solids is generated. All solids data are listed in Appendix A-2 “Solids Analysis Benchsheet.”
Data from the settling tests are entered into a spreadsheet for each size fraction that converts the settling velocities and volumes into Sand Equivalent Size. The SES value generated is plotted against the corresponding volume fraction to generate a series of SES charts. Each chart is divided into 25-micron SES intervals and the percentages of grit falling within each interval are entered into a spreadsheet for analysis. From this data, a cumulative curve factoring SES and weight of fixed solids per size fraction is generated. By comparing the “SES” curve with the “Physical Size” curve, we can determine the amount of grit that can bypass a grit removal system designed around a known sand particle size.
The SES charts are also used to compare the average SES within a sieve fraction with the average physical size of clean, round silica sand for that same sieve fraction. To calculate the concentration of grit present in the sewer during normal flow conditions, the volume of wastewater sampled each day is compared to the measured volume of wastewater passing through the sewer during the sampling periods. The total amount of grit collected during each sampling period is applied to the total volume of wastewater to determine the lbs/MG of grit present in the collection system.
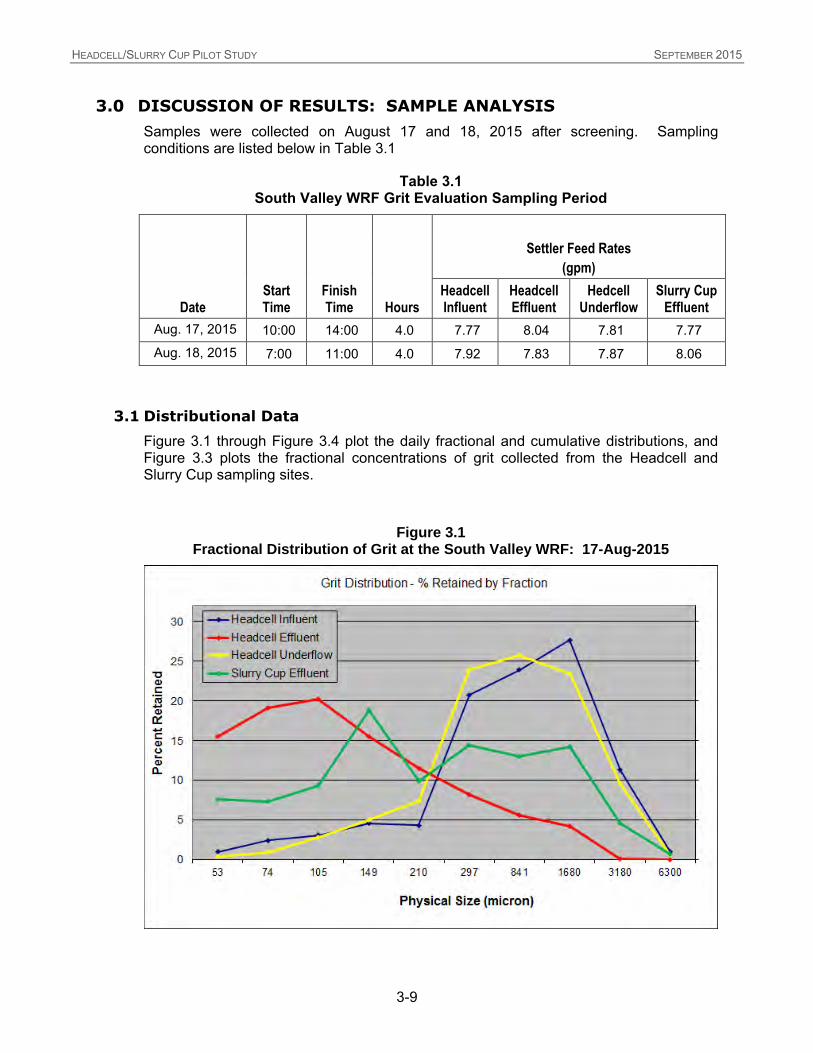
HEADCELL/SLURRY CUP PILOT STUDY SEPTEMBER 2015
3-9
3.0 DISCUSSION OF RESULTS: SAMPLE ANALYSIS
Samples were collected on August 17 and 18, 2015 after screening. Sampling conditions are listed below in Table 3.1
Table 3.1 South Valley WRF Grit Evaluation Sampling Period
Date Start Time
Finish Time Hours
Settler Feed Rates
(gpm)
HeadcellInfluent
Headcell Effluent
Hedcell Underflow
Slurry Cup Effluent
Aug. 17, 2015 10:00 14:00 4.0 7.77 8.04 7.81 7.77
Aug. 18, 2015 7:00 11:00 4.0 7.92 7.83 7.87 8.06
3.1 Distributional Data
Figure 3.1 through Figure 3.4 plot the daily fractional and cumulative distributions, and Figure 3.3 plots the fractional concentrations of grit collected from the Headcell and Slurry Cup sampling sites.
Figure 3.1 Fractional Distribution of Grit at the South Valley WRF: 17-Aug-2015

HEADCELL/SLURRY CUP PILOT STUDY SEPTEMBER 2015
3-10
Figure 3.2 Fractional Distribution of Grit at the South Valley WRF: 18-Aug-2015
Figure 3.3 Cumulative Distribution of Grit at the South Valley WRF: 17-Aug-2015

HEADCELL/SLURRY CUP PILOT STUDY SEPTEMBER 2015
3-11
Figure 3.4 Cumulative Distribution of Grit at the South Valley WRF: 18-Aug-2015
3.2 Settling Velocity Data
Sand Equivalent Size (SES) vs. Physical Size companion plots can be used to determine grit removal system design parameters. Table 3.2 lists theoretical removal efficiencies for a system designed to remove grit based on the SES data collected from the Headcell influent sampling site. Predicted efficiencies listed in Table 3.2 are shown graphically in Figures 3.5 and 3.6.
Table 3.2 Predicted Removal Efficiencies (%) of a System Designed to Remove
Grit of a Specific SES at the South Valley WRF
Sample Date 300-micron SES Design
150-micron SES Design
100-micron SES Design
75-micron SES Design
August 17. 2015 24.4 77.8 93.5 99.0
August 18, 2015 69.6 88.0 94.2 96.7
Figures 3.5 and 3.6 compare the physical and Sand Equivalent Size (SES) distributions of the Headcell influent samples. Figures 3.7 through 3.12 plot companion charts for the remaining samples, and figures 3.13 and 3.14 compares the physical size distributions
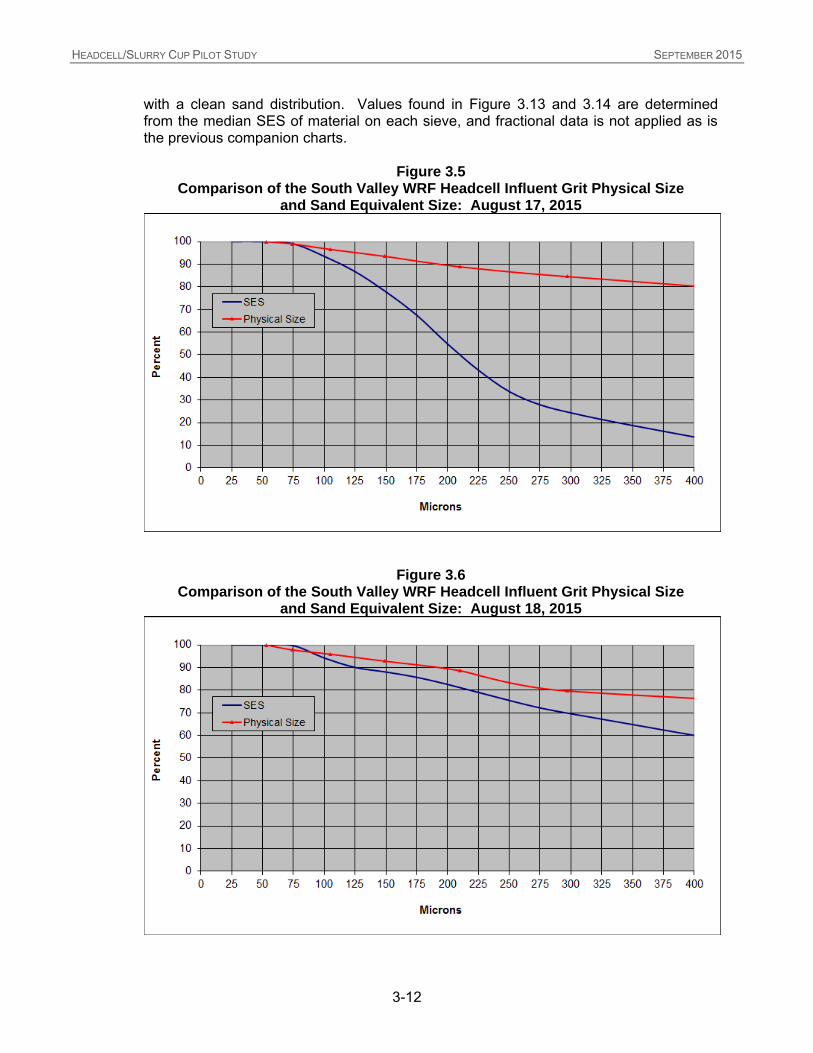
HEADCELL/SLURRY CUP PILOT STUDY SEPTEMBER 2015
3-12
with a clean sand distribution. Values found in Figure 3.13 and 3.14 are determined from the median SES of material on each sieve, and fractional data is not applied as is the previous companion charts.
Figure 3.5 Comparison of the South Valley WRF Headcell Influent Grit Physical Size
and Sand Equivalent Size: August 17, 2015
Figure 3.6 Comparison of the South Valley WRF Headcell Influent Grit Physical Size
and Sand Equivalent Size: August 18, 2015

HEADCELL/SLURRY CUP PILOT STUDY SEPTEMBER 2015
3-13
Figure 3.7 Comparison of the South Valley WRF Headcell Effluent Grit Physical Size
and Sand Equivalent Size: August 17, 2015
Figure 3.8 Comparison of the South Valley WRF Headcell Effluent Grit Physical Size
and Sand Equivalent Size: August 18, 2015

HEADCELL/SLURRY CUP PILOT STUDY SEPTEMBER 2015
3-14
Figure 3.9 Comparison of the South Valley WRF Headcell Underflow Grit Physical Size
and Sand Equivalent Size: August 17, 2015
Figure 3.10 Comparison of the South Valley WRF Headcell Underflow Grit Physical Size
and Sand Equivalent Size: August 18, 2015

HEADCELL/SLURRY CUP PILOT STUDY SEPTEMBER 2015
3-15
Figure 3.11 Comparison of the South Valley WRF Slurry Cup Effluent Grit Physical Size
and Sand Equivalent Size: August 17, 2015
Figure 3.12 Comparison of the South Valley WRF Slurry Cup Effluent Grit Physical Size
and Sand Equivalent Size: August 18, 2015

HEADCELL/SLURRY CUP PILOT STUDY SEPTEMBER 2015
3-16
Figure 3.13 Median Size Distribution of Headcell/Slurry Cup Grit at the
South Valley WRF vs. a Clean Sand Distribution: August 17, 2015
Figure 3.14 Median Size Distribution of Headcell/Slurry Cup Grit at the
South Valley WRF vs. a Clean Sand Distribution: August 18, 2015
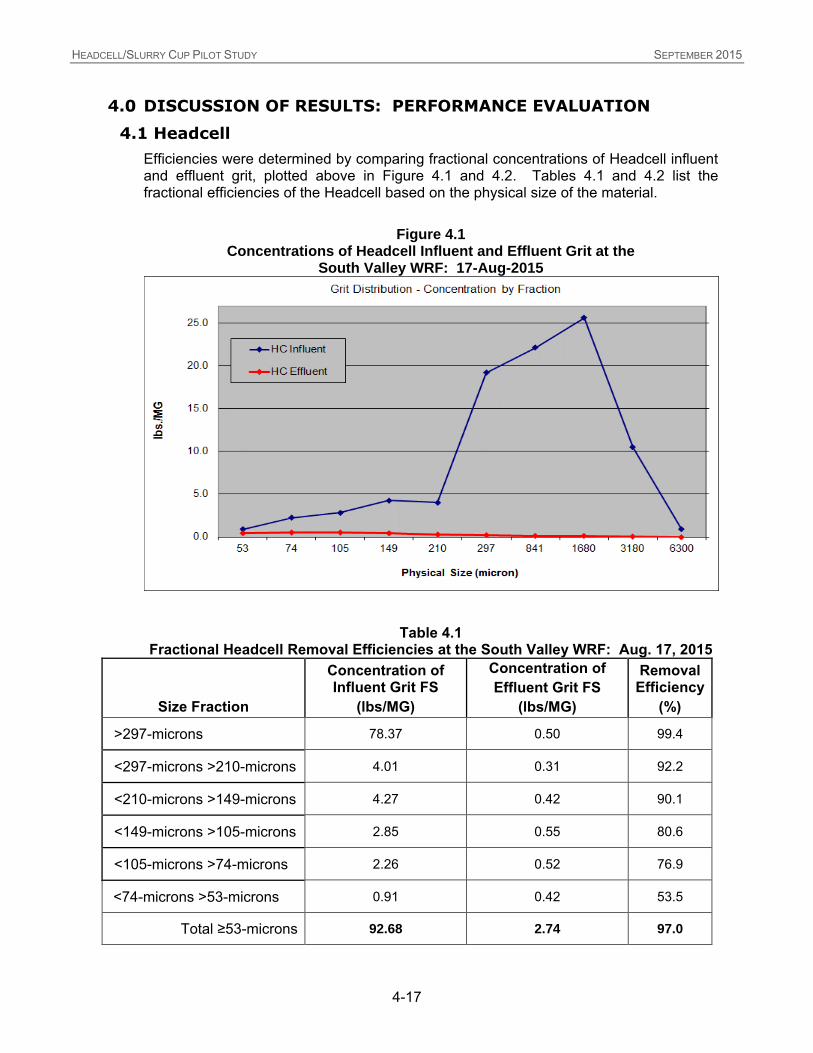
HEADCELL/SLURRY CUP PILOT STUDY SEPTEMBER 2015
4-17
4.0 DISCUSSION OF RESULTS: PERFORMANCE EVALUATION
4.1 Headcell
Efficiencies were determined by comparing fractional concentrations of Headcell influent and effluent grit, plotted above in Figure 4.1 and 4.2. Tables 4.1 and 4.2 list the fractional efficiencies of the Headcell based on the physical size of the material.
Figure 4.1
Concentrations of Headcell Influent and Effluent Grit at the South Valley WRF: 17-Aug-2015
Table 4.1 Fractional Headcell Removal Efficiencies at the South Valley WRF: Aug. 17, 2015
Size Fraction
Concentration of Influent Grit FS
(lbs/MG)
Concentration of
Effluent Grit FS
(lbs/MG)
Removal Efficiency
(%)
>297-microns 78.37 0.50 99.4
<297-microns >210-microns 4.01 0.31 92.2
<210-microns >149-microns 4.27 0.42 90.1
<149-microns >105-microns 2.85 0.55 80.6
<105-microns >74-microns 2.26 0.52 76.9
<74-microns >53-microns 0.91 0.42 53.5
Total ≥53-microns 92.68 2.74 97.0

HEADCELL/SLURRY CUP PILOT STUDY SEPTEMBER 2015
4-18
Figure 4.2 Concentrations of Headcell Influent and Effluent Grit at the
South Valley WRF: 18-Aug-2015
Table 4.2
Fractional Headcell Removal Efficiencies at the South Valley WRF: Aug. 18, 2015
Size Fraction
Concentration of Influent Grit FS
(lbs/MG)
Concentration of
Effluent Grit FS
(lbs/MG)
Removal Efficiency
(%)
>297-microns 25.57 0.83 96.7
<297-microns >210-microns 2.88 0.14 95.2
<210-microns >149-microns 1.34 0.15 89.1
<149-microns >105-microns 0.98 0.16 83.4
<105-microns >74-microns 0.62 0.09 85.3
<74-microns >53-microns 0.70 0.33 52.2
Total ≥53-microns 32.09 1.71 94.7

HEADCELL/SLURRY CUP PILOT STUDY SEPTEMBER 2015
4-19
4.2 Slurry Cup
Efficiencies were determined by comparing fractional concentrations of Headcell underflow and Slurry Cup effluent grit, plotted above in Figure 4.3 and 4.4. Tables 4.3 and 4.4 list the fractional efficiencies of the Slurry Cup based on the physical size of the material.
Figure 4.3 Concentrations of Headcell Underflow and Slurry Cup Effluent Grit
at the South Valley WRF: 17-Aug-2015
Table 4.3 Fractional Slurry Cup Removal Efficiencies at the South Valley WRF:
Aug. 17, 2015
Size Fraction
Concentration of Influent Grit FS
(lbs/MG)
Concentration of
Effluent Grit FS
(lbs/MG)
Removal Efficiency
(%)
>297-microns 164.29 4.17 97.5
<297-microns >210-microns 14.64 0.88 94.0
<210-microns >149-microns 9.87 1.67 83.1
<149-microns >105-microns 5.58 0.82 85.2
<105-microns >74-microns 1.83 0.65 64.7
<74-microns >53-microns 0.82 0.68 16.7
Total ≥53-microns 197.03 8.87 95.5
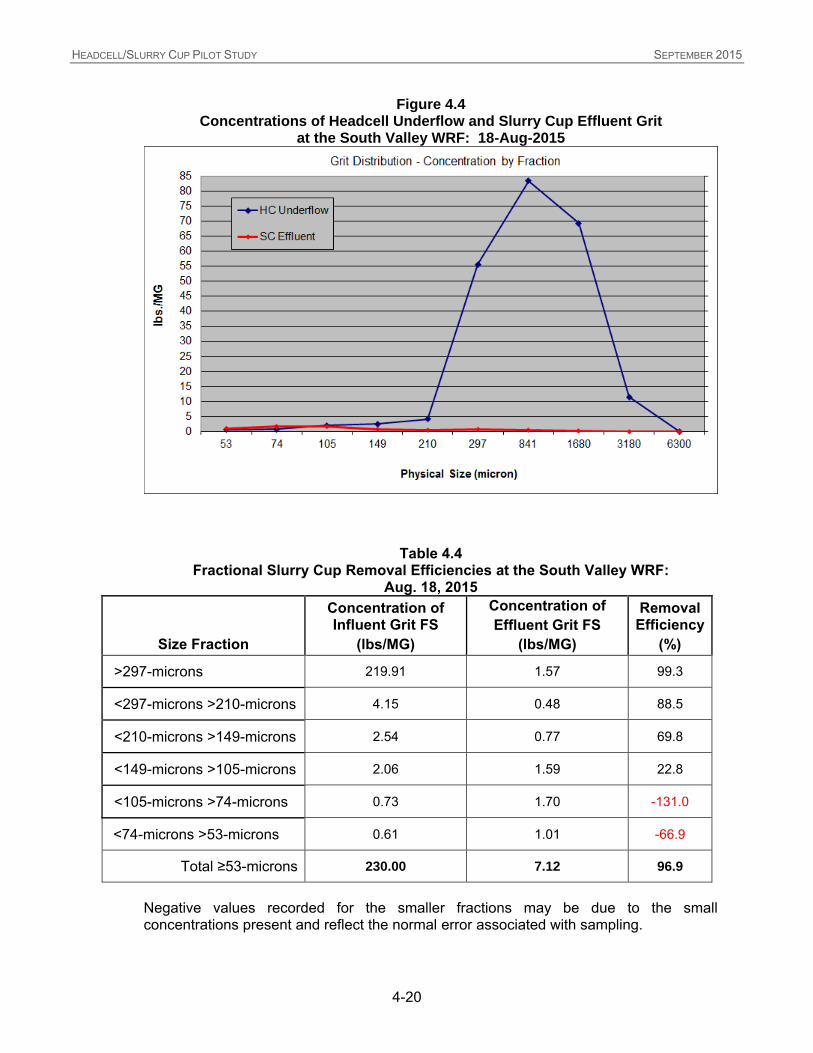
HEADCELL/SLURRY CUP PILOT STUDY SEPTEMBER 2015
4-20
Figure 4.4 Concentrations of Headcell Underflow and Slurry Cup Effluent Grit
at the South Valley WRF: 18-Aug-2015
Table 4.4
Fractional Slurry Cup Removal Efficiencies at the South Valley WRF: Aug. 18, 2015
Size Fraction
Concentration of Influent Grit FS
(lbs/MG)
Concentration of
Effluent Grit FS
(lbs/MG)
Removal Efficiency
(%)
>297-microns 219.91 1.57 99.3
<297-microns >210-microns 4.15 0.48 88.5
<210-microns >149-microns 2.54 0.77 69.8
<149-microns >105-microns 2.06 1.59 22.8
<105-microns >74-microns 0.73 1.70 -131.0
<74-microns >53-microns 0.61 1.01 -66.9
Total ≥53-microns 230.00 7.12 96.9
Negative values recorded for the smaller fractions may be due to the small concentrations present and reflect the normal error associated with sampling.

HEADCELL/SLURRY CUP PILOT STUDY SEPTEMBER 2015
5-21
5.0 ORGANIC CONTENT
Percent Total and Volatile Solids ere determined for each sample and are listed in Tables 5.1 and 5.2.
Table 5.1
Total and Volatile Solids Results From the South Valley WRF Pilot Study: Aug. 17, 2015
Sample Site % Total Solids
% Total Volatile
Solids
Headcell Influent 37.79 74.37
Headcell Effluent 17.27 87.43
Headcell Underflow 28.41 65.34
Slurry Cup Effluent 26.08 93.74
Table 5.2 Total and Volatile Solids Results From the South Valley WRF
Pilot Study: Aug. 18, 2015
Sample Site % Total Solids
% Total Volatile
Solids
Headcell Influent 36.68 94.77
Headcell Effluent 39.63 96.73
Headcell Underflow 36.66 42.12
Slurry Cup Effluent 25.74 95.17
Organic content was high for all samples. Concentrations of grit were considerably lower on August 18 than on August 17, and lower than previously determined influent concentrations (2014). However, sample the sample size was larger on August 18 (1500 mls versus 1000 mls on Aug. 17). This is reflected in the Total Volatile Solids values for influent samples.
The total volume of settleable material entering the Headcell during the study was 1.82 ft3 on August 17 and 2.68 ft3 on August 18.

HEADCELL/SLURRY CUP PILOT STUDY SEPTEMBER 2015
6-22
6.0 CONCLUSIONS
1. At the South Valley WRF, influent samples possessed a coarse distribution with 84.6 and 79.7% of material larger than 297-microns, and 15.4 and 20.3% smaller than 297-microns (Figures 3.1 and 3.2).
2. Concentrations of grit entering the Headcell were 92.7 lbs/MG on August 17 and 32.1 lbs/MG on August 18. (Figures 4.1 and 4.2).
3. Removal efficiencies for the Headcell for all material was 97.0% on August 17 and 94.7% on August 18 (Tables 4.1 and 4.2).
4. Removal efficiencies for the Slurry Cup for all material was 95.5% on August 17 and 96.9% on August 18 (Tables 4.1 and 4.2).
5. The total volume of settleable material entering the Headcell during the study was 1.82 ft3 on August 17 and 2.68 ft3 on August 18.

HEADCELL/SLURRY CUP PILOT STUDY SEPTEMBER 2015
7-23
7.0 BIBLIOGRAPHY
Clesceri, L., Greenberg, A. and Eaton, A., “Standard Methods for the Examination of Water and Wastewater”, 20th Edition, 1998, American Public Health Association, Washington, DC
Tchobanoglous, G., Burton, F.L. and Stensel, H.D., “Wastewater Engineering: Treatment and Reuse”, 4th Edition, 2003. TATA McGraw-Hill

HEADCELL/SLURRY CUP PILOT STUDY SEPTEMBER 2015
APPENDIX A
RAW DATA
A-1 Concentration Calculation Spreadsheet A-2 Solids Analysis Bench Sheets A-3 Grit Concentration Calculation Bench Sheet A-4 SES Data Analysis A-5 SES Charts A-6 SES Chart Analysis A-7 Median SES versus Median Physical Size

HEADCELL/SLURRY CUP PILOT STUDY SEPTEMBER 2015
A-1 Concentration Calculation Spreadsheet
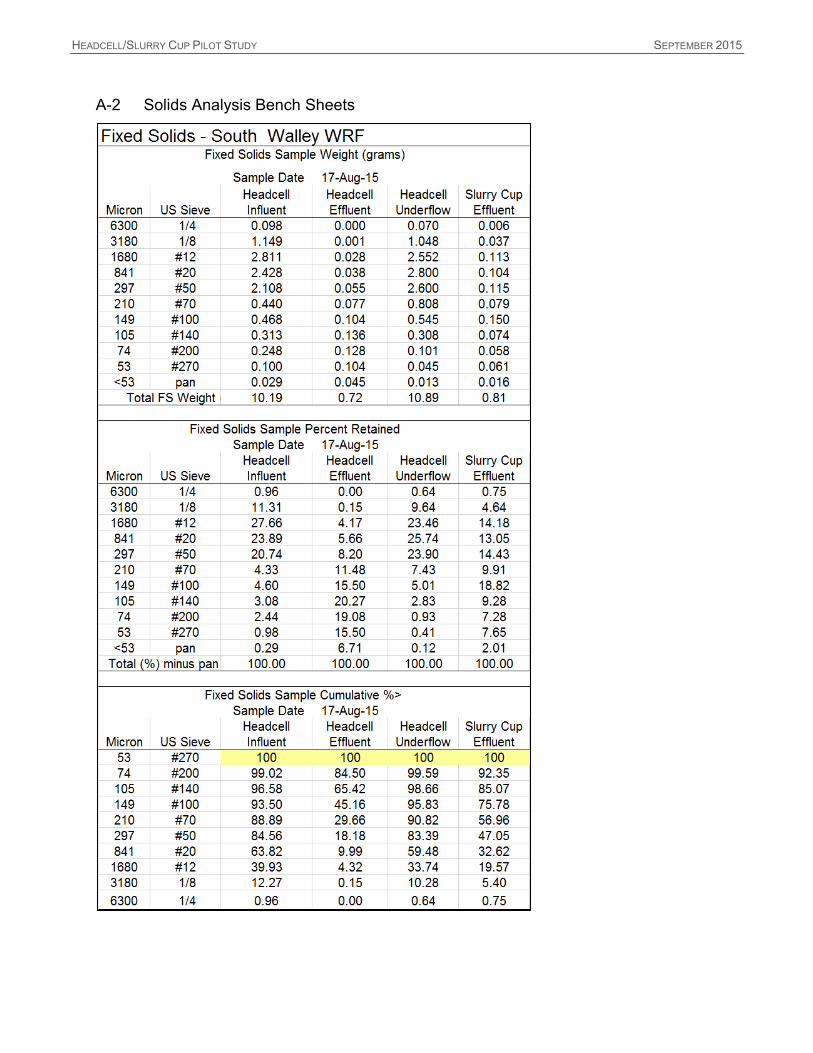
HEADCELL/SLURRY CUP PILOT STUDY SEPTEMBER 2015
A-2 Solids Analysis Bench Sheets

HEADCELL/SLURRY CUP PILOT STUDY SEPTEMBER 2015

HEADCELL/SLURRY CUP PILOT STUDY SEPTEMBER 2015
A-3 Grit Concentration Calculation Bench Sheet

HEADCELL/SLURRY CUP PILOT STUDY SEPTEMBER 2015
A-4 SES Data Analysis

HEADCELL/SLURRY CUP PILOT STUDY SEPTEMBER 2015

HEADCELL/SLURRY CUP PILOT STUDY SEPTEMBER 2015

HEADCELL/SLURRY CUP PILOT STUDY SEPTEMBER 2015

HEADCELL/SLURRY CUP PILOT STUDY SEPTEMBER 2015

HEADCELL/SLURRY CUP PILOT STUDY SEPTEMBER 2015

HEADCELL/SLURRY CUP PILOT STUDY SEPTEMBER 2015
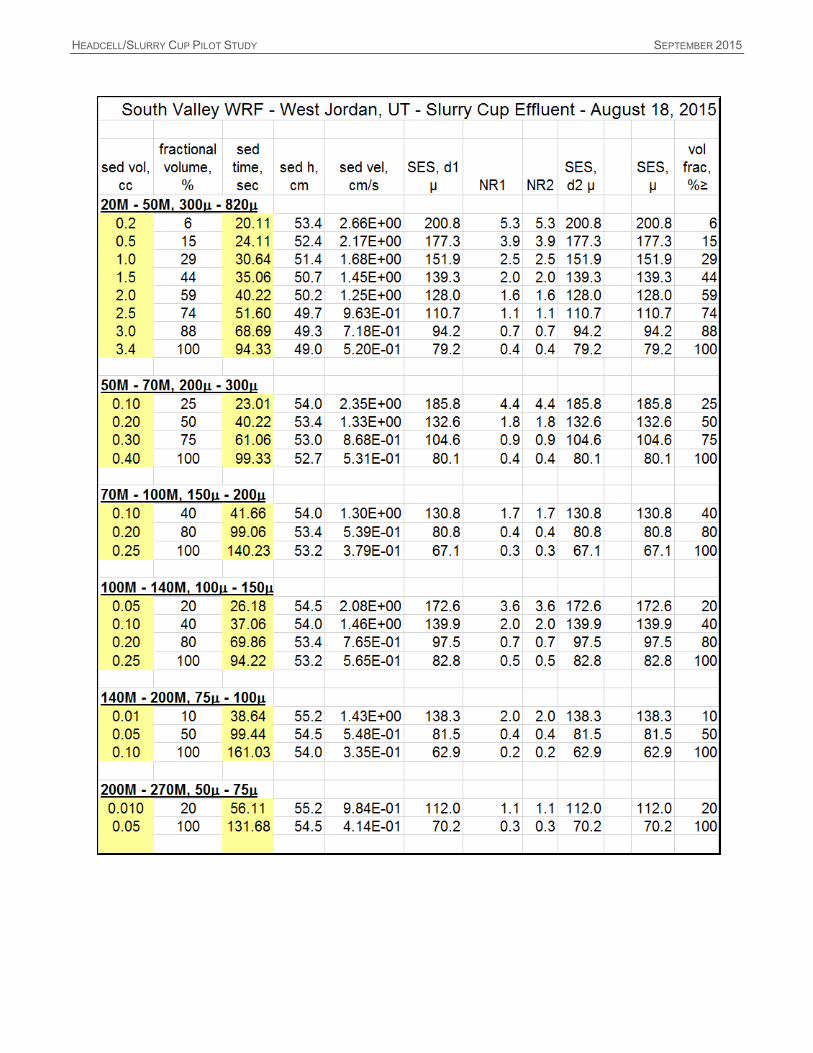
HEADCELL/SLURRY CUP PILOT STUDY SEPTEMBER 2015

HEADCELL/SLURRY CUP PILOT STUDY SEPTEMBER 2015
A-5 SES Charts
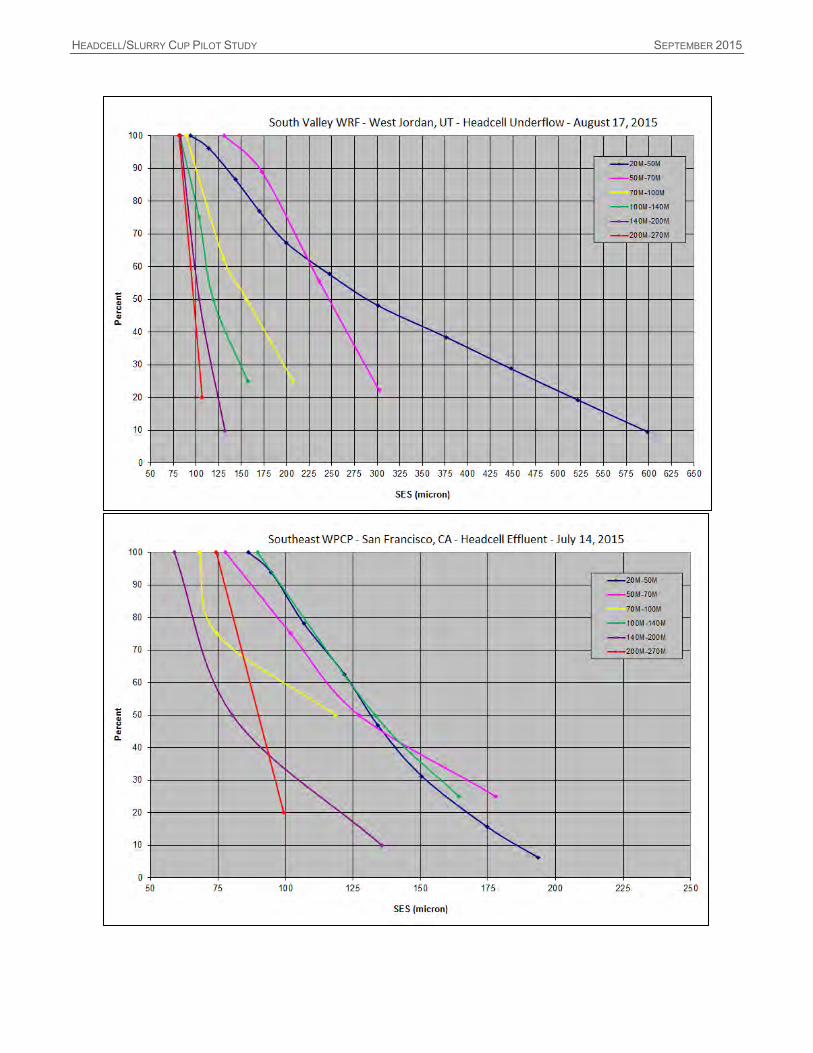
HEADCELL/SLURRY CUP PILOT STUDY SEPTEMBER 2015

HEADCELL/SLURRY CUP PILOT STUDY SEPTEMBER 2015
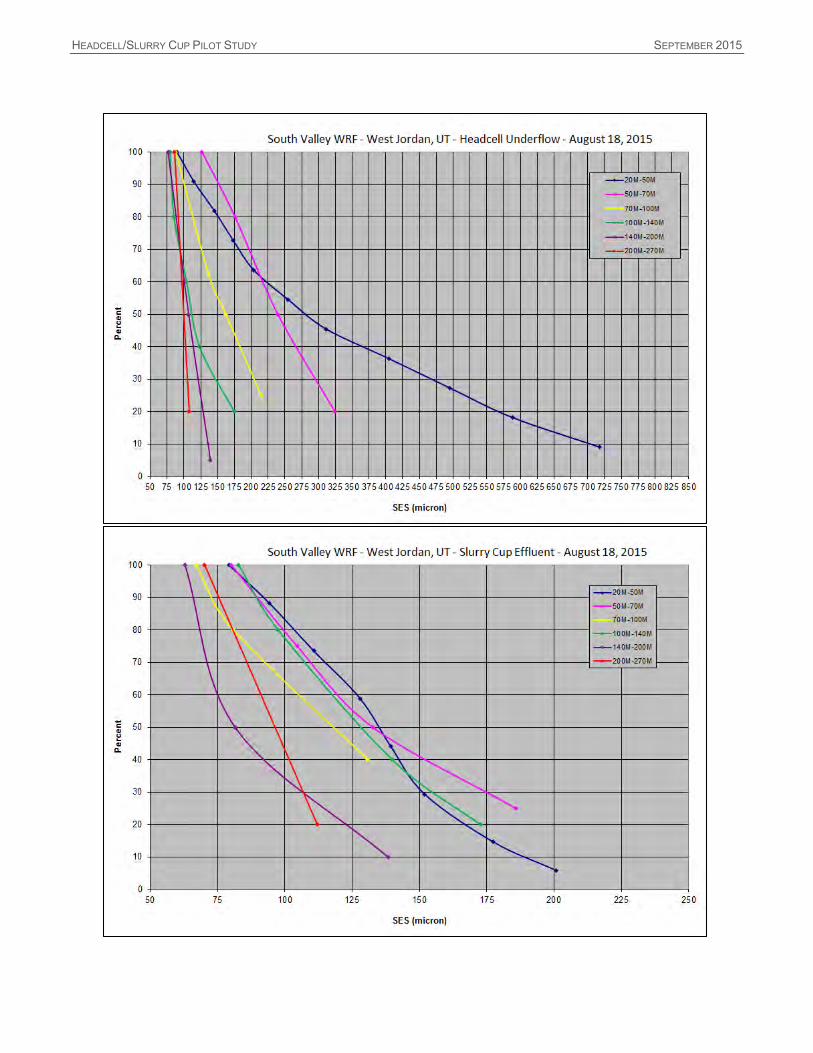
HEADCELL/SLURRY CUP PILOT STUDY SEPTEMBER 2015

HEADCELL/SLURRY CUP PILOT STUDY SEPTEMBER 2015
A-6 SES Chart Analysis

HEADCELL/SLURRY CUP PILOT STUDY SEPTEMBER 2015

HEADCELL/SLURRY CUP PILOT STUDY SEPTEMBER 2015
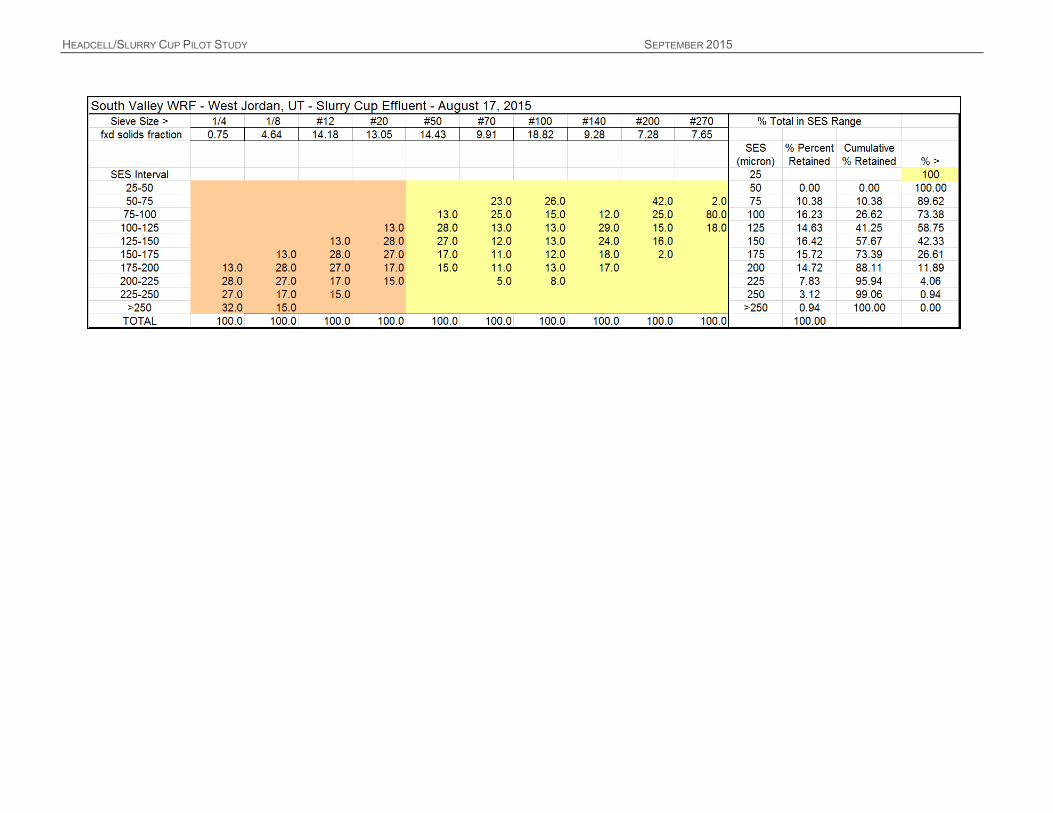
HEADCELL/SLURRY CUP PILOT STUDY SEPTEMBER 2015

HEADCELL/SLURRY CUP PILOT STUDY SEPTEMBER 2015
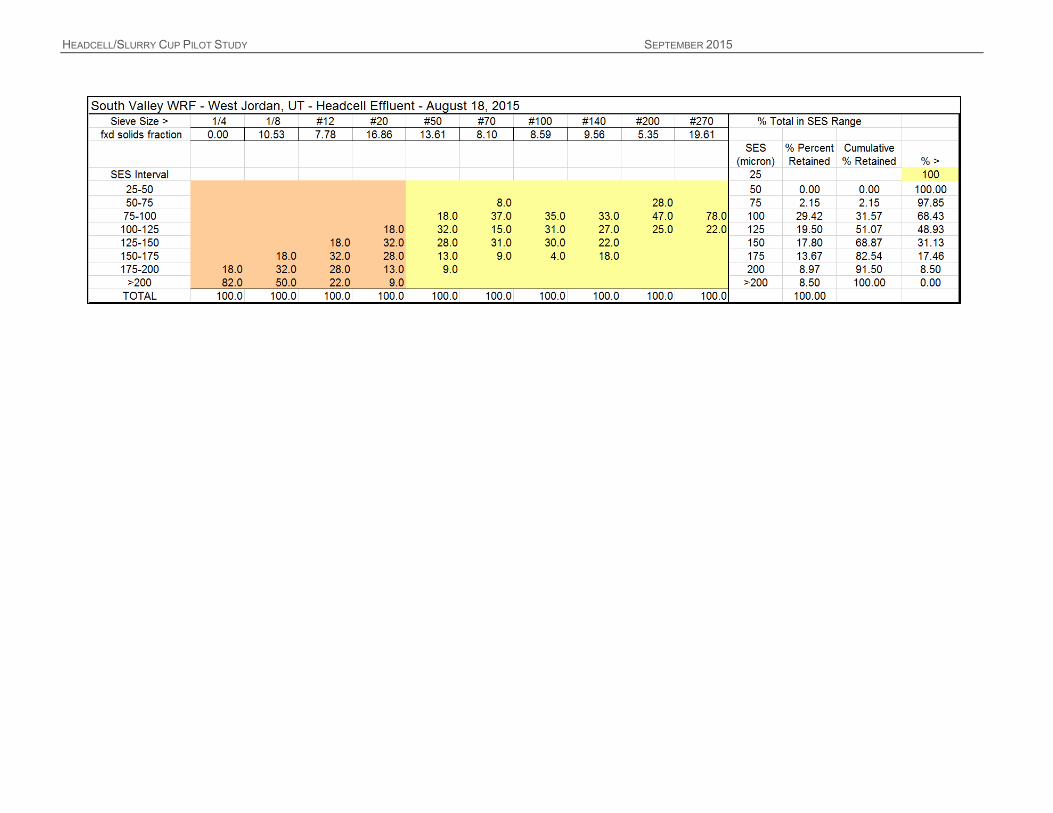
HEADCELL/SLURRY CUP PILOT STUDY SEPTEMBER 2015

HEADCELL/SLURRY CUP PILOT STUDY SEPTEMBER 2015

HEADCELL/SLURRY CUP PILOT STUDY SEPTEMBER 2015
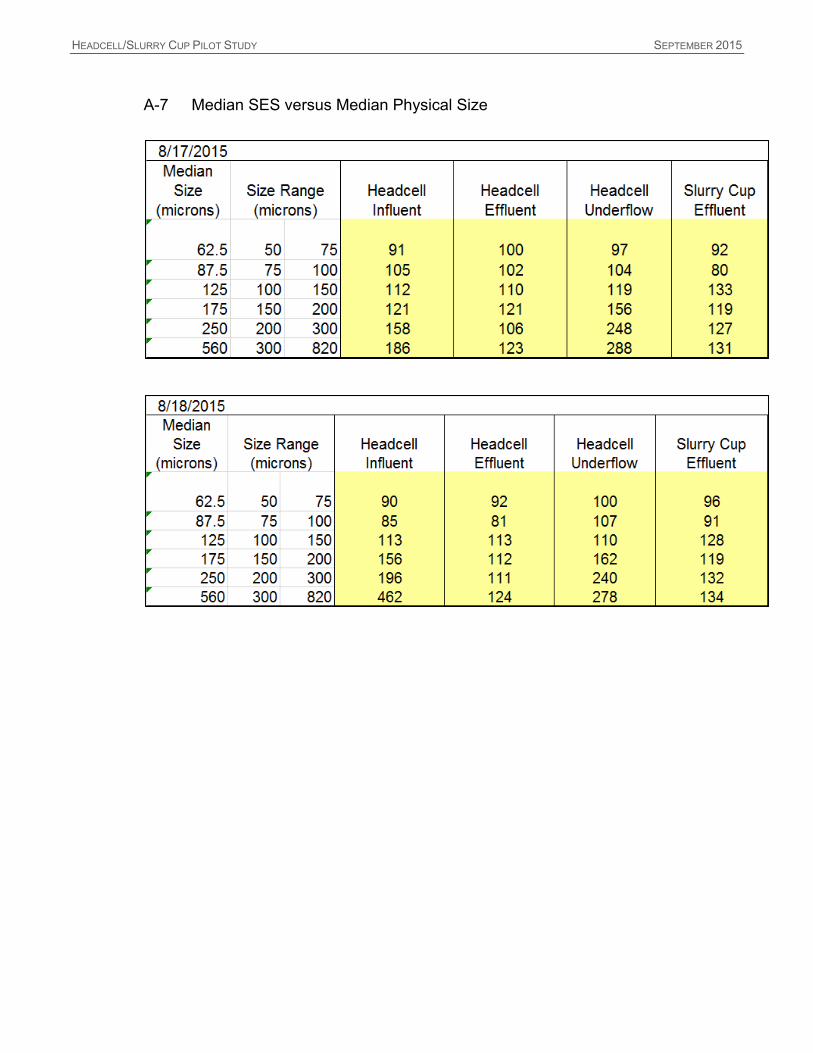
HEADCELL/SLURRY CUP PILOT STUDY SEPTEMBER 2015
A-7 Median SES versus Median Physical Size

HEADCELL/SLURRY CUP PILOT STUDY SEPTEMBER 2015
APPENDIX B
CALCULATIONS

HEADCELL/SLURRY CUP PILOT STUDY SEPTEMBER 2015
Drag Coefficient (Cd) 24/NR + 3/sqrt NR + 0.34 Reynolds number (NR) (settling velocity of particle)(diameter of particle)/kinematic viscosity Stoke’s Law Settling velocity (m/s) = g(sgp – 1)d2p/18v Where g = acceleration due to gravity (9.81 m/s2) sgp = specific gravity of particle
dp = diameter of particle v = kinematic viscosity (m2/s) % Total Solids (grams dry weight/grams wet weight)*100 % Total Volatile Solids [(grams dry weight - grams ash weight)/ grams dry weight]*100

APPENDIXF
HYDROINTERNATIONALPILOTTESTINGPROCEDURE
Hydro International ▪ 2925 NW Aloclek Drive #140 ▪ Hillsboro, OR 97124 ▪ Tel: (503) 615-8130 ▪ Fax: (503) 615-2906
www.Hydro-International.biz ▪ E-mail: [email protected]
HeadCell Pilot Background
The SVWRF executed an agreement with Hydro International on May 12, 2015 to execute a joint pilot project to test for initial test a Eutek HeadcellTM grit concentrator (settler) and a Eutek SlurrycupTM (washer). Hydro International provided the pilot equipment and a process engineer to assist with initial setup and testing. SVWRF provided the influent and effluent piping, influent pump, service water and power feeds. SVWRF also contracted with a third party, Black Dog Analytical, for the final week grit sampling and analysis work. The pilot project is intended to evaluate the performance of Hydro International’s equipment on removing grit at SVWRF from 105 microns and larger. A target influent flow rate of 450 gpm to the HeadcellTM was used. The first three weeks the pilot is to be ran by SVWRF staff. SVWRF during this time will collect and the grit captured by the pilot equipment. This grit will be manually decanted, weighed, sampled and tested by SVWRF staff. The final week of the pilot, SVWRF staff will operate the pilot equipment under the direction of Black Dog Analytical while grit sampling and analysis is performed. Two days of work in the field by Black Dog Analytical is expected. Black Dog Analytical will produce report showing the findings of the sampling and analysis.
SVWRF Pilot Protocol
The minimum initial test period to run the pilot is 4 hours to obtain representative samples of the HeadCell Pilot output for analysis. This should provide a minimum sample of 1500-2000 grams for the particle gradation of the SlurryCup output. Test conditions, to include weather and flow characteristics, will dictate the actual run time after the first test is complete and samples have been collected if subsequent tests are to be performed.
1. Start service water to the SlurryCup underflow. Flow should be regulated between 8-10 gpm on the flow meter.
2. Start plant influent channel feed pump to deliver flow to the HeadCell. 3. When the HeadCell begins to overflow start the HeadCell underflow pump, (also known
as the SlurryCup feed pump). a. Adjust the feed rate to approximately 8 gpm to the “SlurryCup underflow” settler
using the ¼ turn ball valve on the settler influent hose. As a visual guide, flow is typically at the ½ full opening of the 2” hose connection in the settler overflow weir box. The flow rate is fine tuned using the settler 2” overflow hose and a 5-gallon bucket to obtain a time to fill flow measurement. Due to periods of high rate solids removal it is necessary to periodically check the feed valve for plugging. If the valve is starting to plug it should be briefly opened to clear the solids accumulation in the line and returned back to its original flow position. It should be noted that the flow rate visual guide referenced earlier is a useful

Page | 2
indicator for a plugging feed valve as the flow rate or depth of flow of water leaving the settler via the hose connection will decrease over time as the plug occurs.
b. Once every 30 minutes discharge the 1 ½” ¼ turn SlurryCup underflow valve at the axial base of the vessel into a quart container to avoid build up of solids in the base of the vessel that could cause the underflow to block. Allow the solids to settle and decant the free water from the sample. Use a second quart container after the first blow down of grit to collect subsequent samples and decant these and deposit in the original quart container to build up the sample over the duration of the test. If the underflow experiences a hydraulic lock when opened, open the small ¼ turn bleed valve at the top center of the vessel to break the hydraulic lock and allow the underflow to drain into the quart sample container. After observing the sample from burping the SlurryCup the sample may be deposited in the settler being careful not to wash any of the sample down the settler overflow.
4. The test run duration shall be determined by SVWRF staff. The duration should be long enough achieve a measureable amount of settled grit that can be decanted and easily homogenized by stirring for the purpose of taking a sample for the lab. The test duration should begin at 48 hours. When the test duration is achieved shut down the HeadCell feed pump.
5. Close ¼ turn ball valves on the HeadCell influent sample settler and the HeadCell effluent sample settler.
6. Keep the HeadCell underflow pump, (also known as the SlurryCup feed pump), running until the HeadCell is empty.
7. As the HeadCell is draining it is advisable to apply a hose to the internal surfaces of the vessel as they become exposed to flush any debris off the surfaces prior to the surfaces drying. This makes it easier to prep the vessel for the next test.
8. When the Headcell is empty stop the HeadCell underflow pump, (also known as the SlurryCup feed pump).
9. Keep the SlurryCup underflow wash water on while the remainder of the sample is collected from the underflow valve. After all of the grit is collected shut off the wash water feed supply at the source and open the wash water ¼ turn valve to bleed off the line pressure into the base of the SlurryCup.
10. Turn off the feed at the yard hydrant to the HeadCell underflow fluidizing line and open the valve to bleed the line pressure.
11. The sample decanting and transfer process is best performed with (2) personnel to properly control the process due to the bulk size of the settler. Decant the washed grit sample by first opening the upper drain petcock. This will allow the water level to drop to a level that will allow the settler to be adjusted to the proper angle to start the decant process due to the weight of water in the settler. Take care to not drain the settler too rapidly as this will allow the grit to be carried out with the exiting water. When the bulk of the water is decanted allow the grit sample to settle and then repeat the process of decanting the remaining water from the sample.

Page | 3
12. When the grit sample is free of standing water, weigh the container with the grit in it and record this as gross weight noting the date and weight. Subtract the tare weight of the container from the gross weight and note the net grit weight. Stir the grit sample to homogenize it. Take a representative sample of the grit and fill a 1 liter sample bottle from the lab. Mark the container as the ‘SlurryCup’ sample along with the date of the sample and the average daily flow into the facility for the test period.
13. The SVWRF lab will perform the following: a. Dry the sample and note the %solids. b. Burn the sample and note the %volatiles.
14. The next test duration shall begin immediately following sample delivery to the lab.

APPENDIXG
PISTA®GRITSYSTEMINFORMATION

O n l i n e : smithandloveless.com • Phone: 913.888.5201 • Fax: 913.888.2173
it maintains the correct velocities approaching the grit chamber. Previously, the most common way to accomplish water level control in the chamber was to back up the flow with a downstream submerged weir. The PISTA® 360™ with V-Force BAFFle™ has preset inlet and outlet openings that supplant the need for the submerged weir. With all of these improvements, the PISTA® 360™ with V-Force BAFFle™ achieves 95% grit removal efficiency down to 140 mesh (105 microns).
By integrating water elevation settings with the V-Force BAFFle™, the overall outlet footprint requirements decrease by as much as half the typical distance. The resulting smaller footprint provides significant construction cost savings.
The PISTA® 360™ Grit Chamber is equipped with the patented V-Force BAFFle™, which is an integral flow control baffle for both the inlet and outlet of the main chamber. The V-Force BAFFle™ directs the inlet flow into the chamber in a manner that ensures the proper vortex flow and prevents short-circuiting. The V-Force BAFFle™ allows for a full 360° rotation from the inlet to the outlet, providing maximum flow travel for effective grit removal.
The V-Force BAFFle™ directs the flow out of the PISTA® Grit Chamber and acts as a “slice weir”, controlling the water level in the main chamber and the inlet channel. No additional downstream flow control device is required to keep the velocity between 3.5 fps (1.06 m/s) at peak flow and 1.6 fps (0.48 m/s) at minimum flow with a 10:1 turn down.
This most recent innovation further enhances the world’s best grit removal scheme by providing engineering and cost saving considerations. By increasing chamber velocity during low flow periods, less grit is permitted to settle in upstream channels. The V-Force BAFFle™ also extends the grit extraction path within the vortex grit chamber. This is a key feature because a longer grit path within the flow pattern dramatically increases the effectiveness of grit being captured on the chamber’s flat-floor.
Beyond this, the PISTA® 360™ with V-Force BAFFle™
also permits design flexibility so that water elevations can be controlled. Water level control is important because
The PISTA® 360™ with V-Force BAFFle™ is just one of many Smith & Loveless design innovations that make PISTA® the world’s leading grit removal system.
Bul
letin
960
© S
mith
& L
ovel
ess
Inc.
, 201
2
PISTA® 360™
with V-FORCE BAFFLE™
95% Grit Removal Efficiency Down to 140 Mesh (105 Microns)
Particle Size

O n l i n e : smithandloveless.com • Phone: 913.888.5201 • Fax: 913.888.2173
PISTA® TURBO™ Grit Pump [Top-Mounted & Remote-Mounted Options]
Removes grit from storage hopper to washing and dewatering. Available in vacuum-primed and flooded
suction arrangements. Now available with SONIC START® prime sensing.
PISTA® 360™ with V-FORCE BAFFLE™ - Page 2
• 95% grit removal efficiency down to 140 mesh (105 microns) particle size.• Construction cost savings due to decreased overall grit system footprint requirements.• Increases grit chamber velocity during low-flow periods.• Full 360° rotation in the chamber, lengthening grit extraction path.• Eliminates the need for downstream level control devices.• Designed to handle wide range of flows.
V-FORCE BAFFLE™ Benefits 0.5I0.5AI0.5B 1.0I1.0AI1.0B 2.5I2.5AI2.5B 4.0I4.0AI4.0B 7.0I7.0AI7.0B 12.0I12.0AI12.0B 20.0I20.0AI20.0B 30.0I30.0AI30.0B 50.0I50.0AI50.0B 70.0I70.0AI70.0B 100.0I100.0AI100.0B
0.5MGD/1,892CMD/22LPS 1.0MGD/3,785CMD/44LPS 2.5MGD/9,465CMD/110LPS 4.0MGD/15,140CMD/175LPS 7.0MGD/26,495CMD/307LPS 12.0MGD/45,420CMD/526LPS 20.0MGD/75,700CMD/876LPS 30.0MGD/113,550CMD/1,314LPS 50.0MGD/189,250CMD/2,190LPS 70.0MGD/265,000CMD/3,067LPS 100.0MGD/378,500CMD/4,381LPS
PISTA® Model Number Max. Flow (U.S. / Metric / LPS)
PISTA® Grit Chamber Features and Benefits
Storage HopperStores removed grit prior to dewatering.
Inlet ChannelControls velocity of influent and draws grit to the grit chamber floor.
PISTA® Grit FluidizerPatented blade exclusive to S&L design. Loosens collected grit, preventing compacting.
PISTA® V-FORCE BAFFLE™New, patented innovation enhances removal efficiency for low-flow periods and offers design engineering benefits.
Coanda RampEngineered entry facilitates laminar flow so that it takes a steady tangential direction as it enters the grit chamber and properly conditions the grit for entrapment.
Bull Gear DriveProvides minimum service 5.0 factor and trouble-free operation.
Exclusive Flat-Bottom Basin FloorFacilitates the forced vortex flow
pattern inside the chamber. Minimizes organic capture while hydraulically
directing grit into lower hopper. Patented, 360-degree in-line design.
Hopper Cover PlateStationary and recessed, it removes for quick access to storage hopper.
Axial-Flow PropellerAids in directing organic-free grit into
lower hopper by enhancing flow patterns. Rounded edges prevent solids build-up,
thus ensuring high efficiency.
Outlet ChannelS&L can assist
with design information for optimal
performance.

APPENDIXH
HEADCELL®SYSTEMINFORMATION

The Eutek HeadCell® is the ideal grit separator for both new and retrofi t applications. The HeadCell® is a multiple tray separator that can
be sized to remove fi ne grit over a wide range of fl ows with less than a foot of headloss. The HeadCell® provides unparalleled performance
in a small footprint.
• New wastewater treatment plants
• Treatment plant retrofi ts
• Sediment removal pretreatment for potable water
• Grit removal for industrial effl uent
• Pre-treatment for MBR and any other advanced processes
Advantages • Large surface area in a small footprint
• No moving parts or external power source
• Less than a foot of headloss to operate
• Double treatment capacity in the same footprint as existing equipment
• Economical to own and operate
• Easily accommodates high turndown ratios
Applications How it WorksThe stack of hydraulically independent polyethylene trays are
submerged in a concrete chamber. Screened sewage enters
the influent duct and passes into the grit chamber. The influent
duct directs the flow into the high efficiency distribution header to
evenly distribute the influent tangentially into the modular multiple-
tray system.
Tangential feed establishes a vortex flow pattern causing solids to
fall into a boundary layer on each tray. Grit settles out by gravity
along the sloped surface of each tray and then solids are swept
to the center opening which allows them to fall to a common
collection sump. Degritted effluent flows out of the trays, over a
weir and into an effluent trough. The HeadCell® typically requires
less than 12 inches of headloss.
Often, the settled solids are continuously pumped from the grit
sump to an open vortex grit washing system (GritCup®/Eutek
TeaCup®/SlurryCup™) and then dewatered by either a Eutek Grit
Snail® dewatering escalator or SpiraSnail®, depending on grit load.
An intermittent pumping configuration is also available.
www.hydro-int.com Tel: (866) 615 8130
Eutek HeadCell®
Advanced Stacked Tray Grit Separation
Product Profi le
SlurryCup™, TeaCup® or GritCup®
washing
Eutek HeadCell® (in concrete tank) grit removal
Grit Snail® or SpiraSnail®
dewatering
Underflow Collection Sump
Distribution Header
Influent
Effluent
Settling Trays
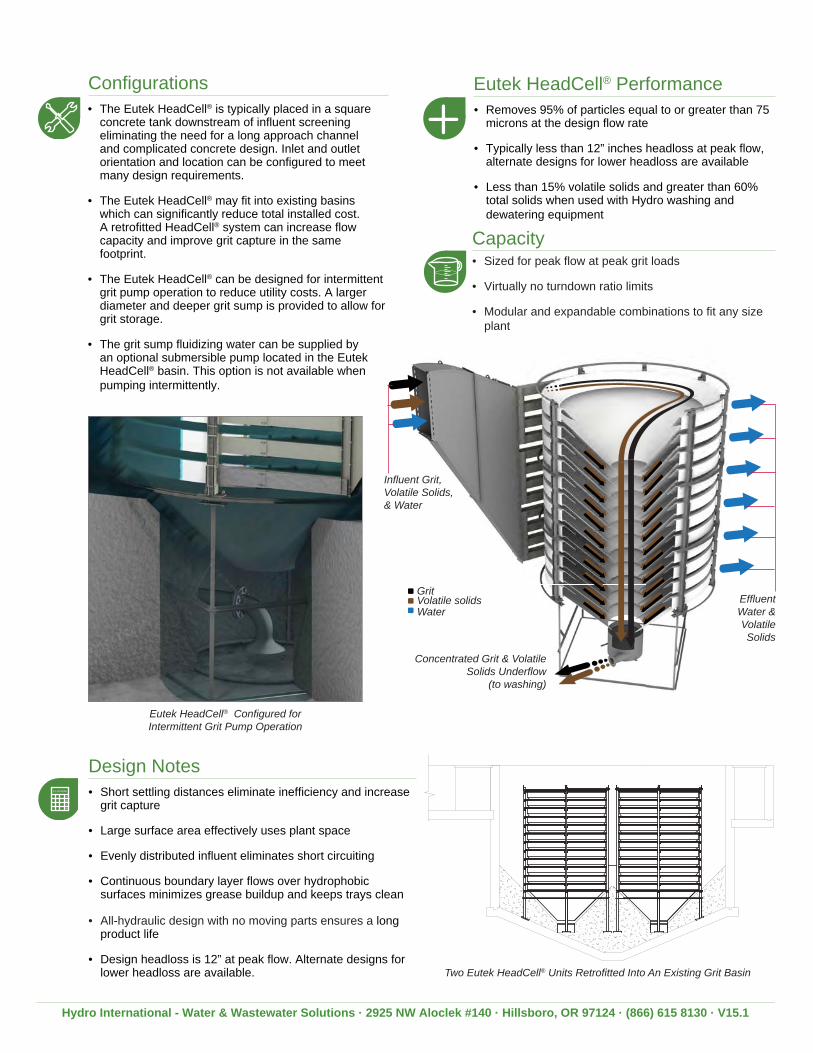
Grit
Organics
Water
Hydro International - Water & Wastewater Solutions · 2925 NW Aloclek #140 · Hillsboro, OR 97124 · (866) 615 8130 · V15.1
+-
3.14159265
Capacity • Sized for peak fl ow at peak grit loads
• Virtually no turndown ratio limits
• Modular and expandable combinations to fi t any size
plant
Eutek HeadCell® Performance
• Removes 95% of particles equal to or greater than 75 microns at the design fl ow rate
• Typically less than 12” inches headloss at peak fl ow, alternate designs for lower headloss are available
• Less than 15% volatile solids and greater than 60% total solids when used with Hydro washing and
dewatering equipment
Design Notes
• Short settling distances eliminate ineffi ciency and increase grit capture
• Large surface area effectively uses plant space
• Evenly distributed infl uent eliminates short circuiting
• Continuous boundary layer fl ows over hydrophobic surfaces minimizes grease buildup and keeps trays clean
• All-hydraulic design with no moving parts ensures a long product life
• Design headloss is 12” at peak fl ow. Alternate designs for lower headloss are available.
• The Eutek HeadCell® is typically placed in a square concrete tank downstream of infl uent screening eliminating the need for a long approach channel and complicated concrete design. Inlet and outlet orientation and location can be confi gured to meet many design requirements.
• The Eutek HeadCell® may fi t into existing basins which can signifi cantly reduce total installed cost. A retrofi tted HeadCell® system can increase fl ow capacity and improve grit capture in the same footprint.
• The Eutek HeadCell® can be designed for intermittent grit pump operation to reduce utility costs. A larger diameter and deeper grit sump is provided to allow for grit storage.
• The grit sump fl uidizing water can be supplied by an optional submersible pump located in the Eutek HeadCell® basin. This option is not available when
pumping intermittently.
Confi gurations
Two Eutek HeadCell® Units Retrofitted Into An Existing Grit Basin
Concentrated Grit & Volatile Solids Underflow
(to washing)
Effluent Water & Volatile Solids
Influent Grit, Volatile Solids, & Water
Eutek HeadCell® Configured for Intermittent Grit Pump Operation
GritVolatile solidsWater

APPENDIXI
HEADCELL®ESTIMATESUMMARY
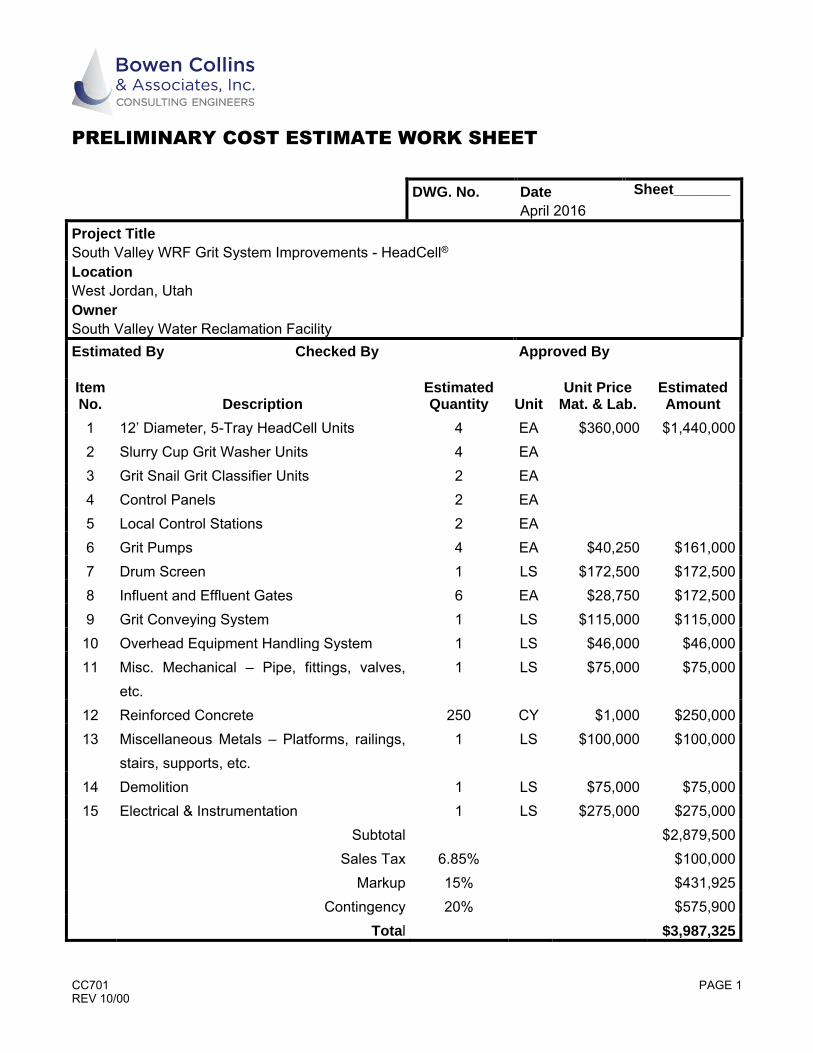
CC701 PAGE 1 REV 10/00
PRELIMINARY COST ESTIMATE WORK SHEET
DWG. No.
Date
April 2016 Sheet_______
Project Title
South Valley WRF Grit System Improvements - HeadCell® Location
West Jordan, Utah Owner
South Valley Water Reclamation Facility Estimated By
Checked By
Approved By
Item No.
Description
Estimated Quantity
Unit
Unit Price Mat. & Lab.
Estimated Amount
1 12’ Diameter, 5-Tray HeadCell Units 4 EA $360,000 $1,440,000 2 Slurry Cup Grit Washer Units 4 EA 3 Grit Snail Grit Classifier Units 2 EA 4 Control Panels 2 EA 5 Local Control Stations 2 EA 6 Grit Pumps 4 EA $40,250 $161,000 7 Drum Screen 1 LS $172,500 $172,500 8 Influent and Effluent Gates 6 EA $28,750 $172,500 9 Grit Conveying System 1 LS $115,000 $115,000
10 Overhead Equipment Handling System 1 LS $46,000 $46,000 11 Misc. Mechanical – Pipe, fittings, valves,
etc. 1 LS $75,000 $75,000
12 Reinforced Concrete 250 CY $1,000 $250,000 13 Miscellaneous Metals – Platforms, railings,
stairs, supports, etc. 1 LS $100,000 $100,000
14 Demolition 1 LS $75,000 $75,000 15 Electrical & Instrumentation 1 LS $275,000 $275,000
Subtotal $2,879,500 Sales Tax 6.85% $100,000 Markup 15% $431,925 Contingency 20% $575,900 Total $3,987,325

APPENDIXJ
PISTA®ESTIMATESUMMARY

CC701 PAGE 1 REV 10/00
PRELIMINARY COST ESTIMATE WORK SHEET
DWG. No.
Date
April 2016 Sheet_______
Project Title
South Valley WRF Grit System Improvements – Pista® Grit Location
West Jordan, Utah Owner
South Valley Water Reclamation Facility Estimated By
Checked By
Approved By
Item No.
Description
Estimated Quantity
Unit
Unit Price Mat. & Lab.
Estimated Amount
1 S&L Model 50 Pista System 2 EA $242,000 $484,000 2 Top-Mounted Vacuum-Primed Pumps 2 EA 3 Vacuum Priming Panel 2 EA 4 Main Control Panel 1 EA 5 Grit Concentrator 2 EA 6 Grit Washer 4 EA 7 Drum Screen 1 EA $172,500 $172,500 8 Influent and Effluent Gates 3 EA $28,750 $86,250 9 Grit Conveying System 1 LS $115,000 $115,000
10 Overhead Equipment Handling System 1 $46,000 $46,000 11 Misc. Mechanical – Pipe, fittings, valves,
etc. 1 LS $50,000 $50,000
12 Reinforced Concrete 500 CY $1,000 $500,000 13 Miscellaneous Metals – Platforms, railings,
stairs, supports, etc. 1 LS $100,000 $100,000
14 Demolition 1 LS $75,000 $75,000 15 Electrical & Instrumentation 1 LS $175,000 $175,000
Subtotal $1,802,750 Sales Tax 6.85% $60,000 Markup 15% $270,412 Contingency 20% $360,550 Total $2,493,712

Southern Utah Area Office:20 North Main
Suite 107
St. George, Utah 84770
Phone: (435) 656-3299
Fax: (435) 656-2190
Salt Lake Area Office:154 East 14000 South
Draper, Utah 84020
Phone: (801) 495-2224
Fax: (801) 495-2225
Boise Area Office:776 East Riverside Drive
Suite 125
Eagle, Idaho 83616
Phone: (208) 939-9561
Fax: (208) 939-9571