gridley biofuels project final report - home - dri … · gridley biofuels project final report doe...
TRANSCRIPT

Gridley Biofuels Project Final Report
DDOOEE PPrroojjeecctt DDEE--FFCC3366--0033GGOO1133007711
PPrreeppaarreedd ffoorr RREEIIII
Prepared by:
S. Kent Hoekman Curtis Robbins Xiaoliang Wang
Desert Research Institute
Division of Atmospheric Sciences
July 21, 2010
i
TABLE OF CONTENTS A. Abstract .............................................................................................................................................. 1
B. Background/Objectives ...................................................................................................................... 2
C. Description of the Synterra Biorefinery ............................................................................................. 3
D. 2008 Synterra Biorefinery Syngas Characterization Studies .............................................................. 6
1. Plant Operation Plans ........................................................................................................................ 6
2. Analytical Methodologies ................................................................................................................. 8
3. Analytical Results ............................................................................................................................ 10
E. 2009 Synterra Biorefinery Syngas Characterization Studies ............................................................ 17
1. Biorefinery and Analytical Improvements ...................................................................................... 17
2. Plant Operation Plans ...................................................................................................................... 19
3. Analytical Methodologies ............................................................................................................... 20
4. Analytical Results ............................................................................................................................ 22
4a. Integrated Laboratory Measurements ........................................................................................ 23
4b. Real-Time Particulate Measurements ........................................................................................ 30
F. Discussion ........................................................................................................................................ 34
G. Conclusions ...................................................................................................................................... 39
H. References ........................................................................................................................................ 40
I. Appendices ........................................................................................................................................... 41
1. Glossary ........................................................................................................................................... 41
2. Protocols for Sampling and Analysis of Syngas ............................................................................. 42
3a. Syngas Sample Identification and Notes – 2008 Field Campaign ................................................. 52
3b. Syngas Sample Identification and Notes - 2009 Field Campaign ................................................. 53
3c. Syngas Sample Volumes and Sampling Conditions – 2009 Field Campaign ............................... 54
4a. Laboratory Results – 2008 Field Campaign .................................................................................. 55
4b. Laboratory Results – 2009 Field Campaign .................................................................................. 58
LIST OF FIGURES Figure 1 – Demonstration Plant for Conversion of Biomass to Biofuels and Electricity ............................. 2
Figure 2 – Unit Processes for the Synterra Biorefinery. ............................................................................... 4
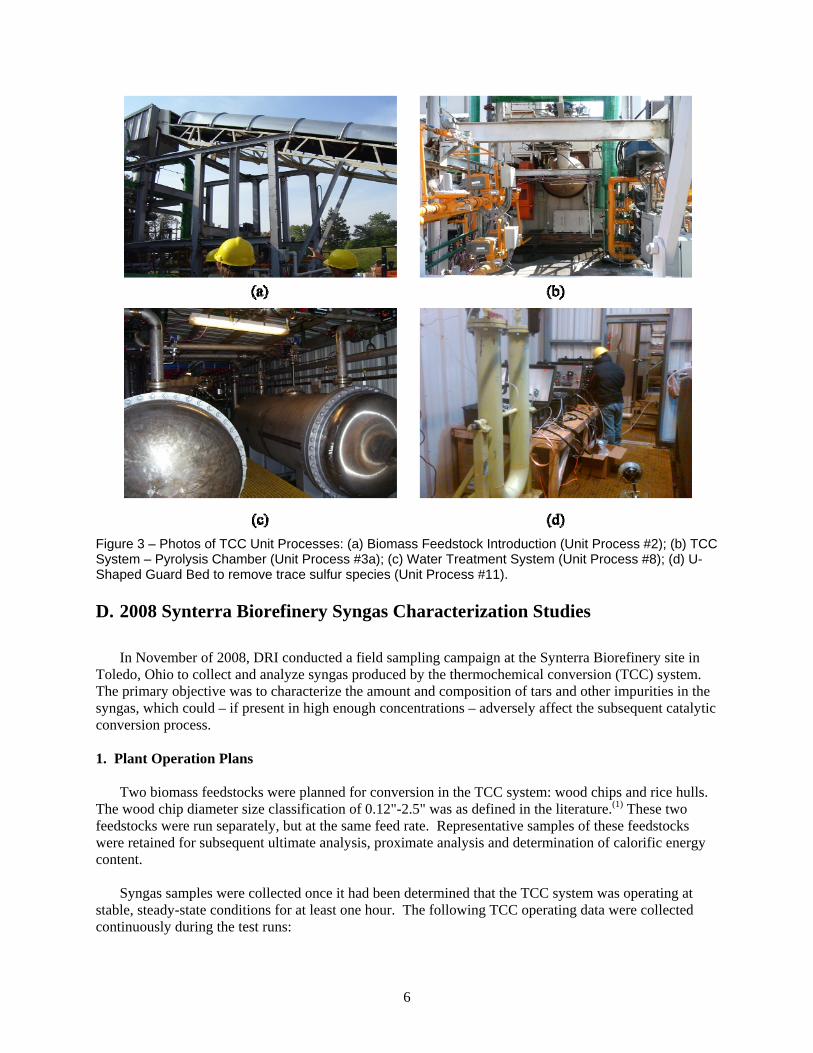
Figure 3 – Photos of TCC Unit Processes: (a) Biomass Feedstock Introduction (Unit Process #2); (b) TCC
System – Pyrolysis Chamber (Unit Process #3a); (c) Water Treatment System (Unit Process #8); (d) U-
Shaped Guard Bed to remove trace sulfur species (Unit Process #11). ........................................................ 6

ii
Figure 4 – Continuous Analyzers in the TCC System Control Room. ......................................................... 8
Figure 5 – DRI Syngas Sampling and Analysis Equipment used in 2008 Field Campaign ......................... 8
Figure 6 – Major Syngas Constituents (2008) ............................................................................................ 12
Figure 7 – Total PM Mass in Syngas (2008) .............................................................................................. 12
Figure 8 – Carbonaceous Material in Syngas (2008) .................................................................................. 13
Figure 9 – PM Elements in Syngas Samples (2008) ................................................................................... 13
Figure 10 – Ammonia in Syngas (2008) ..................................................................................................... 14
Figure 11 – Anions in Syngas Particulate (2008) ....................................................................................... 14
Figure 12 – Acid Gases in Syngas Samples (2008) .................................................................................... 15
Figure 13 – Carbonyl Compounds in Syngas (2008) .................................................................................. 15
Figure 14 – VOCs in Syngas Samples (2008) ............................................................................................ 16
Figure 15 – SVOCs in Syngas Samples (2008) .......................................................................................... 16
Figure 16 – Modified portable syngas dilution sampling system ............................................................... 18
Figure 17 – DRI’s portable, dilution sampling system for collection of syngas: (a) dilution tunnel
component, (b) entire train of sampling equipment in use at Toledo. ........................................................ 19
Figure 18 – On-line GC Analysis of Syngas Composition: Dec. 2009....................................................... 20
Figure 19 – Major syngas constituents (2009) ............................................................................................ 24
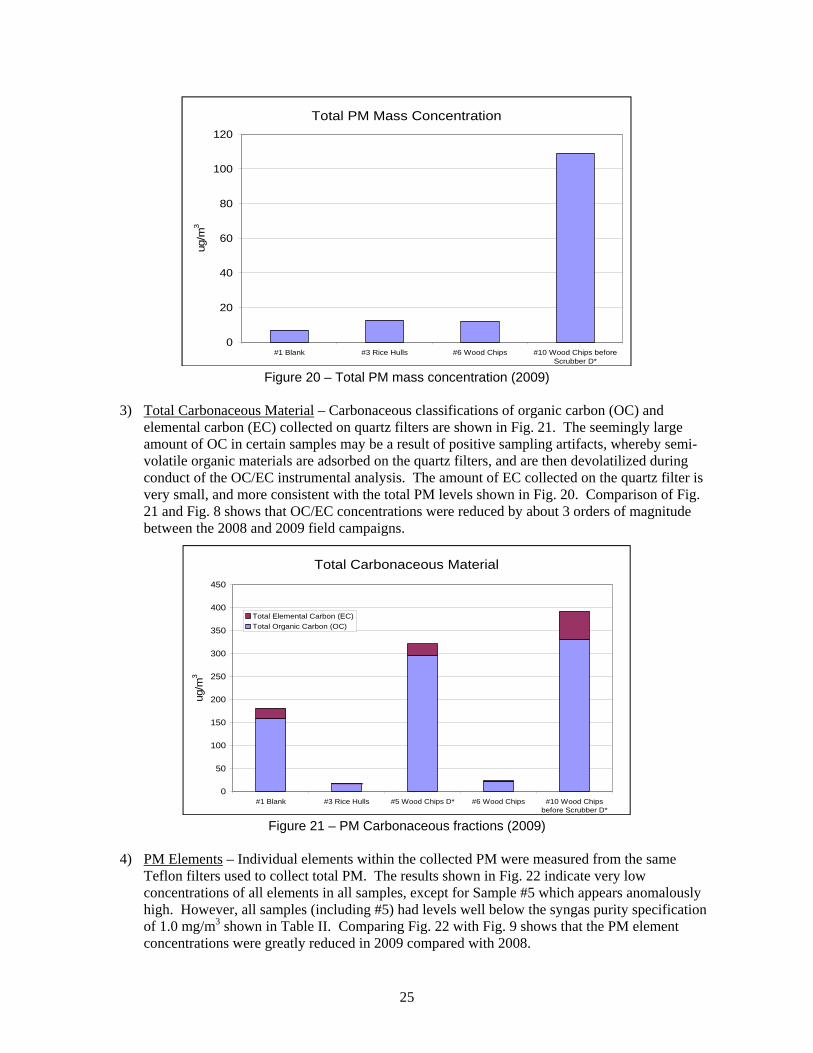
Figure 20 – Total PM mass concentration (2009) ....................................................................................... 25
Figure 21 – PM Carbonaceous fractions (2009) ......................................................................................... 25
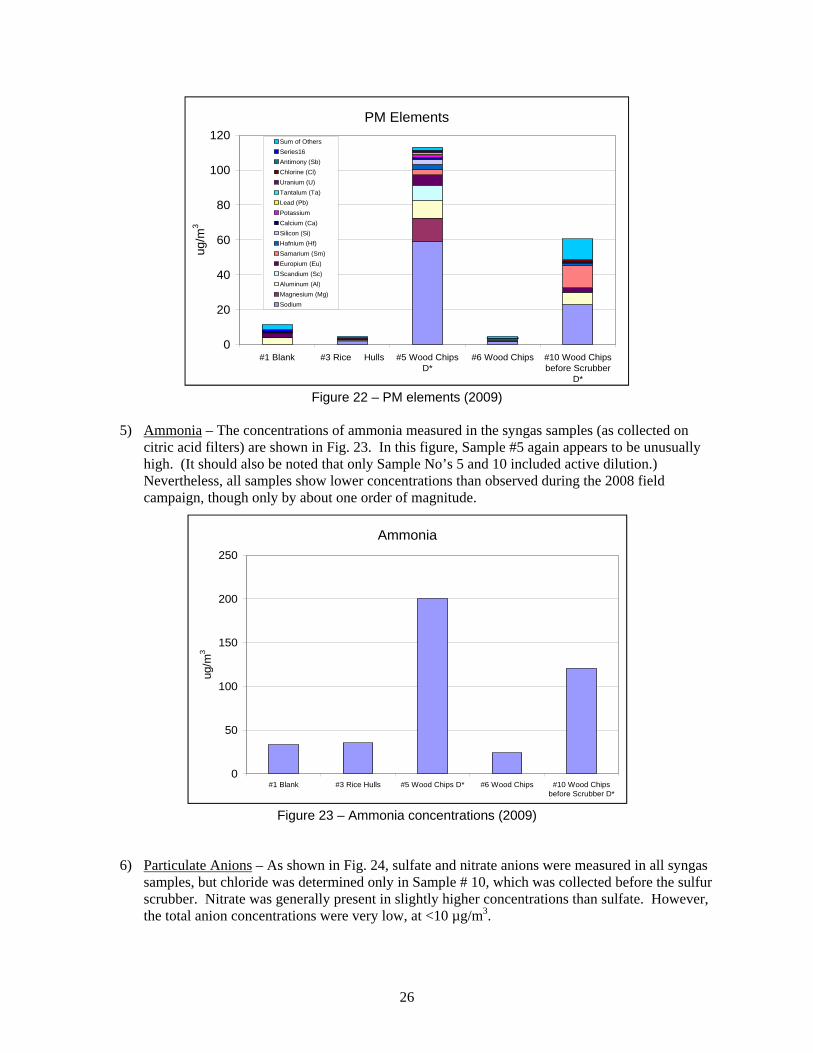
Figure 22 – PM elements (2009)................................................................................................................. 26
Figure 23 – Ammonia concentrations (2009) ............................................................................................. 26
Figure 24 – Particulate anions (2009) ......................................................................................................... 27
Figure 25 – Particulate cations (2009) ........................................................................................................ 27
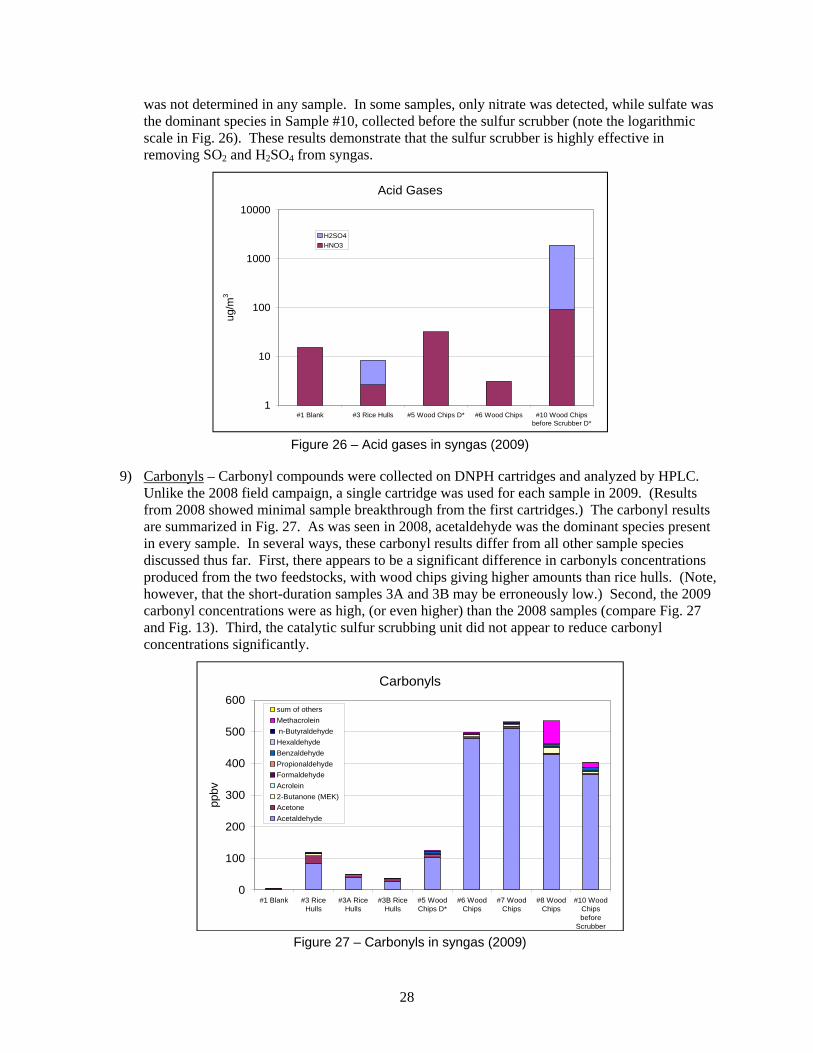
Figure 26 – Acid gases in syngas (2009) .................................................................................................... 28
Figure 27 – Carbonyls in syngas (2009) ..................................................................................................... 28
Figure 30 – Real-Time PM2.5 Mass Concentration Measurements ............................................................. 31
Figure 31 – Real-Time Particle Number Concentrations ............................................................................ 32
Figure 32 – Other Real-Time PM Comparisons ......................................................................................... 33
Figure 33 – Syngas Compositions: Comparison of 2008 and 2009 Samples (a) Total PM Mass
Concentration; (b) Carbonaceous Material; (c) Ammonia; (d) Particulate Anions .................................... 37
Figure 34 – Syngas Compositions: Comparison of 2008 and 2009 Samples (a) Acid Gases; (b) Carbonyls;
(c) VOCs; (d) SVOCs ................................................................................................................................. 38

iii
LIST OF TABLES Table I – Major Syngas Components ............................................................................................................ 7
Table II – Syngas Purity Specifications ........................................................................................................ 7
Table III – DRI’s 2008 Syngas Sampling and Analysis Procedures ............................................................ 9
Table IV – Filter Pack Configurations for Syngas Collection in 2008 ....................................................... 10
Table V – Toledo Syngas Samples Collected in November, 2008 ............................................................. 11
Table VI – DRI’s 2009 Syngas Sampling and Analysis Procedures .......................................................... 21
Table VII – Filter Pack Configurations for Syngas Collection in 2009 ...................................................... 21
Table VIII – Toledo Syngas Samples Collected in December, 2009 .......................................................... 23
Table IX - Test Numbers used for Comparison of 2008 and 2009 Syngas Composition .......................... 34
1
A. Abstract This report summarizes DRI’s total efforts in support of the multi-year Gridley Biofuels Project: DOE Project DE-FC36-03GO13071. The overall objective of the Gridley Biofuels Project is to develop and demonstrate effective thermal conversion technologies for transforming lignocellulosic biomass feedstocks into liquid transportation fuels. The specific objectives for DRI were to sample and characterize syngas produced from a thermochemical conversion (TCC) process plant while operating on two feedstocks: wood chips and rice hulls. Syngas sampling was successfully conducted during two field campaigns at a TCC process plant operated by Red Lion Bio-Energy as part of the Synterra Biorefinery located in Toledo, Ohio. The first field sampling campaign was conducted in November of 2008. Raw (undiluted) syngas was sampled and collected using a variety of sampling media for subsequent laboratory analysis of gas-phase and particle-phase impurities in the syngas. Because the syngas cleanup system was not optimized at this time, very high concentrations of tars and other impurities were observed in most samples. Before the second field sampling campaign in December of 2009, numerous improvements expected to clean-up the syngas were made at the Synterra Biorefinery. In addition, a dilution sampling system was developed and deployed, enabling collection of N2-diluted syngas, in addition to raw syngas. The 2009 field campaign also included real-time measurement of particle number counts and PM2.5 concentration levels. Due to the many process and sampling changes that occurred between the two field sampling campaigns, direct comparison of syngas impurities between 2008 and 2009 should only be done with great caution. Overall, however, it is clear that the concentrations of most impurity species were considerably lower in 2009 compared to 2008. Total PM, total carbonaceous material [elemental carbon (EC) and organic carbon (OC)], particulate anions, and SVOCs were all reduced by about three orders of magnitude. Ammonia, acid gases, and VOCs were reduced by about one order of magnitude. Carbonyl concentrations were unchanged between 2008 and 2009. For most syngas species, substantial concentration differences were not observed between the two biomass feedstocks: rice hulls and wood chips. Exceptions were noted for ammonia, carbonyls, and particulate anions, where somewhat higher concentrations were observed from use of wood chips. Samples collected in 2009 demonstrated that use of a ZnO/CuO sulfur scrubbing column was effective in reducing concentrations of many impurities besides sulfur – including total PM, acid gases, VOCs, and SVOCs; but not ammonia or carbonyls species. Real-time measurements of PM2.5 concentrations and particle number counts confirmed the overall cleanliness of the syngas from both feedstocks with respect to PM impurities, and demonstrated the effectiveness of the sulfur scrubber in reducing both particle numbers and PM2.5 concentrations. The measured syngas particle number counts were similar to those typically seen in unpolluted indoor air situations, and were about three orders of magnitude below levels observed in diesel engine exhaust. Results of this work confirmed that the Synterra Biorefinery is capable of producing syngas from biomass feedstocks having very low impurity levels. This high purity is necessary to enable subsequent catalytic conversion of the syngas to liquid hydrocarbon fuels.
2
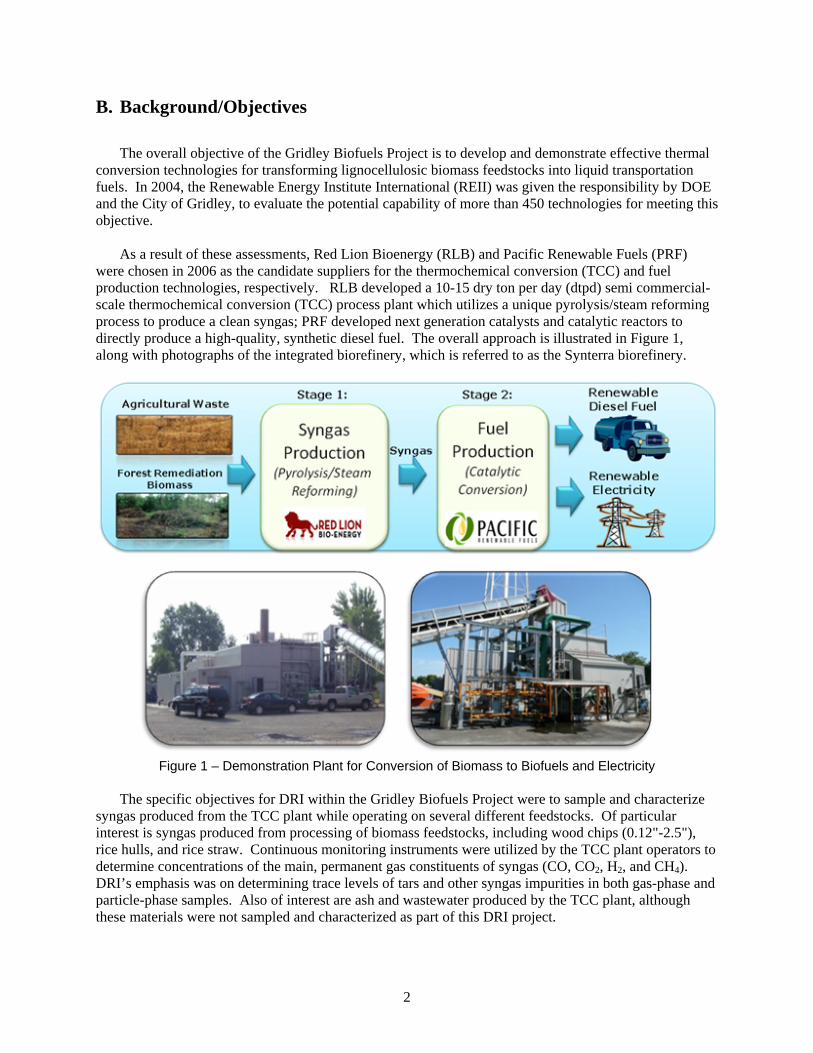
B. Background/Objectives The overall objective of the Gridley Biofuels Project is to develop and demonstrate effective thermal conversion technologies for transforming lignocellulosic biomass feedstocks into liquid transportation fuels. In 2004, the Renewable Energy Institute International (REII) was given the responsibility by DOE and the City of Gridley, to evaluate the potential capability of more than 450 technologies for meeting this objective. As a result of these assessments, Red Lion Bioenergy (RLB) and Pacific Renewable Fuels (PRF) were chosen in 2006 as the candidate suppliers for the thermochemical conversion (TCC) and fuel production technologies, respectively. RLB developed a 10-15 dry ton per day (dtpd) semi commercial-scale thermochemical conversion (TCC) process plant which utilizes a unique pyrolysis/steam reforming process to produce a clean syngas; PRF developed next generation catalysts and catalytic reactors to directly produce a high-quality, synthetic diesel fuel. The overall approach is illustrated in Figure 1, along with photographs of the integrated biorefinery, which is referred to as the Synterra biorefinery.
Figure 1 – Demonstration Plant for Conversion of Biomass to Biofuels and Electricity
The specific objectives for DRI within the Gridley Biofuels Project were to sample and characterize syngas produced from the TCC plant while operating on several different feedstocks. Of particular interest is syngas produced from processing of biomass feedstocks, including wood chips (0.12"-2.5"), rice hulls, and rice straw. Continuous monitoring instruments were utilized by the TCC plant operators to determine concentrations of the main, permanent gas constituents of syngas (CO, CO2, H2, and CH4). DRI’s emphasis was on determining trace levels of tars and other syngas impurities in both gas-phase and particle-phase samples. Also of interest are ash and wastewater produced by the TCC plant, although these materials were not sampled and characterized as part of this DRI project.
3
After collection in the field, time-integrated samples were shipped to DRI’s analytical laboratories in Reno, Nevada, for detailed characterization of the gas-phase and particulate-phase materials. This report describes the sampling and analysis methodologies employed during two separate field campaigns in November, 2008 and December, 2009. The report also provides detailed characterization information from all syngas samples obtained during these field campaigns. C. Description of the Synterra Biorefinery The TCC system was originally built and operated at a site near Denver, Colorado. In December of 2007, DRI was contracted to collect and characterize syngas produced by this plant. However, due to several logistical and operational problems, DRI was not able to obtain representative syngas samples during this time. In 2008, the plant was dismantled and moved to Toledo, Ohio, where it was re-engineered by Red Lion Bioenergy (RLB) at a site on the campus of the Medical University of Ohio (see Figure 1). DRI conducted syngas sampling at this Toledo site during November of 2008 and December of 2009. The conversion of biomass to syngas at the RLB plant in Toledo involves processes that are carried out in closed systems under reducing (oxygen depleted) conditions at moderately high temperatures (1,650 - 1,800 °F). After several cleanup steps, the produced syngas is fed into a catalytic reactor to produce liquid hydrocarbon fuels and other products. A schematic showing all major process units for the TCC and fuel production system (FPS) is presented in Figure 2. Each of these unit processes is briefly described below. Description of Unit Processes:
1) Feedstock Processing – Biomass or solid fossil fuel is ground to less than 2.0” (inch) diameter. 2) Feedstock Introduction – The ground feedstock is introduced using a conveyor system shown in
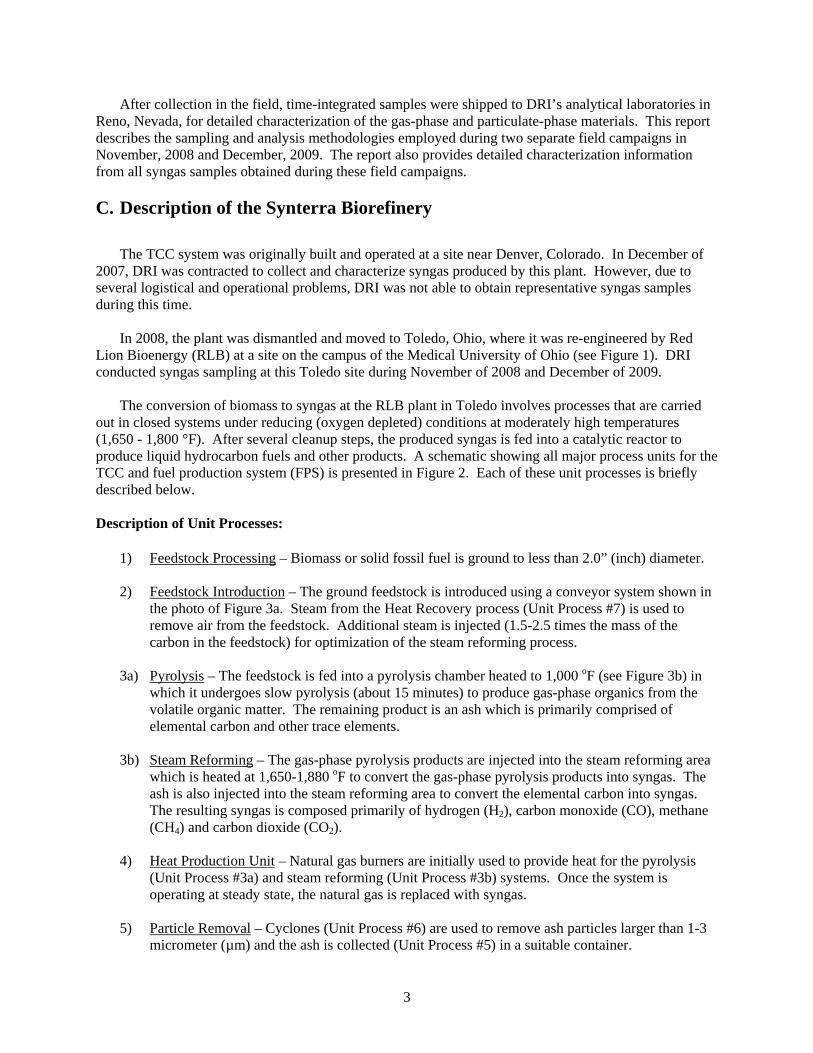
the photo of Figure 3a. Steam from the Heat Recovery process (Unit Process #7) is used to remove air from the feedstock. Additional steam is injected (1.5-2.5 times the mass of the carbon in the feedstock) for optimization of the steam reforming process.
3a) Pyrolysis – The feedstock is fed into a pyrolysis chamber heated to 1,000 oF (see Figure 3b) in
which it undergoes slow pyrolysis (about 15 minutes) to produce gas-phase organics from the volatile organic matter. The remaining product is an ash which is primarily comprised of elemental carbon and other trace elements.
3b) Steam Reforming – The gas-phase pyrolysis products are injected into the steam reforming area
which is heated at 1,650-1,880 oF to convert the gas-phase pyrolysis products into syngas. The ash is also injected into the steam reforming area to convert the elemental carbon into syngas. The resulting syngas is composed primarily of hydrogen (H2), carbon monoxide (CO), methane (CH4) and carbon dioxide (CO2).
4) Heat Production Unit – Natural gas burners are initially used to provide heat for the pyrolysis
(Unit Process #3a) and steam reforming (Unit Process #3b) systems. Once the system is operating at steady state, the natural gas is replaced with syngas.
5) Particle Removal – Cyclones (Unit Process #6) are used to remove ash particles larger than 1-3
micrometer (µm) and the ash is collected (Unit Process #5) in a suitable container.

4
Grind Feedstock(<2” diameter)
Steam Injection(~1.5 times mass
of feestock) b). Steam Reforming
Silica, Metal Oxides,Carbon & Trace Organics
(Produce Super‐HeatedSteam for Gasifier)
SyngasFueled Burners
Remove > 1 umParticles
Remove WaterSoluble
Compounds &Particles from Syngas
1. Feedstock Processing
ZnO/CuOColumn to Remove
Trace Sulfur Compounds
Compress SyngasWith Recycled
H2, CO
Convert Syngas To Fuel
Ethanol (for Gasoline Blending)
2. Air Removal3. Syngas
Production
5. Ash Collection
6. Cyclones & Filters
Separate Fractions & Filter(Distillation if Needed)
Syngas8. Water Scrubber
4. Heat Production Unit
Syngas
14. Catalytic Reactor
19. Fuel Processing
11. Guard Bed13. Compressor &
Heaters
H2+CO
RecycleExcessH2+CO
20. Storage Tanks
Heat
Ash
Biomass Biomass
Diesel Fuel (forCommunity Use)
CollectFuels
Steam
18. Condenser
ProcessWater
17. ProcessSteam
CleanSyngas
Purified Process Water(for reuse)
Cool SyngasSampling &Analysis
Remove Water SolubleCompounds &
Particles from Water
9. Water Purification
CleanSyngas
10. Sludge Collection
7. Heat Recovery
Convert Syngasto Electricity
15. Electricity Generation
MethaneEnriched Syngas
12b. AnalyticalMeasurements
16. Electricity(to Plant & Grid)
a). Pyrolysis
CleanSyngas
Hot Syngas Sampling &Analysis
12a. Analytical Measurements
Figure 2 – Unit Processes for the Synterra Biorefinery.
6) Heat Recovery – Heat is extracted from the syngas using heat recovery exchangers to produce
steam for the Air Removal interlock (Unit Process #2) and Pyrolysis (Unit Process #3a)/Steam Reforming (Unit Process #3b) system and the Fuel Production System (FPS).
7) Water Scrubber – The warm syngas is injected into two in-series water scrubber systems (Unit
Process #8) (Figure 3c) to remove soluble compounds and particles from the syngas.

5
8) Water Purification – A water purification system is used to remove water soluble compounds and particles from the water.
9) Sludge Collection – The sludge is removed and the purified water reused in the water
purification system as well as for the production of steam. 10) Guard Bed – A ZnO/CuO column (see Figure 3d) is used to remove any trace sulfur compounds
that remain in the syngas. 11) Analytical Measurements – On-line and integrated sampling of the hot (Unit Process #12a) and
ambient (Unit Process #12b) syngas is used to determine syngas composition before and after syngas purification.
12) Compressors and Heaters – Compressors and heaters are used to compress the syngas up to 750
psi and 600oF. 13) Catalytic Reactor – The catalytic reactor unit has been designed to accept catalysts recently
developed for the conversion of the clean syngas to ethanol or diesel fuel. 14) Electricity Generation – A combined-cycle turbine or genset (reciprocating engine/generator) is
used to convert the methane enriched syngas. 15) Electricity – Some of the generated electricity is used for operation of the plant; the remainder is
distributed to the local and regional grid. 16) Process Steam – Some of the process steam is used to heat the cool, clean syngas; the remainder
of the process steam is used for co-located facilities 17) Condenser – A condenser is used to cool and collect the fuels produced by the catalytic reactor. 18) Fuel Processing – The fuel product consists of two phases – an aqueous phase and an oil phase.
The aqueous phase consists of ethanol, methanol and other soluble oxygenates. The oil phase consists primarily of C8-C24 hydrocarbons and small quantities of oxygenated hydrocarbons. The aqueous and oil phases are separated and each phase is filtered to remove particles.
19) Storage Tanks – The fuel products are stored and distributed for local use.
6
Figure 3 – Photos of TCC Unit Processes: (a) Biomass Feedstock Introduction (Unit Process #2); (b) TCC System – Pyrolysis Chamber (Unit Process #3a); (c) Water Treatment System (Unit Process #8); (d) U-Shaped Guard Bed to remove trace sulfur species (Unit Process #11).
D. 2008 Synterra Biorefinery Syngas Characterization Studies In November of 2008, DRI conducted a field sampling campaign at the Synterra Biorefinery site in Toledo, Ohio to collect and analyze syngas produced by the thermochemical conversion (TCC) system. The primary objective was to characterize the amount and composition of tars and other impurities in the syngas, which could – if present in high enough concentrations – adversely affect the subsequent catalytic conversion process. 1. Plant Operation Plans Two biomass feedstocks were planned for conversion in the TCC system: wood chips and rice hulls. The wood chip diameter size classification of 0.12"-2.5" was as defined in the literature.(1) These two feedstocks were run separately, but at the same feed rate. Representative samples of these feedstocks were retained for subsequent ultimate analysis, proximate analysis and determination of calorific energy content. Syngas samples were collected once it had been determined that the TCC system was operating at stable, steady-state conditions for at least one hour. The following TCC operating data were collected continuously during the test runs:

7
• Biomass feed rate
• TCC system temperature readings at various locations
• Steam to biomass feed rate
• Amount of syngas produced
The major syngas constituents that were measured continuously are summarized in Table I, along with their expected concentrations. These components, as well as N2, NOx, H2S, COS, and total hydrocarbons were measured continuously using the on-line analysis system shown in Figure 4.
Table I – Major Syngas Components
Component Expected Conc. Range
H2 45-55 Vol% CO 20-30 Vol% CH4 5-15 Vol% CO2 10-20 Vol%
Table II summarizes the syngas purity specifications for several trace constituents as determined by Pacific Renewable Fuels (PRF) and its catalyst development partners. These purity specifications were developed to provide the commercial PRF catalysts with approximately 2-years of useful life.
Table II – Syngas Purity Specifications
Catalyst Contaminant Average Maximum Recommended Contaminant Levels
Total H2S, COS and SO2 < 50 ppb Oxygen (O2) < 500 ppm Total Benzene and Toluene < 5,000 ppm Total NH3, HNO3 and NO2 < 500 ppb Hydrogen Chloride (HCl) < 20 ppbHydrogen Cyanide (HCN) < 20 ppb
Total Inorganic Particulate Matter < 500 µg/m3
(75 ppb as Fe2O3)
Total Organic Particulate Matter < 500 µg/m3
(100 ppb as C16H34)
It was planned to sample syngas both before and after the ZnO/CuO sulfur clean-up guard bed (Unit Process No. 11 in Figure 2) to investigate the effectiveness of the sulfur-scrubbing guard bed. One-hour integrated samples were planned for all canisters, filters, and cartridges, although it was recognized that timing adjustments might be necessary to provide the optimum amount of material for chemical analysis. All syngas samples were taken from a single sampling location, downstream of the syngas clean-up system that includes water scrubbing and chemical absorbents. A single sample line was run from the TCC system to a manifold, which was connected to numerous sampling devices. A photograph of this manifold sampling system (deployed in a different field program) is shown in Figure 5. Due to the presence of water in the syngas, and the possibility of low ambient temperatures during sampling, auxiliary heating of the sample line was necessary to prevent condensation in the sampling system.

8
Figure 4 – Continuous Analyzers in the TCC System Control Room.
2. Analytical Methodologies A variety of sampling media were used to collect both gas-phase and particulate-phase components in raw syngas. These media, along with their associated analysis methods, are listed in Table III. Ideally, the collection of particulate matter (PM) from the syngas would involve isokinetic sampling.(2) However, due to the highly turbulent nature of the syngas flow, isokinetic sampling was not practical in this field application. Nevertheless, a crude assessment of PM mass and composition is still of interest. Thus, we obtained PM samples using the same sampling probe and collection system as for the gaseous syngas species. A brief summary of each major sampling and analysis procedure is provided below. More detailed procedures are given in Appendix II.
Figure 5 – DRI Syngas Sampling and Analysis Equipment used in 2008 Field Campaign

9
Table III – DRI’s 2008 Syngas Sampling and Analysis Procedures
Sample Type Species of Interest Sampling Method Analysis Method
Syngas: Gas Phase
VOCs (C2-C11), COS Canister GC/MS/FID
H2, CO, CO2, CH4 Canister GC-TCD (for H2) GC-FID (CO, CO2, CH4)
Higher MW VOCs (C8-C20)
Tenax Cartridges Thermal Desorption GC/MS
Chlorinated Volatile Organic (C1-C6)
Canister GC/MS
Carbonyls (C1-C7) DNPH Cartridges HPLC
NH3 (measured as NH4
+) Citric acid impregnated cellulose filter Automated Colorimetry
HCl, HNO3, and SO2 (measured as SO4
=) K2CO3 impregnated cellulose filter IC
H2S AgNO3 impregnated filter XRF
Syngas: Particle Phase
Total PM Teflon Filter (preceding citric acid filter) Gravimetry
EC/OC Quartz Filter 1 (preceding K2CO3 filter) Thermal Optical Analysis
Anions (Cl-, NO3-,
SO4=)
Quartz Filter 2 (preceding AgNO3 filter) IC
Elements Teflon Filter XRF, ICP-MS
Speciated PM Organics (>C14)
Quartz Filter 1 Thermal Desorption GC/MS
Time-Integrated Samples Permanent Gases and VOCs – Gaseous materials, including both the major syngas constituents and syngas contaminants, were sampled using electro-polished canisters. Prior to use, these canisters were cleaned and evacuated. After collecting a known volume of syngas, the canisters were returned to the lab for speciated analysis. H2 is analyzed using GC with thermal conductivity detection (GC-TCD). Other gas phase hydrocarbons (C2-C11) are analyzed from the canisters using an integrated GC/MS/FID method. CO, CO2, and CH4 are analyzed using GC with flame ionization detection (GC-FID), following methanation of the column effluent. Detailed protocols for canister cleaning, sampling and analysis are provided in Appendix II. Semi-Volatile Organic Compounds – Semi-volatile organic compounds (SVOCs) are collected by drawing a known amount of syngas through a cartridge containing a Tenax adsorbent material. After use, the Tenax cartridge was capped and returned to the laboratory for speciated analysis by GC/MS. Detailed Tenax sampling and analysis procedures are provided in Appendix II. Carbonyl Compounds – Carbonyl compounds (aldehydes and ketones) were collected by drawing a known amount of syngas through a cartridge impregnated with acidified 2,4-dinitrophenylhydrazine (DNPH). The resulting hydrazone products were eluted from the cartridge and analyzed by high performance liquid chromatography (HPLC) with a photodiode array detector. Detailed sampling and analysis procedures are provided in Appendix II.

10
Filter Samples – Three different filter packs were used for sampling both gaseous and particulate species in syngas. Each filter pack contained two filters. The identities and purposes of these filters are shown in Table IV, and are described below.
• Filter Pack No. 1: The front filter, Teflon, was used for total PM mass. The back filter, a citric acid impregnated filter, was used to collect ammonia (NH3), which was measured as ammonium (NH4
+).
• Filter Pack No. 2: The front filter, Quartz Filter 1, was used for organic carbon/elemental carbon (OC/EC) analysis. The back filter, a K2CO3 impregnated cellulose filter, was used for acidic gases [HCl, HNO3, and SO2 (measured as SO4)].
• Filter Pack No. 3: The front filter, Quartz Filter 2, was used for particulate-phase anions (Cl-,
NO3-, SO4
=) and cations (NH4+, K+, and Na+). The back filter, a silver nitrate impregnated
cellulose filter, was used for H2S.
Table IV – Filter Pack Configurations for Syngas Collection in 2008
Filter Pack No. 1 Filter Pack No. 2 Filter Pack No. 3 Filters Species
Sampled Filters Species
Sampled Filters Species
Sampled
Teflon Citric Acid
Total PM PM Elements
NH3
Quartz 1
K2CO3
OC/EC, Carbon
Fractions
HCl, HNO3, SO2
Quartz 2
AgNO3
NH4+, K+, Na+,
Cl-, NO3-, SO4
=
H2S
Continuous Analysis of Syngas It was planned that the main gas-phase constituents of syngas, CO, CH4, CO2, NOx, H2S and COS, would be measured continuously using the instruments permanently installed in the TC system control room (see Figure 4). Unfortunately, during the time of the November 2008 field campaign, the continuous analysis system was not operating. Consequently, DRI relied upon analysis of the integrated samples (as described above) for most of these species. However, no measurement of NOx was possible. 3. Analytical Results Sampling of syngas at Toledo was conducted on November 11-12, 2008. Prior to introducing any biomass feedstock, steam was blown through the TCC system and was drawn through the complete set of sampling equipment, shown in Figure 5. This constituted a sample blank. Following this, rice hulls were fed into the TCC system and syngas was produced. The first 1-hour syngas sample from rice hulls was collected before the sulfur-scrubbing U-tube. The second and third syngas samples from rice hulls were collected after the sulfur-scrubbing U-tube. During these later samples, feeding of the biomass into the TCC system became difficult, and the TCC system operation appeared to change. Eventually, the system was shut down and cleaned out. On November 12, the TCC system was re-started, and the rest of the syngas samples were collected. However, it was clear that the system was not operating optimally, as feeding difficulties continued and high amounts of tars were observed within the sample lines and filters. Nevertheless, a complete set of
11
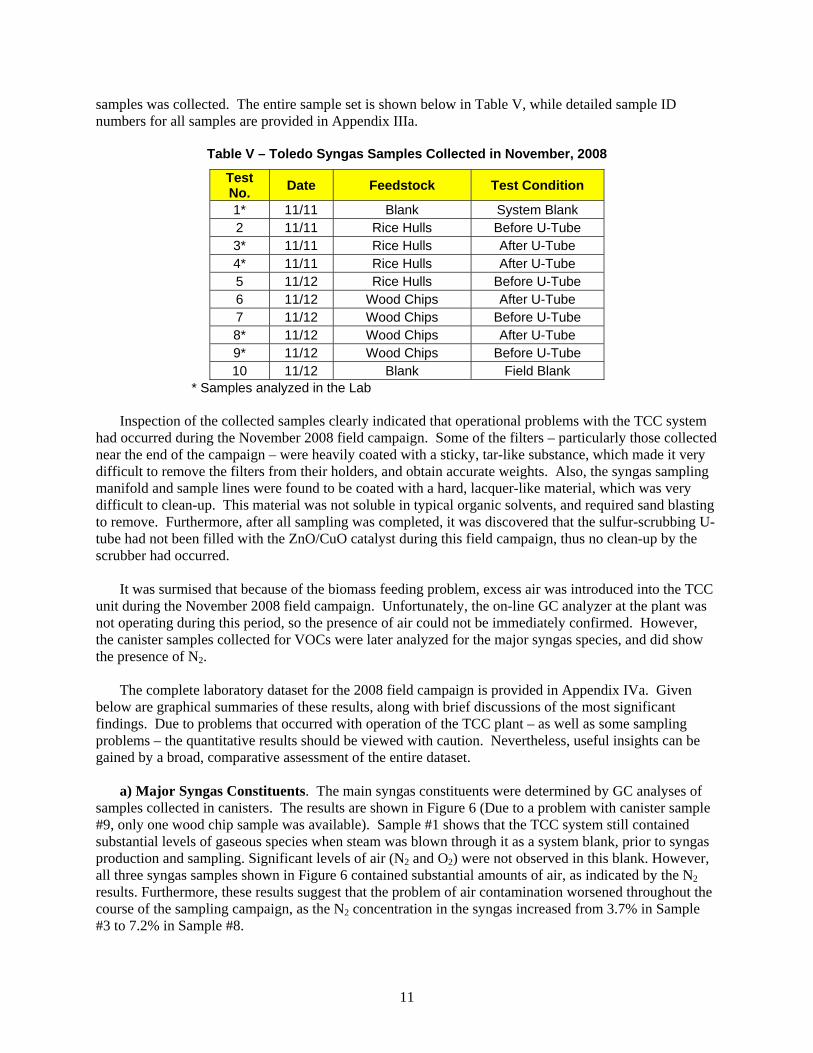
samples was collected. The entire sample set is shown below in Table V, while detailed sample ID numbers for all samples are provided in Appendix IIIa.
Table V – Toledo Syngas Samples Collected in November, 2008
Test No. Date Feedstock Test Condition
1* 11/11 Blank System Blank 2 11/11 Rice Hulls Before U-Tube 3* 11/11 Rice Hulls After U-Tube 4* 11/11 Rice Hulls After U-Tube 5 11/12 Rice Hulls Before U-Tube 6 11/12 Wood Chips After U-Tube 7 11/12 Wood Chips Before U-Tube 8* 11/12 Wood Chips After U-Tube 9* 11/12 Wood Chips Before U-Tube 10 11/12 Blank Field Blank
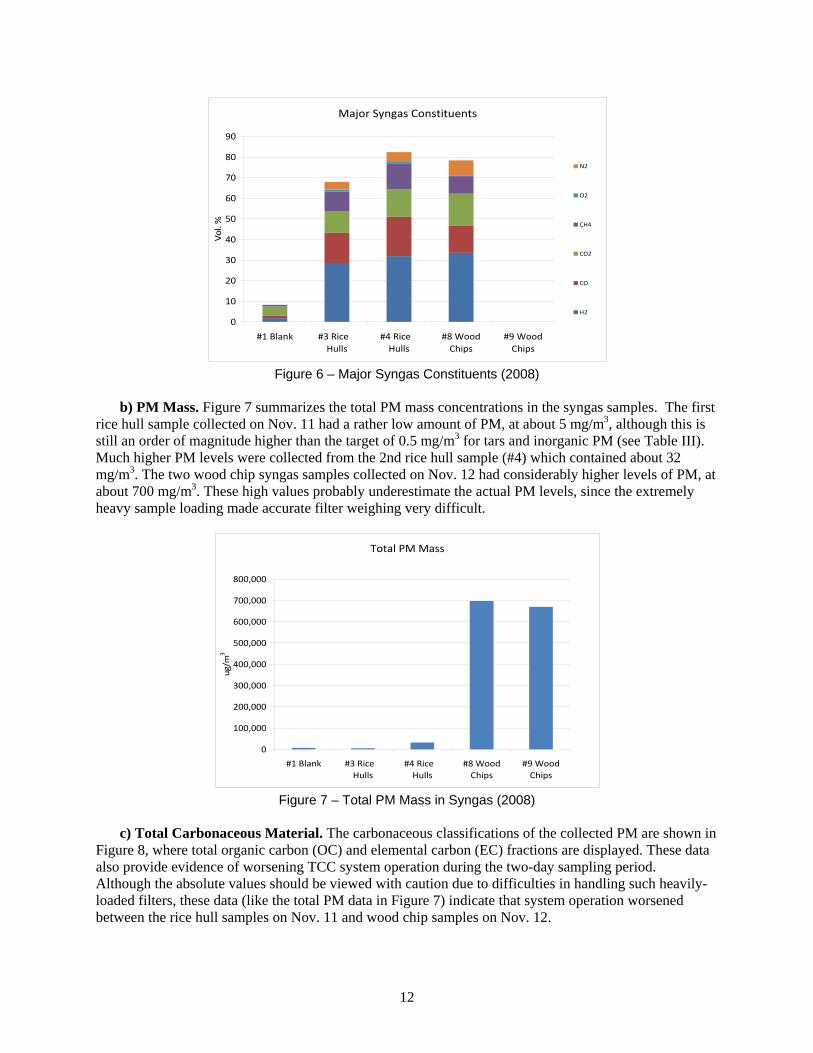
* Samples analyzed in the Lab Inspection of the collected samples clearly indicated that operational problems with the TCC system had occurred during the November 2008 field campaign. Some of the filters – particularly those collected near the end of the campaign – were heavily coated with a sticky, tar-like substance, which made it very difficult to remove the filters from their holders, and obtain accurate weights. Also, the syngas sampling manifold and sample lines were found to be coated with a hard, lacquer-like material, which was very difficult to clean-up. This material was not soluble in typical organic solvents, and required sand blasting to remove. Furthermore, after all sampling was completed, it was discovered that the sulfur-scrubbing U-tube had not been filled with the ZnO/CuO catalyst during this field campaign, thus no clean-up by the scrubber had occurred. It was surmised that because of the biomass feeding problem, excess air was introduced into the TCC unit during the November 2008 field campaign. Unfortunately, the on-line GC analyzer at the plant was not operating during this period, so the presence of air could not be immediately confirmed. However, the canister samples collected for VOCs were later analyzed for the major syngas species, and did show the presence of N2. The complete laboratory dataset for the 2008 field campaign is provided in Appendix IVa. Given below are graphical summaries of these results, along with brief discussions of the most significant findings. Due to problems that occurred with operation of the TCC plant – as well as some sampling problems – the quantitative results should be viewed with caution. Nevertheless, useful insights can be gained by a broad, comparative assessment of the entire dataset. a) Major Syngas Constituents. The main syngas constituents were determined by GC analyses of samples collected in canisters. The results are shown in Figure 6 (Due to a problem with canister sample #9, only one wood chip sample was available). Sample #1 shows that the TCC system still contained substantial levels of gaseous species when steam was blown through it as a system blank, prior to syngas production and sampling. Significant levels of air (N2 and O2) were not observed in this blank. However, all three syngas samples shown in Figure 6 contained substantial amounts of air, as indicated by the N2 results. Furthermore, these results suggest that the problem of air contamination worsened throughout the course of the sampling campaign, as the N2 concentration in the syngas increased from 3.7% in Sample #3 to 7.2% in Sample #8.
12
Figure 6 – Major Syngas Constituents (2008)
b) PM Mass. Figure 7 summarizes the total PM mass concentrations in the syngas samples. The first rice hull sample collected on Nov. 11 had a rather low amount of PM, at about 5 mg/m3, although this is still an order of magnitude higher than the target of 0.5 mg/m3 for tars and inorganic PM (see Table III). Much higher PM levels were collected from the 2nd rice hull sample (#4) which contained about 32 mg/m3. The two wood chip syngas samples collected on Nov. 12 had considerably higher levels of PM, at about 700 mg/m3. These high values probably underestimate the actual PM levels, since the extremely heavy sample loading made accurate filter weighing very difficult.
Figure 7 – Total PM Mass in Syngas (2008)
c) Total Carbonaceous Material. The carbonaceous classifications of the collected PM are shown in Figure 8, where total organic carbon (OC) and elemental carbon (EC) fractions are displayed. These data also provide evidence of worsening TCC system operation during the two-day sampling period. Although the absolute values should be viewed with caution due to difficulties in handling such heavily-loaded filters, these data (like the total PM data in Figure 7) indicate that system operation worsened between the rice hull samples on Nov. 11 and wood chip samples on Nov. 12.
Major Syngas Constituents
0
10
20
30
40
50
60
70
80
90
#1 Blank #3 Rice Hulls
#4 Rice Hulls
#8 WoodChips
#9 WoodChips
Vol. %
N2
O2
CH4
CO2
CO
H2
Total PM Mass
0
100,000
200,000
300,000
400,000
500,000
600,000
700,000
800,000
#1 Blank #3 Rice Hulls
#4 Rice Hulls
#8 WoodChips
#9 WoodChips
ug/m
3

13
Figure 8 – Carbonaceous Material in Syngas (2008)
d) PM Elements. Individual elements within the collected PM were measured by X-ray fluorescence (XRF) spectroscopy, using the same filters as used for collection of the total PM. The results of the XRF analyses are shown in Fig. 9. The ordering of elements within each clustered bar was from highest concentration to lowest, as determined in the rice hull #3 sample (Chlorine was the highest concentration element in rice hull #3, followed by potassium). Only 15 unique elements are portrayed in each bar, with all remaining elements being summed and displayed as the top segment of each clustered bar. The blank sample showed high levels of contamination. In particular, molybdenum (Mo) and chromium (Cr) were present in very high concentrations (533 and 324 µg/m3 respectively). The source of these elements is not known, and they were not seen in the syngas samples themselves. The progression of increasing elemental concentrations in the syngas from the two rice hull samples to the two wood chip samples is consistent with the total PM results (Fig. 7) and the carbonaceous PM results (Fig. 8).
Figure 9 – PM Elements in Syngas Samples (2008)
e) Ammonia. Ammonia was collected on citric acid filters and analyzed as ammonium ion using an automated colorimetry technique. As shown in Fig. 10, significant concentrations of ammonia were
Total Carbonaceous Material
0
50,000
100,000
150,000
200,000
250,000
300,000
#1 Blank #3 Rice Hulls
#4 Rice Hulls
#8 WoodChips
#9 WoodChips
ug/m
3
Total Elemental Carbon (EC)
Total Organic Carbon (OC)
PM Elements
0200400600800
1,0001,2001,4001,6001,8002,000
#1 Blank #3 RiceHulls
#4 RiceHulls
#8 WoodChips
#9 WoodChips
ug/m
3
Sum of OthersHafnium (Hf)Strontium (Sr)Scandium (Sc)Manganese (Mn)Lead (Pb)Copper (Cu)Aluminum (Al)Iron (Fe)Silicon (Si)Calcium (Ca)Zinc (Zn)Bromine (Br)Sulfur (S)Potassium (K)Chlorine (Cl)

14
observed in all syngas samples. However, the concentration in the last wood chip sample was approximately an order of magnitude higher than in the other samples.
Figure 10 – Ammonia in Syngas (2008)
f) Particulate Anions. Particulate anion concentrations are shown in Fig. 11. Clearly, the system blank was contaminated by a large amount of sulfate. This is consistent with the high sulfur concentration observed in the blank sample by XRF (see Fig. 9). Chloride was the dominant anion observed in all four syngas samples, although a considerable amount of sulfate was also seen in wood chip sample #9.
Figure 11 – Anions in Syngas Particulate (2008)
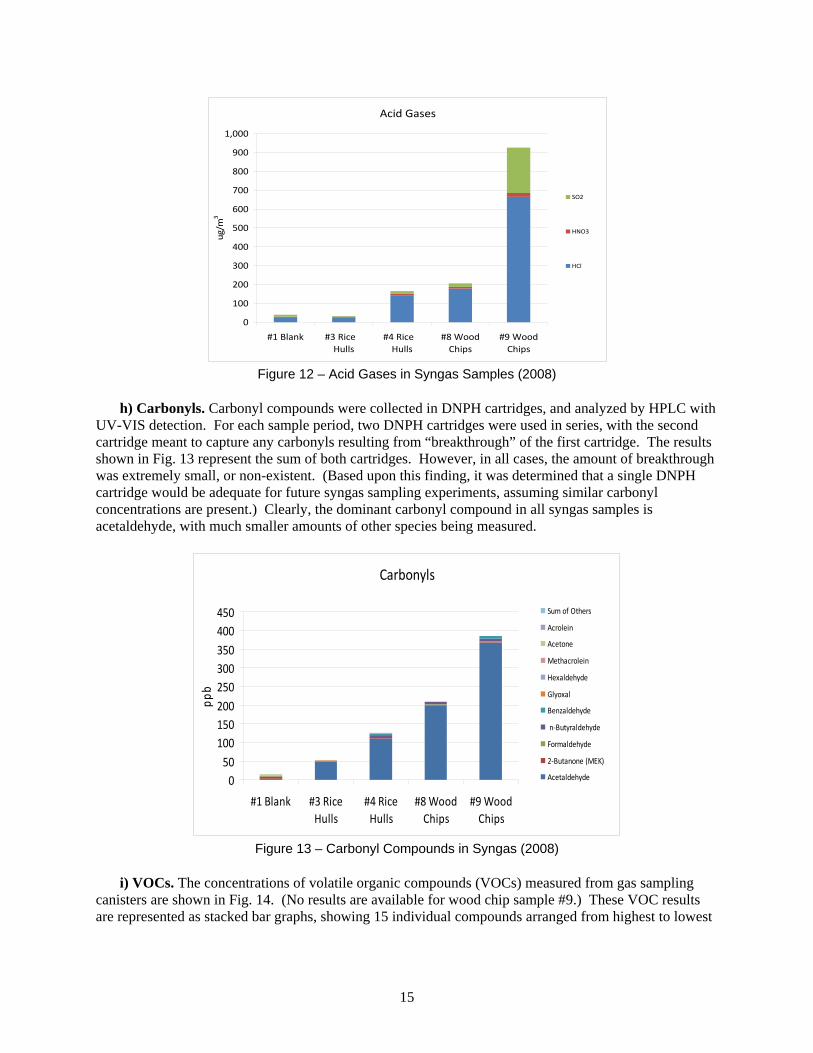
g) Acid Gases. Acid gases were collected on K2CO3 impregnated cellulose filters and were analyzed by ion chromatography. The results shown in Fig. 12 indicate that HCl was the dominant acid gas in all samples (including the blank), but that a considerable amount of SO2 was also present in wood chip Sample #9. The increasing concentrations of acid gases from rice hull #3 to wood chip #9 are consistent with the particulate anion pattern seen in Fig. 11.
Ammonia
0
500
1,000
1,500
2,000
2,500
3,000
#1 Blank #3 Rice Hulls
#4 Rice Hulls
#8 WoodChips
#9 WoodChips
ug/m
3
Particulate Anions
0
500
1,000
1,500
2,000
2,500
3,000
3,500
#1 Blank #3 Rice Hulls
#4 Rice Hulls
#8 WoodChips
#9 WoodChips
ug/m
3
Sulfate
Nitrate
Chloride
15
Figure 12 – Acid Gases in Syngas Samples (2008)
h) Carbonyls. Carbonyl compounds were collected in DNPH cartridges, and analyzed by HPLC with UV-VIS detection. For each sample period, two DNPH cartridges were used in series, with the second cartridge meant to capture any carbonyls resulting from “breakthrough” of the first cartridge. The results shown in Fig. 13 represent the sum of both cartridges. However, in all cases, the amount of breakthrough was extremely small, or non-existent. (Based upon this finding, it was determined that a single DNPH cartridge would be adequate for future syngas sampling experiments, assuming similar carbonyl concentrations are present.) Clearly, the dominant carbonyl compound in all syngas samples is acetaldehyde, with much smaller amounts of other species being measured.
Figure 13 – Carbonyl Compounds in Syngas (2008)
i) VOCs. The concentrations of volatile organic compounds (VOCs) measured from gas sampling canisters are shown in Fig. 14. (No results are available for wood chip sample #9.) These VOC results are represented as stacked bar graphs, showing 15 individual compounds arranged from highest to lowest
Acid Gases
0
100
200
300
400
500
600
700
800
900
1,000
#1 Blank #3 Rice Hulls
#4 Rice Hulls
#8 WoodChips
#9 WoodChips
ug/m
3
SO2
HNO3
HCl
Carbonyls
050100150200250300350400450
#1 Blank #3 RiceHulls
#4 RiceHulls
#8 WoodChips
#9 WoodChips
ppb
Sum of Others
Acrolein
Acetone
Methacrolein
Hexaldehyde
Glyoxal
Benzaldehyde
n‐Butyraldehyde
Formaldehyde
2‐Butanone (MEK)
Acetaldehyde
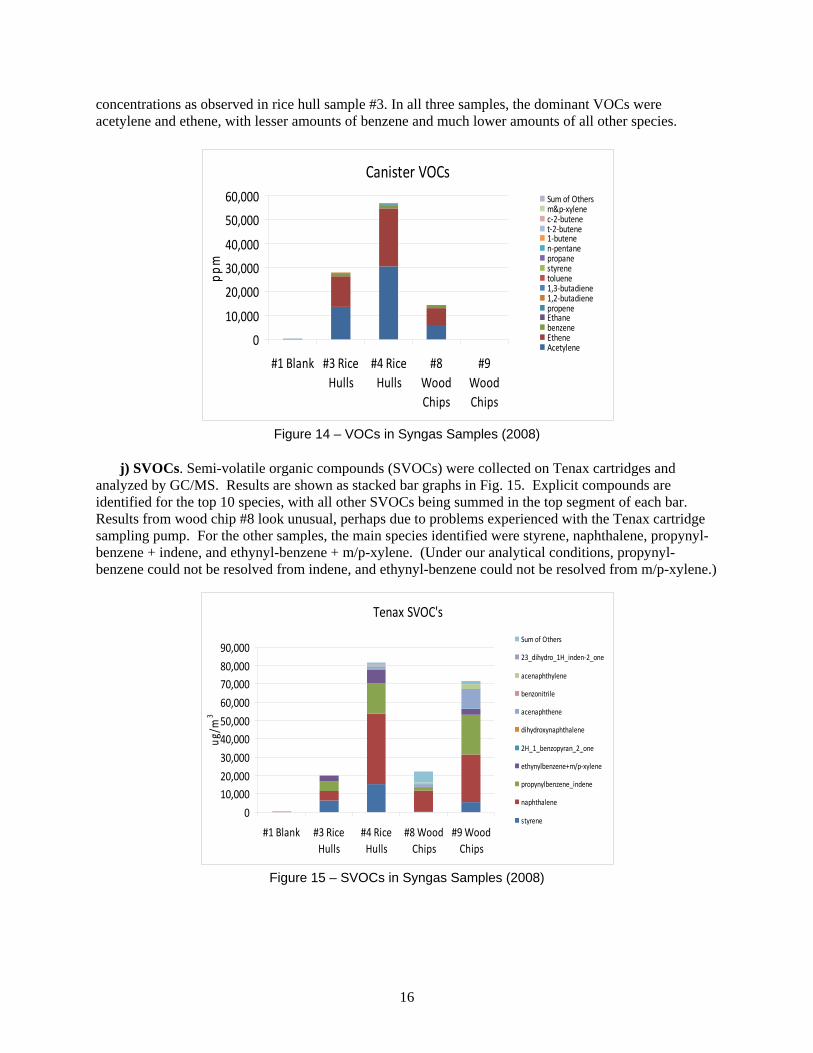
16
concentrations as observed in rice hull sample #3. In all three samples, the dominant VOCs were acetylene and ethene, with lesser amounts of benzene and much lower amounts of all other species.
Figure 14 – VOCs in Syngas Samples (2008)
j) SVOCs. Semi-volatile organic compounds (SVOCs) were collected on Tenax cartridges and analyzed by GC/MS. Results are shown as stacked bar graphs in Fig. 15. Explicit compounds are identified for the top 10 species, with all other SVOCs being summed in the top segment of each bar. Results from wood chip #8 look unusual, perhaps due to problems experienced with the Tenax cartridge sampling pump. For the other samples, the main species identified were styrene, naphthalene, propynyl-benzene + indene, and ethynyl-benzene + m/p-xylene. (Under our analytical conditions, propynyl-benzene could not be resolved from indene, and ethynyl-benzene could not be resolved from m/p-xylene.)
Figure 15 – SVOCs in Syngas Samples (2008)
Canister VOCs
0
10,000
20,000
30,000
40,000
50,000
60,000
#1 Blank #3 RiceHulls
#4 RiceHulls
#8WoodChips
#9WoodChips
ppm
Sum of Othersm&p‐xylenec‐2‐butenet‐2‐butene1‐butene n‐pentanepropanestyrenetoluene1,3‐butadiene1,2‐butadienepropeneEthanebenzeneEtheneAcetylene
Tenax SVOC's
0
10,00020,000
30,000
40,00050,000
60,000
70,00080,000
90,000
#1 Blank #3 RiceHulls
#4 RiceHulls
#8 WoodChips
#9 WoodChips
ug/m
3
Sum of Others
23_dihydro_1H_inden‐2_one
acenaphthylene
benzonitrile
acenaphthene
dihydroxynaphthalene
2H_1_benzopyran_2_one
ethynylbenzene+m/p‐xylene
propynylbenzene_indene
naphthalene
styrene

17
E. 2009 Synterra Biorefinery Syngas Characterization Studies 1. Biorefinery and Analytical Improvements Following conclusion of the 2008 sampling campaign, numerous process upgrades and improvements were made to the TCC system in Toledo. In particular, improvements were made to the biomass feeding system and the syngas clean-up system. In addition, a catalytic fuel processing system was introduced, to convert syngas directly to a high-quality, synthetic diesel fuel. This approach of converting biomass to liquid transportation fuels is consistent with DOE’s concept of an integrated biorefinery, whereby biomass conversion into fuels and other products is optimized by a combination of processes applied to a variety of feedstocks.(3,4) One of the major analytical challenges we faced in the 2008 field sampling campaign was the high level of “tars” present in the syngas. The presence of tars in biomass-derived syngas is well documented, and can make standard stationary-source test methods unreliable for the collection and quantification of PM. A review on the topic of biomass gasifier tars was conducted by NREL a decade ago(5) with more recent updates provided by various research groups.(2,6,7) The unstable nature of tars, in combination with reactive syngas environments, leads to chemical changes due to oxidation, polymerization and other degradation processes. Consequently, the integrity of raw syngas collected by standard sampling techniques is likely to be compromised. Dilution sampling is commonly employed to preserve the integrity of reactive pollutant materials. DRI has extensive experience in developing and deploying dilution sampling methodologies for both stationary and mobile source emissions.(8,9) We expect that dilution sampling would also prove useful in the collection and characterization of reactive product mixtures resulting from gasification of biomass. Therefore, prior to the 2009 field sampling campaign, we adapted a novel, portable dilution sampling methodology that had been developed for emissions sampling, to be suitable for the collection and monitoring of contaminants in syngas. For ease of use in a variety of situations, this system is designed to operate with battery power, although line power can be used when available. To facilitate transport and quick setup, the entire system was designed to fit into five plastic shipping boxes. This modular structure also allows for deployment in locations where space is limited. When on-site, the necessary electrical and plumbing connections can be made to assemble the complete system. While successfully assembled and operated to collect engine exhaust gases, this system had never been applied to the monitoring of syngas from thermochemical conversion processes. Therefore, various modifications were necessary to make it more suitable for syngas sampling and analysis. These modifications included the following:
• The design and installation of an appropriate sampling probe for syngas
• The design and installation of a gas expansion chamber to reduce the syngas pressure
• The incorporation of a mass flow controller to regulate the amount of syngas sampled
• The utilization of compressed N2 rather than ambient air as diluent gas
• The utilization of a more flexible selection of sampling substrates and flow rates for the collection and characterization of syngas
• The development of a LabView program to operate the modified system
18
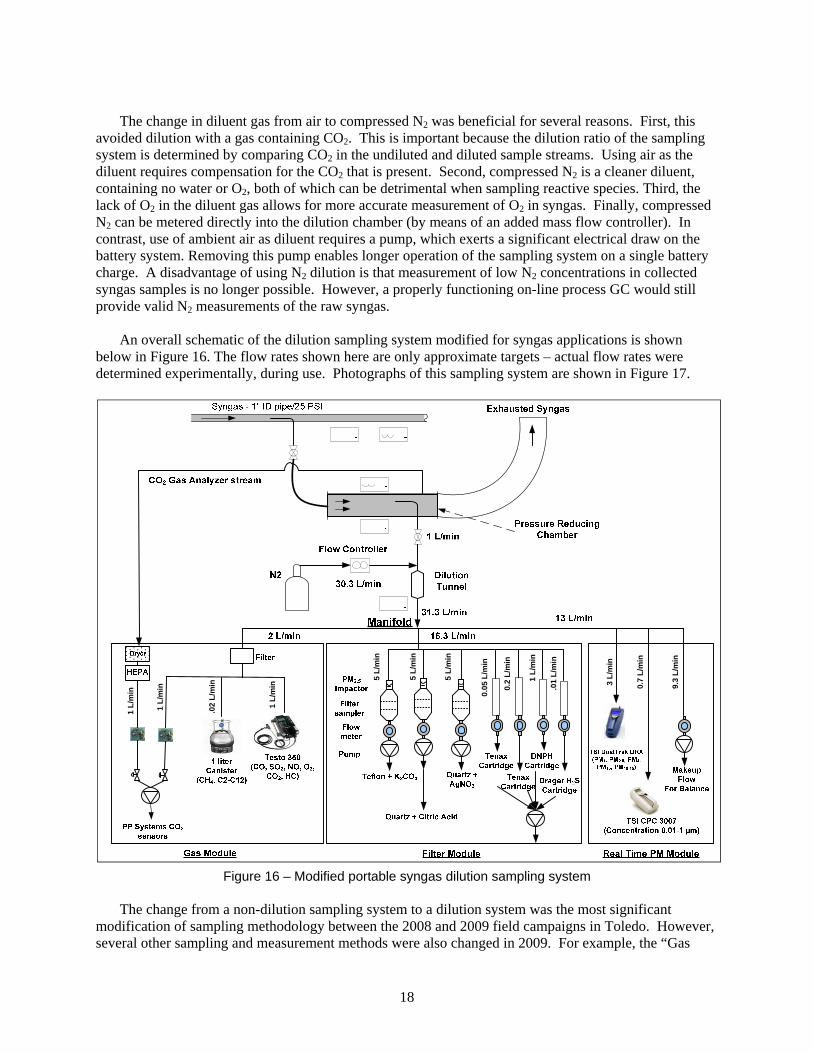
The change in diluent gas from air to compressed N2 was beneficial for several reasons. First, this avoided dilution with a gas containing CO2. This is important because the dilution ratio of the sampling system is determined by comparing CO2 in the undiluted and diluted sample streams. Using air as the diluent requires compensation for the CO2 that is present. Second, compressed N2 is a cleaner diluent, containing no water or O2, both of which can be detrimental when sampling reactive species. Third, the lack of O2 in the diluent gas allows for more accurate measurement of O2 in syngas. Finally, compressed N2 can be metered directly into the dilution chamber (by means of an added mass flow controller). In contrast, use of ambient air as diluent requires a pump, which exerts a significant electrical draw on the battery system. Removing this pump enables longer operation of the sampling system on a single battery charge. A disadvantage of using N2 dilution is that measurement of low N2 concentrations in collected syngas samples is no longer possible. However, a properly functioning on-line process GC would still provide valid N2 measurements of the raw syngas. An overall schematic of the dilution sampling system modified for syngas applications is shown below in Figure 16. The flow rates shown here are only approximate targets – actual flow rates were determined experimentally, during use. Photographs of this sampling system are shown in Figure 17.
Figure 16 – Modified portable syngas dilution sampling system
The change from a non-dilution sampling system to a dilution system was the most significant modification of sampling methodology between the 2008 and 2009 field campaigns in Toledo. However, several other sampling and measurement methods were also changed in 2009. For example, the “Gas
5 L/
min
5 L/
min
0.2
L/m
in
5 L/
min
1 L/
min
.02
L/m
in
1 L/
min
1 L/
min 9.
3 L/
min
1 L/
min
0.7
L/m
in
3 L/
min
0.05
L/m
in
.01
L/m
in
19
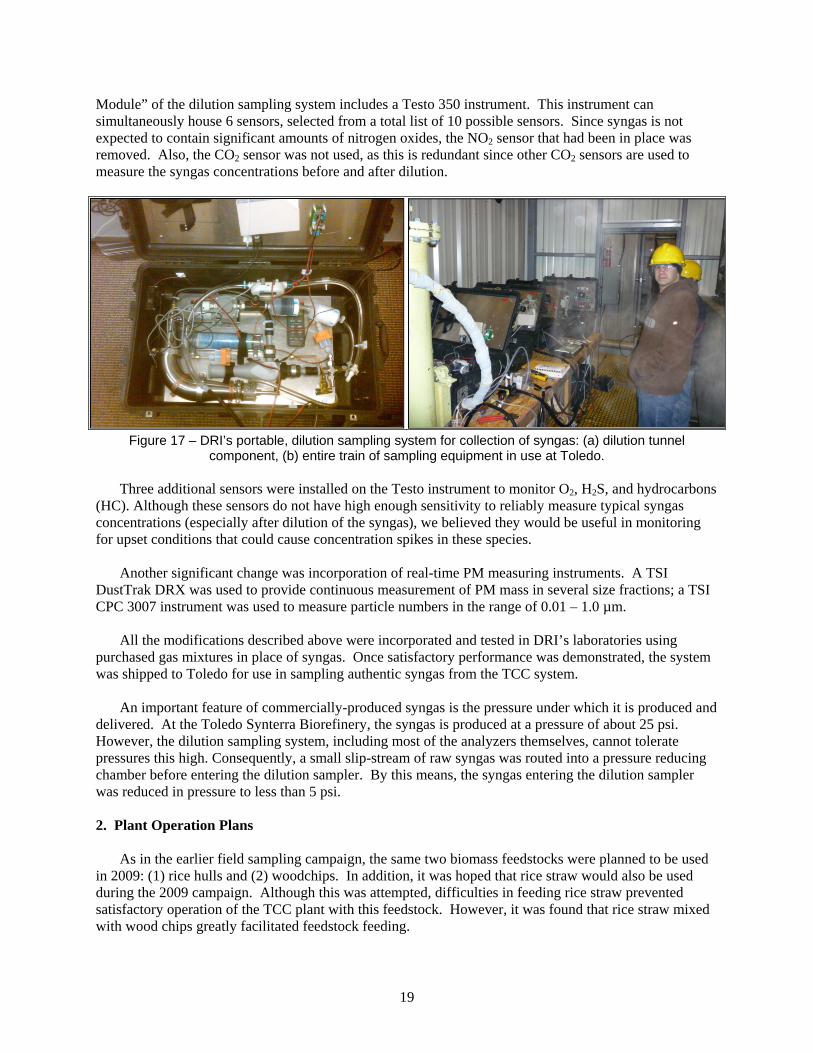
Module” of the dilution sampling system includes a Testo 350 instrument. This instrument can simultaneously house 6 sensors, selected from a total list of 10 possible sensors. Since syngas is not expected to contain significant amounts of nitrogen oxides, the NO2 sensor that had been in place was removed. Also, the CO2 sensor was not used, as this is redundant since other CO2 sensors are used to measure the syngas concentrations before and after dilution.
Figure 17 – DRI’s portable, dilution sampling system for collection of syngas: (a) dilution tunnel component, (b) entire train of sampling equipment in use at Toledo.
Three additional sensors were installed on the Testo instrument to monitor O2, H2S, and hydrocarbons (HC). Although these sensors do not have high enough sensitivity to reliably measure typical syngas concentrations (especially after dilution of the syngas), we believed they would be useful in monitoring for upset conditions that could cause concentration spikes in these species. Another significant change was incorporation of real-time PM measuring instruments. A TSI DustTrak DRX was used to provide continuous measurement of PM mass in several size fractions; a TSI CPC 3007 instrument was used to measure particle numbers in the range of 0.01 – 1.0 µm. All the modifications described above were incorporated and tested in DRI’s laboratories using purchased gas mixtures in place of syngas. Once satisfactory performance was demonstrated, the system was shipped to Toledo for use in sampling authentic syngas from the TCC system. An important feature of commercially-produced syngas is the pressure under which it is produced and delivered. At the Toledo Synterra Biorefinery, the syngas is produced at a pressure of about 25 psi. However, the dilution sampling system, including most of the analyzers themselves, cannot tolerate pressures this high. Consequently, a small slip-stream of raw syngas was routed into a pressure reducing chamber before entering the dilution sampler. By this means, the syngas entering the dilution sampler was reduced in pressure to less than 5 psi. 2. Plant Operation Plans As in the earlier field sampling campaign, the same two biomass feedstocks were planned to be used in 2009: (1) rice hulls and (2) woodchips. In addition, it was hoped that rice straw would also be used during the 2009 campaign. Although this was attempted, difficulties in feeding rice straw prevented satisfactory operation of the TCC plant with this feedstock. However, it was found that rice straw mixed with wood chips greatly facilitated feedstock feeding.
20
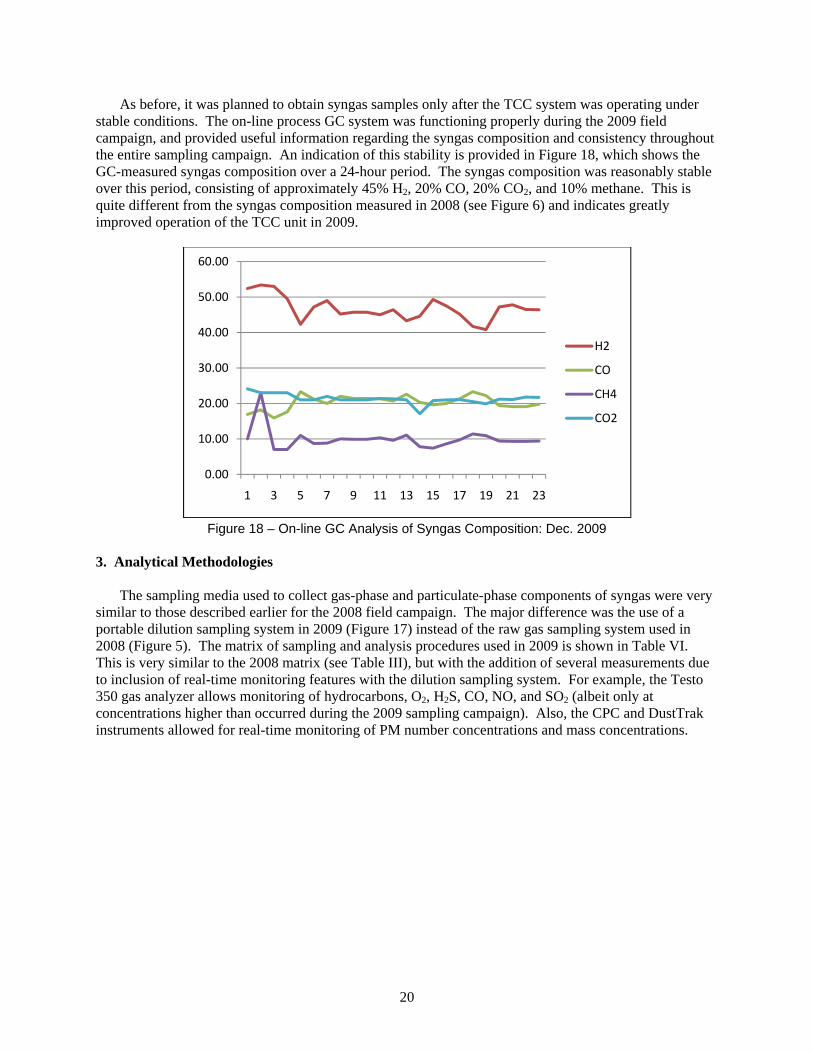
As before, it was planned to obtain syngas samples only after the TCC system was operating under stable conditions. The on-line process GC system was functioning properly during the 2009 field campaign, and provided useful information regarding the syngas composition and consistency throughout the entire sampling campaign. An indication of this stability is provided in Figure 18, which shows the GC-measured syngas composition over a 24-hour period. The syngas composition was reasonably stable over this period, consisting of approximately 45% H2, 20% CO, 20% CO2, and 10% methane. This is quite different from the syngas composition measured in 2008 (see Figure 6) and indicates greatly improved operation of the TCC unit in 2009.
Figure 18 – On-line GC Analysis of Syngas Composition: Dec. 2009
3. Analytical Methodologies The sampling media used to collect gas-phase and particulate-phase components of syngas were very similar to those described earlier for the 2008 field campaign. The major difference was the use of a portable dilution sampling system in 2009 (Figure 17) instead of the raw gas sampling system used in 2008 (Figure 5). The matrix of sampling and analysis procedures used in 2009 is shown in Table VI. This is very similar to the 2008 matrix (see Table III), but with the addition of several measurements due to inclusion of real-time monitoring features with the dilution sampling system. For example, the Testo 350 gas analyzer allows monitoring of hydrocarbons, O2, H2S, CO, NO, and SO2 (albeit only at concentrations higher than occurred during the 2009 sampling campaign). Also, the CPC and DustTrak instruments allowed for real-time monitoring of PM number concentrations and mass concentrations.
0.00
10.00
20.00
30.00
40.00
50.00
60.00
1 3 5 7 9 11 13 15 17 19 21 23
H2
CO
CH4
CO2

21
Table VI – DRI’s 2009 Syngas Sampling and Analysis Procedures
Sample Type Species of Interest Sampling Method Analysis Method
Syngas: Gas Phase
VOCs (C2-C11), COS Canister GC/MS/FID
H2, CO, CO2, CH4 Canister GC-TCD (for H2) GC-FID (CO, CO2, CH4)
Higher MW VOCs (C8-C20)
Tenax Cartridges Thermal Desorption GC/MS
Carbonyls (C1-C7) DNPH Cartridges HPLC HCl, HNO3, and SO2 (measured as SO4
=) K2CO3 impregnated cellulose filter IC
NH3 (measured as NH4+) Citric acid filter Automated colorimetry
H2S AgNO3 impregnated filter XRF
CxHy, O2, CO, NO, SO2 Real-time monitoring Testo 350 gas analyzer
CO2 Real-time monitoring (before and after dilution)
NDIR
Syngas: Particle Phase
Total PM mass Teflon Filter (preceding citric acid) Gravimetry
OC/EC Total Carbon
Quartz Filter 1 (preceding K2CO3 filter)
Thermal Optical Analysis
Anions (Cl-, NO3-, SO4
=) Cations (NH4
+, K+, Na+) Quartz Filter 2 (preceding AgNO3)
IC
Elements Teflon Filter XRF, ICP-MS Speciated organic compounds Teflon Filter 1 GC/MS (with
derivatization) Particle number concentration Real-time monitoring Condensation Particle
Counter PM1, PM2.5, PM4, PM10, and TPM mass concentrations Real-time monitoring DustTrak DRX
As in 2008, integrated particulate samples were collected in the 2009 field campaign using a series of three filter packs. The configuration of these filter packs, shown in Table VII, was identical to the 2008 configuration, shown in Table IV.
Table VII – Filter Pack Configurations for Syngas Collection in 2009
Filter Pack No. 1 Filter Pack No. 2 Filter Pack No. 3
Filters Species Sampled Filters Species
Sampled Filters Species Sampled
Teflon
Citric Acid
Total PM PM Elements
NH3
Quartz 1
K2CO3
OC/EC, Carbon Fractions
HCl, HNO3, H2SO4
Quartz 2 AgNO3
NH4+, K+, Na+,
Cl-, NO3-, SO4
=
H2S

22
4. Analytical Results The 2009 field sampling campaign in Toledo was conducted on December 14-17. A chronology of events is provided below.
• On Dec. 14, the dilution sampling system was setup and operated while only N2 was blown through the expansion chamber (no syngas was used). This set of samples constituted a “system blank” for the field campaign.
• On December 15, rice hulls were fed into the TCC process unit and syngas was produced.
However, shortly after dilution sampling of syngas began, the TCC unit was shut down and all sampling was halted. Due to this premature shutdown, and resulting questions about sample representativeness, all samples from Dec. 15 were scrapped. However, sufficient sample time had occurred to observe that the syngas was much cleaner than during the 2008 campaign. In fact, no visible material was collected on the filter samples, and very low particle number counts and particle mass were seen with the real-time PM analyzers. Because of these observations, it was decided that once syngas sampling resumed, a lower dilution ratio would be employed (5/1 rather than 20/1), and that some samples would be collected without any dilution.
• On December 16, the TCC system was re-started and syngas samples produced from rice hulls
were collected. Because the amount of particulate matter was so low (as indicated by the real-time PM instruments) the filter packs were allowed to collect a single integrated sample of undiluted syngas over a 2-hour period. During this 2-hour period, three integrated samples of 60-min., 30-min., and 10-min. were collected in canisters, Tenax cartridges, and DNPH cartridges.
• On December 17, the TCC system was run with wood chips as the feedstock. Syngas samples
were successfully collected, both with and without use of N2 dilution. In addition, an attempt was made to operate the TCC system using a mixture of rice straw and wood chips as the feedstock. However, significant difficulties in feeding these mixed materials occurred on this date, and the run was aborted. Although we did analyze these mixed feedstock syngas samples in the laboratory, the results appeared anomalous. Due to the numerous complications and questions regarding these mixed feedstock samples, their results are not included in the data presentation and analysis that follows.
• Also on December 17, while the TCC was operating with wood chips, the syngas sample line was
moved to a location before the U-tube ZnO/CuO catalytic sulfur scrubbing system. (All previous syngas samples were collected after this U-tube.) Results from this sample were very instructive in understanding the effectiveness of the scrubber in removing syngas impurities.
An identification of all syngas samples collected during the 2009 field campaign is shown in Table VIII. Detailed sample ID numbers are provided in Appendix IIIb. The complete laboratory dataset for the 2009 field campaign is provided in Appendix IVb. Given below are graphical summaries of these results, along with brief discussions of the most significant findings. Both time-integrated samples (based upon filters, canisters, and cartridge collection) and real-time PM samples are discussed.

23
Table VIII – Toledo Syngas Samples Collected in December, 2009
Test Number Date Feedstock Test Conditions
1* 12/14/2009 Blank System Blank 2 12/15/2009 Rice Hulls Scrapped 3*
12/16/2009 Rice Hulls Undiluted 3A* 3B* 4* 12/16/2009 Blank Field Blank 5* 12/17/2009 Wood Chips Diluted x4.6 6*
12/17/2009 Wood Chips Undiluted 7* 8*
9* 12/17/2009 Rice Straw/Wood Chips Diluted x 5.1
10* 12/17/2009 Wood Chips Diluted x 5.0; before U-Scrubber
* samples analyzed in the lab. 4a. Integrated Laboratory Measurements 1) Major Syngas Constituents – The main syngas constituents were determined by GC analysis of
samples collected in canisters. Results are shown in Figure 19 for H2, CO, CO2, and CH4. Samples 3A and 3B (and possibly 7) appear to have anomalously low total concentrations, which raises questions about the validity of these samples. However, in all samples (including 3A and 3B), the relative fractions of the four major species are reasonably constant. The dominant species is H2, which generally constitutes about ½ of the total identified species. CO2 is the 2nd largest constituent in all samples, followed by CO and CH4. (Compounds not measured include water, N2, and O2.) These species profiles are somewhat different from those determined by the on-line GC analysis (see Fig. 18) which showed nearly identical amounts of CO and CO2. Reasons for these discrepancies are not fully understood.
For several samples, total syngas compositions measured in 2009 were considerably lower than measured in 2008 (compare Figures 19 and 6). In addition, the 2009 results showed a strong relationship with sampling time. (Note sampling times indicated in Figure 19.) For example, Sample No’s 3, 3A, and 3B were all collected during a single run with rice hulls: Sample 3 was 60-min. long, Sample 3A was 10.5-min., and Sample 3B was 30 min. From wood chip generated syngas, Sample No. 6 was 60-min., Sample 7 was 10-min. and Sample No. 8 was 37 min. These varying results with sample time suggest that some systematic problem may have occurred during sampling. However, the total volume of gas collected in each canister seemed correct, as confirmed by measurement of canister pressures before and after use. Several factors may partially explain the low syngas concentrations measured when collected for short time periods. First, the critical orifice used to control the sampling rate into the evacuated canisters was selected so that slightly more than ½ capacity (at 1 atmosphere) would be achieved with 60-minutes of sampling. This means that for a 10-minute sample, very little syngas would be collected. It is possible that some amount of wall losses occurred with all samples, but these losses would represent a larger fraction of the total for short duration samples.

24
Another factor to consider is that the dilution sampler itself contains a some amount of “void volume” if it is used in a configuration that does not employ dilution gas – as was the case for all samples except No’s 5 and 10. During sampling, contents of the void volume (N2 or air) would diffuse throughout the dilution tunnel, thereby passively diluting the collected syngas sample. However, we don’t believe this passive dilution was very significant, since a 10-minute sample at 31 L/min represents a total flow of 310 L, while the total void volume within the dilution sampler is much less than 1 Liter. A third factor is that the sampling system was designed and intended for operation in a dilution mode. Failure to utilize dilution gas could result in unbalanced pressures across the range of sampling devices, or even introduction of leaks. (The occurrence of leaks could be determined by measuring N2 in the canisters, as was done in the 2008 field campaign. This was not possible with the 2009 samples because the canisters were pressurized with N2 prior to analysis.) However, it is not clear how such problems would disproportionately affect short-duration samples. Nevertheless, in future work, it seems advisable to utilize the sampler in a dilution mode, and to collect sufficient sample to half-fill the canisters.
Figure 19 – Major syngas constituents (2009)
(Sampling time indicated above each bar)
2) Total PM Mass – The total mass of PM in the syngas (as collected on Teflon filters) is shown in Fig. 20. (A total PM mass measurement is not available for Test No. 5.) This figure illustrates the effectiveness of the U-tube scrubber in removing PM species. The scrubber efficiency for total PM appears to be about 90%, based upon these results. Comparing Fig. 20 and Fig. 7 shows dramatic improvement in the overall TCC system performance in 2009 compared to 2008. In 2009, the total syngas PM concentrations were reduced by about 3 orders of magnitude, and were well within the purity specifications of 1.0 mg/m3 (see Table II). (It should also be pointed out that all filter mass measurements (except for Test No. 10) were near detection limits.
25
Figure 20 – Total PM mass concentration (2009)
3) Total Carbonaceous Material – Carbonaceous classifications of organic carbon (OC) and
elemental carbon (EC) collected on quartz filters are shown in Fig. 21. The seemingly large amount of OC in certain samples may be a result of positive sampling artifacts, whereby semi-volatile organic materials are adsorbed on the quartz filters, and are then devolatilized during conduct of the OC/EC instrumental analysis. The amount of EC collected on the quartz filter is very small, and more consistent with the total PM levels shown in Fig. 20. Comparison of Fig. 21 and Fig. 8 shows that OC/EC concentrations were reduced by about 3 orders of magnitude between the 2008 and 2009 field campaigns.
Figure 21 – PM Carbonaceous fractions (2009)
4) PM Elements – Individual elements within the collected PM were measured from the same
Teflon filters used to collect total PM. The results shown in Fig. 22 indicate very low concentrations of all elements in all samples, except for Sample #5 which appears anomalously high. However, all samples (including #5) had levels well below the syngas purity specification of 1.0 mg/m3 shown in Table II. Comparing Fig. 22 with Fig. 9 shows that the PM element concentrations were greatly reduced in 2009 compared with 2008.
Total PM Mass Concentration
0
20
40
60
80
100
120
#1 Blank #3 Rice Hulls #6 Wood Chips #10 Wood Chips beforeScrubber D*
ug/m
3
Total Carbonaceous Material
0
50
100
150
200
250
300
350
400
450
#1 Blank #3 Rice Hulls #5 Wood Chips D* #6 Wood Chips #10 Wood Chipsbefore Scrubber D*
ug/m
3
Total Elemental Carbon (EC)Total Organic Carbon (OC)
26
Figure 22 – PM elements (2009)
5) Ammonia – The concentrations of ammonia measured in the syngas samples (as collected on
citric acid filters) are shown in Fig. 23. In this figure, Sample #5 again appears to be unusually high. (It should also be noted that only Sample No’s 5 and 10 included active dilution.) Nevertheless, all samples show lower concentrations than observed during the 2008 field campaign, though only by about one order of magnitude.
Figure 23 – Ammonia concentrations (2009)
6) Particulate Anions – As shown in Fig. 24, sulfate and nitrate anions were measured in all syngas
samples, but chloride was determined only in Sample # 10, which was collected before the sulfur scrubber. Nitrate was generally present in slightly higher concentrations than sulfate. However, the total anion concentrations were very low, at <10 µg/m3.
PM Elements
0
20
40
60
80
100
120
#1 Blank #3 Rice Hulls #5 Wood ChipsD*
#6 Wood Chips #10 Wood Chipsbefore Scrubber
D*
ug/m
3
Sum of OthersSeries16Antimony (Sb)Chlorine (Cl)Uranium (U)Tantalum (Ta)Lead (Pb)PotassiumCalcium (Ca)Silicon (Si)Hafnium (Hf)Samarium (Sm)Europium (Eu)Scandium (Sc)Aluminum (Al)Magnesium (Mg)Sodium
Ammonia
0
50
100
150
200
250
#1 Blank #3 Rice Hulls #5 Wood Chips D* #6 Wood Chips #10 Wood Chipsbefore Scrubber D*
ug/m
3

27
Figure 24 – Particulate anions (2009)
7) Particulate Cations – Cations collected on quartz filters were analyzed by ion chromatography.
(Cation analyses were not conducted as part of the 2008 field campaign.) As shown in Fig. 25, ammonium was the dominant cation observed in all samples, with lesser amounts of potassium. Total cation concentrations were very low (<20 µg/m3) with sample #5 (which involved active dilution) again appearing higher than the other samples. Interestingly, the system blank sample showed a total cation concentration about ½ that of the highest syngas sample. A similar relative blank concentration was observed for total anions – see Fig. 24. (It should be noted that all syngas sample concentrations are shown as measured, with no corrections made based upon system blank levels.)
Figure 25 – Particulate cations (2009)
8) Acid Gases – The expected acid gases in syngas include HCl, HNO3, and H2SO4, as well as SO2 which is converted to SO4
= during the sampling and collection process. As shown in Fig. 26, HCl
Particulate Anions
0
2
4
6
8
10
12
#1 Blank #3 Rice Hulls #5 Wood Chips D* #6 Wood Chips #10 Wood Chipsbefore Scrubber D*
ug/m
3
Sulfate
Nitrate
Chloride
Particulate Cations
0
2
4
6
8
10
12
14
16
18
20
#1 Blank #3 Rice Hulls #5 Wood Chips D* #6 Wood Chips #10 Wood Chips before Scrubber D*
ug/m
3
Potassium (K+)Sodium (Na+)Ammonium (NH4+)
28
was not determined in any sample. In some samples, only nitrate was detected, while sulfate was the dominant species in Sample #10, collected before the sulfur scrubber (note the logarithmic scale in Fig. 26). These results demonstrate that the sulfur scrubber is highly effective in removing SO2 and H2SO4 from syngas.
Figure 26 – Acid gases in syngas (2009)
9) Carbonyls – Carbonyl compounds were collected on DNPH cartridges and analyzed by HPLC.
Unlike the 2008 field campaign, a single cartridge was used for each sample in 2009. (Results from 2008 showed minimal sample breakthrough from the first cartridges.) The carbonyl results are summarized in Fig. 27. As was seen in 2008, acetaldehyde was the dominant species present in every sample. In several ways, these carbonyl results differ from all other sample species discussed thus far. First, there appears to be a significant difference in carbonyls concentrations produced from the two feedstocks, with wood chips giving higher amounts than rice hulls. (Note, however, that the short-duration samples 3A and 3B may be erroneously low.) Second, the 2009 carbonyl concentrations were as high, (or even higher) than the 2008 samples (compare Fig. 27 and Fig. 13). Third, the catalytic sulfur scrubbing unit did not appear to reduce carbonyl concentrations significantly.
Figure 27 – Carbonyls in syngas (2009)
Acid Gases
1
10
100
1000
10000
#1 Blank #3 Rice Hulls #5 Wood Chips D* #6 Wood Chips #10 Wood Chipsbefore Scrubber D*
ug/m
3H2SO4HNO3
Carbonyls
0
100
200
300
400
500
600
#1 Blank #3 RiceHulls
#3A RiceHulls
#3B RiceHulls
#5 WoodChips D*
#6 WoodChips
#7 WoodChips
#8 WoodChips
#10 WoodChipsbefore
Scrubber
ppbv
sum of othersMethacrolein n-ButyraldehydeHexaldehydeBenzaldehydePropionaldehydeFormaldehydeAcrolein2-Butanone (MEK)AcetoneAcetaldehyde

29
10) VOCs – The VOC compounds measured from canisters are shown in Fig. 28. As in 2008, the three main species identified are benzene, ethene, and acetylene, with much smaller amounts of all other species. The total VOC concentrations measured in 2009 were about one order of magnitude less than those in 2008 (compare Fig. 28 and Fig. 14). As with the carbonyl results, these canister VOC concentrations appeared to be higher from the wood chip feedstock compared to the rice hull feedstock. Use of the sulfur-scrubbing catalyst appeared to also reduce VOCs somewhat. (Note again the apparently low concentrations for the short-duration samples 3A, 3B, and 7.)
Figure 28 – VOCs in syngas (2009)
11) SVOCs – Results of semi-volatile compounds measured from Tenax cartridges are shown in Fig.
29. Total concentrations measured in 2009 were much lower than in 2008 (compare Fig. 29 and Fig. 15.) The sulfur-scrubbing catalyst appeared to be very effective in removing most of the SVOCs.
Figure 29 – Tenax SVOCs in syngas (2009)
Canister VOCs
0
2,000
4,000
6,000
8,000
10,000
12,000
14,000
#1 Blank #3 RiceHulls
#3A RiceHulls
#3B RiceHulls
#5 WoodChips D*
#6 WoodChips
#7 WoodChips
#8 WoodChips
#10 WoodChipsbefore
ScrubberD*
ppm
v
Sum of OthersfuranToluene1,2-butadiene1,3-butadieneiso-butanepropeneEthaneAcetyleneEthenebenzene
Tenax SVOCs
0
1,000
2,000
3,000
4,000
5,000
6,000
7,000
8,000
9,000
#1 Blank #3 RiceHulls
#3A RiceHulls
#3B RiceHulls
#5 WoodChips D*
#6 WoodChips
#7 WoodChips
#8 WoodChips
#10 WoodChips beforeScrubber D*
ug/m
3
ethylbenzene
Indene
naphthalene
styrene
30
4b. Real-Time Particulate Measurements
Use of the portable syngas dilution sampling system in the 2009 field campaign allowed for real-time measurements of particle numbers and PM2.5 mass concentrations. Selected results from these measurements are provided below.
1) PM2.5 Mass Concentrations – Representative examples of real-time PM2.5 mass concentrations are shown in Figure 30. The top panel compared diluted and undiluted syngas samples produced from wood chips. (All results are expressed as concentrations in raw, undiluted syngas.) While these results may suggest that higher PM2.5 concentrations were measured when dilution sampling was used, it should be emphasized that all measurements were very low, and the differences between diluted and undiluted samples may simply be due to differences in stability of operation of the gasification system during the respective sampling periods.
The middle panel of Figure 30 compares PM2.5 measured in undiluted syngas samples from rice
hulls and wood chips. These real-time data suggest higher PM2.5 concentrations from rice hulls – by a factor of 4.5. However, these concentrations are all very low. On a time-integrated basis (from filter samples) no differences in PM2.5 concentration were observed (see Figure 20). It is also apparent that the gasifier operation was much more stable during collection of the wood chip syngas (Run No. 6-8) than during collection of the rice hull syngas (Run No. 3). The bottom panel of Figure 30 compares PM2.5 concentrations in syngas from wood chips before and after passing through the U-tube sulfur scrubber. Clearly, the scrubber was effective in reducing PM2.5, as the concentration ratio before/after this device was 32/1.
2) Particle Number Concentrations – Representative examples of real-time particle number
concentrations are shown in Figure 31. The same three comparisons as in Figure 30 (PM2.5 mass concentrations) are presented here for particle numbers. The top panel compares diluted and undiluted syngas from wood chips. As with the PM2.5 concentration results described above, the apparently higher particle numbers in the diluted sample may simply result from differences in operation of the gasifier during these two different sampling periods. Also, the total particle numbers are very low in all cases – generally near 104 particles/cm3.
The middle panel shows no difference in particle numbers between syngas from rice hulls and
wood chips, despite the apparent difference in PM2.5 mass concentrations shown in Figure 30. Again, all these number counts are very low. The bottom panel shows the effectiveness of the sulfur scrubber in removing particle numbers. The average ratio of particle numbers before/after the scrubber was 55/1.
3) Other Real-Time PM Comparisons – Several other interesting comparisons of real-time particle
measurements are presented in Figure 32. The top panel shows PM2.5 concentrations and particle numbers for the same Toledo syngas sample (Test No. 5, produced from wood chips). While not showing identical behavior, there does appear to be a good correspondence between these two real-time measurements, as they show similar peaks and valleys over the same time course.
The other two panels in Figure 32 compare particle measurements of Toledo syngas with diesel
exhaust emissions (from a different research study) and indoor air. Particle numbers are shown in the middle panel. On this basis, Toledo syngas was as clean as typical indoor air, while diesel exhaust emissions had PM number counts 3-orders of magnitude higher. PM2.5 mass concentrations are shown in the bottom panel. On this basis, Toledo syngas had an order of magnitude higher PM2.5 than indoor air, but 3 orders of magnitude below diesel exhaust emissions.

31
A. Syngas from wood chips
• Comparison of diluted and undiluted samples
• Diluted syngas test run No. 5; (12/17/09)
• Undiluted syngas test run No. 6-8 (12/17/09)
B. Syngas from wood chips and rice hulls
• Woodchip tests No. 6-8; (12/17/09; undiluted)
• Rice hull test No. 3: (12/16/09; undiluted)
• Higher PM conc. from rice hulls (ratio of 4.5/1)
C. Syngas before and after sulfur U-scrubber
• Syngas from woodchips
• Before scrubber: test run No. 10; (12/17/09; diluted)
• After scrubber: test run No. 6-8: (12/17/09; diluted)
• Much higher PM conc. before scrubber (ratio of 32/1)
Figure 30 – Real-Time PM2.5 Mass Concentration Measurements
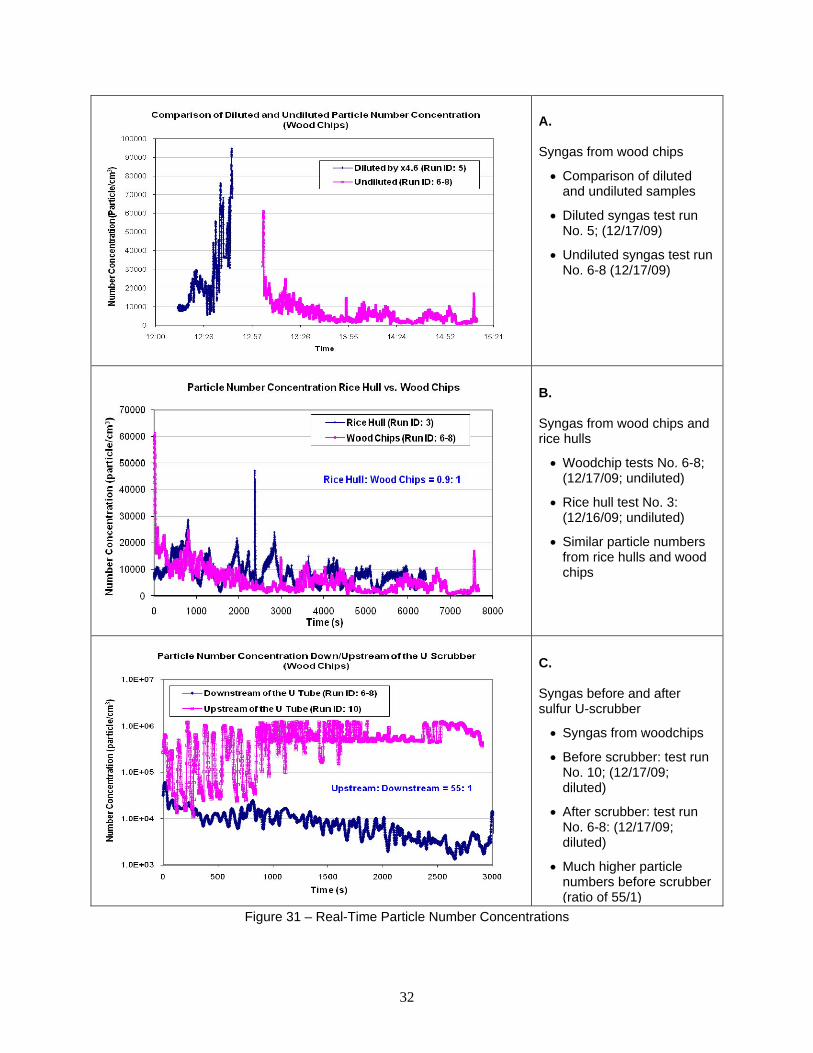
32
A. Syngas from wood chips
• Comparison of diluted and undiluted samples
• Diluted syngas test run No. 5; (12/17/09)
• Undiluted syngas test run No. 6-8 (12/17/09)
B. Syngas from wood chips and rice hulls
• Woodchip tests No. 6-8; (12/17/09; undiluted)
• Rice hull test No. 3: (12/16/09; undiluted)
• Similar particle numbers from rice hulls and wood chips
C. Syngas before and after sulfur U-scrubber
• Syngas from woodchips
• Before scrubber: test run No. 10; (12/17/09; diluted)
• After scrubber: test run No. 6-8: (12/17/09; diluted)
• Much higher particle numbers before scrubber (ratio of 55/1)
Figure 31 – Real-Time Particle Number Concentrations

33
A. Particle numbers and PM2.5 concentrations in syngas sample from wood chips
• Test Run No. 5: (12/17/09;)
• Diluted syngas
B. Comparison of particle numbers in syngas and in other samples
• Syngas from woodchip tests No. 6-8; (12/17/09; undiluted)
• Diesel engine exhaust tests from Oct. 2009; sampled with same dilution sampler
• Indoor office air sampled Feb. 2010
C. Comparison of PM2.5 mass concentration of syngas and other samples
• yngas from woodchip tests No. 6-8 (12/17/09; undiluted)
• Diesel engine exhaust tests from Oct. 2009; sampled with same dilution sampler
• Indoor office air sampled Feb. 2010
Figure 32 – Other Real-Time PM Comparisons
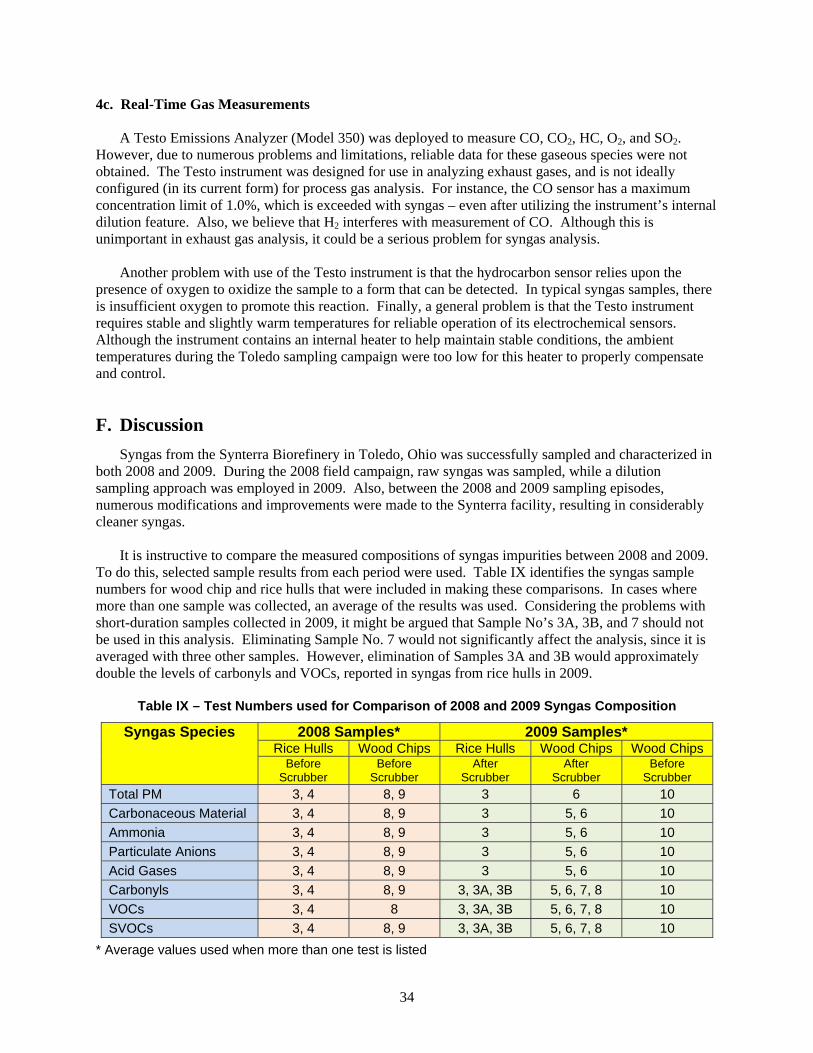
34
4c. Real-Time Gas Measurements
A Testo Emissions Analyzer (Model 350) was deployed to measure CO, CO2, HC, O2, and SO2. However, due to numerous problems and limitations, reliable data for these gaseous species were not obtained. The Testo instrument was designed for use in analyzing exhaust gases, and is not ideally configured (in its current form) for process gas analysis. For instance, the CO sensor has a maximum concentration limit of 1.0%, which is exceeded with syngas – even after utilizing the instrument’s internal dilution feature. Also, we believe that H2 interferes with measurement of CO. Although this is unimportant in exhaust gas analysis, it could be a serious problem for syngas analysis. Another problem with use of the Testo instrument is that the hydrocarbon sensor relies upon the presence of oxygen to oxidize the sample to a form that can be detected. In typical syngas samples, there is insufficient oxygen to promote this reaction. Finally, a general problem is that the Testo instrument requires stable and slightly warm temperatures for reliable operation of its electrochemical sensors. Although the instrument contains an internal heater to help maintain stable conditions, the ambient temperatures during the Toledo sampling campaign were too low for this heater to properly compensate and control.
F. Discussion Syngas from the Synterra Biorefinery in Toledo, Ohio was successfully sampled and characterized in
both 2008 and 2009. During the 2008 field campaign, raw syngas was sampled, while a dilution sampling approach was employed in 2009. Also, between the 2008 and 2009 sampling episodes, numerous modifications and improvements were made to the Synterra facility, resulting in considerably cleaner syngas.
It is instructive to compare the measured compositions of syngas impurities between 2008 and 2009. To do this, selected sample results from each period were used. Table IX identifies the syngas sample numbers for wood chip and rice hulls that were included in making these comparisons. In cases where more than one sample was collected, an average of the results was used. Considering the problems with short-duration samples collected in 2009, it might be argued that Sample No’s 3A, 3B, and 7 should not be used in this analysis. Eliminating Sample No. 7 would not significantly affect the analysis, since it is averaged with three other samples. However, elimination of Samples 3A and 3B would approximately double the levels of carbonyls and VOCs, reported in syngas from rice hulls in 2009.
Table IX - Test Numbers used for Comparison of 2008 and 2009 Syngas Composition
Syngas Species 2008 Samples* 2009 Samples* Rice Hulls Wood Chips Rice Hulls Wood Chips Wood Chips
Before Scrubber
Before Scrubber
After Scrubber
After Scrubber
Before Scrubber
Total PM 3, 4 8, 9 3 6 10 Carbonaceous Material 3, 4 8, 9 3 5, 6 10 Ammonia 3, 4 8, 9 3 5, 6 10 Particulate Anions 3, 4 8, 9 3 5, 6 10 Acid Gases 3, 4 8, 9 3 5, 6 10 Carbonyls 3, 4 8, 9 3, 3A, 3B 5, 6, 7, 8 10 VOCs 3, 4 8 3, 3A, 3B 5, 6, 7, 8 10 SVOCs 3, 4 8, 9 3, 3A, 3B 5, 6, 7, 8 10
* Average values used when more than one test is listed

35
Besides the many plant modifications and improvements made between the 2008 and 2009 sampling,
it should be pointed out that all 2008 samples were collected before the U-tube sulfur scrubber, while most of the 2009 samples were collected after the scrubber. (Only one 2009 syngas sample – from wood chips – was collected before the scrubber.) Graphical summaries of the 2008-2009 comparisons are provided in Figures 33 and 34, and are briefly discussed below.
1) Total PM – Figure 33A shows that total PM concentrations in the syngas samples were reduced by about three orders of magnitude in 2009, compared to 2008. (The 2008 samples were collected before the sulfur scrubber; the 2009 samples were collected after the sulfur scrubber.) Improvements in the syngas cleanup system are largely responsible for this reduction, as well as overall improvement in the operation of the Synterra biorefinery system. The biomass feedstock type (wood chips and rice hulls) did not have a major effect upon the total PM concentrations, but use of the sulfur scrubber did. The 2009 syngas results indicate that an order of magnitude reduction in PM concentration (from wood chips) resulted from use of the sulfur scrubber.
2) Total Carbonaceous Material – Similar to total PM, the concentrations of carbonaceous material
(measured as EC and OC by thermal/optical reflectance and transmittance) showed a three-order of magnitude reduction between 2008 and 2009 (before scrubber in 2008; after scrubber in 2009). In both sampling periods, it appears that syngas from wood chips had higher carbonaceous concentrations than syngas from rice hulls. Use of the sulfur scrubber in 2009 reduced the total carbonaceous material somewhat, particularly the EC fraction.
3) Ammonia – Figure 33C shows that ammonia concentrations were also reduced substantially
between 2008 and 2009, but by only about one order of magnitude. This suggests that the factors responsible for ammonia production and/or removal differ from those responsible for total PM and total carbonaceous material. This figure also suggests that wood chips produce somewhat higher ammonia concentrations compared to rice hulls – by a factor of about 3. Use of the sulfur scrubber had no effect on measured ammonia concentrations.
4) Particulate Anions – As shown in Figure 33D, particulate anion concentrations were reduced in
2009 syngas by about two orders of magnitude compared to 2008. In addition, the relative composition of the anions differed between these two periods. In 2008, chloride was the dominant species. In 2009, approximately equivalent amounts of chloride, nitrate, and sulfate were observed, but all were at very low concentrations. The total particulate anion concentrations in 2009 were below 10 µg/m3. Use of the sulfur scrubber in 2009 had little effect upon the particulate anion concentrations.
5) Acid Gases – The results of acid gas concentrations are somewhat confusing. The 2008 samples
(taken before the sulfur scrubber) had an order of magnitude higher concentration of total acid gases than the 2009 samples (taken after the sulfur scrubber). In addition, the compositional makeup of these acid gases varied significantly between 2008 and 2009. In 2008, hydrochloric acid was the dominant species, while in 2009 only nitric acid and sulfuric acid were measured. The 2009 samples clearly demonstrated the effectiveness of the sulfur scrubber, as this removed virtually all sulfuric acid from the wood chip-generated syngas.
6) Carbonyls – The results shown in Figure 34B indicate that acetaldehyde was the dominant
carbonyl species present in all syngas samples from both 2008 and 2009. (Note: the y-axis scale for the carbonyl results is linear, rather than logarithmic.) Unlike most other syngas impurities, the carbonyl concentrations were not reduced in 2009 compared to 2008. (The carbonyl level from rice hulls in 2009 would be about twice as large as shown if Samples 3A and 3B were
36
eliminated.) Furthermore, use of the sulfur scrubber in 2009 had no significant effect on the carbonyl concentrations. Apparently, the mechanism for carbonyl formation was unaffected by the improvements made in syngas cleanup and general operation changes that were implemented in 2009.
7) VOCs – VOC concentrations were substantially reduced in 2009 compared to 2008 – by about an
order of magnitude. It appears that rice hulls produced somewhat higher VOC concentrations than wood chips in 2008, while the reverse was seen in 2009. However, eliminating Samples 3A and 3B would approximately double the VOC levels shown for rice hulls in 2009. The C2 compounds (ethane, ethylene, and acetylene) were the dominant VOC species in all samples, although significant levels of benzene were also seen – particularly in the 2009 samples. Use of the sulfur scrubber in 2009 was somewhat effective in reducing VOCs, although the total concentrations were reduced by less than an order of magnitude.
8) SVOCs – Figure 34D shows that SVOC concentrations were dramatically reduced in 2009
compared to 2008 – by about three orders of magnitude (2008 samples before the sulfur scrubber; 2009 samples after the scrubber). In all samples, the SVOCs were primarily aromatic species, particularly styrene, naphthalene, and indene. No significant differences were observed between rice hull-derived and wood chip-derived syngas. Use of the sulfur scrubber in 2009 was very effective in reducing SVOCs – by about two orders of magnitude.

37
Figure 33 – Syngas Compositions: Comparison of 2008 and 2009 Samples (a) Total PM Mass Concentration; (b) Carbonaceous Material; (c) Ammonia; (d) Particulate Anions

38
Figure 34 – Syngas Compositions: Comparison of 2008 and 2009 Samples (a) Acid Gases; (b) Carbonyls; (c) VOCs; (d) SVOCs

39
G. Conclusions Syngas produced from biomass feedstocks by the Synterra biorefinery system in Toledo, Ohio was
successfully sampled and characterized during two field campaigns – one in 2008, the other in 2009. Both gas-phase and particle-phase samples were collected in each year. Numerous changes in operation of the Synterra plant and in sampling methodology between the two sampling periods make direct comparison of the results difficult.
In 2008, sampling of raw (undiluted) syngas resulted in fouling of sample lines and collection media, due to the presence of tars in high concentration. After the 2008 field campaign, plant modifications were implemented to improve the syngas cleanup at the Synterra biorefinery. Another measure taken to avoid high tar levels in 2009 was utilization of a dilution sampling system in place of the raw sampling that was conducted in 2008. As a result of these measures, no problems with tar contamination of sampling equipment were observed in the 2009 field campaign. In fact, the 2009 syngas was so clean that dilution sampling was not even necessary for most samples.
Comparing the syngas impurity levels between 2008 (before the sulfur scrubber) and 2009 (after the sulfur scrubber) showed dramatic reductions of most species. Total PM, total carbonaceous material (EC and OC), particulate anions, and SVOCs were all reduced by about three orders of magnitude. Ammonia, acid gases, and VOCs were reduced by about one order of magnitude. Carbonyl concentrations were unchanged between 2008 and 2009.
For most syngas species, substantial concentration differences were not observed between the two biomass feedstocks: rice hulls and wood chips. Exceptions were noted for ammonia, carbonyls, and particulate anions, where somewhat higher concentrations were observed from use of wood chips. Samples collected in 2009 demonstrated that use of the sulfur scrubber was effective in reducing concentrations of many impurities – including total PM, acid gases, VOCs, and SVOCs; but not ammonia or carbonyls species. Approximate concentrations of syngas impurities measured in 2009 (after the sulfur scrubber) are summarized below:
Syngas Impurity Approximate Concentration
Rice Hulls Wood Chips Total PM < 20 µg/m3 < 20 µg/m3 Carbonaceous material 20 µg/m3 150 µg/m3 Ammonia 35 µg/m3 120 µg/m3 Particulate anions < 10 µg/m3 < 10 µg/m3 Acid gases 10 µg/m3 20 µg/m3 Carbonyls 100 ppbv 400 ppbv VOCs 2000 ppmv 4000 ppmv SVOCs 50 µg/m3 100 µg/m3
Real-time measurements of PM2.5 concentrations and particle number counts were conducted during
the 2009 field campaign. These measurements confirmed the overall cleanliness of the syngas from both feedstocks with respect to PM impurities, and demonstrated the effectiveness of the sulfur scrubber in reducing both particle numbers and PM2.5 concentrations. The measured syngas particle number counts were similar to those typically seen in unpolluted indoor air situations, and were about three orders of magnitude below levels observed in diesel engine exhaust. Real-time PM measurements may be a useful way to monitor the performance of commercial syngas process units in the future.
40
H. References 1. Hartmann, H., T. Bohm, P. Daugbjerg Jensen, M. Temmerman, F. Rabier, and M. Golsner;
Methods for size classification of wood chips. Biomass and Bioenergy, 30, (11), 944-953. 2006.
2. Sampling and analysis of tar and particles in biomass producer gases. CEN BT/TF 143, 1-44. 2005.
3. Office of the Biomass Program; Biomass Multi-Year Program Plan. 2009.
4. Roadmap for Bioenergy and Biobased Products in the United States. Biomass Research and Development Technical Advisory Committee, 2007.
5. Milne, T.A., R.J. Evans, and N. Abatzoglou; Biomass Gasifier "Tars": Their Nature, Formation, and Conversion. NREL/TP-570-25357, National Renewable Energy Laboratory, 1998.
6. Xu, M., R.C. Brown, G. Norton, and J. Smeenk; Comparison of a solvent-free tar quantification method to the international energy agency's tar measurement protocol. Energy & Fuels, 19, (6), 2509-2513. ISI:000233419100040. 2005.
7. Carpenter, D.L., S.P. Deutch, and R.J. French; Quantitative Measurement of Biomass Gasifier Tars Using a Molecular-Beam Mass Spectrometer: Comparison with Traditional Impinger Sampling. Energy & Fuels, 21, 3036-3043. American Chemical Society, 2007.
8. England, G.C., J.G. Watson, J.C. Chow, B. Zielinska, K.R. Loos, and G.M. Hidy; Dilution-based emissions sampling from stationary sources: Part 1 - Compact sampler methodology and performance. J. Air Waste Manage. Assoc., 57, 65-78. 2007.
9. England, G.C., J.G. Watson, J.C. Chow, B. Zielinska, M.-C.O. Chang, K.R. Loos, and G.M. Hidy; Dilution-based emissions sampling from stationary sources: Part 2 - Gas-fired combustors compared with other fuel-fired systems. J. Air Waste Manage. Assoc., 57, 79-93. 2007.

41
I. Appendices APPENDIX I
1. Glossary
Acronym Definition BDT Bone Dry Ton BTU British Thermal Unit CHP Combined Heat and Power System (produces electricity and process heat) DRI Desert Research Institute dtpd Dry Tons Per Day (biomass feed rate: dry, ash free basis), equivalent to BDT dtph Dry Tons Per Hour (biomass feed rate: dry, ash free basis), equivalent to BDT EC/OC Elemental Carbon/Organic Carbon FPS Fuel Production System Gal U.S. gallon GC Gas Chromatography GC/FID Gas Chromatography-Flame Ionization Detector GC/MS Gas Chromatography-Mass Spectrometry IBEP Integrated Biofuels and Energy Production System HPLC High Performance Liquid Chromatography HHV Higher Heating Value (Btu/scf for syngas) IC Ion Chromatography ICP/MS Inductively coupled plasma mass spectrometry mg/m3 Milligrams per cubic meter m Meter mL Milliliter mm Millimeter MW Molecular Weight PDU Process Development Unit PM Particulate Matter ppbv parts per billion by volume ppm parts per million ppmv parts per million by volume PRF Pacific Renewable Fuels REII Renewable Energy Institute International RLB Red Lion Bio-Energy scf Standard cubic feet (at 70ºF, 14.7 psig) SRM Standard Reference Material SVOC Semi-Volatile Organic Compounds TCC Thermo-Chemical Conversion System VOC Volatile Organic Compounds Vol% % by volume
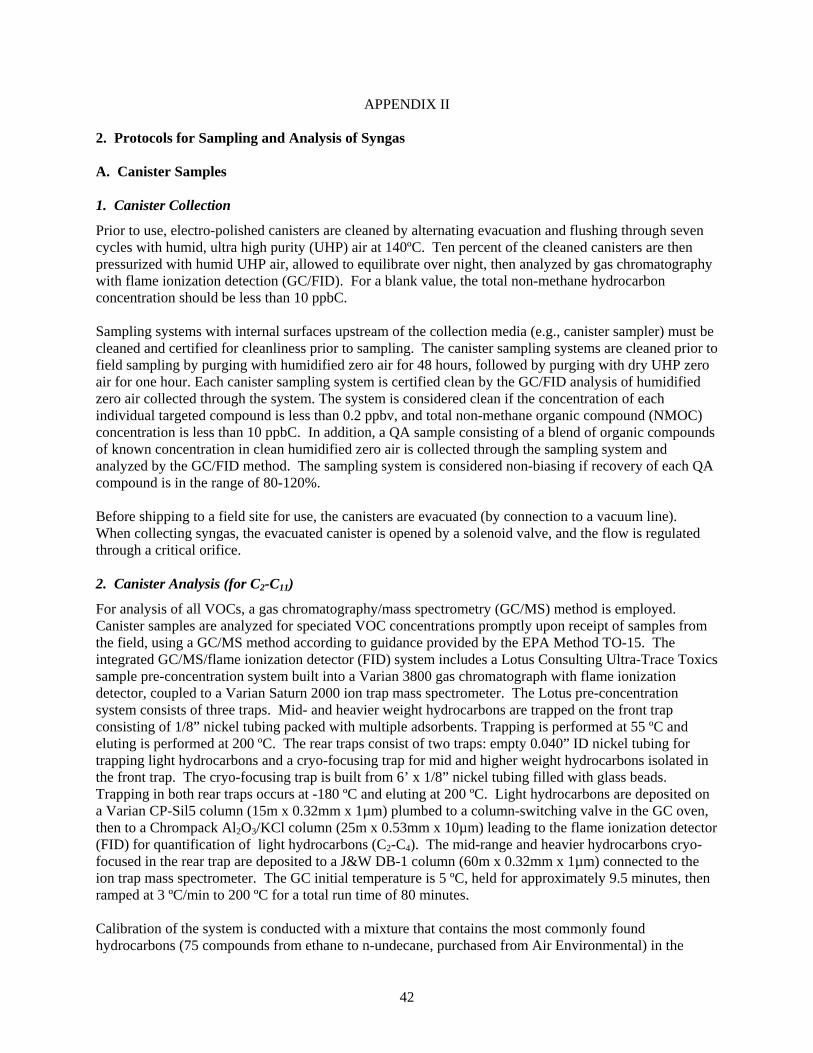
42
APPENDIX II
2. Protocols for Sampling and Analysis of Syngas A. Canister Samples 1. Canister Collection
Prior to use, electro-polished canisters are cleaned by alternating evacuation and flushing through seven cycles with humid, ultra high purity (UHP) air at 140ºC. Ten percent of the cleaned canisters are then pressurized with humid UHP air, allowed to equilibrate over night, then analyzed by gas chromatography with flame ionization detection (GC/FID). For a blank value, the total non-methane hydrocarbon concentration should be less than 10 ppbC. Sampling systems with internal surfaces upstream of the collection media (e.g., canister sampler) must be cleaned and certified for cleanliness prior to sampling. The canister sampling systems are cleaned prior to field sampling by purging with humidified zero air for 48 hours, followed by purging with dry UHP zero air for one hour. Each canister sampling system is certified clean by the GC/FID analysis of humidified zero air collected through the system. The system is considered clean if the concentration of each individual targeted compound is less than 0.2 ppbv, and total non-methane organic compound (NMOC) concentration is less than 10 ppbC. In addition, a QA sample consisting of a blend of organic compounds of known concentration in clean humidified zero air is collected through the sampling system and analyzed by the GC/FID method. The sampling system is considered non-biasing if recovery of each QA compound is in the range of 80-120%. Before shipping to a field site for use, the canisters are evacuated (by connection to a vacuum line). When collecting syngas, the evacuated canister is opened by a solenoid valve, and the flow is regulated through a critical orifice. 2. Canister Analysis (for C2-C11)
For analysis of all VOCs, a gas chromatography/mass spectrometry (GC/MS) method is employed. Canister samples are analyzed for speciated VOC concentrations promptly upon receipt of samples from the field, using a GC/MS method according to guidance provided by the EPA Method TO-15. The integrated GC/MS/flame ionization detector (FID) system includes a Lotus Consulting Ultra-Trace Toxics sample pre-concentration system built into a Varian 3800 gas chromatograph with flame ionization detector, coupled to a Varian Saturn 2000 ion trap mass spectrometer. The Lotus pre-concentration system consists of three traps. Mid- and heavier weight hydrocarbons are trapped on the front trap consisting of 1/8” nickel tubing packed with multiple adsorbents. Trapping is performed at 55 ºC and eluting is performed at 200 ºC. The rear traps consist of two traps: empty 0.040” ID nickel tubing for trapping light hydrocarbons and a cryo-focusing trap for mid and higher weight hydrocarbons isolated in the front trap. The cryo-focusing trap is built from 6’ x 1/8” nickel tubing filled with glass beads. Trapping in both rear traps occurs at -180 ºC and eluting at 200 ºC. Light hydrocarbons are deposited on a Varian CP-Sil5 column (15m x 0.32mm x 1µm) plumbed to a column-switching valve in the GC oven, then to a Chrompack Al2O3/KCl column (25m x 0.53mm x 10µm) leading to the flame ionization detector (FID) for quantification of light hydrocarbons (C2-C4). The mid-range and heavier hydrocarbons cryo-focused in the rear trap are deposited to a J&W DB-1 column (60m x 0.32mm x 1µm) connected to the ion trap mass spectrometer. The GC initial temperature is 5 ºC, held for approximately 9.5 minutes, then ramped at 3 ºC/min to 200 ºC for a total run time of 80 minutes.. Calibration of the system is conducted with a mixture that contains the most commonly found hydrocarbons (75 compounds from ethane to n-undecane, purchased from Air Environmental) in the

43
range of 0.2 to 10 ppbv. Three point external calibrations are run prior to analysis, and one calibration check is run every 24 hours. If the response of an individual compound is more then 10% off, the system is recalibrated. Replicate analyses are conducted at least 24 hours after the initial analyses to allow re-equilibration of the compounds within the canisters. All replicate analyses are flagged in the project database. Our data processing program extracts these replicates and determines a replicate precision. Replicate analysis is important because this provides a continuous check on all aspects of each analysis, and highlights analytical problems before they become significant. Method detection limit (MDL) is determined as recommended by the EPA Method TO-15 (according to the Code of Federal Regulations, 40 CFR 136 Appendix B). Briefly, seven consecutive replicate measurements of the compounds of interest at concentrations near (within a factor of 5) the expected detection limits are made, and the standard deviations for these 7 replicate concentrations are calculated. The MDL is obtained by multiplying these standard deviations by 3.14 (i.e. the Student’s t-value for 99 percent confidence for 7 values). In general, MDLs for VOC measurements are 0.1 – 0.2 ppbv. 3. Canister Analysis of Permanent Gases (CO, CO2, N2, CH4, H2)
3a. Methane, Carbon Monoxide, and Carbon Dioxide Methaane (CH4), carbon monoxide (CO) and carbon dioxide (CO2) are measured from the canister samples using GC/FID (Shimadzu GC-17A). Since the FID does not respond to CO and CCOO22,, these species are converted to methane by a methanator, positioned right after a GC column, but ahead of the FID. The methanator comprises a firebrick powder impregnated with nickel catalyst, through which a stream of hydrogen gas flows continuously at ~450 °C. For compound separation, a 20--ft x 1/8--in.. inner-diameter (i.d.) column, packed with 60/80 mesh of Carboxen 1000 (Supelco) is used. This column provides sufficient separation between CH4 and CO without retaining CO2. Five--ml samples are injected using a constant volume loop. An initial column temperature of 35°C is held for 8-min., followed by a gradient of 15°C/min to a final temperature of 200°C. The response factors are determined by calibrations with the gaseous standard mixtures (Scott Specialty Gases or AGA Specialty Gases, NIST-traceable) containing CO, CO2 and CH4 in zero air. The minimum detection limit for CO is 0.06 ppmv and for CH4 it is 0.2 ppmv, whereas for CO2 it is ~3 ppmv (MDLs determined as described above). The precision of measurements is generally better than 10%. 3b. Hydrogen and Nitrogen Hydrogen (H2) and nitrogen (N2) concentrations were measured using a SRI 8610C gas chromatograph with a 0.5 ml sample loop and a thermal conductivity detector. A SRI Molecular Sieve 13x (6 ft x 1/8 in ID) GC column was used. GC oven conditions were initial temperature of 40 °C, followed by a temperature ramp of 50 °C/min to 200 °C and held for 6.8 minutes to give a total run time of 10 minutes. A single stock calibration standard was obtained from Airgas containing a blend of H2 (50.04% ±1%), CO (19.98% ±1%), CO2 (19.98% ±1%), and CH4 (10% ±1%). Lower calibration levels were prepared by quantitatively diluting the stock gas with ultra high purity N2 into 6-liter stainless steel canisters. H2 calibration levels were 7.48%, 20.28%, 30.17%, and 50.04%. N2 standards were prepared from an ultra high purity (UHP) N2 sample mixed with helium (He).

44
B. Carbonyl Samples 1. Carbonyl Collection Carbonyl compounds are collected by drawing air through silica gel Sep-Pak cartridges impregnated with acidified 2,4-dinitrophenylhydrazine (DNPH), available commercially from Waters, Inc. The resulting products (hydrazones) in the cartridges are measured in the laboratory using high performance liquid chromatography (HPLC). The DRI sampler used for carbonyl collection consists of check valves, solenoid valves and a pump. Flow can be individually adjusted and measured for each cartridge. The solenoid is controlled by the timer, which allows for unattended sampling operations. A check valve is used with each solenoid valve, to protect the cartridge from any contamination when it is not in use. A 120V AC vacuum pump is capable of drawing air through the cartridges at up to 5-liters per minute. When the exposed cartridges are removed from the sampler, they are immediately plugged, put into vials, and stored in a container designated for exposed cartridges. The exposed cartridges are stored inside a refrigerator and returned to the laboratory in a cooler. 2. Carbonyl Analysis After sampling, the DNPH Sep-Pak cartridges are eluted with 2-mL acetonitrile to remove the hydrazone products produced during sampling of carbonyl compounds. An aliquot of the eluent is transferred into a 2-mL septum vial and injected with an autosampler into a high performance liquid chromatograph (HPLC; Waters 2690 Alliance System with 996 Photodiode Array Detector) for separation and quantification of the hydrazones. The chromatographic conditions are as follows: Polaris C18-A 3µm 100 x 2.0 mm HPLC column, flow rate of 0.2 ml/min, injection volume of 2.0 µl, solvent A: water, solvent B: acetonitrile. The HPLC program is: 60% A, 40% B for 0.02 min., 50% A and 50% B over 15 min., 30% A and 70% B over 6 min., and 100% B over 1 min., final hold at 100% B for 1 min. Run time: 30 min. C1 through C7 carbonyl compounds are analyzed, including the following: formaldehyde, acetaldehyde, acetone, acrolein, propionaldehyde, crotonaldehyde, methyl ethyl ketone, methacrolein, butyraldehyde, benzaldehyde, glyoxal, valeraldehyde, m-tolualdehyde, and hexanaldehyde. The original carbonyl concentrations in the syngas (in units of ppb) are computed from the amounts measured after blank correction, and after accounting for the volume of syngas sampled. MDLs are determined according to the method described above for VOC, and are generally in the range of 0.1-0.2 ppbv. C. Tenax SVOC Samples 1. Tenax Collection Tenax sampling and analysis is employed for compounds that are too heavy to be quantitatively retrieved from canisters. These materials are called semi-volatile organic compounds (SVOC). Prior to use, the Tenax-TA solid adsorbent is cleaned by Soxhlet extraction with hexane/acetone mixture (4/1 v/v) overnight, and dried in a vacuum oven at ~80ºC. The dry Tenax is packed into Pyrex glass tubes (4 mm i.d. x 15 cm long; each tube containing 0.2 g of Tenax) and is thermally conditioned for four hours by heating in an oven at 300ºC under a nitrogen purge (25 mL/min N2 flow). Approximately 10% of the pre-cleaned Tenax cartridges are tested by GC/MS for quality assurance prior to sampling. After cleaning, the Tenax cartridges are capped tightly using clean Swagelok caps (brass) with graphite/vespel ferrules, placed in metal containers with activated charcoal on the bottom, and kept in a clean environment at room temperature. The DRI Tenax sampler includes mass flow controllers, which allows for individual flow control of each cartridge. Cartridges installed in the sampler are protected by a check valve upstream, and a solenoid valve downstream. They are only exposed to the sample stream during a defined period of collection.

45
When the exposed cartridges are removed, they are immediately plugged with Swagelok caps, and stored in a container designated for exposed cartridges with activated charcoal on the bottom. The exposed cartridges are stored inside a refrigerator and returned to the laboratory in a cooler containing blue ice. 2. Tenax Analysis The Tenax samples are analyzed by a thermal desorption-cryogenic pre-concentration method, followed by high-resolution gas chromatographic separation and mass spectrometric detection (GC/MS) of individual compounds. A Gerstel ThermoDesorption System (TDS) unit, equipped with a 20 position autosampler, attached to the Varian Saturn 2000 GC/MS system, is used for the purpose of sample desorption and cryogenic pre-concentration. A 60 m (0.32 mm i.d., 0.25 µm film thickness) DB-1 capillary column (J&W Scientific, Inc.) is used to achieve separation of the target species. The GC initial temperature is 30°C, held for 3-min., then increased to 250°C at 5°C/min., and held for 3-min. for a total run time of 50 min. For calibration of the GC/MS standard, Tenax cartridges are spiked with a methanol solution of standard hydrocarbons, prepared from high-purity commercially available C8-C20 aliphatic, oxygenated and aromatic hydrocarbons. The solvent is then removed with a stream of He (2 min, 100 mL/min at room temperature) and the Tenax cartridges are thermally desorbed into the GC system. Three concentrations of each standard compound are employed and two repeated sample injections per calibration level are made. Area response factors per nanogram of compound per Tenax cartridge are calculated for each concentration by the instrument software. All response factors are recorded in the software program and the mean or median value is taken. The original concentrations of SVOCs in the syngas (expressed in units of µg/m3) are computed after accounting for the volume of syngas sampled. MDLs are determined as described above for VOC, and are generally in the range of 0.01-0.02 µg/cartridge. D. Filter Packs 1. Filter Sample Collection
No single filter medium is appropriate for all desired analyses, so it is necessary to sample on multiple substrates for chemical speciation. Filter packs containing Teflon-membrane, quartz fiber and cellulose filters are used for syngas sampling and analysis. All filter batches are conditioned and acceptance tested prior to use in sampling. Two percent of filters from each batch are subjected to identical analyses as sampled filters, to ensure that they are sufficiently clean before use in actual sampling. The following three types of filters are used: Teflon-membrane filters are used for measurement of mass and elemental concentrations. These filters are obtained from Pall Corporation (Part No. R2PJ047) or Whatman Inc. (Part No. 7592-104). Quartz fiber filters are used for the determination of carbon fractions and ions in the particulate phase. These filters are obtained from Pall Corporation (Part No. 7202) or Whatman Inc. (Part No. 1851-047). Cellulose fiber filters are placed behind the more efficient particle-collecting filters (Teflon-membrane and quartz fiber). They are impregnated with gas-absorbing compounds, and are used to capture ammonia (with citric acid impregnation), acidic gases (with K2CO3 impregnation), and H2S (with AgNO3 impregnation). These filters are obtained from Whatman Inc. (31ET and 41). 2. PM Mass by Gravimetric Analysis
Unexposed and exposed Teflon-membrane filters are equilibrated at a temperature of 21.5 ± 1.5 °C and a relative humidity of 35 ± 5% for a minimum of 24 hours prior to weighing. Weighing is performed on a

46
Metter Toledo MT5 electro-microbalance with ±0.001 mg sensitivity. The charge on each filter is neutralized by exposure to a 210Po ionizing source for 30 seconds or more prior to the filter being placed on the balance pan. The balance is calibrated with a series of three Class 1 weights (50, 100, and 200 mg) and the tare is set prior to weighing each batch of filters. After every 10 filters are weighed, the calibration and tare are re-checked. If the results of these performance tests deviate from specifications by more than ±5 μg, the balance is re-calibrated. Replicate weights are determined on 100% of the filters before sampling (initial weights or pre-weights), and on 30% of the filters after sampling (final weights or post-weights) by an independent technician. Replicate pre-sampling (initial) weights must be within ± 0.010 mg of the original weights. Replicate post-sampling (final) weights on lightly-loaded samples (i.e., less than 1 mg) must be within ± 0.015 mg. Post-sampling weights on heavily loaded (i.e., greater than 1 mg) samples must be within 2% of the net weight. Pre- and post-weights, check weights, and re-weights (if required) are recorded on data sheets as well as being directly entered into a database via an internet connection. 3. Elements by X-Ray Fluorescence
Individual elements are analyzed on Teflon-membrane filters using a PANalytical Epsilon 5, energy dispersive x-ray fluorescence (ED-XRF) analyzer. The emissions of x-ray photons from the sample are integrated over time and yield quantitative measurements for 51 elements ranging from aluminum (Al) through uranium (U), and semi-quantitative measurements of sodium (Na) and magnesium (Mg). A spectrum of x-ray counts versus photon energy is acquired and displayed during analysis, with individual peak energies corresponding to each element and peak areas corresponding to elemental concentrations. The advantages of XRF analysis include high sensitivity for a large number of elements, the ability to analyze small sample quantities, and the non-destructive nature of the analysis. The source of x-rays in the PANalytical Epsilon 5 analyzer is a side-window, liquid-cooled, 100 KeV, 24 milliamp gadolinium anode x-ray tube. X-rays are focused on one of 11 secondary targets (Al, Ca, Ti, Fe, Ge, Zr, Mo, Ag, Cs, Ba, Ce) which in turn emit polarized x-rays to excite a sample. X-rays from the secondary target or the tube are absorbed by the sample, exciting electrons to higher level orbitals. As the electrons return to their ground state, photons are emitted which are characteristic of the quantum level jumps made by the electron; the energy of the emitted photons are, therefore, characteristic of the elements contained in the sample. The fluoresced photons are detected in a solid state germanium x-ray detector. Each photon that enters the detector generates an electrical charge whose magnitude is proportional to the photon's energy. The number of these photons is proportional to the number of atoms present. Ten separate XRF analyses are conducted on each sample to optimize detection limits for the specified elements. The ED-XRF system is calibrated using Micromatter (Arlington, WA) thin film standards. Multielement standards are analyzed daily to monitor for any instrument drift. Method detection limit (MDL) is defined as 3 times the standard deviation of multiple measurements of a laboratory blank filter. 4. Carbon Analysis by Thermal/Optical Reflectance/Transmittance (TOR/TOT)
The thermal/optical reflectance and transmittance (TOR/TOT) method measures organic (OC) and elemental (EC) carbon. This method is based on the principle that different types of carbon-containing particles are converted to gases under different temperature and oxidation conditions. The different carbon fractions from TOR/TOT are useful for comparison with other methods, which are specific to a single definition for organic and elemental carbon. The seven carbon fractions measured by the DRI Model 2001 Thermal/Optical Carbon Analyzer are the following:
1) OC1: Carbon evolved in a helium atmosphere at temperatures between ambient and 140 °C

47
2) OC2: Carbon evolved in a helium atmosphere at temperatures between 140 and 280 °C
3) OC3: Carbon evolved in a helium atmosphere at temperatures between 280 and 480 °C
4) OC4: Carbon evolved in a helium atmosphere between 480 and 580 °C
5) EC1: Carbon evolved in an oxidizing atmosphere at 580 °C
6) EC2: Carbon evolved in an oxidizing atmosphere between 580 and 740 °C
7) EC3: Carbon evolved in an oxidizing atmosphere between 740 and 840 °C The thermal/optical reflectance carbon analyzer consists of a thermal system and an optical system. The thermal system consists of a quartz tube placed inside a coiled heater. Current through the heater is controlled to attain and maintain pre-set temperatures for given time periods. A portion of a quartz filter is placed in the heating zone and heated to different temperatures under non-oxidizing and oxidizing atmospheres. The optical system consists of a He-Ne laser, a fiber optic transmitter and receiver, and a photocell. The filter deposit faces a quartz light tube so that the intensity of the reflected laser beam can be monitored throughout the analysis. As the temperature increases from ambient (~25 °C) to 580 °C, organic compounds are volatilized from the filter in a non-oxidizing (He) atmosphere while elemental carbon is not oxidized. When oxygen is added to the helium at temperatures greater than 580 °C, the elemental carbon burns and enters the sample stream. The evolved gases pass through an oxidizing bed of heated manganese dioxide where they are oxidized to carbon dioxide, then across a heated nickel catalyst, which reduces the carbon dioxide (by reaction with hydrogen) to produce methane (CH4). The methane is then quantified with a flame ionization detector (FID). The laser light for reflectance and transmittance is continuously monitored throughout the analysis cycle. The negative change in laser signal is proportional to the degree of pyrolytic conversion from OC to EC that takes place during OC analysis. After O2 is introduced, the laser signal increases rapidly as the light-absorbing carbon is burned off the filter. The carbon measured after the reflectance attains the value it had at the beginning of the analysis cycle is classified as EC. This adjustment for pyrolysis (i.e., optical pyrolysis [OP]) in the analysis is significant, and cannot be ignored. OC and EC are calculated as OC = OC1 + OC2 + OC3 + OC4 + OP and EC = EC1 + EC2 + EC3 - OP. The carbon analyzer system is calibrated by analyzing samples of known amounts of CH4, CO2, sucrose, and potassium hydrogen phthalate (KHP). The FID response is ratioed to a reference level of CH4 injected at the end of each sample analysis. Performance tests of the instrument calibration are conducted at the beginning and end of each day's operation. Intervening samples are re-analyzed when calibration changes of more than ±10% are found. Known amounts of American Chemical Society (ACS) certified reagent grade crystal sucrose and KHP are committed to carbon analysis as a verification of the OC fractions. Fifteen different standards are used for each calibration. 5. Filter Extraction
Water-soluble captions and anions are obtained by extracting a quartz-fiber particle filter in 15 mL of deionized-distilled water (DDW). The filter is placed in a 16 x 150 mm polystyrene extraction vial with a screw cap (e.g., Falcon #2045). Each vial is labeled with a bar code sticker containing the filter ID code. The extraction tubes are placed in tube racks, and the extraction solutions are added. The extraction vials are capped and sonicated for 60 minutes, shaken for 60 minutes, then aged overnight to assure complete extraction of the deposited material into the solvent. The ultrasonic bath water is monitored to prevent temperature increases from the dissipation of ultrasonic energy in the water. After extraction, these solutions are stored under refrigeration prior to analysis.

48
6. Water-Soluble Particulate Anion Analyses
Water-soluble particulate anions (Cl-, NO2-, NO3
-, PO43-, and SO4
2-) are collected on a quartz-fiber filter, and extracted into water using 15-mL of DDW, as described above. The anions are then analyzed using a Dionex ICS-3000 ion chromatograph (IC; Sunnyvale, CA). An ion-exchange column is used to separate the ions for individual quantification by a conductivity detector. Prior to detection, the column effluent enters a suppressor column where the chemical composition of the component is altered, resulting in a matrix of low conductivity. The ions are identified by their elution/retention times and are quantified by the conductivity peak area, as compared with calibration curves derived from solution standards. 250-µL of filter extract is injected into the Dionex IC. The system used for anion analysis contains a guard column (AG14 column, Cat. No. 046134) and an anion separator column (AS14 column, Cat. No. 046129) with a strong basic anion exchange resin, and an anion micro membrane suppressor column (250 × 4 mm ID) with a strong acid ion exchange resin. The anion eluent consists of 0.0035 M sodium carbonate (Na2CO3) and 0.001 M sodium bicarbonate (NaHCO3) prepared in DDW. The DDW is verified to meet ATSM Type 1 specifications prior to preparation of the eluent. For quantitative determinations, the IC is operated at a flow rate of 2.0 mL/min. NIST traceable primary standard solutions are purchased either from Environmental Research Associates (ERA; Arvada, CO) or Dionex (Sunnyvale, CA). Calibration standards at concentration levels of 100 µg/mL are prepared monthly by diluting the primary standard solution to concentrations covering the range of concentrations expected in the filter extracts. These calibration standards are stored in a refrigerator. The calibration concentrations prepared are at 0.05, 0.1, 0.2, 0.5, 1.0, 2.0 and 3.0 μg/mL for each of the analysis species. Calibrations are performed daily. A DDW blank is analyzed after every 20 samples and a calibration standard is analyzed after every 10 samples. These quality control checks verify the baseline and calibration, respectively. Environmental Research Associates (ERA) standards are used daily as an independent quality assurance (QA) check. These standards (ERA Wastewater Nutrient and ERA Mineral WW) are NIST traceable. If the values obtained for these standards do not coincide within a pre-specified uncertainty level (typically three standard deviations of the baseline level or ±5%), the samples between that standard and the previous calibration standards are re-analyzed. After analysis, the printout for each sample in the batch is reviewed for the following: 1) proper operational settings, 2) correct peak shapes and integration windows, 3) peak overlaps, 4) correct background subtraction, and 5) quality control sample comparisons. When values for replicates differ by more than ±10%, or values for standards differ by more than ±5%, samples before and after these quality control checks are designated for re-analysis in a subsequent batch. Individual samples with unusual peak shapes, background subtractions, or deviations from standard operating parameters are also designated for re-analysis. Dionex Chromeleon software operating on a Dell Optiplex microcomputer controls the sample throughput, calculates concentrations, and records data in the laboratory data base. Method detection limit (MDL) is defined as 3 times the standard deviation of multiple measurements of a laboratory blank filter. 7. Water-Soluble Particulate Cation Analyses
Water-soluble particulate cations (NH4+, K+, Na+, Mg2+, and Ca2+) are collected on the same quartz-fiber
filters used for collection of particulate anions (see above), and are isolated in the same water extract solution. Different analytical methods are then used to measure NH4+ (automated colorimetry) and the rest of the cations (atomic absorption). These methods are described below:
49
a) NH4+ measurement
Ammonium concentrations are measured using the indol-phenol method with an automated colorimetric analyzer system (Astoria Analyzer AC; Astoria Pacific, Clackamas, OR, USA). The heart of the AC system is a peristaltic pump, which introduces air bubbles into the sample stream. Each sample is mixed with reagents and subjected to appropriate reaction periods before submission to a colorimeter. Beer’s Law relates the liquid’s absorbency to the amount of the ion in the sample. A photomultiplier tube measures this absorbency through an interference filter that is specific to the species being measured. Water-soluble NH4
+ in the extract is reacted with phenol and alkaline sodium hypochlorite to produce indol-phenol, a blue dye. The reaction is catalyzed by the addition of sodium nitro-prusside. The absorbency of the solution is measured at 630 nm. Two mL of extract in a sample vial is placed in an autosampler that is controlled by a computer. Eight standard concentrations (i.e., 0.05, 0.1, 0.2, 0.5, 1.0, 2.0, 5.0, and 10.0 µg/mL) are prepared from ACS reagent-grade (NH4)2SO4. Each set of samples consists of two distilled water blanks to establish a baseline, seven calibration standards and a blank, then sets of 10 samples followed by analysis of one of the standards and a replicate from a previous batch. The system determines carry-over by analysis of a low concentration standard following a high concentration standard. The percent carry-over is then automatically calculated and can be applied to the samples analyzed during the run. Astoria’s FASPac software operating on a Dell Optiplex microcomputer controls the sample throughput, calculates concentrations, and records data in the laboratory data base. When present in high concentrations (>20% of the NH4
+ level) formaldehyde has been found to interfere with NH4
+ measurements. Hydrogen sulfide (H2S) also interferes when it is present in concentrations that exceed 1 mg/mL. Also, NO3
- and SO4= are potential interferents when present at levels that exceed 100
times the NH4+ concentration, although these levels are rarely observed. The precipitation of hydroxides
of heavy metals such as calcium and magnesium is also a potential problem, but this is prevented by addition of sodium citrate/sodium potassium tartrate buffer solution to the sample stream. b) K+, Na+, Mg2+, and Ca2+ measurement
The remaining the water-soluble cations are measured by atomic absorption (AA) spectrometry, using a Varian SpectrAA 880 Double Beam Atomic Absorption Spectrometer (Varian, Palo Alto, CA, USA). Atomic absorption spectroscopy methods rely on the principle that free, uncombined atoms will absorb light at specific wavelengths corresponding to the energy requirements of the specific atom. Atoms in the ground state absorb light and are exited into a higher energy state. Each transition between energy states is characterized by a different energy, and therefore a different wavelength of light. The atomic spectrum of each element comprises a number of discrete lines arising from both the ground and exited states. The lines which originate in the ground state atoms, called resonance lines, are the most often of interest in atomic absorption spectrometry, as ground state atoms are most prevalent in practical atomization methods. The amount of light absorbed is proportional to the concentration of the atoms over a given absorption path length and wavelength. Standards of known concentration are prepared, matched to the sample matrix, and measured. The unknown sample absorbencies are compared to the absorbencies of the standards. Since the measured absorbance is directly proportional to the concentration of analyte this gives a simple and accurate method of determining the unknown concentration. The Varian SpectrAA instrument uses a hollow-cathode lamp emits wavelengths appropriate for each analysis. The monochrometer is set at 766.5 nm for K+, 589 nm for Na+, 285.2 nm for Mg2+, and 422.7 nm for Ca2+. Approximately 1-2 mL of the aqueous filter extract solutions are aspirated (at 0.5 mL/min) into an air/acetylene flame within the AA spectrometer. The output of the photomultiplier is recorded at a

50
rate of two readings per second. These readings are averaged over 2.5-second intervals and compared to the results from standard analyses over the same averaging times. For routine analysis, up to 120 sample vials containing 1 mL of solution per cation analyzed are loaded into the autosampler. Sets of 13 vials follow, with each set containing 10 filter extract samples, one standard, one blank, and one replicate from a previous batch. Samples are re-analyzed when quality control standards differ from specifications by more than ±5% or when replicates (at levels exceeding 10 times detection limits) differ by more than ±10%. NIST traceable ICP grade standards at concentration levels of 1,000 µg/mL are used for stock standard solutions. Stock solutions are diluted monthly for use as calibration standards. Ionization interference is eliminated by addition of cesium chloride (CsCl) to samples and standard solutions. Varian SpectrAA Pro software operating on a Dell Optiplex microcomputer controls the sample throughput, calculates concentrations, and records data in the laboratory data base. Method detection limit (MDL) is defined as 3 times the standard deviation of multiple measurements of a laboratory blank filter. 8. Ammonia
Ammonia is collected on a citric acid impregnated cellulosic fiber filter, where it is chemically reacted to produce ammonium citrate. The filter is then extracted with DDW, and the extract is analyzed for ammonium ion using the indol-phenol method an automated colorimetric analyzer system, as described above. 9. Acid Gases Acid gases (HCl, HNO3, and H2SO4) are collected on a cellulose fiber filter that is impregnated with potassium carbonate (K2CO3). During collection, these acid gases react with the potassium carbonate to produce the corresponding potassium salts (KCl, KNO3, and K2SO4). This filter is then extracted with DDW, and the extract is analyzed for anions using the same ion chromatographic method described above. In addition, sulfur dioxide (SO2) present in the gas phase will react on the filter to produce sulfate. Thus, the total sulfate measurement by IC represents the sum of H2SO4 and SO2 present in the original gas sample. 10. Hydrogen Sulfide (H2S)
Hydrogen sulfide (H2S) is collected on a cellulosic fiber filter that is impregnated with sulfur nitrate (AgNO3). During collection, the H2S is reacted to produce silver sulfide (AgS). This filter is not extracted, but is analyzed directly by XRF, to quantify the sulfur on the filter, from which the original H2S concentration in the sampled gas is computed. E. Real-Time Measurements 1. PM Concentration by the DustTrak DRX
The DustTrak DRX Aerosol Monitor (Model 8534 by TSI Inc., Shoreview, MN) simultaneously measures PM1, PM2.5, PM4, PM10, and total particulate matter (TPM) based on light scattering principles. Aerosols are drawn into the instrument by an internal pump operating at 3 liter/minute. Light scattered from the ensemble of particles in the laser beam, as well as from individual larger particles, is used to calculate size segregated mass concentrations. The DustTrak DRX measures a wide concentration range (0.001-150 mg/m3) with a fast response time (1 second). Since it is an optical instrument, its response

51
depends on aerosol size distribution and composition. A custom calibration factor with the aerosol being tested can be generated using a reference method (filter-based gravimetric method in this study). 2. Particle Number Concentration by the Condensation Particle Counter (CPC)
The hand-held CPC (Model 3007, TSI Inc., Shoreview, MN) measures particle number concentration in real time based on the principle of condensation growth followed by optical counting. An aerosol sample is drawn continuously at 0.7 liter/minute through a heated saturator, in which alcohol is vaporized and diffuses into the sample stream. Together, the aerosol sample and alcohol vapor pass into a cooled condenser where the alcohol vapor becomes supersaturated and ready to condense. Particles present in the sample stream serve as condensation sites for the alcohol vapor. Once condensation begins, particles grow quickly into larger alcohol droplets (>1 µm) and pass through an optical detector where they are counted. The particle concentration is calculated from the number of particles counted in a give time interval. The CPC 3007 can measure particles larger than 10 nm for concentrations up to 100,000 particle/cm3. Extra dilution can be applied for measuring higher concentrations. 3. Real-Time Gas Concentrations (CO, CO2, hydrocarbons, NO, O2, and SO2)
The Testo Emission Analyzer (Model 350) hosts up to 6 gas sensors for real-time gas monitoring. In this study, the six sensors used are CO, CO2, hydrocarbons, NO, O2, and SO2. The CO2 sensor is a non-dispersive infrared (NDIR) sensor; the other five are electrochemical sensors based on the principle of ion selective potentiometry. Each sensor contains an electrolytic matrix that is designed for a specific gas to be detected. Two or three gas-specific electrodes are placed in this matrix and an electrical field is applied. Sample gas enters the sensor and chemically reacts (via oxidation or reduction) on the electrode, releasing electrically charged particles. This reaction causes the potential of the electrode to rise or fall with respect to the counter electrode. With a resistor connected across the electrodes, a current is generated that is proportional to the concentration of gas present. The output is converted and displayed as a concentration. The nominal specifications of the Testo 350 Emission Analyzer are listed in the table below:
Gas Range Accuracy Resolution Response Time
CO 0-10,000 ppm ±10 ppm (0...99 ppm) ±5 % of reading (100...2,000 ppm) ±10 % of reading (2001...10,000 ppm)
1 ppm 40 s
CO2 0-50 vol.%
±0.3 vol.%+1 % of reading (0.00...25.00 vol.%) 0.01 vol.%
10 s ±0.5 vol.%+1.5 % of reading
(25.1...50.0 vol.%) 0.1 vol.%
CxHy 100-40,000 ppm (methane) 100-21,000 ppm (propane) 100-18,000 ppm (butane)
±400 ppm (100...4,000 ppm) ±10 % of reading (rest of range) 10 ppm 40 s
NO 0-300 ppm ±2 ppm (0.0...39.9 ppm) ±5 % of reading (40.0...300.0 ppm)
0.1 ppm 30 s
O2 0-25 vol.% ±0.2 vol% 0.01 vol.% 20 s
SO2 0-5000 ppm ±5 ppm (0...99 ppm) ±5 % of reading (100...2,000 ppm) ±10 % of reading (2,001...5,000 ppm)
1 ppm 30 s

52
APPENDIX IIIa 3a. Syngas Sample Identification and Notes – 2008 Field Campaign
Test No. Feedstock Date Test Condition Canister Tenax
(higher flow) Tenax
(lower flow) DNPH Front
DNPH Backup
Teflon - Citric Acid Filter Pack
Quartz - Carbonate Filter Pack
Quartz - Silver Nitrate
Filter Pack
1* Blank 11/11/2008 System Blank P080M001I001 P080M002I001 P080M002I002 P080M003I001 P080M003I002 GDTCC001 GDQKK001 GDQAA001 2 Rice Hulls 11/11/2008 Before scrubber P080M001I002 P080M002I003 P080M002I004 P080M003I003 P080M003I004 GDTCC002 GDQKK002 GDQAA002 3* Rice Hulls 11/11/2008 thru empty scrubber P080M001I003 P080M002I005 P080M002I006 P080M003I005 P080M003I006 GDTCC003 GDQKK003 GDQAA003 4* Rice Hulls 11/11/2008 thru empty scrubber P080M001I004 P080M002I007 P080M002I008 P080M003I007 P080M003I008 GDTCC004 GDQKK004 GDQAA004 5 Rice Hulls 11/12/2008 Before scrubber P080M001I006 P080M002I009 P080M002I010 P080M003I009 P080M003I010 GDTCC005 GDQKK005 GDQAA005 6 Wood chips 11/12/2008 thru empty scrubber P080M001I007 P080M002I011 P080M002I012 P080M003I011 P080M003I012 GDTCC006 GDQKK006 GDQAA006 7 Wood chips 11/12/2008 Before scrubber P080M001I008 P080M002I013 P080M002I014 P080M003I013 P080M003I014 GDTCC007 GDQKK007 GDQAA007 8* Wood chips 11/12/2008 thru empty scrubber P080M001I009 P080M002I015 P080M002I016 P080M003I015 P080M003I016 GDTCC008 GDQKK008 GDQAA008 9* Wood chips 11/12/2008 Before scrubber P080M001I010 P080M002I017 P080M002I018 P080M003I017 P080M003I018 GDTCC009 GDQKK009 GDQAA009 10 Blank 11/12/2008 Field Blank P080M001I011 P080M002I019 P080M002I020 P080M003I019 P080M003I020 GDTCC010 GDQKK010 GDQAA010
Comments for above samples
Test No. Feedstock Date Test Condition Canister Tenax
High flow Tenax
Low flow DNPH DNPH Teflon Quartz Quartz
1* Blank 11/11/2008 system blank pump off for ~1 minutes Pump did not start. Tied into Tenax pump for last 18 minutes
2 Rice Hulls 11/11/2008
3* Rice Hulls 11/12/2008 no catalyst in scrubber
4* Rice Hulls 11/12/2008 no catalyst in scrubber Filter pump blew circuit breaker
5 Rice Hulls 11/12/2008 Filter pump blew circuit breaker filter stuck to drain disk
6 Wood chips 11/12/2008 no catalyst in scrubber Did not sample Filter pump blew circuit breaker;
Low flow tip broke filter stuck to drain disk
7 Wood chips 11/12/2008 Filter pump blew circuit breaker Filter pump blew circuit breaker filter stuck to drain disk
part of filter still stuck to grid
filter was stuck to grid and stretchy
8* Wood chips 11/12/2008 no catalyst in scrubber filter stuck
to drain disk
part of filter still stuck to grid
9* Wood chips 11/12/2008 filter stuck to drain disk
part of filter still stuck to grid
10 Blank 11/12/2008 field blank
* Bolded samples were analyzed
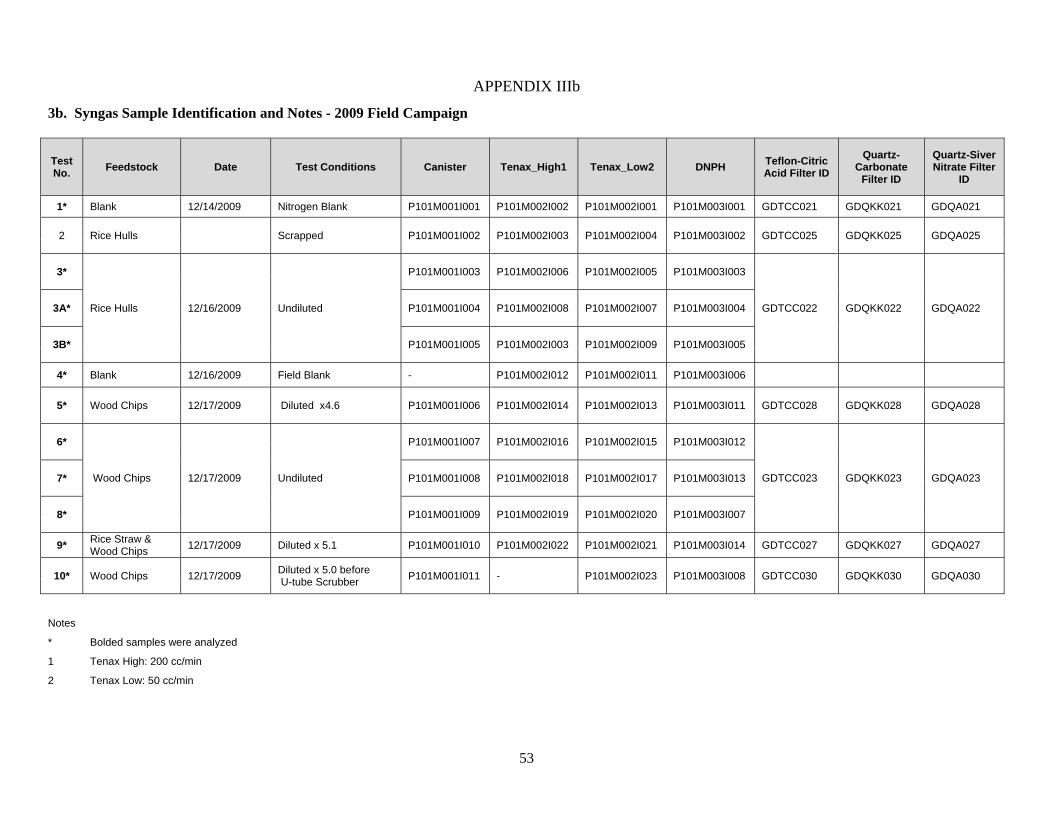
53
APPENDIX IIIb
3b. Syngas Sample Identification and Notes - 2009 Field Campaign
Test No. Feedstock Date Test Conditions Canister Tenax_High1 Tenax_Low2 DNPH Teflon-Citric
Acid Filter ID Quartz-
Carbonate Filter ID
Quartz-Siver Nitrate Filter
ID
1* Blank 12/14/2009 Nitrogen Blank P101M001I001 P101M002I002 P101M002I001 P101M003I001 GDTCC021 GDQKK021 GDQA021
2 Rice Hulls Scrapped P101M001I002 P101M002I003 P101M002I004 P101M003I002 GDTCC025 GDQKK025 GDQA025
3*
Rice Hulls 12/16/2009 Undiluted
P101M001I003 P101M002I006 P101M002I005 P101M003I003
GDTCC022 GDQKK022 GDQA022 3A* P101M001I004 P101M002I008 P101M002I007 P101M003I004
3B* P101M001I005 P101M002I003 P101M002I009 P101M003I005
4* Blank 12/16/2009 Field Blank - P101M002I012 P101M002I011 P101M003I006
5* Wood Chips 12/17/2009 Diluted x4.6 P101M001I006 P101M002I014 P101M002I013 P101M003I011 GDTCC028 GDQKK028 GDQA028
6*
Wood Chips 12/17/2009 Undiluted
P101M001I007 P101M002I016 P101M002I015 P101M003I012
GDTCC023 GDQKK023 GDQA023 7* P101M001I008 P101M002I018 P101M002I017 P101M003I013
8* P101M001I009 P101M002I019 P101M002I020 P101M003I007
9* Rice Straw & Wood Chips 12/17/2009 Diluted x 5.1 P101M001I010 P101M002I022 P101M002I021 P101M003I014 GDTCC027 GDQKK027 GDQA027
10* Wood Chips 12/17/2009 Diluted x 5.0 before U-tube Scrubber P101M001I011 - P101M002I023 P101M003I008 GDTCC030 GDQKK030 GDQA030
Notes
* Bolded samples were analyzed
1 Tenax High: 200 cc/min
2 Tenax Low: 50 cc/min

54
APPENDIX IIIc – 2009 Field Campaign 3c. Syngas Sample Volumes and Sampling Conditions – 2009 Field Campaign
Tenax High Flow 1
Tenax Low Flow 2 DNPH Cartridge Canister Teflon-Citric Acid Filters
Quartz-Carbonate Filters Quartz-AgNO3 Filters
Sample No. Feedstock Time
(min)
Flow Rate
(SLPM)
Vol. (SL)
Time (min)
Flow Rate
(SLPM)
Vol. (SL)
Time (min)
Flow Rate
(SLPM)
Vol. (SL)
Time (min)
Time (min)
Flow Rate
(SLPM)
Vol. (SL)
Time (min)
Flow Rate
(SLPM)
Vol. (SL)
Time (min)
Flow Rate
(SLPM)
Vol. (SL)
1 Blank 30.00 0.20 6.00 30.00 0.05 1.50 30.00 1.07 32.10 30.00 30.00 4.84 145.20 30.00 5.01 150.30 30.00 4.53 135.90
2 Rice Hulls
3
Rice Hulls
72.75 0.20 14.55 70.00 0.05 3.50 75.20 1.01 75.95 60.00
118.67 4.84 574.36 118.67 5.01 594.54 118.67 4.53 537.58 3A 18.50 0.20 3.70 18.00 0.05 0.90 18.33 1.01 18.51 10.50
3B 26.33 0.20 5.27 28.42 0.05 1.42 24.50 1.01 24.75 30.00
4 Blank
5 Wood Chips 37.00 0.20 1.61 37.00 0.05 0.40 37.00 1.01 8.12 30.00 30.00 4.84 31.57 30.00 5.01 32.67 30.00 4.53 29.54
6
Wood Chips
71.83 0.20 14.37 71.83 0.20 14.37 73.75 1.01 74.49 60.00
132.50 4.84 641.30 132.50 5.01 663.83 132.50 4.53 600.23 7 18.55 0.20 3.71 19.58 0.05 0.98 17.50 1.01 17.68 10.35
8 41.53 0.20 8.31 43.10 0.05 2.16 40.83 1.01 41.24 37.30
9 Rice Straw
& Wood Chips
35.00 0.20 1.37 35.00 0.05 0.34 35.00 1.01 6.93 13.00 354.00 4.84 335.95 354.00 5.01 347.75 354.00 4.53 314.44
10 Wood Chips 52.95 0.05 0.53 52.95 1.01 10.70 46.83 52.95 4.84 51.26 52.95 5.01 53.06 52.95 4.53 47.97
1 Tenax High flow rate = 200 cc/min
2 Tenax low flow rate = 50 cc/min

55
APPENDIX IVa
4a. Laboratory Results – 2008 Field Campaign Sample # (Concentration of Species)
Analytical Method Detection Limit #1 Blank
#3 Rice Hulls
#4 Rice Hulls
#8 Wood Chips
#9 Wood Chips
(Sampling Method) Species Measured units Conc Conc Conc Conc Conc Gravimetry (Teflon Filters)
Mass Concentration µg/m3 7.3 7046 5287 32292 697262 669449
Thermal Optical (Quartz Filters)
Total Organic Carbon (OC) µg/m3 38.8 179 6422 57095 194267 121955 Total Elemental Carbon (EC) µg/m3 1.0 0 4133 10049 75323 67458 Total Carbon µg/m3 41.8 179 10555 67144 269590 189414 OC/EC Ratio N/A 1.55 5.68 2.58 1.81
Ion Chromatography (Quartz Filter)
Chloride µg/m3 10.0 253.91 50.13 82.77 146.21 524.19 Nitrate µg/m3 10.0 23.22 1.38 2.32 4.80 26.05 Sulfate µg/m3 10.0 2974.67 5.61 8.11 26.76 201.25
Automated Colorimetry (Citric Acid Cellulose Impregnated Filters)
NH3 µg/m3 10.9 109.7 532.6 351.6 287.0 2653.4
Ion Chromatography (Na2CO3 Impregnated Cellulose Filters)
HCl µg/m3 11.6 27.14 26.48 140.81 178.53 664.56 HNO3 µg/m3 11.6 2.27 2.89 11.40 9.46 20.83 SO2 µg/m3 11.6 10.29 3.84 12.59 18.18 240.41
X-Ray Fluorescence (AgNO3 Impregnated Filter)
H2S µg/m3 0.3 0 0 0 0 0
GC/TCD & GC/FID (Canister Samples Major Syngas Components)
H2 % 1.8 28.6 31.9 33.5 0.0 CO % 1.0 14.6 19.0 13.4 N/A CO2 % 4.5 10.6 13.3 15.3 N/A CH4 % 0.8 9.5 12.4 8.6 N/A O2 % N/A 0.85 0.89 0.44 N/A N2 % N/A 3.7 4.8 7.2 N/A
GC/MS/FID Acetylene ppbv 258501 13512650 30592438 6007374 N/A (Canister Samples) Ethene ppbv 13258 12936591 24090346 6921604 N/A
Ethane ppbv 2859 259196 372406 174366 N/A propene ppbv 249.64 77269 149384 33018 N/A propane ppbv 9.27 471.10 746.92 246.32 N/A 1,3-butadiene ppbv 61.89 29545 84227 8815 N/A 1-butene ppbv 11.98 206.33 356.09 79.40 N/A c-2-butene ppbv 2.94 146.56 271.50 45.48 N/A isobutene ppbv 7.83 79.17 147.86 34.38 N/A t-2-butene ppbv 3.71 173.73 327.93 72.36 N/A n-butane ppbv 0 0 0 0 N/A iso-butane ppbv 0 0 0 0 N/A iso-pentane ppbv 4.12 0 0 0 N/A n-pentane ppbv 6.04 293.22 781.08 93.19 N/A 1,2-butadiene ppbv 593.47 48194 116834 22879 N/A 2,2,4-trimethylpentane ppbv 0.84 0 0 0 N/A 2-methyl-1-butene ppbv 1.12 0 0 0 N/A 1-pentene ppbv 3.16 17.80 46.79 0 N/A isoprene ppbv 0 57.12 152.11 24.19 N/A t-2-pentene ppbv 1.22 0 0 0 N/A 2-methyl-2-butene ppbv 1.20 0 0 0 N/A c-2-pentene ppbv 0.75 0 0 0 N/A 2,2-dimethylbutane ppbv 0.46 0 0 0 N/A cyclopentane ppbv 0.80 0 0 0 N/A cyclopentene ppbv 1.35 63.85 89.09 45.97 N/A 2,3-dimethylbutane ppbv 0.90 0 0 0 N/A 2-methylpentane ppbv 1.65 0 0 0 N/A 2-methyl-1-pentene ppbv 0.77 0 0 0 N/A 3-methylpentane ppbv 1.65 0 0 0 N/A t-2-hexene ppbv 0.14 0 0 0 N/A n-hexane ppbv 2.18 0 0 0 N/A c-2-hexene ppbv 0.27 0 0 0 N/A 1,3-hexadiene (trans) ppbv 0.10 0 0 0 N/A methylcyclopentane ppbv 2.52 0 0 0 N/A 2,4-dimethylpentane ppbv 0.26 0 0 0 N/A

56
Sample # (Concentration of Species)
Analytical Method Detection Limit #1 Blank
#3 Rice Hulls
#4 Rice Hulls
#8 Wood Chips
#9 Wood Chips
(Sampling Method) Species Measured units Conc Conc Conc Conc Conc
benzene ppbv 7953 956059 1354000 1256000 N/A cyclohexane ppbv 2.65 0 0 0 N/A cyclohexene ppbv 0.48 0 0 0 N/A 2-methylhexane ppbv 2.14 0 0 0 N/A 2,3-dimethylpentane ppbv 1.06 0 0 0 N/A 1,3-dimethylcyclopentane (cis) ppbv 0.96 0 0 0 N/A 3-methylhexane ppbv 3.06 0 0 0 N/A n-heptane ppbv 9.29 0 0 0 N/A 2,3-dimethyl-2-pentene ppbv 0 0 0 0 N/A methylcyclohexane ppbv 17.26 0 0 0 N/A toluene ppbv 353.62 24870 44278 26799 N/A 2,3,4-trimethylpentane ppbv 0.29 0 0 0 N/A 2-methylheptane ppbv 0.79 0 0 0 N/A 4-methylheptane ppbv 0.23 0 0 0 N/A 3-methylheptane ppbv 0.48 0 0 0 N/A n-octane ppbv 0.29 0 0 0 N/A ethylbenzene ppbv 2.17 41.45 91.32 45.18 N/A m&p-xylene ppbv 5.28 106.03 307.31 117.14 N/A styrene ppbv 5.50 1817 3548 2645 N/A o-xylene ppbv 2.60 102.05 269.98 157.40 N/A n-nonane ppbv 0.05 0 0 0 N/A isopropylbenzene ppbv 2.89 1.42 4.01 3.47 N/A 3-ethyltoluene ppbv 1.06 0 3.93 0 N/A n-propylbenzene ppbv 0.45 0 0 0 N/A 4-ethyltoluene ppbv 0.60 0 1.19 0 N/A alpha-pinene ppbv 0.14 0 0 0 N/A 1,3,5-trimethylbenzene ppbv 0.51 0 0 0 N/A o-ethyltoluene ppbv 0.43 0 0 0 N/A 1,2,4-rimethylbenzene+ t-butylbenzene ppbv 0.77 0 3.42 0 N/A
n-decane ppbv 0.25 0 0 0 N/A indan ppbv 0.27 5.30 17.64 16.94 N/A 1,2,3-trimethylbenzene ppbv 0.44 0 0 0 N/A 1,3-diethylbenzene ppbv 0.32 0 0 0 N/A 1,4-diethylbenzene ppbv 0.65 0 0 0 N/A n-butylbenzene ppbv 0 0 0 0 N/A n-undecane ppbv 1.07 0 0 0 N/A furan ppbv 8.15 21.74 52.51 14.13 N/A 2-methyl-furan ppbv 4.21 7.25 12.80 5.12 N/A 2-furfural ppbv 0 0 0 0 N/A 3-furfural ppbv 0.21 0 0 0 N/A 2,5-dimethyl-furan ppbv 0.25 0 0 0 N/A 2-ethyl-furan ppbv 0.35 0 0 0 N/A
GC/MS (Tenax Cartridges)
ethynylbenzene+m/p-xylene µg/m3 49.81 3116 7367 212.99 3184 styrene µg/m3 25.54 6280 15416 440.02 5412 propenylbenzene µg/m3 0.88 18.84 61.30 1.95 22.42 benzonitrile µg/m3 3.51 35.17 121.55 29.21 194.11 1,2,3-trimethylbenzene µg/m3 0.58 0.00 9.39 0.00 5.89 1-ethynyl_2-methyl-benzene µg/m3 0.10 10.43 59.29 1.78 27.05 methylstyrene µg/m3 1.07 13.91 56.23 1.06 21.55 indane µg/m3 0.00 20.10 71.55 4.18 52.17 propynylbenzene_indene µg/m3 14.62 5005 16499 1794.98 21560 butylbenzene µg/m3 0.10 6.67 56.23 13.94 79.03 azulene µg/m3 0.88 17.20 115.71 45.88 219.03 dihydroxynaphthalene µg/m3 0.00 97.20 310.54 24.19 144.73 naphthalene µg/m3 177.97 5375 38353 11326.92 26068 benzothiophene µg/m3 1.17 5.02 0.00 5932.89 0.00 13_dihyrdro_2H_inden_2_one µg/m3 0.10 5.12 20.88 2.40 18.65 23_dihydro_1H_inden-2_one µg/m3 0.00 26.67 69.35 11.93 64.83 2-methyl-naphthalene µg/m3 2.05 8.31 168.68 110.54 482.71 1-methyl-naphthalene µg/m3 2.44 6.38 142.34 137.18 408.60 acenaphthene µg/m3 27.00 74.59 1473 1542.98 10597 2H_1_benzopyran_2_one µg/m3 0.00 105.02 131.42 22.41 195.65 acenaphthylene µg/m3 4.48 30.24 911.59 616.44 2411 dibenzofuran µg/m3 0.39 1.06 58.05 33.33 154.20 fluorene µg/m3 0.68 3.57 121.93 34.06 152.66

57
Sample # (Concentration of Species)
Analytical Method Detection Limit #1 Blank
#3 Rice Hulls
#4 Rice Hulls
#8 Wood Chips
#9 Wood Chips
(Sampling Method) Species Measured units Conc Conc Conc Conc Conc HPLC (DNPH Cartridges)
Formaldehyde ppbv 1.43 1.09 0.74 1.39 1.47 Acetaldehyde ppbv 3.03 47.49 109.04 199.73 367.86 Acetone ppbv 5.38 0 0 0 0 Acrolein ppbv 0 0 0 0 0 Propionaldehyde ppbv 0 0 0 0.41 0 Crotonaldehyde ppbv 0 0 0 0 0 2-Butanone (MEK) ppbv 5.71 1.68 1.78 1.09 0.87 Methacrolein ppbv 0 0.10 0.10 0 0 n-Butyraldehyde ppbv 0 0.81 7.89 5.96 7.98 Benzaldehyde ppbv 0 0.63 3.73 0 6.99 Valeraldehyde ppbv 0 0 0 0 0 Glyoxal ppbv 0 0.31 1.53 0.33 0.09 m-Tolualdehyde ppbv 0 0 0 0 0 Hexaldehyde ppbv 0 0.23 0.50 0.41 0.26
X-Ray Fluorescence (Teflon Filters)
Sodium (Na) µg/m3 27.3 41.44 0 4.43 14.56 19.67 Magnesium (Mg) µg/m3 8.3 1.41 0 0 3.29 4.18 Aluminum (Al) µg/m3 3.3 4.18 0.72 2.27 4.12 13.26 Silicon (Si) µg/m3 2.6 50.77 1.28 9.84 8.64 90.85 Phosphorus (P) µg/m3 0.9 24.52 0 0 0 0 Sulfur (S) µg/m3 0.4 371.44 4.30 24.52 69.31 100.64 Chlorine (Cl) µg/m3 0.4 70.90 50.53 120.61 28.22 43.44 Potassium (K) µg/m3 0.3 329.55 9.01 27.32 127.97 126.57 Calcium (Ca) µg/m3 0.5 0 1.38 6.37 31.69 85.80 Scandium (Sc) µg/m3 1.4 0 0.05 0 0 0 Titanium (Ti) µg/m3 0.3 0 0.03 0.21 44.51 51.60 Vanadium (V) µg/m3 0.1 14.68 0 0 0.32 0.62 Chromium (Cr) µg/m3 0.3 323.97 0.03 0.22 0.59 1.46 Manganese (Mn) µg/m3 0.6 0.30 0.05 0.56 12.82 17.16 Iron (Fe) µg/m3 0.6 5.17 1.06 3.51 14.98 51.29 Cobalt (Co) µg/m3 0.0 0 0 0 0 0 Nickel (Ni) µg/m3 0.1 2.06 0.03 0.30 3.96 7.65 Copper (Cu) µg/m3 0.3 1.79 0.42 0.89 31.41 104.05 Zinc (Zn) µg/m3 0.3 0.76 1.43 7.33 99.91 283.51 Gallium (Ga) µg/m3 0.9 0 0 0 0 0 Arsenic (As) µg/m3 0.1 18.98 0.02 0 0 0.70 Selenium (Se) µg/m3 0.2 0.25 0.01 0 0 0 Bromine (Br) µg/m3 0.3 3.76 1.71 5.99 2.25 5.88 Rubidium (Rb) µg/m3 0.2 1.88 0 0 0.00 0 Strontium (Sr) µg/m3 0.5 0.20 0.05 0.27 0.72 1.58 Yttrium (Y) µg/m3 0.3 0.02 0 0.02 0.13 0.23 Zirconium (Zr) µg/m3 0.7 0.09 0.02 0.24 0.15 0.67 Niobium (Nb) µg/m3 0.5 0 0 0 0.02 0 Molybdenum (Mo) µg/m3 0.5 532.93 0.01 0 0.10 1.24 Palladium (Pd) µg/m3 1.1 0 0 0 0 0 Silver (Ag) µg/m3 1.1 0 0 0 0 0 Cadmium (Cd) µg/m3 0.8 0 0.01 0 0 0 Indium (In) µg/m3 0.9 0 0.00 0 0 0 Tin (Sn) µg/m3 1.0 0 0 0 0 0 Antimony (Sb) µg/m3 1.5 0.47 0 0 20.10 25.20 Cesium (Cs) µg/m3 0.4 0 0.00 0 0 0 Barium (Ba) µg/m3 0.5 0 0 0 0 0 Lanthanum (La) µg/m3 0.3 0 0 0 0 0 Cerium (Ce) µg/m3 0.3 0 0 0 0 0 Samarium (Sm) µg/m3 0.6 0 0 0.03 0 0 Europium (Eu) µg/m3 1.0 0 0 0 0 0 Terbium (Tb) µg/m3 0.7 0 0 0 0 0 Hafnium (Hf) µg/m3 2.9 0.04 0.04 0 0 0 Tantalum (Ta) µg/m3 1.9 0 0 0.42 0 0 Tungsten (W) µg/m3 2.6 0 0 0.69 0 0 Iridium (Ir) µg/m3 0.9 0 0.03 0 0 0 Gold (Au) µg/m3 1.4 0 0.02 0.10 0 0 Mercury (Hg) µg/m3 0.7 0 0 0 0 0 Thallium (Tl) µg/m3 0.5 0.00 0.00 0.03 0.01 0.06 Lead (Pb) µg/m3 0.7 0.20 0.34 0.71 10.83 16.46 Uranium (U) µg/m3 1.2 0 0 0 0 0

58
APPENDIX IVb
4b. Laboratory Results – 2009 Field Campaign
Analytical Method (Sampling Method)
Species Measured
DF* units
#1 Blank #3 Rice Hulls
#3A Rice Hulls
#3B Rice Hulls
#5 Wood Chips
#6 Wood Chips
#7 Wood Chips
#8 Wood Chips
#10 Wood Chips before
Scrubber N/A N/A N/A N/A 4.6 N/A N/A N/A 5.0
Gravimetry (Teflon Filters)
Mass Concentration µg/m3 7.03 12.74 0.00 11.88 108.84
Thermal Optical (Quartz Filters)
Total Organic Carbon (OC) µg/m3 158.48 18.43 295.43 21.69 331.66 Total Elemental Carbon (EC) µg/m3 22.39 0.12 25.58 1.57 60.08 Total Carbon µg/m3 180.87 18.55 321.01 23.26 391.73 OC/EC Ratio 7.08 155.04 11.55 13.80 5.52
Ion Chromatography (Quartz Filter)
Chloride µg/m3 0.00 0.00 0.00 0.00 0.55 Nitrate µg/m3 1.87 0.87 5.32 0.55 4.84 Sulfate µg/m3 1.79 0.40 2.45 0.35 4.43 Ammonium (NH4
+) µg/m3 5.59 0.93 16.25 0.90 11.94 Sodium (Na+) µg/m3 0.80 0.54 0.00 0.00 0.00 Potassium (K+) µg/m3 4.82 0.67 1.38 0.12 5.33
Automated Colorimetry (Citric Acid Cellulose Impregnated Filters)
NH3 µg/m3 33.43 35.35 200.60 24.17 120.82
Ion Chromatography (K2CO3 Impregnated Cellulose Filters)
HCl µg/m3 N/A N/A N/A N/A N/A N/A N/A N/A N/A HNO3 µg/m3 15.27 2.62 31.97 3.08 91.02 SO2 µg/m3 H2SO4 0.00 5.74 0.00 0.00 1798.15
X-Ray Fluorescence (AgNO3 Impregnated Filter)
H2S µg/m3 0.00 0.53 0.00
GC/TCD & GC/FID (Canister Samples - Major Syngas Components)
H2 % 0.00 44.21 9.30 19.98 49.09 38.18 30.48 36.01 49.31 CO % 0.00 8.27 1.96 5.09 10.27 10.76 8.85 11.61 17.25 CO2 % 0.00 22.03 5.15 11.52 22.11 17.49 13.18 18.04 26.42 CH4 % 0.00 6.89 1.06 2.43 4.73 6.74 4.81 7.22 9.96
* DF = Dilution Factor

59
Analytical Method (Sampling Method)
Species Measured
DF* units
#1 Blank #3 Rice Hulls
#3A Rice Hulls
#3B Rice Hulls
#5 Wood Chips
#6 Wood Chips
#7 Wood Chips
#8 Wood Chips
#10 Wood Chips before
Scrubber N/A N/A N/A N/A 4.6 N/A N/A N/A 5.0
GC/MS/FID (Canister Samples)
Acetylene ppbv 0.00 179816.52 5235.24 8562.52 856278.71 853185.85 442435.16 827000.25 1566368.75 Ethene ppbv 0.00 618851.00 43255.88 74225.23 1964919.90 2434249.75 1458876.25 2877900.25 5802287.50 Ethane ppbv 0.00 53304.59 4524.99 9152.21 111525.18 119662.25 71527.15 157919.31 359199.68 propene ppbv 0.00 1365.35 178.55 235.94 8460.26 7678.27 518.39 9179.04 22275.23 propane ppbv 0.00 0.00 0.00 0.00 0.00 0.00 0.00 0.00 0.00 1,3-butadiene ppbv 0.00 367.12 0.00 326.92 2629.82 1674.96 756.15 1766.47 5616.16 1-butene ppbv 0.00 0.00 0.00 0.00 0.00 0.00 0.00 0.00 0.00 c-2-butene ppbv 0.00 0.00 0.00 0.00 0.00 0.00 0.00 0.00 0.00 isobutene ppbv 0.00 0.00 0.00 0.00 0.00 0.00 0.00 0.00 0.00 t-2-butene ppbv 0.00 0.00 0.00 0.00 0.00 0.00 0.00 0.00 0.00 n-butane ppbv 0.00 0.00 0.00 0.00 0.00 0.00 0.00 0.00 0.00 iso-butane ppbv 0.00 977.39 0.00 0.00 0.00 0.00 0.00 0.00 0.00 iso-pentane ppbv 0.00 0.00 0.00 0.00 0.00 0.00 0.00 0.00 0.00 n-pentane ppbv 0.00 0.00 0.00 0.00 0.00 0.00 0.00 0.00 0.00 1,2-butadiene ppbv 0.00 265.80 0.00 0.00 1388.97 1270.80 554.76 1238.03 2671.44 2,2,4-trimethylpentane ppbv 0.00 0.00 0.00 0.00 0.00 0.00 0.00 0.00 0.00 2-methyl-1-butene ppbv 0.00 0.00 0.00 0.00 0.00 0.00 0.00 0.00 0.00 1-pentene ppbv 0.00 0.00 0.00 0.00 0.00 0.00 0.00 0.00 0.00 isoprene ppbv 0.00 0.00 0.00 0.00 0.00 0.00 0.00 0.00 0.00 t-2-pentene ppbv 0.00 0.00 0.00 0.00 0.00 0.00 0.00 0.00 0.00 2-methyl-2-butene ppbv 0.00 0.00 0.00 0.00 0.00 0.00 0.00 0.00 0.00 c-2-pentene ppbv 0.00 0.00 0.00 0.00 0.00 0.00 0.00 0.00 0.00 2,2-dimethylbutane ppbv 0.00 0.00 0.00 0.00 0.00 0.00 0.00 0.00 0.00 cyclopentane ppbv 0.00 0.00 0.00 0.00 0.00 0.00 0.00 0.00 0.00 cyclopentene ppbv 0.00 0.00 0.00 0.00 0.00 19.69 0.00 14.87 0.00 2,3-dimethylbutane ppbv 0.00 0.00 0.00 0.00 0.00 0.00 26.73 0.00 0.00 2-methylpentane ppbv 0.00 0.00 0.00 0.00 0.00 0.00 0.00 0.00 0.00 2-methyl-1-pentene ppbv 0.00 0.00 0.00 0.00 0.00 0.00 0.00 0.00 0.00 3-methylpentane ppbv 0.00 0.00 0.00 0.00 0.00 0.00 0.00 0.00 0.00 t-2-hexene ppbv 0.00 0.00 0.00 0.00 0.00 0.00 0.00 0.00 0.00 n-hexane ppbv 0.00 0.00 0.00 0.00 0.00 0.00 0.00 0.00 0.00 c-2-hexene ppbv 0.00 0.00 0.00 0.00 0.00 0.00 0.00 0.00 0.00 1,3-hexadiene (trans) ppbv 0.00 0.00 0.00 0.00 0.00 0.00 0.00 0.00 0.00

60
Analytical Method (Sampling Method)
Species Measured
DF* units
#1 Blank #3 Rice Hulls
#3A Rice Hulls
#3B Rice Hulls
#5 Wood Chips
#6 Wood Chips
#7 Wood Chips
#8 Wood Chips
#10 Wood Chips before
Scrubber N/A N/A N/A N/A 4.6 N/A N/A N/A 5.0
GC/MS/FID (Canister Samples)
methylcyclopentane ppbv 0.00 0.00 0.00 0.00 0.00 0.00 0.00 0.00 0.00 2,4-dimethylpentane ppbv 0.00 0.00 0.00 0.00 0.00 0.00 0.00 0.00 0.00 benzene ppbv 132.83 802395.94 428961.25 422706.13 344970.53 948279.75 871753.88 1630000.00 5845000.00 cyclohexane ppbv 0.00 0.00 0.00 0.00 0.00 0.00 0.00 0.00 0.00 cyclohexene ppbv 0.00 0.00 0.00 0.00 0.00 0.00 0.00 0.00 0.00 2-methylhexane ppbv 0.00 0.00 0.00 0.00 0.00 0.00 0.00 0.00 0.00 2,3-dimethylpentane ppbv 0.00 0.00 0.00 0.00 0.00 0.00 0.00 0.00 0.00 1,3-dimethylcyclopentane (cis) ppbv 0.00 0.00 0.00 0.00 0.00 0.00 0.00 0.00 0.00 3-methylhexane ppbv 0.00 0.00 0.00 0.00 0.00 0.00 0.00 0.00 0.00 n-heptane ppbv 0.00 0.00 0.00 0.00 0.00 0.00 0.00 0.00 0.00 2,3-dimethyl-2-pentene ppbv 0.00 0.00 0.00 0.00 0.00 0.00 0.00 0.00 0.00 methylcyclohexane ppbv 0.00 0.00 0.00 0.00 0.00 0.00 0.00 0.00 0.00 2,3,4-trimethylpentane ppbv 0.00 0.00 0.00 0.00 0.00 0.00 0.00 0.00 0.00 2-methylheptane ppbv 0.00 0.00 0.00 0.00 0.00 0.00 0.00 0.00 0.00 4-methylheptane ppbv 0.00 0.00 0.00 0.00 0.00 0.00 0.00 0.00 0.00 3-methylheptane ppbv 0.00 0.00 0.00 0.00 0.00 0.00 0.00 0.00 0.00 n-octane ppbv 0.00 0.00 0.00 0.00 0.00 0.00 0.00 0.00 0.00 Toluene ppbv 0.00 43.04 137.60 150.58 102.82 194.41 214.25 663.22 3879.46 m&p-xylene ppbv 0.00 0.00 0.00 0.00 0.00 0.00 0.00 0.00 0.00 styrene ppbv 0.00 0.00 0.00 0.00 0.00 0.00 0.00 0.00 0.00 o-xylene ppbv 0.00 0.00 0.00 0.00 0.00 0.00 0.00 0.00 0.00 n-nonane ppbv 0.00 0.00 0.00 0.00 0.00 0.00 0.00 0.00 0.00 isopropylbenzene ppbv 0.00 0.00 0.00 0.00 0.00 0.00 0.00 0.00 0.00 3-ethyltoluene ppbv 0.00 0.00 0.00 0.00 0.00 0.00 0.00 0.00 0.00 n-propylbenzene ppbv 0.00 0.00 0.00 0.00 0.00 0.00 0.00 0.00 0.00 4-ethyltoluene ppbv 0.00 0.00 0.00 0.00 0.00 0.00 0.00 0.00 0.00 alpha-pinene ppbv 0.00 0.00 0.00 0.00 0.00 0.00 0.00 0.00 0.00 1,3,5-trimethylbenzene ppbv 0.00 0.00 0.00 0.00 0.00 0.00 0.00 0.00 0.00 o-ethyltoluene ppbv 0.00 0.00 0.00 0.00 0.00 0.00 0.00 0.00 0.00 1,2,4-trimethylbenzene+t-butylbenzene ppbv 0.00 0.00 0.00 0.00 0.00 0.00 0.00 0.00 0.00 n-decane ppbv 0.00 0.00 0.00 0.00 0.00 0.00 0.00 0.00 0.00 indan ppbv 0.00 0.00 0.00 0.00 0.00 0.00 0.00 0.00 0.00 1,2,3-trimethylbenzene ppbv 0.00 0.00 0.00 0.00 0.00 0.00 0.00 0.00 0.00

61
Analytical Method (Sampling Method)
Species Measured
DF* units
#1 Blank #3 Rice Hulls
#3A Rice Hulls
#3B Rice Hulls
#5 Wood Chips
#6 Wood Chips
#7 Wood Chips
#8 Wood Chips
#10 Wood Chips before
Scrubber N/A N/A N/A N/A 4.6 N/A N/A N/A 5.0
GC/MS/FID (Canister Samples)
1,3-diethylbenzene ppbv 0.00 0.00 0.00 0.00 0.00 0.00 0.00 0.00 0.00 1,4-diethylbenzene ppbv 0.00 0.00 0.00 0.00 0.00 0.00 0.00 0.00 0.00 n-butylbenzene ppbv 0.00 0.00 0.00 0.00 0.00 0.00 0.00 0.00 0.00 n-undecane ppbv 0.00 0.00 0.00 0.00 0.00 0.00 0.00 0.00 0.00 furan ppbv 0.00 9.34 12.98 5.22 54.45 9.82 20.74 7.25 120.94 2-methyl-furan ppbv 0.00 0.00 0.00 0.00 0.00 0.00 0.00 0.00 0.00 2-furfural ppbv 0.00 0.00 0.00 0.00 0.00 0.00 0.00 0.00 0.00 3-furfural ppbv 0.00 0.00 0.00 0.00 0.00 0.00 0.00 0.00 0.00 2,5-dimethyl-furan ppbv 0.00 0.00 0.00 0.00 0.00 0.00 0.00 0.00 0.00 2-ethyl-furan ppbv 0.00 0.00 0.00 0.00 0.00 0.00 0.00 0.00 0.00
GC/MS (Tenax Cartridges)
ethynylbenzene+m/p-xylene µg/m3 styrene µg/m3 0.95 20.73 43.34 9.85 50.04 4.06 27.98 51.94 4194.10 ethylbenzene µg/m3 1.05 2.18 4.79 0.82 6.41 0.43 1.99 4.26 238.31 Indene µg/m3 0.07 9.59 6.85 12.13 48.78 2.23 2.56 12.23 2254.24 naphthalene µg/m3 1.87 10.34 2.88 6.26 43.84 2.14 11.86 11.44 1804.68
HPLC (DNPH Cartridges)
Formaldehyde ppbv 0.37 0.94 0.39 0.72 1.75 0.72 0.44 0.78 2.11 Acetaldehyde ppbv 0.63 82.93 38.61 27.53 102.93 479.18 511.18 428.77 365.00 Acetone ppbv 4.58 25.10 5.68 5.42 4.44 5.18 6.17 3.55 3.26 Acrolein ppbv 0.00 0.98 0.00 0.00 1.74 0.62 2.03 1.83 0.00 Propionaldehyde ppbv 0.22 0.54 0.47 0.20 0.00 1.63 1.19 0.00 0.00 Crotonaldehyde ppbv 0.00 0.00 0.00 0.00 0.00 0.00 0.00 0.00 0.00 2-Butanone (MEK) ppbv 0.15 6.17 2.85 1.82 3.53 6.13 6.23 17.41 6.19 Methacrolein ppbv 0.00 0.00 0.00 0.00 3.40 2.32 1.16 72.71 14.96 n-Butyraldehyde ppbv 0.00 0.11 0.00 0.00 0.11 0.15 0.00 0.00 0.00 Benzaldehyde ppbv 0.00 0.49 0.00 0.17 7.25 2.91 2.47 8.10 9.32 Valeraldehyde ppbv 0.00 0.00 0.00 0.00 0.00 0.00 0.00 0.00 0.00 Glyoxal ppbv 0.00 0.00 0.00 0.00 0.00 0.00 0.00 0.00 0.00 m-Tolualdehyde ppbv 0.00 0.00 0.00 0.00 0.00 0.00 0.00 0.00 0.15 Hexaldehyde ppbv 0.00 0.42 0.44 0.00 0.93 0.00 0.00 1.09 2.01

62
Analytical Method (Sampling Method)
Species Measured
DF* units
#1 Blank #3 Rice Hulls
#3A Rice Hulls
#3B Rice Hulls
#5 Wood Chips
#6 Wood Chips
#7 Wood Chips
#8 Wood Chips
#10 Wood Chips before
Scrubber N/A N/A N/A N/A 4.6 N/A N/A N/A 5.0
X-Ray Fluorescence (Teflon Filters)
Sodium µg/m3 0.00 1.45 59.18 1.95 22.91 Magnesium (Mg) µg/m3 0.00 0.09 13.26 0.33 0.00 Aluminum (Al) µg/m3 3.72 0.87 10.12 0.18 6.73 Silicon (Si) µg/m3 0.02 0.12 2.82 0.02 0.16 Phosphorus (P) µg/m3 0.00 0.00 0.00 0.00 0.00 Sulfur (S) µg/m3 0.00 0.00 0.00 0.00 1.14 Chlorine (Cl) µg/m3 0.04 0.37 0.49 0.07 1.05 Potassium µg/m3 0.03 0.44 0.99 0.05 0.03 Calcium (Ca) µg/m3 0.00 0.04 1.22 0.06 0.00 Scandium (Sc) µg/m3 0.00 0.42 8.86 0.25 0.40 Titanium (Ti) µg/m3 0.16 0.00 0.11 0.06 0.00 Vanadium (V) µg/m3 0.06 0.00 0.00 0.00 0.00 Chromium (Cr) µg/m3 0.00 0.01 0.00 0.01 0.25 Manganese (Mn) µg/m3 0.00 0.03 0.00 0.00 0.15 Iron (Fe) µg/m3 0.00 0.01 0.00 0.08 0.08 Cobalt (Co) µg/m3 0.00 0.00 0.00 0.00 0.05 Nickel (Ni) µg/m3 0.00 0.01 0.00 0.00 0.00 Copper (Cu) µg/m3 0.00 0.00 0.05 0.01 0.12 Zinc (Zn) µg/m3 0.00 0.01 0.23 0.07 6.20 Gallium (Ga) µg/m3 0.02 0.05 0.00 0.00 0.00 Arsenic (As) µg/m3 0.00 0.00 0.00 0.00 0.00 Selenium (Se) µg/m3 0.00 0.00 0.00 0.00 0.00 Bromine (Br) µg/m3 0.16 0.00 0.22 0.03 0.00 Rubidium (Rb) µg/m3 0.00 0.00 0.00 0.00 0.61 Strontium (Sr) µg/m3 0.00 0.02 0.08 0.02 0.60 Yttrium (Y) µg/m3 0.13 0.00 0.00 0.00 0.35 Zirconium (Zr) µg/m3 0.00 0.00 0.00 0.00 0.00 Niobium (Nb) µg/m3 0.00 0.00 0.00 0.00 0.00 Molybdenum (Mo) µg/m3 0.00 0.00 0.00 0.00 0.00 Palladium (Pd) µg/m3 0.00 0.00 0.00 0.03 0.00 Silver (Ag) µg/m3 0.02 0.00 0.44 0.00 0.00 Cadmium (Cd) µg/m3 0.00 0.00 0.35 0.03 0.16 Indium (In) µg/m3 0.00 0.00 0.00 0.00 0.00

63
Analytical Method (Sampling Method)
Species Measured
DF* units
#1 Blank #3 Rice Hulls
#3A Rice Hulls
#3B Rice Hulls
#5 Wood Chips
#6 Wood Chips
#7 Wood Chips
#8 Wood Chips
#10 Wood Chips before
Scrubber N/A N/A N/A N/A 4.6 N/A N/A N/A 5.0
X-Ray Fluorescence (Teflon Filters)
Tin (Sn) µg/m3 0.00 0.00 0.28 0.00 0.00 Antimony (Sb) µg/m3 0.00 0.00 0.45 0.00 0.00 Cesium (Cs) µg/m3 0.00 0.00 0.00 0.00 0.00 Barium (Ba) µg/m3 0.00 0.40 0.00 0.00 0.00 Lanthanum (La) µg/m3 2.38 0.18 0.00 0.36 0.00 Cerium (Ce) µg/m3 0.00 0.03 0.00 0.00 0.00 Samarium (Sm) µg/m3 0.00 0.00 3.10 0.50 12.66 Europium (Eu) µg/m3 2.73 0.00 5.73 0.00 2.40 Terbium (Tb) µg/m3 0.00 0.00 0.00 0.42 0.00 Hafnium (Hf) µg/m3 0.65 0.00 2.93 0.00 1.54 Tantalum (Ta) µg/m3 0.00 0.00 0.79 0.08 0.16 Tungsten (W) µg/m3 0.00 0.00 0.00 0.00 2.04 Iridium (Ir) µg/m3 0.00 0.00 0.00 0.02 0.00 Gold (Au) µg/m3 0.00 0.07 0.00 0.02 0.00 Mercury (Hg) µg/m3 0.00 0.00 0.00 0.00 0.00 Thallium (Tl) µg/m3 0.00 0.00 0.00 0.00 0.31 Lead (Pb) µg/m3 0.02 0.00 0.87 0.01 0.08 Uranium (U) µg/m3 0.29 0.00 0.59 0.00 0.36