grid energy storage chemistries and technologies...jun 14, 2019 · •seamless integration...
TRANSCRIPT

Sandia National Laboratories is a multi-mission laboratory managed and operated by National Technology and Engineering Solutions of Sandia, LLC, a wholly
owned subsidiary of Honeywell International, Inc., for the U.S. Department of Energy’s National Nuclear Security Administration under contract DE-NA0003525SAND2019-6638 PE
VINCENT SPRENKLE – (PNNL)
SUMMER FERREIRA, SANDIA NATIONAL LABORATORIES
(SANDIA)
JUNE 14TH, 2019
Grid Energy Storage Chemistries and Technologies

2
Agenda
Brief Overview of DOE Office of Electricity (OE)
Energy Storage Program
Current State of Battery Chemistries and Technology
Introduction to Topic Areas for Consideration
2

3
Grid Scale Energy Storage Market is growing
3
2018
• 310 MW/777 MWh new storage deployments in US.1
Market Penetration
• Grid-Scale Battery Storage still < 0.1% of U.S. Generation Capacity
• EV’s < 1% of vehicles sold in U.S.
1) Wood Mackenzie P&R / ESA | U.S. energy storage monitor 2018 YIR and Q1 2019

4
Source: DOE Global Energy Storage Databasehttp://www.energystorageexchange.org/ Nov. 2017
Energy Storage Comparison
Globally
• 1.7 GW - Battery Energy Storage (BES)
• ~170 GW - Pumped Hydro Storage (PHS)
U.S.
• 0.33 GW BES
• 22.7 GW PHS
% of U.S. Generation Capacity
• 0.03% BES
• 2.2% BES + PHS
Grid Energy Storage deployments
(Operational as of Nov. 2017)
Li-ion78%
Flow5%
Na-metal12%
Pb-acid5%
Other0%
0.0
1.0
2.0
3.0
4.0
5.0
Li-ion Flow Na-metal Pb-acid
Average Duration Discharge (hrs)

5
Mapping of Grid Scale Energy Storage Deployments from DOE Energy
Storage Database.
5

6
OE Energy Storage Program
Objectives
Cost Competitive Technology
• Materials and chemistry
• Systems and manufacturing
• Cost reduction
• Expanded applications
Reliability & Safety
• Lab testing
• Codes and standards
• Expected lifetime
• R&D Improvements
• Policy analysis
• Valuation methods
• Resolution of benefitsRegulatory Environment
Industry Acceptance through Demonstrations
• Stakeholder engagement
• Proving success
• Seamless integration
• Consumer benefits

7
OE Energy Storage Program Engagement Map

8
Where Energy Storage Technologies Fit In

9
Energy Storage Technologies
9
1
10
100
1000
10000
100000
1000000
0.01 0.1 1 10
Dis
char
ge P
ow
er
Discharge Duration (hrs)
1 GW
1 MW
1 kW
Sup
erca
p
TVA PHS1.6 GW22 hrs
Battery Energy Storage
CAESFl
ywh
eels
100

10
Storage Technology and Application Markets
Source: DOE/EPRI Electricity Storage Handbook in Collaboration with NRECA, 2013

11
Growth in Battery Energy Storage over Past Decade
However
Grid-Scale Energy Storage still < 0.1% of U.S. Generation Capacity
EV’s < 1% of vehicles sold in U.S.
Source: GTM Research / ESA | U.S. Energy Storage Monitor Q2 2018
KEYFront of Meter
Non -
Residential
Residential
Current Grid Storage Deployments

12
Increased adoption a result of Falling Lithium
Ion Battery Prices
12

13
Battery Technologies
13

14
Li-ion Batteries
Advantages
High energy density
Better cycle life than Lead - Acid
Decreasing costs – Stationary on coattails
of increasing EV.
Ubiquitous – Multiple vendors
Fast response
Higher efficiency* (Parasitic loads like
HVAC often not included)
Applications
Traditionally a power battery but cost
decreases and other factors allow them to
used in energy applications SCE Tehachapi plant, 8MW - 32MWh.
SCE/Tesla 20MW -80MWh Mira Loma Battery Facility

15
Li-ion:
Basic Chemistry
Source: Z. Yang JOM September 2010, Volume 62, Issue 9, pp 14-23

16
Li-ion:
Basic Chemistries
ChemistrySpecific Capacity
Potentialvs. Li+/Li
LiCoO2 273 / 160 3.9
LiNiO2 274 / 180 3.6
LiNixCoyMnzO2
~ 270 / 150~180
3.8
LiNixCoyAlzO2 ~ 250 / 180 3.7
LiMn2O4 148 / 130 4.1
LiMn1.5Ni0.5O4 146 / 130 4.7
LiFePO4 170 / 160 3.45
LiMnPO4
171 / 80~150
4.1
LiNiPO4 166 / - 5.1
LiCoPO4
166 / 60~130
4.8
Chemistry Specific Capacity Potentialvs. Li+/Li
Soft Carbon < 700 < 1
Hard Carbon 600 < 1
Li4Ti5O12 175 / 170 1.55
TiO2 168 / 168 1.85
SnO2 782 / 780 < 0.5
Sn 993 / 990 < 0.5
Si 4198 / < 3500 0.5 ~ 1
Cathodes
Anodes
NMC – LG/Volt
LFP
LTO
NCA - Tesla
iphone

17
Energy Density of Li-ion Chemistries
1. Curtesy courtesy of Battery University

18
Tesla Battery Pack
85 kWh
http://insideevs.com/look-inside-a-tesla-model-s-battery-pac/
7,104 cells
http://club.dx.com/forums/forums.dx/threadid.457734
18650 cell format used in 85 kWh Tesla battery
A system like 20MW -80MWh Mira Loma Battery Storage Facility would require at least 6.7 million of these 18650 cells
Why this form factor?

19
Li-ion Batteries: SOA
For grid applications
Costs coming down in LIB. However, BOM constitute ~70-80% of cell cost in a LiB.
Need lower manufacturing costs, currently in the $300-400M range for a 1GWh of
manufacturing capacity
Grid batteries in addition to low BOM and cost of manufacturing
Excess capacity in the large format automotive batteries driving the market for
applications in the grid
However
Safety and reliability continues to be significant concerns
Power control and safety adds significant cost to Li ion storage
Packaging and thermal management add significant costs
Deep discharge cycle life issues for energy applications (1000 cycles for automotive)
Take Away: Need to manage the battery to limit the DoD, charge, ambient temperature.

20
Lead-Acid:
Basic Chemistry and IssuesOverall Reaction
• Pb(s) + PbO2(s) + 2H2SO4(aq) → 2PbSO4(s) + 2H2O(l)
• OCV ~ 2.0 V
Flooded lead-acid
• Requires continuous maintenance
• Most common
Sealed lead-acid
• Gel and Absorbed Glass Mat (AGM)
• More temperature dependent
Advantages/Drawbacks
• Low cost/Ubiquitous
• Limited life time (5~15 yrs)/cycle life (500~1000 cycles) and degradation w/ deep discharge (>50% DoD)
• New Pb/C systems > 5,000 cycles.
• Low specific energy (30-50 Wh/kg)
• Overcharging leads to H2 evolution
• Sulfation from prolonged storage
http://www.ultrabattery.com/technology/ultrabattery-technology/

21
Advanced Lead Acid:
Testing at Sandia National Laboratories
#
http://www.sandia.gov/batterytesting/docs/LifeCycleTestingEES.pdf
Take Away: Lower energy density than lithium ion and shorter cycle life

22
Sodium Metal Batteries (NaS, NaNiCl2..)
Two primary Sodium chemistriesNaS mature grid technology developed in 1960’s
High energy density -Long discharge cycles
Fast response- Long life
High operating temperature (250-300C)
530 MW/3700MWh installed primarily in Japan (NGK)
NaNiCl2, (Zebra)mature, more stable than NaS. Developed in South Africa in 1980’s
FIAMM in limited production
Large cells and stable chemistry
Lower temperature than NaS
Cells loaded in discharge mode
Addition of NaAlCl4 leads to a closed circuit on failure
High efficiency, low discharge
Long warm up time (16 hr)
Neither NaS nor NaNiCl2 are at high volumes of production for economies of scale
NGK 34MW - 245 MWh NaS, Rokkasho, Japan
FIAMM Sonick Na-NiCl2 Battery Module

23
Na-Metal Batteries
Basic Chemistry
Batteries consisting of molten sodium anode and β"-Al2O3 solid electrolyte (BASE).
Use of low-cost, abundant sodium low cost
High specific energy density (120~240 Wh/kg)
Good specific power (150-230 W/kg)
Good candidate for energy applications (4-6 hrsdischarge)
Operated at relatively high temperature (300~350C)
Sodium-sulfur (Na-S) battery
2Na + xS Na2Sx (x = 3~5)
E = 2.08~1.78 V at 350C
Sodium-nickel chloride (Zebra) battery
2Na + NiCl2 2NaCl + Ni
E = 2.58V at 300C
Use of catholyte (NaAlCl4)

24
Na-Metal Batteries
Advantages/Issues.
Temperature
Less over-temperature concerns, typical operating window 200-350C. additional
heaters needed when not in use.
At < 98°C, Na metal freezes out, degree of distortion to cell dictated by SOC of
battery (amount of Na in anode)
Charging/Discharging Limitations
Safety Concerns
Solid ceramic electrolyte keeps reactive elements from contact. Failure in electrolyte can lead to exothermic reaction (Na-S)
Take Away: Limited commercially availability for deployment and requires constant energy input to maintain temperature

25
Flow Batteries
Flow Battery Energy Storage
Long cycle life
Power/Energy decomposition
Lower efficiency
Applications
Ramping
Peak Shaving
Time Shifting
Power quality
Frequency regulation
Challenges
Developing technology
Complicated design
Lower energy density
UET - AVISTA, Pullman, WA. 1.0MW – 3.2 MWh.
Vionx Vanadium Redox Flow battery, 65kW - 390kWh

26
Key Aspects
Power and Energy are separate enabling greater flexibility and safety.
Suitable for wide range of applications 10’s MW to ~ 5 kw
Wide range of chemistries available.
Low energy density ~ 30 Whr/kg
Lower energy efficiency
Redox Flow Battery:
Basic Chemistry

27
Flow Batteries - Future
The flexibility of redox flow battery technology offers the potential to capture
multiple value streams from a single storage device.
Current research has demonstrated high power conditions can be achieved with
minimal impact in stack efficiency.
Next generation RFB technology based on Aqueous Soluble Organics (ASO)
being developed to replace vanadium species.
Continued cost reductions in Li-ion technology will be driven by EV/PHEV
deployments. RFB may be able to achieve similar cost targets at ~ 100X lower
production volume.
Take Away: Flow batteries are potentially well suited to grid storage but not as mature as lithium ion

28
Non-Aqueous Flow Chemistries
• Wider voltage window
• Higher charge cycle efficiency
• Decreased temperature sensitivity
• Increased cycle life
• Favorable cost projections
Aqueous vanadium (+5) speciation chemistry is complex!
Major Challenge: Getting high concentrations of redox active species.

29
High Energy Density Li and Metal Air Batteries
All metal air batteries (Li-air, Zn-air) have the potential to deliver high energy
densities at low cost, challenges with recharging have so far precluded
commercialization of the technology
Lot of startup activity in Metal-Air batteries
Technology not mature, decade or more away
Potential fundamental problems
Li-Air combines difficulties of air and lithium electrodes
Breakthroughs needed in cheap catalysts, more stable and conductive ceramic
separators
Developing a robust air electrode is a challenge, need major breakthroughs
Li-S suffers from major problems of self discharge and poor life
breakthroughs needed for life of Li electrode, low cost separator
Take Away: Looking for operational data to evaluate claims.

30
Rechargeable Alkaline Batteries
Primary Chemistries
NiMH
Ni-Fe
Zn-Ni
Zn-MnO2
For low cost grid storage applications, Zn-MnO2 has compelling
attributes

31
History of Rechargeable Zn-MnO2 Alkaline
Batteries
Long history of research on making Zn-
MnO2 rechargeable.
Several commercial products based on
cylindrical formats (Rayovac, BTI).
All focused on cylindrical designs for
consumer markets.
J. Daniel-Ivad and K. Kordesch, “Rechargeable Alkaline Manganese Technology: Past-Present-Future,” ECS Annual Meeting, May 12-17, 2002
Cylindrical cells
No flexibility to change criticalparameters.
• Traditionally primary batteries• Lowest bill of materials costs and
manufacturing capital expenses• Established supply chain for high volume • Readily be produced in larger form
factors for grid applications• Do not have the temperature limitations
of Li-ion/Pb-acid• Are inherently safer, e.g. are EPA certified
for landfill disposal. Reversibility of Zn/MnO2 has been
challenging
Take Away: Low cost and robust to temperature but cycle life needs a breakthrough to be viable.

32
Super Capacitors
Capacitor Energy Storage
Very long life
Highly reversible and fast discharge, low losses
Applications
Power quality
Frequency regulation
Regenerative braking (vehicles)
Challenges
CostUltra capacitor module, designed for vehicle applications (e.g., buses, trains)

33
Battery Technologies
Mature Technologies
World Wide Capacity (GWh/y)
Cost and Performance Improvements
Key Challenges for Energy Storage
Major Suppliers
Lead Acid Batteries (LAB)
300 2%/year ((30 year data).$150/kWh
Cycle life. Advanced lead acid cycle life on par with EV grade LIB
JCI, GS Yuesa, EastPenn, EnerSys, Exide, Hagen, Amara Raja
Lithium Ion Batteries (LIB)
50 8%/year (20 year data). Cell level price reaching $200/kWh
Cycle life for deep discharge. Safety. Thermal management
Panasonic, Samsung, LG Chem, BYD, GS Yuesa (Nissan, Honda JVS), Lishen, JCI, A123, Toshiba. EV Batteries: Converging to NMC chemistry
Emerging Technologies
NaS and NaNiCl 300 MWh No economies of scale
High temperaturechemistry. Safely, Cost
NGK, GE, FIAMM
Flow Batteries <200 MWh Not fully mature. Potential for lower cost. $400/kWh. Reach $270/kWh
Not mature. Has not reached manufacturing scale.
Sumitomo, UET, Rongke Power, ZBB, Gildenmeister.Only Sumitomo provides 18 yr. warranty
Alkaline chemistries(Na, Zn-MnO2,..)
<100 MWh Not fully mature.Lowest cost BOM
Has not reached manufacturing scale.
Aquion (Na), UEP (Zn-MnO2), Fluidic Energy (Zn-air)

34
Cost Trends

35
Global Production Volumes
Lead Acid Battery business continues to be highly profitableLi-ion struggling with low factory utilization rates of ~10-20%
Source: Avicenne (2015), DOE

36
Manufacturing Capex and Starting Materials
Capex for GWh/yr production capacity
Lead acid: $50-60M
LIB: $300-400M
For lead acid and Li-ion, BOM is 80-85% of the cell cost
Large format LIB: BOM $180-200/KWh
For flow batteries, electrolyte cost ~30-40% overall cost
For comparison, primary alkaline batteries: $18-20/KWh
Source: Roland Berger, 2013

37
Large Format LIB Manufacturing
Capex intensive $300-400M /GWh capacity additionContinued consolidation in the Automotive Li Battery businessExcess capacity driving the need for applications beyond EVs
Source: D. Chang, et al, Automotive Li-ion Battery (LIB) Supply Chain andU.S. Competitive Considerations, NREL/PR-‐6A50-‐63354, June 2015

38
Lithium Ion Battery Prices
38
2018
~$200/kWh Pack
$400-$450/kWh
system

39
Cell price not only driver for further cost reduction.
39
Cell
Pack
X 1.4
System
X 2.0
Installed
X 1.3
$80/kWh cell
$~300/kWh installed

40
Future Cost Reduction requires addressing the Entire Suite
of Barriers for Continued Deployment of Energy Storage
Safety and Reliability Industrial
Acceptance
Regulatory Support
Redox Flow Sodium
Cost Competitive Technologies
Zn-MnO2 Cell
Pack
X 1.4
System
X 2.0
Installed
X 1.3

41
Battery to an Energy Storage systemElements of an Energy Storage System
Storage
• Storage device
• Battery Management & Protection (BMS)
• Racking
• $/KWh
• Efficiency
• Cycle life
Balance of Plant
• Housing
• Wiring
• Climate control
• Fire protection
• Permits
• $
Power Control System (PCS)
• Bi-directional Inverter
• Switchgear
• Transformer
• Interconnection
• $/KW
Energy management System (EMS)
• Charge / Discharge
• Load Management
• Ramp rate control
• Grid Stability
• Monitoring
• $
• DER control
• Synchronization
• Islanding
• Microgrid• $
Site Management System (SMS)
Take Away: All in can increase cost by 2-4x

42
Energy Storage Systems
The process of making batteries into energy storage requires a significant level
of systems integration including packaging, thermal management systems,
power electronics and power conversion systems, and control electronics.
System and engineering aspects represent a significant cost and component, and
system-level integration continues to present significant opportunities for
further research.

43
Energy Storage Safety and Reliability

44
Safety-Related Issues
ESS ‘product’ configuration and how safety validation is addressed
New versus existing systems and new versus existing building/facility
applications
Siting (location, loads, protection, egress/access, maximum quantities of
chemicals, separation, etc.)
Ventilation, thermal management, exhausts (when necessary, flow rates, etc.)
Interconnection with other systems (electrical, any non-electrical sources)
Fire protection (detection, suppression, containment, smoke removal, etc.)
Containment of fluids (from the ESS and from incident response)
Signage

45
Improving Storage Safety
Development of
Inherently Safe Cells
• Safer cell chemistries
• Non-flammable electrolytes
• Shutdown separators
• Non-toxic battery materials
• Inherent overcharge protection
Safety Devices and
Systems
• Cell-based safety devices
• current interrupt devices
• positive T coefficient
• Protection circuit module
• Battery management system
• Charging systems designed
Effective Response to
Off-Normal Events
• Suppressants
• Containment
• Advanced monitoring and controls
46
Safety through Codes and Standards
Many ESS safety related issues are identical or similar to those associated
with other technologies
Some safety issues are unique to energy storage in general and others
only to a particular energy storage technology
Current codes and standards provide a basis for documenting and
validating system safety
prescriptively
through alternative methods and materials criteria
Codes and standards are being updated and new ones developed
to address gaps between ESS technology/applications and criteria
needed to foster initial and ongoing safety

47
SNL & PNNL Protocol for Evaluation of ES Systems
Companies looking for an accurate
method to gauge how well large
batteries and other grid-scale energy
storage systems work now have a
new set of evaluation guidelines,
called the Energy Storage
Performance Protocol, at their
disposal. The guidelines currently
evaluate three energy storage
performance uses: Peak shaving, Frequency Regulation, and
Islanded Microgrids
Additional Lab Protocols:
• Duty Cycle for ESS Firming
• Duty Cycle for PV Smoothing

48
PNNL Documents for Evaluation of ES Systems

49
SNL Documents for Evaluation of ES Systems

50
Energy Storage Applications and Economics

51
Energy Storage Applications
Energy storage application time scale
“Energy” applications – slower times scale, large amounts of energy
“Power” applications – faster time scale, real-time control of the electric grid

52
Energy Storage Services (Value Streams)
Source: DOE/EPRI Electricity Storage Handbook in Collaboration with NRECA, 2013J. Eyer and G. Corey, “Energy Storage for the Electricity Grid:Benefits and Market Potential Assessment Guide”http://www.sandia.gov/ess/publications/SAND2010-0815.pdf

53
ES Policy and Market Implications (for the future)
The Federal Energy Regulatory Commission (FERC), which oversees U.S. energy markets, is in the midst of re-evaluating several policies that could open up more of a market for storage.
FERC order 755 and FERC order 784: “pay-for-performance”More fairly compensates “fast responding” systems (e.g., storage)
Market redesign for frequency regulation compensationSeparate signals for “fast” devices
Mileage payment in addition to capacity payment
Currently, California and the regional grid PJM Interconnection (excluding New Jersey) together account for 92 percent of U.S. energy storage deployments.
California energy storage mandate (California Public Utilities Commission) 10/17/20131.3 GW by 2020
More Energy Storage to come – Non-Fossil Generation by year ????
There's a short-term frequency regulation market in PJM and incentives for self-generation in California.
The storage industry is working to encourage FERC to apply changes such as these in services and benefits more broadly.
Reference: Julian Specter, “The Year Ahead for Energy Storage Policy”, in Greentech Media; July 2016.

54
Why is Storage Valuation Difficult?
Location/Jurisdiction
Market area, e.g., California ISO
Vertically integrated utility, e.g., PNM
Transmission and distribution deferral is very location specific
Many applications require a combination of technical and financial analysis
Dynamic simulations (requires an accurate system model)
Production cost modeling (requires an accurate system model)
Difficult to break out current cost of services, especially for vertically integrated utilities
Identifying alternatives can be difficult
Many storage technologies are not “off-the-shelf ”, proven technology (e.g., O&M costs, warranty????)
Storage is expensive

55
An Example
Energy Storage Value Streams – Renewable Firming
Renewable firming
Duck curve (CA is starting to be concerned)
CA “duck” curve
Solar variability
For vertically integrated utilities – increased regulating and spinning reserves. In market areas, adding ramping products.
56
Energy Storage Applications and Economics:
Take Aways
The grid needs energy storage – right now there are several barriers
Storage is expensive
Electricity markets/utilities do not properly allocate payments/costs for services
provided
Voltage support
Inertia
Renewable integration
Reliability
The future ….
Greater penetration of renewables – storage becomes essential;
Higher energy prices – storage starts looking better
Lower technology costs – storage starts looking better
Efficient market design – helps pay for storage costs
Potentially large market

57
Energy Storage Optimization Tool

58
Energy price ($/MWh)
Arbitrage only
Arbitrage + Balancing
Arbitrage + Balancing + T&D deferral
Pow
er o
utp
ut
(MW
)
Arbitrage + Balancing + T&D deferral + volt/var
Bundling Services: how to do it optimally?
59
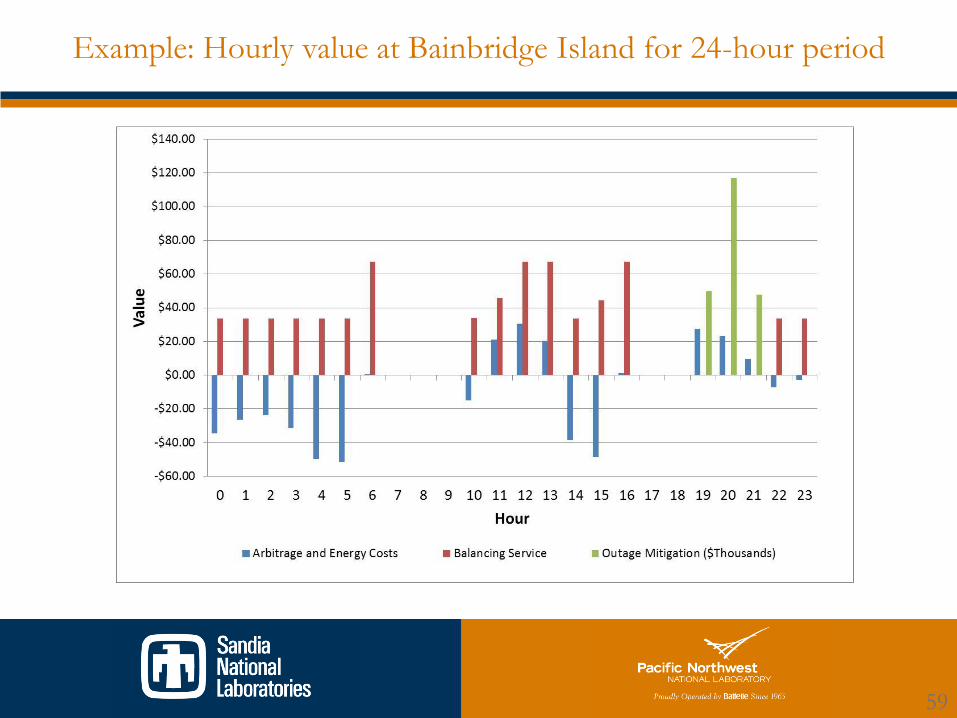
Example: Hourly value at Bainbridge Island for 24-hour period

60
Summary of Results (NPV benefits and revenue requirements over 20-
year time horizon) – Bainbridge Island
Random Outages – Mid-C Capacity
Value
Projected Outages – Mid-C Capacity
Value
Projected Outages – Peaker-Driven Capacity Value
Random Outages – Peaker-Driven Capacity Value
Do You notice the biggest contributor?

61
WA CEF Battery Testing Began with Comprehensive
Test Plan and Data Requirements
Baseline tests
Stored energy capacity
Response time and ramp rate
Internal resistance
Peak shaving
Frequency regulation
Use-case based duty cycles specific to each
utility and battery system; detailed duty cycle
tables in appendices
Critical and optional AC- and DC-side data
requirements specified by time increments
Detailed performance metrics
61

62
Washington CEF Matrix for Testing Program
Use Case and application as described in PNNL Catalog
Avista PSE Sno – MESA1
Sno – MESA2
Sno - Controls Integration
UC1: Energy Shifting
Energy shifting from peak to off-peak on a daily basis Y Y Y Y
System capacity to meet adequacy requirements Y Y Y Y
UC2: Provide Grid Flexibility
Regulation services Y Y Y*
Load following services Y Y Y*
Real-world flexibility operation Y Y Y*
UC3: Improving Distribution Systems Efficiency
Volt/Var control with local and/or remote information
Y Y Y
Load-shaping service Y Y Y Y
Deferment of distribution system upgrade Y Y
UC4: Outage Management of Critical Loads Y
UC5: Enhanced Voltage Control
Volt/Var control with local and/or remote information and during enhanced CVR events
Y
UC6: Grid-connected and islanded micro-grid operations
Black Start operation Y
Micro-grid operation while grid-connected Y
Micro-grid operation in islanded mode Y
UC7: Optimal Utilization of Energy Storage Y Y Y

63
Non-Linear Battery Model Summary
Model allows estimation of state of charge
(SOC) during operation taking into account
Operating mode
Power
SOC
Temperature
Model has been validated with data
Allows calculation of one way efficiency
from rate of change of SOC
Actual battery performance can be
anticipated, thus providing a high degree of
flexibility to the BESS owner/operator
Self-learning model applicable to energy
type of storage system
Model will be fine tuned as more data are
gathered.6
3

64
Non-Linear Battery Model Used to Enhance Arbitrage Value Estimated for SnoPUD
SnoPUD MESA 2UET 2 MW/8 MWh V/V Flow
Annual benefits in energy arbitrage
50% more arbitrage revenue possible for
SnoPUD when optimized using self-
learning non-linear battery model
Battery characterization based on data
collected from Avista-operated UET
battery deployed in Pullman, WA.
64

65
Acknowledgements
This work was supported by
US DOE Office of Electricity Delivery and Energy Reliability.
We thank Dr. Imre Gyuk, Manger of the DOE Energy Storage Program.
Many thanks to the Grid Energy Storage teams at Sandia, PNNL and numerous
collaborative partners at universities and the industry.