grenada labour market needs assessment
TRANSCRIPT

ERASMUS UNIVERSITY ROTTERDAM
Grenada Labour Market Needs Assessment
Final Report – May 2014
Jaap de Koning
Niek de Jong

2

3
Contents
Executive summary ....................................................................................................................... 6
1. Introduction .......................................................................................................................... 8
2. Trends in the labour market................................................................................................ 10
2.1 Labour Force ................................................................................................................ 10
2.2 Employment ................................................................................................................ 10
2.3 Unemployment ........................................................................................................... 14
3. Labour market projections .................................................................................................. 16
3.1 Aims and methodology ............................................................................................... 16
3.2 Employment projections ............................................................................................. 16
3.2.1 Step 1: projecting macro GDP ............................................................................. 16
3.2.2 Step 2: projecting GDP broken down by sector ................................................... 17
3.2.3 Step 3: projecting employment by industry ......................................................... 19
3.2.4 Step 4: projecting employment by occupation .................................................... 20
3.2.5 Step 5: projecting employment by education ...................................................... 21
3.3 Confrontation with available supply of labour ........................................................... 23
3.3.1 Employment and non-employment rate ................................................................. 23
3.3.2 Unemployment ....................................................................................................... 24
3.4 Final remarks ............................................................................................................... 26
4 Analysis of the 2013 Employers Survey .............................................................................. 28
4.1 Introduction ................................................................................................................ 28
4.2 Employment ................................................................................................................ 28
4.3 Performance and employability of the workforce ...................................................... 33
4.4 Vacancies and job mobility.......................................................................................... 35
4.5 Expected turnover, vacancies and shortages .............................................................. 38
4.6 Employability of school leavers and unemployed people .......................................... 39

4
4.7 Some conclusions ........................................................................................................ 41
5 Possible Skill Needs and Skills Development ...................................................................... 42
5.1 Introduction ................................................................................................................ 42
5.2 Improving the connection between education and the labour market and the
employability of workers......................................................................................................... 43
5.3 Improving the employment situation ......................................................................... 46
5.4 Improving the data situation ....................................................................................... 49
Annex I: Terms of Reference ....................................................................................................... 54
Annex II: List of persons met ....................................................................................................... 59
Annex III: Methodology used for the projections ....................................................................... 60
A3.1 Projecting GDP by industry ......................................................................................... 60
A3.2 Projecting employment by industry ............................................................................ 61
A3.3 Projecting employment by occupation and level of education .................................. 62
Annex IV: Education and training in Grenada ............................................................................. 64
Annex V: Questionnaire for the 2013 Employer’s Survey ........................................................... 71

5
Preface
This study was carried out on behalf of the Government of Grenada, Ministry of Education,
with financial support from the World Bank. The report was written by Jaap de Koning (SEOR)
and Niek de Jong (ERBS), both affiliated with the Erasmus University Rotterdam in the
Netherlands.
For the implementation of the 2013 Employers´ Survey, support was provided by Mr. Jude
Bernard (training of enumerators and management of the survey data collection) and Ms.
Étoile Pinder (assistance in design of the survey questionnaire, training of enumerators and
survey data base construction).
On behalf of the Client, the study was supervised by Mr. Lincoln Morgan, CEO of the National
Training Agency.
We are thankful to everyone who has contributed to the success of this study.

6
Executive summary
The purpose of this study was fourfold:
- Give a description of the structure and trends regarding the labour market of Grenada;
- Make labour market projections, providing information on the future labour market and
on skill mismatch in particular;
- Implement and analyse a survey among employers;
- Give recommendations for policies to improve the labour market situation and for
improvements regarding the labour market information system.
In 2011, the most recent year for which we had information, one quarter of the labour force
was unemployed. Among young people the unemployment rate was almost twice the general
unemployment rate. In such a situation vacancies tend to be filled relatively easily. The 2013
employers´ survey that was held within the framework of this study confirms this. In 2013 only
a small minority of the employers had problems in finding personnel. Furthermore, a large
majority of the firms does not expect any problem in filling their vacancies until 2015. This is in
agreement with our labour market projections, which show that the unemployment rate will
stay almost the same in until 2014. As of 2015, we expect a gradual and limited reduction in
the unemployment rate owing to the recovery in the US economy.
Although employers do not have many problems in finding personnel, they do signal
qualitative shortcomings in the labour force. Regarding their own workforce they indicate that
about 15 per cent is not performing adequately. Furthermore, according to employers most
unemployed persons and most young people leaving school lack sufficient skills. Lack of soft
skills (self-initiative, communication, work attitude) and lack of basic skills (basic numeracy and
literacy are mentioned most often. Employers also signal future problems in hiring people for
some specific occupations, such as managers.
The problems encountered in the labour market are especially challenging the educational
system. In the present situation, education is too much focused on academic skills and it does
not provide children with the type of skills they need in the labour market. Education can
stimulate self-initiative and communication skills, but that requires different educational
methods rather than different content. In many countries, the educational system is more and
more based on the idea that children need to explore and find out things by themselves. This is
a breakaway from the old system where the teacher was telling how things are and children
were listening passively. Such a system takes away self-initiative rather than stimulating it. One
cannot teach self-initiative; it is a matter of learning by doing.
The educational system has to provide the foundation for a successful work life. However,
education has a much wider significance and is beneficial to other life spheres as well, for
example to health and social participation. For a successful work life, skills must be updated

7
regularly. This is first of all the responsibility of employers and workers, although the
government can play an important role too, particularly regarding disadvantaged groups.

8
1. Introduction
The labour market of Grenada is currently characterized by a high rate of unemployment,
especially among younger persons, combined with particular skills gaps and shortages. It has
been observed that there is a “disconnect” between labour demand and labour supply in
Grenada.
The needs of employers are not sufficiently taken into account, which is partly related to
weaknesses in the education system, already at the level of primary education. Education in
Grenada is considered to be too academic. Young people do not learn to apply what they
learn. The TVET component is weakly developed.
However, the high rate of unemployment can only very partially be attributed to these points.
There is a mismatch between skill needs of employers and the output of the education and
training system. But there is also a lack of jobs.
The demand for labour in Grenada, but also elsewhere in the Eastern Caribbean, is likely to
have slowed down or even dropped as a result of the economic recession that started in 2009.
Table 1.1 shows that economic growth in Grenada was in most periods largely in line with the
regional average in the Eastern Caribbean. The economy contracted in 2009-2010. This was
followed by a modest recovery in 2011, while several other countries in the region still
observed negative growth. However, there is not yet a return to high growth rates observed in
Grenada in most years prior to the recession.1
Table 1.1: Real GDP (Average annual percentage growth rates)
1991–2000 2001–2008 2009–2010 2011
Antigua and Barbuda 3.5 4.5 -9.6 -0.5
Anguilla 4.0 7.6 -11.1 -2.1
Dominica 2.1 2.3 -0.2 0.5
Grenada 4.6 3.4 -3.5 1.1
Montserrat -9.0 2.5 -2.3 3.9
St. Kitts and Nevis 4.4 3.6 -4.1 0.0
Saint Lucia 2.4 2.1 1.1 0.2
St. Vincent and the Grenadines 3.1 3.9 -2.1 -0.4
Eastern Caribbean 3.0 3.5 -4.1 0.0 Source: IMF (2013). The Eastern Caribbean Economic and Currency Union Macroeconomics and financial Systems, Table 3.1. Washington D.C.: International Monetary Fund, April 2013.
1 Estimated real economic growth in Grenada was negative in 2012 (http://www.eccb-
centralbank.org/Statistics/).

9
In an effort to restore economic growth, the Government of Grenada identified sectors and
subsectors with potential for growth and employment generation. As noted in GNTA (2012:4),
the OECS (Grenada) Skills for Inclusive Growth Project is “designed to increase the
employability of unemployed youths in the country through skills training that is demand
driven.”2 As part of the Project, also a Labour Market Needs Assessment was to be made.
For specific occupations within the identified key (sub-) sectors in particular, the government
of Grenada would like to know what skills would likely be required in the next five years or so.
In that context a skill needs assessment is to be made. That assessment will help the
government to address the above-mentioned mismatch in the labour market.
According to the Terms of Reference included in Annex I, the general objective of the
assignment is “to conduct a Labour Market Needs Assessment in Grenada, which would
identify the skills gaps, in the anticipated sectors for economic growth, which include
agriculture, agro processing, health and wellness renewable energy, ICT and marine along with
the targeted sectors, and the specific occupational streams within each sector, for the period
2013-2018.”
The remainder of this report is structured as follows. Chapter 2 contains a descriptive analysis
of some labour market trends. Chapter 3 presents labour market projections until 2018.
Chapter 4 presents the results of the analysis of the 2013 Employer’ Survey in Grenada. The
final chapter summarises some main findings of the study and gives suggestions for policies in
three areas: the connection between education and the labour market and the employability
of workers; the employment situation; and, labour market information. The annexes contain
additional information.
2 GNTA (2012). Annual Report 2011. St. George’s: National Training Agency (www.grenadanta.gd).

10
2. Trends in the labour market
2.1 Labour Force
The labour force increased from nearly 42 thousand in 2001 to almost 47 thousand in 2005. In
2008 it was estimated to be about 47,500.
Labour force participation rates fluctuated somewhat over time (Table 2.1). The economically
active population was about 60 per cent of the potential labour force in 2001.3 The labour
force participation rate rose to almost 66 per cent in 2005 and subsequently declined again to
62 per cent in 2008. The fluctuation over time may be partly related to differences in
measurement methods (i.e. census versus surveys). Anyhow, it is clear that labour force
participation among males is consistently higher than among females.
Table 2.1: Labour Force Participation Rates (Percentage of Potential Labour Force)
2001 2005 2008
Total 60.1 65.7 61.8
Male 71.9 72.5 67.4
Female 48.8 59.1 56.2
Source: Data on Main Labour Force Indicators received from CSO
2.2 Employment
Overall employment in Grenada increased from nearly 38 thousand in 2001 to over 41
thousand a decade later (Figure 2.1). This amounts to an average annual growth rate of
employment of 0.9 per cent in the period 2001-2011. However, most of the growth in
employment took place between 2005 and 2011 and principally occurred on account of
growth of female employment, which was 2.0 per cent per year over the decade and 2.8 per
cent in 2005-2011, compared to 0.8 per cent in 2001-2005.
There is also an estimate of employment for 2008 based on the Living Standards Survey.
Estimated employment in 2008 was 35,722.4 This estimate is substantially lower than
employment shown in Figure 2.1. We therefore have doubts regarding the comparability of
this estimate with the numbers in Figure 2.1.
3 The potential labour force is the population of 15 years and above.
4 Data received from CSO.

11
Figure 2.1: Employment by Sex – 2001, 2005, 2011
Source: Authors’ elaboration based on data received from CSO
Figure 2.2 presents the percentage distribution of employment according to (broad) industries,
whereby the response category “not stated” is excluded from the calculations. There are also
estimates for 2005 and 2008 of employment broken down by industry, but the industry
classifications used in the surveys for these years are not comparable with those used in the
censuses.
The figure reveals that a shift took place over time in employment from the primary and
secondary sectors to particularly public administration and defence, social security, education
and health and private services. The share of hotels & restaurants and wholesale & retail –
economic activities that are expected to be related to tourism – remained virtually unchanged
at about a quarter of total employment.
In terms of occupations, there has been a clear shift in employment from elementary
occupations to occupations for which higher skills are required (Figure 2.3). The two bottom
categories in Figure 2.3 comprised 60 per cent of the employed workforce in 2011, compared
to only 47 per cent in 2001.
Over the decade, there has been a shift to paid employment in government and self-
employment (with or without employees) at the cost of paid employment outside the public
sector (Figure 2.4).
22
,48
6
15
,25
5
37
,74
1
22
,40
9
15
,76
3
38
,17
2
22
,79
7
18
,61
1
41
,40
8
0
5,000
10,000
15,000
20,000
25,000
30,000
35,000
40,000
45,000
Male Female Total
2001
2005
2011

12
Figure 2.2: Employment according to Industry – 2001 and 2011 (Percentage shares)
Source: Authors’ elaboration based on data received from CSO
Figure 2.3: Employment according to Occupation – 2001 and 2011 (Percentage shares)
Source: Authors’ elaboration based on data received from CSO
Figure 2.4: Employment according to Category of Worker – 2001 and 2011 (Percentage shares)
Source: Authors’ elaboration based on data received from CSO
13 9
26 19
25
23
7
8
6
3
23 38
0%
20%
40%
60%
80%
100%
2001 2011
Public adm. and defence; Compulsory social security, Education, Health, Private services
Financial and insurance activities, Real estate activities
Transportation, Communication
Wholesale & Retail, Hotels and Restaurants
19 25
28
35 8
7 24
21
22 12
0%
20%
40%
60%
80%
100%
2001 2011
Elementary occupations
Craft and related trades workers, Plant and machine operators, and assemblers
Skilled agricultural, forestry and fishery workers
Clerical support workers, Service and sales workers
Managers & Professionals, Technicians and Associate Professionals
17 22
65 57
4 6
11 14 2 2
0%
20%
40%
60%
80%
100%
2001 2011
Other
Self-Employed without paid employees
Self-Employed with paid employees
Paid Employee - Other
Paid Employee - Government

13
Census data on employment broken down by highest level of education completed are
available for 2011 and 2001. The education classifications used in the two censuses are largely
comparable. Survey estimates of employment according to educational attainment are
available for 2005 and 2008, but the classifications used in the surveys are not comparable to
the one in the 2011 census.
Figure 2.5 indicates that there has been a substantial shift in the composition of employment
from lower to high levels of education. The higher-educated made up a quarter of employed
persons in 2011, compared to only 13 per cent a decade earlier. Whereas persons with primary
education or less still comprised 58 per cent of the employed workforce in 2001, ten years
later, their share had declined to only 38 per cent and was equal to the share of persons with
secondary education. The shift towards higher levels of education of employed persons is in
line with the general shift towards higher education of the population of Grenada.5
Figure 2.5: Employment according to Education – 2001 and 2011 (Percentage shares)
Source: Authors’ elaboration based on data received from CSO
A third of the employed persons did not work full time (i.e. 35 hours or more per week) in
2011. This proportion is even higher in agriculture, forestry and fishing, where only half of the
employed persons work full time.
Finally, we requested, but did not receive information from the 2011 census that would allow
us to make an estimate of employment in the informal sector.
5 It is also in line with declining enrolment in primary education, increasing transition rates to secondary
education, virtually constant enrolment in and graduation from secondary education, and increasing enrolment in tertiary education, as reported in a data set provided by the Ministry of Education and Human Resources (see also Chapter 5).
58
38
29
37
9 18
4 7
0%
20%
40%
60%
80%
100%
2001 2011
University
Post Secondary
Secondary
Primary or less (including None and NS)

14
2.3 Unemployment
There is limited availability of data on unemployment. The overall unemployment rate was
almost 10 per cent in 2001 and rose to an estimated 18.8 per cent in 2005. Estimated
unemployment in 2008 stood at almost a quarter of the labour force (Table 2.2). The
unemployment rate in 2011 was similar to that in 2008.
As is also typical elsewhere, youth unemployment is higher than unemployment among older
people. Available data for 2008 reveal that the rate of unemployment tends to decline with
age (Figure 2.6). If comparable data for the census years were be made available, it could be
checked whether the patterned observed in Figure 2.6 has shifted over time.
Table 2.2: Unemployment (Per cent of Labour Force)
2001 2005 2008
Total 9.9 18.8 24.9 Male 9.8 12.4 17.9 Female 9.9 26.3 31.8 Youth (15-24 years of age) 20.3 32.9 36.3 Source: Data on Main Labour Force Indicators received from CSO
Figure 2.6: Age-specific Unemployment Rates in 2008 (Percentage of Labour Force)
Source: Authors’ calculations based on data from SLC 2008
0
10
20
30
40
50
60
70
80
15-19 20-24 25-29 30-34 35-39 40-44 45-49 50-54 55-59 60-64 65 +
Male Female Total

15
The question now is: Why is it particularly difficult for younger persons and for females to find
a job in Grenada? Is this related to a lack of skills?
In Chapters 3 and 4 we will pay attention to skill mismatches. In the next chapter we will first
present labour market projections for Grenada. These projections are limited by the limited
availability of relevant labour market information.
No data are available on labour market mobility (flows), but the available data to which we
have access so far is also too limited to use a quasi-flow approach in the projections.

16
3. Labour market projections
3.1 Aims and methodology
Our aim is to make labour market projections until 2018. We would like to project in the first
place the following labour market indicators:
1. Employment broken down by industry, occupation and level of education;
2. The labour force broken down by occupation and level of education.
By using these indicators, we could also compute the discrepancy between the number of
persons willing to work and the number of employed persons:
3. Unemployment broken down by occupation and level of education.
However, as we will show, with the currently available data it will not be possible to break
down the labour force by occupation and education. In principle, the data needed for this are
available, but so far we could not obtain these data.
The employment projections are made by taking the following steps:
a) First projections are made of (macro) GDP in fixed prices (reflecting volume growth);
b) Then these GDP projections are broken down by industry;
c) GDP projections by industry are used to project employment by industry;
d) Then, for each industry, the employment projections are broken down by occupation;
e) Finally, for each occupation, employment is broken down by level of education.
With respect to labour supply, it will only be possible to make very tentative projections for
the total labour force. Then total unemployment is projected by taking the difference between
labour force and employment.
3.2 Employment projections
3.2.1 Step 1: projecting macro GDP
GDP of Grenada appears to be quite strongly correlated with US GDP. However, it is
dangerous to assign too much value to correlations between variables that show a strong time
trend. Hence, we looked at the percentage changes in the variables. For Grenada, data about
GDP is available for the period 2000-2012.6 The problem is that during this period Grenada was
hit by two hurricanes. In some years, GDP is affected negatively by these events. In other
years, GDP growth has been extremely high owing to high growth in the construction sector in
6 GDP estimates were made by the Central Statistical Office (CSO) and the Eastern Caribbean Central Bank (ECCB),
see http://www.eccb-centralbank.org/Statistics/

17
the recovery phase. If we correct for these specific years, GDP growth in Grenada is
significantly related to GDP growth in the US. In fact, we find the following relationship:
(1) GDP growth Grenada = a * GDP growth US
Where the estimated ‘a’ does not significantly differ from 1. Therefore, we will assume for
future years that projected GDP growth rates in Grenada are equal to the ones in the growth
projections for the US. See Annex III for more details.
On the basis of the statistical relationship found, projections have been made of GDP in
Grenada. Projections of US GDP are taken from a recent US publication.7 The results for
Grenada are shown in Figure 3.1 The results point to an average annual growth rate of 3 per
cent for the period 2013-2018.
Figure 3.1: GDP growth: data (2001-2012) and projections (2013-2018)
Source: Authors’ calculations
3.2.2 Step 2: projecting GDP broken down by sector
The different industries are interconnected. In some cases there is a direct connection. An
example is the linkage between agriculture and those parts of the manufacturing industry that
use agricultural products as input for production. In other cases the relationship is largely
indirect. Growth in sector A leads to growth in aggregate income, more consumer spending
and therefore growth in sector B. In our analyses, we take account of this linkage by assuming
that the share of a specific industry in GDP depends on GDP per capita. It is likely that one
7 Congress of the United States, Congressional Budget Office, The budget and economic outlook: fiscal years 2013 to 2023,
February 2013.
-8
-6
-4
-2
0
2
4
6
8
10
12
14
2000 2002 2004 2006 2008 2010 2012 2014 2016 2018 2020

18
sector is more affected by macro-economic development than another. Probably, the share of
an industry in GDP will not only depend on GDP per capita, but also on other factors. However,
we lack the information needed to take these factors explicitly into account. We therefore
include a time trend to account for these missing factors. For each industry, we regress its
share in GDP on both GDP per capita and a time trend. In general, both factors appear to be
statistically significant.
If we combine the GDP projections that were presented in the previous section with existing
population projections, we can compute the projections for the GDP shares of the various
industries.
In our analyses, the following industries are distinguished:
- Agriculture and fisheries (primary sector);
- Mining, manufacturing, utilities and construction (secondary sector);
- Wholesale and retail trade, and hotels and restaurants;
- Transport and communication;
- Banks, insurance companies and real estate;
- Public sector.
The reason for taking some industries together is that some of them are quite small. In the
end, we want to break down employment by type of labour. For small industries, the numbers
of workers in specific occupations are very small. Hence, these numbers will show a lot of
variation over time and will therefore be hard to predict.
Table 3.1 shows the development of the sectoral structure of GDP during the period 2000-
2012 and the projections of this structure for the period 2013-2018. During the period 2000-
2012, the percentage share of the public sector has increased from almost 22 per cent to 33
per cent. This increase is due to an expansion of the educational sector. If we apply the above-
mentioned approach to every industry, including the public sector, we find that the GDP share
of the public sector will further increase to 43 per cent in 2018. However, this may not be
desirable. Therefore, it may well be that policy decisions will be taken to prevent this further
increase. In the projections presented in Table 3.1, we assume that such decisions will indeed
be taken and that the share of the public sector remains at its 2012 level – i.e. 33 per cent of
GDP. See Annex III for more details on the methodology.
According to our projections, the employment share of the primary sector will increase
between 2011 and 2018. Hence, this sector shows a recovery after 2010, compared with the
period before 2010. The employment share of the secondary sector declines. The shares of
Trade and Hotels and Restaurants as well as Transport and Communication remain more or
less at their 2012 level. The share of the financial sector increases somewhat.

19
Table 3.1: GDP shares per industry: data (2000-2012) and projections (2013-2018)
Year Primary
sector Secondary
sector
Trade, hotels and
restaurants Transport
Financial sector and real estate
Public sector Total
2000 7.4 20.3 14.7 15.1 20.9 21.6 100
2001 7.3 18.7 14.3 14.6 22.7 22.4 100
2002 7.3 18.5 14.5 14.1 22.3 23.2 100
2003 7.1 19.5 13.1 15.2 21.9 23.2 100
2004 6.5 19.3 12.2 15.7 22.6 23.6 100
2005 3.3 27.1 10.6 16.2 21.1 21.7 100
2006 4.5 22.3 13.6 14.6 21.2 23.9 100
2007 4.3 20.6 13.1 15.4 21.0 25.7 100
2008 4.6 19.3 13.1 14.8 20.5 27.7 100
2009 5.5 16.5 11.7 14.2 21.6 30.5 100
2010 5.2 16.6 11.3 13.9 21.5 31.4 100
2011 5.1 16.0 11.6 13.4 21.9 31.9 100
2012 5.6 14.9 11.4 13.3 21.8 33.0 100
2013 6.1 13.7 11.6 13.1 22.5 33.0 100
2014 6.4 13.1 11.6 13.0 23.0 33.0 100
2015 6.4 12.9 11.5 13.0 23.3 33.0 100
2016 6.1 12.9 11.4 13.1 23.5 33.0 100
2017 6.1 12.7 11.4 13.1 23.8 33.0 100
2018 6.6 11.8 11.4 12.8 24.4 33.0 100
Source: Authors’ calculations
3.2.3 Step 3: projecting employment by industry
For two years, we have reliable information about employment broken down by industry:
1) 2001 (Census);
2) 2011 (Census).
On the basis of this data, we analyse for each industry to what extent productivity has changed
between 2001 and 2011. On that basis we project productivity for each industry from 2011 to
2018. Then we use the following formula:
(2) Employment= Production/Productivity
Clearly, two observations are a weak basis for a projection. However, we do not have
employment by industry from the 2005 Labour Force Survey. We do have this data from a
2008 survey, but this data has a classification that is hard to combine with the classification of
the GDP data.
It appears that labour productivity has increased in the primary sector, the secondary sector
and in the financial sector. Extrapolating productivity and computing employment with the
help of the formula (2) leads to the results presented in Table 3.2.

20
Table 3.2: Employment by industry: data (2001 and 2011) and projections (2012-2018)
Primary sector
Secondary sector
Trade, Hotels and
Restaurants Transportation, Communication
Financial sector
Collective sector Total
2001 4,824 9,906 9,424 2,746 2,163 8,677 37,741
2011 3,771 7,873 9,614 3,168 1,293 15,681 41,401
2012 4,096 7,076 9,383 3,129 1,197 16,138 41,018
2013 4,488 6,439 9,706 3,108 1,175 16,381 41,296
2014 4,708 6,144 9,906 3,151 1,142 16,725 41,777
2015 4,868 6,077 10,249 3,272 1,125 17,377 42,969
2016 4,860 6,184 10,610 3,441 1,108 18,142 44,346
2017 4,971 6,164 10,973 3,584 1,091 18,867 45,651
2018 5,513 5,737 11,319 3,616 1,073 19,396 46,654 Source: Authors’ calculations
According to the projections, employment will grow in the primary sector, the sector
consisting of trade, hotels and restaurants, transportation and the collective sector. On
average, expected annual growth of total employment in the period 2011-2018 equals 1.4 per
cent.
3.2.4 Step 4: projecting employment by occupation
For each industry, we assume for the future that the employment shares of the various
occupations will not change compare to the shares observed in the 2011 census. This leads to
the following projections of employment broken down by occupation presented in Table 3.3.
Most occupational groups show a growth of employment. The only exception is the
occupational group consisting of professions that are related to the secondary sector (mainly
consisting of manufacturing industry and construction). This is caused by the fact that this is
the only shrinking sector.

21
Table 3.3: Employment by occupational group: data (2011) and projections (2012-2018)
Managers & Professionals,
Technicians and associate professionals
Clerical support
workers, Service and
sales workers
Skilled agricultural, forestry and
fishery workers
Craft and related trades workers, Plant
and machine operators,
and assemblers
Elementary occupations
and Not stated Total
2011 8,981 13,084 2,972 8,459 7,905 41,401
2012 8,975 12,977 3,218 7,919 7,930 41,018
2013 9,034 13,194 3,516 7,556 7,996 41,296
2014 9,152 13,403 3,684 7,427 8,111 41,777
2015 9,443 13,844 3,809 7,508 8,365 42,969
2016 9,801 14,354 3,808 7,723 8,659 44,346
2017 10,129 14,839 3,897 7,848 8,939 45,651
2018 10,328 15,196 4,310 7,664 9,156 46,654 Source: Authors’ calculations
3.2.5 Step 5: projecting employment by education
The problem in projecting employment by education is that we do not have the occupation-
education matrix for 2001. A possibility would be to use the occupation-education matrix of
2011, which we do have, and assume that this matrix remains the same until 2018. Then we
would assume that the educational composition of the people with a specific occupation will
not change. However, this is not realistic. As discussed in Chapter 2, if we compare the
educational structure of employment in 2001 with the corresponding structure in 2011, we
can observe a number of important changes. The share of workers with only primary or less
education has diminished considerably (from 58% to 38%, see Figure 2.5). In contrast, the
share of workers with a post-secondary or a university education has increased. It is highly
likely that the increase in the educational level of the employed will continue in the future.
We assume that between 2011 and 2018 these changes will continue in the same pace. One
might argue, however, that the educational structure is also affected by changes in the
occupational structure. The share of workers with a university education is much higher among
managers them among unskilled workers. Therefore, the share of workers with university
education in total employment will increase if the share of managers in total employment is
rising. We have tested the hypothesis that the occupational structure matters by computing
the educational structure of employment for 2001 assuming that the occupation-education
matrix for 2001 is the same as for 2011. It appears that the result is hardly different from the
actual educational structure for 2001. Hence, we conclude that the occupational structure of
employment is not that important for the educational composition of employment. So, by
extrapolating the trends in the educational structure of employment without taken changes in

22
the occupational structure, we may still obtain reasonable projections of employment by level
of education. The results of this extrapolation are given in Table 3.4.
Table 3.4 Percentage shares educational levels in employment: 2011 (observation) and
2012-2018 (projections)
Primary Secondary Post-secondary University Total
2011 38.3 36.8 18.1 6.9 100
2012 36.4 37.2 19.2 7.1 100
2013 34.5 37.7 20.4 7.4 100
2014 32.7 38.0 21.6 7.7 100
2015 30.9 38.3 22.8 7.9 100
2016 29.1 38.6 24.1 8.2 100
2017 27.4 38.7 25.4 8.4 100
2018 25.8 38.8 26.7 8.7 100 Source: Authors’ calculations
According to Table 3.4 the percentage share of the primary educated in education will diminish
to about 26 per cent in 2018. The percentage shares of the post-secondary and university
educated will increase. We expect that 35 per cent of the workers will have tertiary education
in 2018. The share of the secondary educated will hardly change.
The absolute numbers corresponding to table 3.4 are included in Table 3.5. Because total
employment is expected to increase also the number of workers with a secondary education
will increase. Despite the increase in total employment, the number of primary educated
workers will diminish.
Table 3.5 Projected numbers of workers by level of education: 2011 (observation) and
2012-2018 (projections
Primary Secondary Post-secondary University Total
2011 15,870 15,216 7,474 2,842 41,401
2012 14,938 15,277 7,875 2,928 41,018
2013 14,261 15,558 8,417 3,060 41,296
2014 13,656 15,891 9,022 3,207 41,777
2015 13,271 16,472 9,815 3,411 42,969
2016 12,916 17,101 10,694 3,634 44,346
2017 12,517 17,677 11,602 3,855 45,651
2018 12,021 18,108 12,473 4,053 46,654 Source: Authors’ calculations

23
3.3 Confrontation with available supply of labour
In the previous section employment was projected without taking labour supply into account.
Will enough people be available to fill the jobs? It is very difficult to answer this question
because recent information about unemployment is lacking. The 2011 census does contain
information about unemployment, but the unemployment figures are not published and
treated as confidential.
Labour supply is defined as the number of people that have a job and the jobless that are in
search of a job. The latter are the unemployed. So, without data about unemployment we
cannot measure labour supply.
However, we do have figures for potential labour supply. This consists of the people of 15
years of age or older. The difference between potential labour supply and employment is the
sum total of unemployment and inactivity. The ration between employment and the potential
labour force is the employment rate. We will refer to it as the none-employed. This will be
treated in Section 3.3.1. In Section 3.3.2 we will give a rough estimate of unemployment.
3.3.1 Employment and non-employment rate
There are population forecasts available. However, these forecasts were made before the
census 2011 data became available. The projected age structure of these projections is not
consistent with the 2011 census. Therefore, the forecasts have been adjusted to the 2011
census figure. Projections are available for 2015 en 2020. The intermediate years have been
estimated by interpolation. On the basis of these estimates, calculations have been made of
the potential labour force by level of education. Similar to the employment projections, we
assumed that the trends in the educational structure of the potential labour force between
2001 and 2011 continue in the future. Table 3.6 gives the projections of the potential labour
force by level of education.
Table 3.6 Potential labour force by level of education: 2011 (observation) and 2012-
2018 (projections)
Primary Secondary Post-secondary University Total
2011 38,955 28,647 9,971 3,426 81,000
2012 38,158 29,352 10,564 3,563 81,638
2013 37,346 30,050 11,182 3,702 82,281
2014 36,521 30,738 11,827 3,843 82,929
2015 35,683 31,415 12,498 3,986 83,582
2016 34,650 31,910 13,126 4,109 83,795
2017 33,618 32,385 13,774 4,232 84,009
2018 32,589 32,838 14,441 4,355 84,223 Source: Authors’ calculations

24
For each level of education we can now compute the employment rate by dividing
employment by the potential labour force. The results are depicted in Figure 3.2.
Figure 3.2: Employment rate by level of education: 2011 (observation) and 2012-2018
(projections)
0
0,1
0,2
0,3
0,4
0,5
0,6
0,7
0,8
0,9
1
2010 2012 2014 2016 2018
Prim
Sec
Post-sec
Univ
Source: Authors’ calculations
Figure 3.2 shows that for post-secondary and university educated people the employment rate
will increase. In 2018 more than 90 per cent of the potential labour force with university
education will be employed. Given the fact that not every person in the potential labour force
is opting for a job, this means that shortages of university educated persons are highly likely.
Also for the post-secondary educated labour market prospects are good. For this category the
employment rate will increase to 0.86 in 2018. Also for this group the labour market will be
tight and unemployment low. For the persons with secondary education, it will increase
slightly to 0.55. This means that 45 per cent of the secondary educated persons are not
employed. Even if one takes into account that a certain part of this group do not want to have
a job, the unemployment rate for this group is likely to stay high. This holds is even more for
the primary educated. The employment rate for this group will diminish to 0.36 in 2018.
Hence, the unemployment rate for this group is likely to be high and will probably increase
further.
3.3.2 Unemployment
The 2011 Census is the only reliable recent source for unemployment and labour force
participation. The available data for the period 1991-2008 does not show a consistent

25
pattern 8. According to this data, labour force participation shows huge fluctuations.
Therefore, we decided to use the most recent figure for the labour force participation rate,
that of 2011 (0.672). We assume that the labour force participation rate will remain constant
at this level until 2018. Under this assumption, labour supply can be computed as follows:
(3) Labour force = 0.672 * Potential labour force
Then, unemployment is equal to:
(4) Unemployment = Labour force – Employment
So, using our employment projections, we can also make projections for unemployment and
the unemployment rate. The latter is defined as:
(5)
The results are presented in Table 3.7.
Table 3.7: Labour force and unemployment: tentative projections (2011-2018)
Potential labour force
Labour force Employment Unemployment Unemployment rate
(*1000 persons) (as percentage of the labour force)
2011 81 54 41 13 24
2012 82 55 41 14 25
2013 82 55 41 14 25
2014 83 56 42 14 25
2015 84 56 43 13 23
2016 84 56 44 12 21
2017 84 56 46 11 19
2018 84 57 47 10 18 Source: Authors’ calculations
According to our forecasts, the unemployment rate is fairly constant at 24 to 25 per cent of the
labour force until 2014, before it gradually decreases to 18 per cent in 2018. However, our
projections must be seen as very tentative. Furthermore, we know from results in other
countries that the labour force participation rate depends on the labour market situation. If
the unemployment rate decreases, more people will be inclined to look for a job, because the
chance of finding a job is higher. This is the so-called encouraged worker effect. Hence, it is
likely that in reality the reduction in the unemployment rate will be less than suggested by the
results presented in Table 3.7.
8 Data provided by CSO.

26
It is also likely that the unemployment rate among post-secondary and university educated
people will decrease more than the average unemployment rate. The unemployment rate
among primary educated people may even increase somewhat. However, we lack the
necessary data even to give indicative projections of unemployment by level of education.
3.4 Final remarks
In this chapter, an attempt was made to make labour market projections for Grenada. The
data that we could use was very limited. In principle, data is available for 2001 (Census), 2005
(labour market survey), 2008 (survey) and 2011 (census). However, we could only get access to
a limited part of these data.
We consider the projections of GDP by industry as the most reliable part of our projections.
The 2005 and 2008 data about employment broken down by industry is not detailed enough to
match it with the classification of GDP in a very meaningful way. Hence, useful (and reliable)
employment data broken down by industry was only available for 2001 and 2011, which is a
weak basis for employment projections.
Cross-tabulations of employment according to industry and occupation and according to
occupation and education were only available for 2011. Hence, we had to make assumptions
to derive projections of employment by level of education. It was also possible to make
projections of the potential labour force by level of education. The two have been combined to
make projections of the employment rate. These projections show that for post-secondary and
university educated the employment rate will increase, while it will decrease for the primary
educated. The employment rate for the secondary educated will not change that much. Our
conclusion from this result is that shortages may arise for post-secondary and university
educated people. Low-skilled labour will become even more abundant than in the past.
The weakest part of the projections concern labour supply. We took the most recent figure for
the labour force participation rate, namely the figure for 2011. Only under the assumption that
this rate will be constant, we could make projections for labour supply and unemployment.
According to these tentative projections the unemployment rate will decrease after 2014. It is
likely that the decrease in the unemployment rate will even be bigger for the post-secondary
and the university educated. For the low educated, however, the unemployment rate is more
likely to increase further.
In general, we can observe that more data are available than we could obtain. If we could
dispose of the available data, more reliable projections could be made. Furthermore, in that
case, it would probably be possible to differentiate the labour supply and unemployment
projections by occupation and education. With the data currently at our disposal this is not
possible. It would be particularly important to have the three-dimensional table industry-
education-age for employment for 2001 and 2011 (and for 2005 to at least check for shifts in
the education-age structure of employment). Then we might be able to compute the number

27
future job openings and compare this figure with projections of the number of young people
leaving school and entering the labour market.

28
4 Analysis of the 2013 Employers Survey
4.1 Introduction
The 2013 Employers’ Survey in Grenada was conducted between August and October 2013.
The Grenada Statistical Office (CSO) provided a list of employers classified by industry and
number of employed persons. The list was compiled in 2012 and contains 589 employers with
5 or more employed persons. All these employers with 5 or more employed persons were
approached. After several reminders, the survey team managed to interview 350 out of the
589 employers with 5 or more employed persons were interviewed. The CSO list does not
cover the public administration. Several departments have been approached separately, but
due to non-response, the public administration could not be covered in the survey. This
limitation should be borne in mind when interpreting the results of the survey analysis.
The composition of the sample of 350 companies/organizations in terms of size class of
number of employed persons and aggregate sector of economic activity was compared with
that of the list of 586 companies/organizations provided by CSO. While some sectors and some
size classes are slightly under- or overrepresented, the structure of the sample and that of the
list are sufficiently comparable (except that the list does not include the sector electricity).
However, no serious biases in measurement are expected. For that reason, there is no real
need to apply correction factors to reweight the sample, and we have decided to take the
sample “as is,” as application of a reweighting procedure may introduce other biases.
In this chapter we will successively discuss the following topics: employment, performance and
employability of the current workforce, vacancies and job mobility, expectation for the near
future, and employability of young school leavers and unemployed persons.
4.2 Employment
In total, the 350 employers covered by the survey employed almost nine thousand persons
(including some 400 workers who were not on their payroll) in 2013.9 The average number of
workers was little over 25. Not surprisingly, employment was largely concentrated in St.
George’s (with 79 per cent of total employment). St. Andrews and Carriacou accounted for
respectively 9 and 3 per cent of total employment.
9 Compared with total employment according to the 2011 Population Census, this number comprises
about a quarter of the employed workforce. The share is similar to the share of the employed workforce that the Saint Lucia Labour Market Needs Assessment Survey 2012 covered, see Edward St Catherine, Analysis of the Saint Lucia Labour Market Needs Assessment Survey 2012, May 14, 2013.

29
While only employers who employ 5 or more persons were approached, 32 of the 350
interviewed employers (i.e. 9.1%) reported to have less than 5 workers. A possible explanation
for this is that these employers reduced their workforce. However, the discrepancy may also
be due to inaccuracies in the list or due to response errors.
Nearly all the 350 employers are active in the private sector, and over 85 per cent of the
employers are only active in Grenada. Accordingly, the private sector accounts for the lion’s
share of (paid) employment.
The total number of paid employees was 8,314 in 2013, of which 8,017 were employed in
companies/organizations that started operations before 2010. These numbers compare to
reported paid employment of 7,871 persons in 2010 (Figure 4.1).10
Figure 4.1: Paid employment by Type of Sector – 2010 and 2013
Source: Authors’ elaboration based on the 2013 Grenada Employers’ Survey
Note: (i) excluding companies/organizations established after 2009; (ii) all companies/organizations
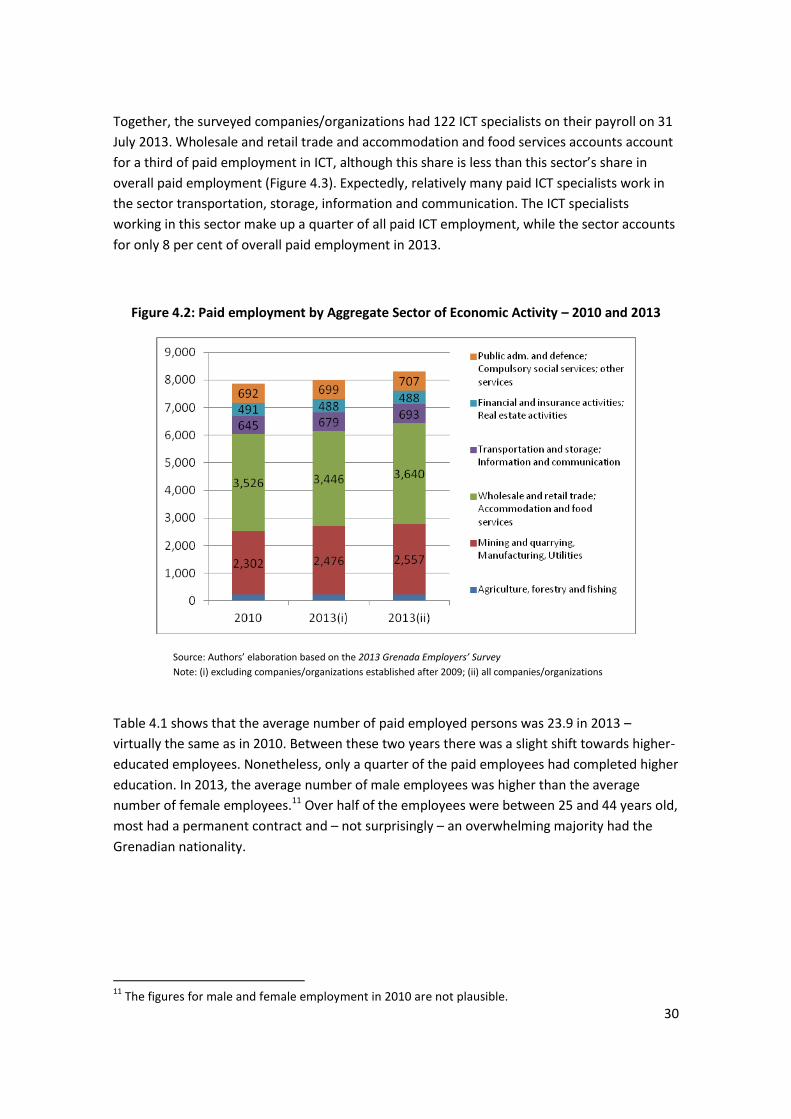
The sector “Wholesale and retail trade, together with accommodation and food services” is
the largest sector in terms of paid employment, with a share of 44 per cent in 2013 (Figures 4.2
and 4.3). The number of paid employees in this sector increased in recent years, partly due to
the establishment of new companies/organizations since 2010. There has also been a modest
growth of paid employment in mining and quarrying, manufacturing and utilities, which
accounts for a share of 30 per cent in 2013.
10
Please note that only 326 employers reported the number of paid employees in 2010, compared to 349 in 2013. This is partly due to the fact that some private sector companies/organizations were established only in recent years: 341 employers reported the year of commencement; 21 of them reported that they had started after 2009.
1,297 1,329 1,329
6,470 6,574 6,871
0
1,000
2,000
3,000
4,000
5,000
6,000
7,000
8,000
9,000
2010 2013(i) 2013(ii)
Non-governmental organization
Private Sector
Public Sector
30
Together, the surveyed companies/organizations had 122 ICT specialists on their payroll on 31
July 2013. Wholesale and retail trade and accommodation and food services accounts account
for a third of paid employment in ICT, although this share is less than this sector’s share in
overall paid employment (Figure 4.3). Expectedly, relatively many paid ICT specialists work in
the sector transportation, storage, information and communication. The ICT specialists
working in this sector make up a quarter of all paid ICT employment, while the sector accounts
for only 8 per cent of overall paid employment in 2013.
Figure 4.2: Paid employment by Aggregate Sector of Economic Activity – 2010 and 2013
Source: Authors’ elaboration based on the 2013 Grenada Employers’ Survey
Note: (i) excluding companies/organizations established after 2009; (ii) all companies/organizations
Table 4.1 shows that the average number of paid employed persons was 23.9 in 2013 –
virtually the same as in 2010. Between these two years there was a slight shift towards higher-
educated employees. Nonetheless, only a quarter of the paid employees had completed higher
education. In 2013, the average number of male employees was higher than the average
number of female employees.11 Over half of the employees were between 25 and 44 years old,
most had a permanent contract and – not surprisingly – an overwhelming majority had the
Grenadian nationality.
11
The figures for male and female employment in 2010 are not plausible.

31
Figure 4.3: Percentage distribution of all paid employees and paid ICT specialists across
Aggregate Sectors of Economic Activity in 2013 (Percentage shares)
All paid employees
Paid ICT Specialists
Source: Authors’ elaboration based on the 2013 Grenada Employers’ Survey
31%
44%
8%
6%
8% 3%
Mining and quarrying, Manufacturing, Utilities
Wholesale and retail trade; Accommodation and food services
Transportation and storage; Information and communication
Financial and insurance activities; Real estate activities
Public adm. and defence; Compulsory social services; other services
Agriculture, forestry and fishing
16%
33%
25%
8%
18%
Mining and quarrying, Manufacturing, Utilities
Wholesale and retail trade; Accommodation and food services
Transportation and storage; Information and communication
Financial and insurance activities; Real estate activities

32
Table 4.1: Average Number of Paid Employees per Employer1
2010 2013
TOTAL 24.0 23.9
Educational attainment Did not complete secondary school 6.1 5.5
Completed secondary school (but nothing more) 9.9 9.8 Post-secondary, non-tertiary (Vocational / diploma /Associates) 3.8 4.6 Tertiary – Bachelors, Masters, Doctorate, Professionals 1.5 1.9 Unknown education level 2.8 2.5
Gender Males 18.8 13.3
Females 16.8 10.4
Age group 15-24 years old - 3.3
25-44 years old - 13.8 45-64 years old - 6.3 65 years old and older - 0.3
Hours worked
Full-time (i.e., work 35 hours / week or more) - 21.7 Part-time (i.e., work 34 hours / week or less) - 2.2 Other - 0.0
Type of contract
Permanent - 20.9 Temporary - 1.6 Contract - 0.7 Don’t know - 1.1
Nationality
Grenadian nationals - 22.6 Foreign nationals - 0.3 Don’t know - 1.4
Source: Authors’ calculations based on the 2013 Grenada Employers’ Survey 1 The percentage shares of the breakdowns do not always exactly sum up to the total because of a different number of
observations.

33
4.3 Performance and employability of the workforce
A large majority of the 350 companies/organizations in the survey gives feedback to workers
about their performance and over half of them does this more than once a year (Figure 4.4).
Figure 4.4: Feedback to worker about performance?
(Number of companies/organizations, n=350)
Source: Authors’ elaboration based on the 2013 Grenada Employers’ Survey
Employers are reasonably satisfied with the performance of their existing workforce in view of
achieving the goals of the company/organization. Some 6 out of every 7 employers rate the
performance of the workforce at least adequate. Public sector employers and NGOs are
slightly more positive about their workforce than private sector employers (Table 4.2).
Table 4.2: Perceived performance of the workforce (Number of employers)
Public sector Private Sector NGOs Total
Inadequate 1 9 0 10
Fair 0 44 0 44
Adequate 3 62 1 66
Good 6 166 5 177
Excellent 4 46 3 53
Total
14
327
9
350
Source: Authors’ calculations based on the 2013 Grenada Employers’ Survey
Never / very rarely, 32
Yes, but less than once a
year, 14 Yes, once every year,
46
Yes, more than once in a year,
254
Not Stated, 4

34
Performance was not considered adequate in 54 cases (including one case in the public
sector). The main reason reported for the inadequate or fair performance was a lack of right
attitude. Another important reason was lack of self-initiative (Figure 4.5).
Figure 4.5: Reasons for inadequate or poor performance
(Number of companies/organizations, n=54)
Source: Authors’ elaboration based on the 2013 Grenada Employers’ Survey
95 employers think that they can improve performance of their workforce by giving (more)
feedback on performance. Even larger numbers of employers think that providing training in
technical and/or soft skills is the best way to improve performance.12
Figure 4.6 shows that there are several companies/organizations in which all or most of the
paid employees received formal training (in-house or by a contractor) in the last twelve
months. However, in 129 cases no formal training was given to the paid employees, while in
other cases only some paid employees received training. The main reason for not formally
training paid employees in the last twelve months is that the employers consider that their
employees are already sufficiently trained. Another reason is that training is considered to be
expensive. These two reasons were especially important among employers with 5 to 9 paid
employees.
12
Providing technical training is reported 132 and 44 times as the best and second-best option, respectively. Similarly, providing training on soft skills is mentioned 38 and 116 times.
Lack of right attitude, 23
Lack of self-initiative, 13
Lack of communication
skills, 7
Lack of technical skills, 3
Lack of commercial
skills, 3 Other, 5

35
Figure 4.6: Formal training of paid employees (n=350)
Source: Authors’ elaboration based on the 2013 Grenada Employers’ Survey
4.4 Vacancies and job mobility
Sixty per cent of the employers had no vacancies at all in the last twelve months. Most of the
141 employers who reported to have vacancies had up to five vacancies: 35 employers had
only one vacancy, 48 had two vacancies and 32 had three to five vacancies. Together, the 141
employers had a total of 760 vacancies.13 Hence, the job vacancy rate (defined as the number
of vacancies, or job opening, relative to the sum of the number of job openings and existing
paid employment) was 8.4 per cent. The job vacancy rate tends to decline with the size of the
company/organization (Table 4.3).
In total, 667 vacancies were filled in the past twelve months. This means that the job creation
rate (defined as the number of persons hired relative to paid employment) was 8.0 per cent
(see also Table 4.3). This rate compares to a job creation rate of 13 per cent measured in Saint
Lucia in 2012.14 Apparently, the Grenadian economy was less buoyant in terms of job creation
than the Saint Lucian economy.
13
Of this total, one employer reported to have 175 vacancies, which were all filled. 14
The actual difference may be even larger, as the reference period was 4 weeks in the case of the survey conducted in Saint Lucia, compared to 12 months in the Grenada Employers Survey.
050
10
015
020
025
0
E4N
um
Form
ally
Tra
ined
0 100 200 300 400B3NumPaidEmployees2013

36
Table 4.3: Job vacancy, job creation, job destruction and job turnover rates by size of
company/organization and sector of economic activity (percentages)
Job vacancy rate
Job creation rate
Job destruction
rate
Job turnover rate
Number of paid employees1
5-9 8.6 8.0 12.4 -4.4
10-19 9.4 7.1 10.8 -3.7
20-49 8.6 8.1 10.7 -2.7
50-99 6.6 6.9 4.9 2.0
> 100 8.1 8.6 4.8 3.8
Sector of economic activity Agriculture, forestry and fishing 2.1 2.2 1.7 0.4
Mining and quarrying,
Manufacturing, Utilities 11.8 12.5 6.5 6.1
Wholesale and retail trade;
Accommodation and food services 6.8 5.9 8.7 -2.8
Transportation and storage;
Information and communication 3.9 3.9 5.9 -2.0
Financial and insurance activities;
Real estate activities 6.7 5.9 5.9 0.0
Public administration and
defence; Compulsory social
services; other services 10.7 10.2 13.7 -3.5
Total 8.4 8.0 7.9 0.2
Source: Authors’ calculations based on the 2013 Grenada Employers’ Survey 1 The rates for companies/organizations with less than 5 paid employees are not shown because of a limited number of observations.
There do not appear to be major bottlenecks to fill vacancies. Nearly all the employers (i.e. 90
per cent of them) were able to fill all the vacancies they had in the last twelve months. In total,
93 per cent of the vacancies were filled. However, 34 employers reported one or more
difficult-to-fill vacancies. In total, 84 of the 760 vacancies (i.e. 11 per cent) were considered
difficult to fill.
Only 31 employers who had vacancies in the past twelve months reported the occupation for
which they had most difficulties to fill vacancies. The occupation of manager was mentioned
most often (five times). All other occupations for which employers encountered difficulties to

37
fill a vacancy were mentioned only once or twice.15 Weighted by the number of difficult-to-fill
vacancies that employers had, the vacancies for chefs and managers were most often
considered the hardest ones to fill. These two occupations were followed by sales
representatives and construction engineers.
Nearly 200 employers reported that one or more employees had left the
organization/company in the last twelve months. This number included 97 employers who
dismissed one or more of their employees. In the majority of cases, less than five employees
left their job, but in a few cases this number was higher than thirty.
In total, 653 persons left their job, so the job destruction rate – i.e. the number of separations
relative to paid employment – is 7.9 per cent. This is less than the rate of 11 per cent
estimated for Saint Lucia. However, in Grenada, the job destruction rate is much lower for
larger companies/organizations than for those with less than 50 paid employees (Table 4.3).
The number of persons who left their job was almost the same as the number of new hires.
Therefore, the job turnover rate is 0.2 per cent on average, which is much lower than the rate
of 2 per cent estimated for Saint Lucia. On average, most of the vacancies occur just to replace
persons who leave the company/organization. However, the rate is negative for
companies/organizations with less than 50 paid employees and positive for larger ones (Table
4.3).
Table 4.3 also reveals that the sector “wholesale and retail trade and accommodation and food
services” is characterized by a negative job turnover rate if the last twelve months are
considered. Apparently, the growth in employment in this sector between 2010 and 2013 (as
shown in Figure 4.2) took place between 2010 and the first half of 2012, and was then
followed by negative employment growth in the next twelve months.
The results suggest that employment rose in only two sectors in the last twelve months, as
there are only two sectors in which the job creation rate exceeds the job destruction rate are
“mining and quarrying, manufacturing and utilities” – resulting in a job turnover rate of 6.1 per
cent – and, to a lesser extent, “agriculture, forestry and fishing” (see Table 4.3)
Job destruction occurs for various reasons. In the last twelve months, the number of persons
who left voluntarily was 225. Another 210 employees were dismissed. (Most often, the reason
for dismissal was problems with behaviour/conduct at the workplace.) In addition, 70 persons
retired from their job in the last twelve months, whiles for other persons the reason of leaving
the organization/company is not known.
15
Only 11 employers reported the occupation for which it was second-most important to fill vacancies,
while just 7 employers reported a third occupation. No particular occupation was reported much more
frequently than others.
38
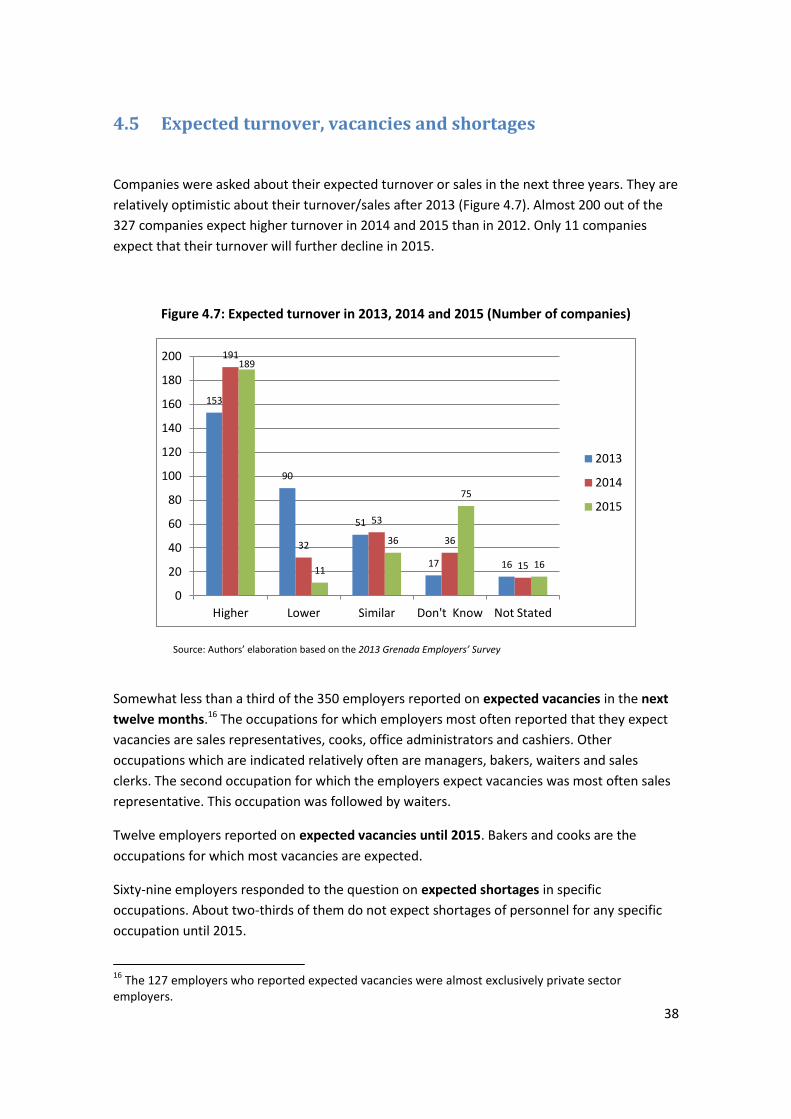
4.5 Expected turnover, vacancies and shortages
Companies were asked about their expected turnover or sales in the next three years. They are
relatively optimistic about their turnover/sales after 2013 (Figure 4.7). Almost 200 out of the
327 companies expect higher turnover in 2014 and 2015 than in 2012. Only 11 companies
expect that their turnover will further decline in 2015.
Figure 4.7: Expected turnover in 2013, 2014 and 2015 (Number of companies)
Source: Authors’ elaboration based on the 2013 Grenada Employers’ Survey
Somewhat less than a third of the 350 employers reported on expected vacancies in the next
twelve months.16 The occupations for which employers most often reported that they expect
vacancies are sales representatives, cooks, office administrators and cashiers. Other
occupations which are indicated relatively often are managers, bakers, waiters and sales
clerks. The second occupation for which the employers expect vacancies was most often sales
representative. This occupation was followed by waiters.
Twelve employers reported on expected vacancies until 2015. Bakers and cooks are the
occupations for which most vacancies are expected.
Sixty-nine employers responded to the question on expected shortages in specific
occupations. About two-thirds of them do not expect shortages of personnel for any specific
occupation until 2015.
16
The 127 employers who reported expected vacancies were almost exclusively private sector employers.
153
90
51
17 16
191
32
53
36
15
189
11
36
75
16
0
20
40
60
80
100
120
140
160
180
200
Higher Lower Similar Don't Know Not Stated
2013
2014
2015

39
Two of the 27 employers who expect shortages in specific occupations expect in the first place
shortages of bakers. Other employers expect shortages of personnel for the following
occupations:
Technical and professional occupations: auto mechanics, graphic artists, plant propagators,
masons, pharmacists, IT specialists, nurses, carpenters, mechanical engineers, painters,
laboratory technicians, quantity surveyors, electronic security officers.
Commercial and service occupations: chefs, sales representatives, marketing executives,
pastry chefs, housekeepers and sales clerks.
Other occupations: supervisors, HR managers and apprentices.
4.6 Employability of school leavers and unemployed people
Figure 4.8 indicates that a lot of employers rate the skills and attitude of young school leavers
at most ‘fair.’ Basic numeracy and literacy skills are considered good by only 21 per cent of the
employers. Other skills and attitude – and especially self-initiative and work attitude – score
even worse.
In the opinion of a majority of the employers, the best ways that companies/organizations can
help young people in the transition from school to work are (in order of importance) to
provide internships, to provide mentoring and to contribute to a training fund. The responses
clearly point at the need for further (on the job) training of school leavers.
At the same time, most of the employers think that the government can better equip young
people for the labour market by especially providing training on technical and soft skills and by
paying more attention to vocational education.17 There are also employers who responded
that the government should focus on basic literacy and numeracy or stimulate
entrepreneurship.
Employers tend to rate the skills and attitude of unemployed people somewhat better than
those of young school leavers (Figure 4.9). The exception are the basic numeracy and literacy
skills of unemployed persons, which a larger proportion of the employers considers
inadequate than in the case of young school leavers.
To better equip unemployed persons for the labour market, the government should in the
opinion of a lot of employers take similar measures as for school leavers: providing training on
technical and soft skills and on improving basic literacy and numeracy.
17
Providing training on technical skills was 108 times the first reported action the government should take and 63 times the second action. Providing training on soft skills was mentioned 34 and 114 times, respectively. Similarly, paying more attention to vocational education was reported 95 and 3 times as an action that the government should take.

40
Figure 4.8: Skills and attitude of young school leavers (Percentage distribution)
Source: Authors’ elaboration based on the 2013 Grenada Employers’ Survey
Figure 4.9: Skills and attitude of unemployed people (Percentage distribution)
Source: Authors’ elaboration based on the 2013 Grenada Employers’ Survey
While employers were in general not positive in their opinions concerning skills and attitude of
young school leavers, over half (i.e. 100) of the 178 employers who hired new staff in the last
twelve months did hire any of such young persons – most often via their own workers. In many
13 22 21 26 30
36
33 41
42 37
22 21
19 15 15
21 16 13 11 11
0
10
20
30
40
50
60
70
80
90
100
Basic numeracy & literacy skills
Technical (professional)
skills
Communication skills
Self-initiative Work attitude
Don't Know
Excellent
Good
Adequate
Fair
Inadequate
16 18 18 23 23
31 31 37 37 37
29 29 22 20 19
17 14 16 11 14
0
10
20
30
40
50
60
70
80
90
100
Basic numeracy & literacy skills
Technical (professional)
skills
Communication skills
Self-initiative Work attitude
Don't Know
Excellent
Good
Adequate
Fair
Inadequate

41
cases they normally provide them training when they are hired, but it must be admitted that
providing training is often a standard procedure for all new hires.
The main reasons that other employers did not hire young school leavers include lack of
experience or lack of technical knowledge among those who applied for a job. About a quarter
of the employers who did not hire any young school-leaver reported these as the main
reasons. Interestingly, these are not the main reasons for not hiring unemployed persons.
A majority of employers who hired new staff in the last twelve months (139 out of the 178) did
hire any unemployed person. The main channels for hiring were the own workers and own
social networks. Again, the majority of the newly hired unemployed people normally received
training, especially because it is often a standard procedure for all new hires.
4.7 Some conclusions
Some conclusions can be drawn from the analysis above. First, employment appears to have
increased between 2010 and 2013, but some sectors recorded negative employment growth in
the last twelve months. Second, only two out of every five employers had any vacancies in the
last twelve months. Third, in general, employers appear to have had relatively little difficulty to
fill vacancies. Nevertheless, there are some occupations for which it proved more difficult to
fill all vacancies. The occupation of manager was mentioned most often.
Employers are relatively optimistic about their turnover/sales after 2013. Only a small minority
of companies expect that their turnover will further decline in 2015.
Occupations for which employers most often reported that they expect vacancies include sales
representatives, cooks, office administrators, cashiers, managers, bakers, waiters and sales
clerks.
Some employers expect shortages of certain types of technicians and professionals (including
IT specialists, nurses, carpenters, painters, mechanical engineers, laboratory technicians and
electronic security officers), of personnel for commercial and service occupations, such as
bakers, chefs, pastry chefs, sales representatives and marketing executives, as well as of
supervisors and HR managers. At the same time, about two-thirds of the employers who
reported on expected vacancies do not expect shortages of personnel for any specific
occupation until 2015.
Further, it appears that a lot of employers do invest in the human capital of their workforce.
For several employers it is also a standard procedure to training new employees. Employers
also think that training of young school leavers and unemployed persons will help to increase
their employability. They emphasize the need for training in both technical and soft skills.
Several employers also stress that the government should do more to improve basic literacy
and numeracy skills, which may turn out to be an obstacle for job seekers to get employed.

42
5 Possible Skill Needs and Skills Development
5.1 Introduction
Grenada is suffering from considerable labour market imbalances. The main problem is the
huge level of unemployment. More than 30 per cent of the labour force is out of work. For
young people it is even more than 50 per cent. Given the enormous excess labour supply, it is
not surprising that most employers can fill their vacancies relatively easily. Hence, one could
argue what the point is of training more people, when there are hardly any unfilled vacancies.
This is, however, a static vision on the labour market. In five years’ time a considerable part of
the current labour force will have left the labour market. And many of them will be employed
at the time of leaving the labour market. They will have to be replaced. Hence, for the future
of the Grenadian economy, it is crucial that young people are now educated and trained in
trades that will be in demand in the future. That is why it is so important that on a regular
basis analyses are made of what the future has in store for the labour market. In this study, a
first attempt was made to do so. Our labour market projections have many limitations owing
to poor data. However, experiences in other countries in the Caribbean like Barbados show
that it is possible to improve the data situation to a reasonable level, enabling one to make
satisfactory projections.
The fact that most vacancies can be filled relatively easily does not mean that there is no
problem with labour as a factor of production. The results of our business survey show that
most employers are of the opinion that both young people and unemployed people (which are
partly overlapping categories) lack particular skills. Soft skills like self-initiative and attitude are
mentioned most often as being insufficient. But many young people and unemployed people
also lack, according to employers, basic numeracy and literacy skills. To a somewhat lesser
degree this is also the case for technical skills, but contrary to soft skills and basic skills,
technical skills can be acquired more easily at later age. Furthermore, the requirements for
technical skills tend to change with technological and market development. Therefore,
continuous training of workers is required.
Although most vacancies are filled relatively easily, there are some trades that probably will be
short in demand in the future. This is particularly true for management functions. So, for some
occupations, young people could indeed be advised to opt for a type of education that
qualifies them for these occupations.
Clearly, improving the connection between education and labour market will not solve the
shortage of jobs in the short term. But a good level of education may at least help young
people find a job abroad. Furthermore, education may have positive social effects. There is for
instance considerable evidence that if people are better educated they lead a more healthy
life. Indirectly, these effects may entail substantial benefits to society. But then there is still the
question what the government can do to improve the employment situation.

43
Before we turn to these themes, it is important to note that a number of important issues
could not be addressed in this study. Gender inequality is one of these. Labour force
participation is lower among women compared with men, while women are facing a much
higher unemployment rate than men. There is no evidence that women do worse in education
than men. It is more likely that the poor labour situation of women is only one aspect of a
general gender inequality. It is also said that women are paid less for the same type of work.
However, information on pay broken down by gender is completely lacking.18
Another important issue not covered is the poverty problem. In order to find solutions for
these problems, more information must become available. For example, in most countries,
women earn less than men for the same type of work. For several countries estimates are
made for this gender gap in pay. But for Grenada hardly any information about pay exists. In
fact, the business survey that was carried out within the framework of this study is one of the
first sources providing information on pay. However, as the number of questions had to be
limited in view of obtaining a reasonable response no attempt was made to ask for
information on wages for male and female workers separately. What kind of information
needed for this type of analysis is shortly discussed in the next section, which is about
improving the data situation.
The structure in this chapter is as follows. In section 5.2 we discuss what policies can be
implemented to improve the connection between education and the labour market and to
enhance the employability of workers. Then section 5.3 discusses what the government could
do to improve the employment situation. In the final section (section 5.4) we give specific
recommendations for improving the data situation.
5.2 Improving the connection between education and the labour
market and the employability of workers
Both interviews held with various stakeholders in Grenada and the employers’ survey point at
the “disconnect” between education and the labour market, as well as limitations regarding
the employability of workers.
In the interviews with some stakeholders, the following general points were raised regarding
skills shortages and skills gaps of young people in Grenada:19
18 For a recent gender assessment we refer to Baksh (2013). Country Gender Assessment. Report
commissioned by the Caribbean Development Bank. Barbados, November 2013 (draft). We also refer to
a draft version of the Gender Equality Policy and Action Plan for period 2014-2019.
19
Skill shortages refer to the lack of people with certain skills and, hence, the difficulty that employers face to fill certain vacancies with appropriately skilled applicants. It is a measure of quantitative deficits..

44
- Young people lack self-confidence and self-initiative. The type of work that is
realistically available to them given their education has a low status. This affects their
motivation and work attitude negatively;
- The earlier indicated lack of personnel for middle management and supervision has
partly to do with the lack of self-confidence and self-initiative;
- Education is too academic. Young people do not learn to apply what they learn. The
TVET component is weakly developed. There is no stimulation of creativity at school
and no appreciation of industry. There should be more technical schools;
- Young people graduate and hope to get a good job. But private entrepreneurship is
not sufficiently developed.
The formal education system comprises pre-primary, primary and secondary education, as well
as education at post-secondary and tertiary level. The T.A. Marryshow Community College
(TAMCC) and St. Georges University are the major providers of secondary and post-
secondary/tertiary education and training in Grenada.
Enrolment in primary schools has declined since 2001, when it stood at nearly 20 thousand.
Enrolment in secondary education remained virtually unchanged at about 10 thousand in the
period 2001-2011. The annual number of graduation from secondary education ranged
between around 1,500 and 2,100 in that period.
Both enrolment in and graduation from St. Georges University (SGU) has increased in recent
years. (Details on education and training provision in Grenada are included in Annex 4.)
Enrolment at SGU rose to about 6,800 in 2011 and graduation to little over 1,300. The
increases were particularly due to higher numbers for Medicine and Pre Medicine, which
accounts for an overwhelming majority of students and graduates. However, graduation from
ICT-related studies also increased. This might have helped to avoid (substantial) shortages of
ICT specialists. Expectedly, a large share of the graduates from (PRE) Medicine will not enter
the Grenadian labour market.
TAMCC’s intention is to provide higher education to the Grenadian youth. Apart from this, it
also addresses the academic shortcomings of people outside the formal education system, as
is evidenced by the provision of training in GNTA programmes. TAMCC offers programmes in
the areas of Arts, Science and Professional Studies, Applied Arts and Technology, as well as in
Continuing Education (in full-time, part-time or evening classes). The latter focuses on
competency-based TVET training (providing CVQs).
Total enrolment in TAMCC has increased since academic year 2000/2001 to over 2,300 in
2011-2012. Enrolment in the academic programmes was about 2,000 in both 2011-2012 and
2012-2013. Enrolment in continuing education was nearly 400.
In one of the interviews it was said that TAMCC produced some 800 graduates last year, of
which some 200-250 in vocational education. Nearly 800 students graduated in 2009 and
Skill gaps refer to lack of certain skills among members of the existing labour force. It is a measure of qualitative shortcomings.

45
about 900 a year later. Around 240 received a certificate in these years and 500-600 an
Associate degree.
It is generally recognized that there are weaknesses in the formal education system in
Grenada, already at the level of primary education. Education is often considered to be too
academic and insufficiently oriented at making the transition from school to the world of work,
because of lack of attention to development of social and life skills, insufficient development
of basic numeracy and literacy skills, as well of self-initiative and technical skills. The results of
the survey among employers presented in the previous chapter also point in this direction.
It is tried to remedy some of the identified weaknesses, by introducing the new subject of
Social and Life Skills in education. Also TVET-related crafts are introduced in grades 6 and 7 of
primary education.
In the area of training for unemployed people, the Ministry of Youth launched a large training
project for people in the age of 18 to 38 years called the new IMANI.20 The scheme is meant
for jobless people and basically tries to repair what is missing in initial education. It
furthermore provides vocational education and training. There is some overlap with training
provided by TAMCC.
The GNTA develops occupational standards and provides technical and vocational education
and training (TVET) in Grenada in four sectors with potential demand for labour. The training is
provided in the framework of the OECS Skills for Inclusive Growth Project and is delivered by
selected pre-qualified training providers, among which TAMCC. The aim was to train and
certify 1,200 unemployed youth of 18 to 30 years of age, over a three-year period.
Training for development of technical, professional and soft skills is also provided by:
- GIDC (entrepreneurship development)
- The Granada Employers’ Federation ( especially in industrial health and safety)
- The Grenada Hotel & Tourism Association (a CARIBCERT certification programme)
- The Contractors’ Association
- The marine sector (a kind of apprenticeship training)
Finally, several individual companies have made efforts to train young people, but it is difficult
for them to train young people during slack periods. The number of training places tends to
vary with the activity level. Hence, some type of government support seems to be needed.
This opinion was also expressed by several employers who were interviewed for the 2013
Employers’ survey.
The various training programmes address some of the shortcomings of the education system
and intend to improve the transition to the labour market and the employability of both
employed and unemployed persons.
20
It officially started on 1 July 2013.

46
However, the key issue is to improve the formal education system to improve the connection
with the labour market in the longer run, while in the mean time trying to address
inadequacies in technical and soft skills of people who currently cannot find a job by providing
them training. It is suggested to:
- Improve the development of basic and soft skills in education
- Stimulate the development of entrepreneurial skills in education
- Encourage cooperation between government and private sector regarding
development of technical skills, whereby a role can be played by a system of
apprenticeships21
- Provide practice-oriented training to currently unemployed persons.
In addition, it appears necessary to change the teaching methods, by shifting the focus from
traditional class room teaching and demonstrations in which the teacher transfers knowledge
and information towards more practice-oriented learning in smaller groups, whereby the
teacher plays more the role of a coach.
Finally it should be mentioned that it is difficult for young people to choose a particular field in
vocational education. There is virtually no information about which occupations are in
demand in the labour market. But for a really good choice, young people in school must have
indications about the type of occupations that will be in demand once they finish their
education. If vocational courses take three years indications must be available about the
labour market situation three years ahead. Both our labour market projections and our
employers’ survey must be seen as first attempts to provide this information. These exercises
should be improved and repeated every two years or so. Possibilities for improvement depend
strongly on the data situation. We come back to that in Section 5.4.
5.3 Improving the employment situation
Key problems identified in the labour market at this moment are insufficient demand for
labour, mismatches and a lack of specific skills. The results of the 2013 Employers’ Survey also
point at lack of some skills, in particular technical and vocational skills, but also soft skills.
Sometimes foreign labour has to be brought in. There is however no condition that foreign
workers train local people when they are issued a work permit.
While there is currently insufficient demand for labour in Grenada, this may change in the
future, partly by stimulating that people start their own business, but also related to the need
to replace currently employed persons who will leave the labour force.
21
It should however be avoided that apprentices displace regular employees.

47
The forecasts of Chapter 3 suggest that there will be future growth in the primary sector and a
reduced contribution to GDP of the secondary sector and of tourism-related industries.
At the same time, Grenada is looking at the development of new sub-sectors to stimulate the
demand for labour. These range from ICT to energy (especially renewable energy), agro-
industry/agro-processing, health and education (e.g. medical tourism), the marine sector
(especially marina) and activities within the tourism sector. Apparently, in fishing it is also
possible to make economic benefits.
The Grenada Investment Development Corporation (GIDC) makes sector profiles and identifies
opportunities within sectors or sub-sectors.22 In 2011, it developed an investment promotion
strategy, which was approved by government. It should be noted that identification of
opportunities is not done by GIDC and the government only. Social partners are also involved
in identifying opportunities.
Initiatives are already taking place in the ‘new’ (sub-) sectors. Currently, there are huge public
investments being made in agriculture. In agro-processing, there is foreign investment in
chocolate production. It is important to take into consideration possible supply limitations. For
example, the company Baron Food, which produces pepper sauce, intended to export pepper
sauce from Grenada two years ago, but could not get the sufficient amount of peppers to
produce the sauce. The reason for that was insufficient fertilization. Hence, activities in
agriculture and in agro-processing should be developed in a coordinated way.
GIDC has identified that in the field of ICT there may be opportunities in call centres and
medical billing (for which more specific skill sets are needed). There are already two call
centres in Grenada. More needs to be done to develop the skills for jobs in call centres and
medical billing. Skills development is important, whatever sector you look at. It seems that St.
George’s University is interested in getting involved in training for medical billing.
In the area of tourism, additional demand for labour is expected related to the opening of a
hotel in Grenada by Sandals. In other sectors there are also opportunities, but the possibility to
generate jobs may be smaller.
Reforms have been made to enhance the business climate. For example, E-services are
possible as of July 2013. But making improvements has to be a continuous process.
A possible limitation for the development of new activities is that Grenada is a high-cost
location, among others because of the high cost of electricity (which is imported from
Trinidad) and high port charges.
A critical issue for the success of implementation of the strategy is the availability of human
resources. Particularly middle management and supervisory staff is said to be insufficiently
22 See also http://www.grenadaworld.com/InvestorsGuide/SectorProfiles/tabid/110/Default.aspx

48
available in Grenada. In light of the forecasted growth in demand for managers (as well as
technicians and (associate) professionals), this issue needs attention.
While generating employment opportunities in Grenada is important, an issue raised by
several interviewed stakeholders is that finding a job in Grenada is not the only positive labour
market outcome of education and training. If someone finds a job elsewhere, this must also be
seen as positive, not only for the person educated or trained, but also for Grenada:
- as a result of higher remittance payments;
- as a result of people gaining work experience in other countries, which is brought to
Grenada when they return.
Grenada has been reported to have one of the highest rates of emigration among tertiary
educated persons.23 There is also a high rate of immigration, but the net migration rate was
estimated to be five thousand in 2008-2012.24 There is free movement of (skilled) labour
within the Eastern Caribbean. Migration to Grenada of skilled people, particularly of people
from the region, could also be seen as positive and can help to improve the employment
situation. One could see the Eastern Caribbean labour market as the relevant labour market.
Currently, the Ministry of Labour does not appear to play an active role in the generation of
employment opportunities. The scope of its work is limited. It basically deals with labour
disputes, controlling and executing labour laws and handling applications for work permits,
and hardly deals with employment services. People who call the Ministry are sometimes
advised in job search. Some 40 to 45 unemployed people are assisted per month, and some 3
to 5 school leavers per week.
There are no programmes for self-employment at the Ministry of Labour. Local people who
want to establish a business do not go to the Ministry of Labour, but to the Grenada
Investment Development Corporation (GIDC).
Even if economic policy is successful in creating the conditions for job growth, unemployment
is likely to stay high. Public Work Programmes are a means to provide employment for the
jobless. These programmes can be used to improve Grenada’s infrastructure and at the same
time help avoiding that people stay unemployed for such a long time that they become totally
disconnected from the labour market. However, these programmes are only successful if they
target disadvantaged groups that do not have any alternative source of employment, even if
the economy improves. Hence, Public Work Programmes only ‘work’ if they are managed by
people who know the potential pitfalls of these programmes. Another possibility is what is
often referred to as ‘social return’. The Government commissions contracts to private
business, for instance contracts for constructing public buildings. In these cases the
government can require that the contractor hires a certain percentage of his staff (five per
cent for example) from the pool of unemployed.
23
In 2000, nearly 85 per cent of tertiary educated of 25 years and above emigrated to OECD countries, see http://wdi.worldbank.org/table/6.13 24
http://data.worldbank.org/indicator/SM.POP.NETM

49
Suggestions for policy are:
- giving more attention to employment services for unemployed persons
- enhancing cooperation between the Ministry of Labour and the GIDC to stimulate self-
employment
- attaching the condition of provision of training of a Grenadian to the issuance of work
permits
- public work programmes and social return programmes as long as they are designed
and implemented in such a way that lock-in effects and displacement effects are
avoided
- trying to address possible future shortages of particular skills by collecting information
on expected developments and equipping persons with such skills by means of
education and training
Finally, more labour market research into the gender inequality issue is needed (to address
questions like: How big is the gender gap in pay? How can employers be stimulated to give
equal opportunities to men and women?, etc.).
5.4 Improving the data situation
Labour Force Survey
From time to time a Census is held in Grenada. Assuming that Census data gives a reliable
picture of the level and structure of the population and of employment, this offers a
benchmark for surveys to be held between two Censuses. As far as we know, two such surveys
have been held between the Census years 2001 and 2011. However, the results of these
surveys do not seem consistent with the Census outcomes. A precondition for reliable surveys
is an up-do-date registration of the population. If such a registration exists, a survey of
sufficient size will produce reliable results if the response rate is sufficiently high. The data is
only useful if it allows one to make a breakdown according to a number of important
characteristics like:
- the type of industry and the type of occupation a person is working in;
- personal characteristics like field and level of education, age, etc.
The survey size must be such that there are at least two thousand respondents with a job. In
that case, it is possible to make reliable breakdowns according to job characteristics and
personal characteristics. This is important, as surveys are the only source of information about
many of these characteristics of employment during the period in between two Censuses.
Furthermore, with such a sample size we would have about four to five hundred observations
on unemployed persons, making it possible to give a more detailed picture of unemployment.

50
Unemployment is a severe problem in Grenada and knowing more about it is the first step in
solving it.
But even with a large sample size non-response may lead to bias. Often people that do not
respond have different characteristics than the ones that do respond. On the basis of the
population registration it is possible to find out how non-response differs between different
types of households. These results, together with patterns observed in the latest Census, may
be used to correct for bias. Later, data from two subsequent Censuses could be used to further
analyse non-response from surveys held between the two Censuses. This would help to build a
consistent data system spanning a longer period of time. Given the fact that Censuses and
household surveys are the only reliable sources for many labour market variables, surveys on a
yearly basis (except of course for Census years) would be desirable.
What subjects should be incorporated? The most important ones are:
- labour market status (employee, self-employed, unemployed, internship, non-employed;
distinction between main activity and second (and even third) activity);
- a question indicating whether a job is in the formal or in the informal sector.
- Job characteristics (type of industry and size of employer, occupation, type of contract,
tenure, number of hours worked, pay, job satisfaction).
- educational status ( full-time student; part-time student; being trained);
- level and field of the highest level of education attained;
- subjective judgment about the relationship between personal competencies and job
requirements (no discrepancies, over-qualified, under-qualified, field of education does
not match type of job).
- if trained during the year previous to the survey, characteristics of the training;
- personal characteristics (age, gender, marital status, number of children, health
situation25);
- participation in specific social programs;
- subjective well-being.
A questionnaire containing this set of questions could still be feasible if the questions are kept
as simple as possible. With this set of questions a survey would provide relevant information
on a broad category of social issues.
Over time there can be good reasons for making changes in the questionnaire. An obvious
drawback of such changes is that the comparability between surveys is reduced. An
information system that is not consistent over time is less useful. Therefore, changes should be
avoided as much as possible. And if a question is changed it is advisable to include the old
question too, the first time the new version is used.
25
It has been shown that a simple question asking how a person experiences his or her own health is a very good predictor of both physical and mental health.

51
In some countries like the Netherlands the Labour Force Survey contains a longitudinal
component. A certain part of the people surveyed in year t is surveyed again in year t+1. This
makes it possible to measure mobility. For example, how many people that were unemployed
in year t have a job in year t+1 (or vice versa). Mobility is a very important phenomenon in
understanding how the labour market works. Therefore, the Central Statistical Office should
seriously consider including a longitudinal element in the Labour Force Survey. However, the
introduction of frequent Labour Force Surveys has in our view more priority. Once this is
established, incorporating a longitudinal component would be a second step.
Business surveys
Frequent Labour Force Surveys in addition to Censuses, would give a lot of information
allowing research into the supply side of the labour market. However, labour market outcomes
also depend on the demand side: the behaviour of employers. Therefore, surveys among
employers are useful too. There are several types of employer’s surveys. The one that was
carried out within the framework of this study was an in-depth survey covering several topics.
The most important are:
- employment flows (job vacancies, job turnover and job separations);
- problems (if any) in filling vacancies;
- expectations concerning sales and employment in the next few years;
- human resource management (feedback to workers about their performance, training,
etc.);
- employers’ views on the performance of their own workforce and on the expected
performance of groups in search of a job (school-leavers, unemployed persons);
- remuneration.
A limitation of employers’ surveys is that by definition they are restricted to employers
operating in the formal market. Hence, they do not provide estimates of total employment. It
is possible to obtain information on the informal sector, but that would require a different,
more demanding approach.
Administrative data
In a number of countries, such as the Netherlands, administrative employment data has been
made available for research. Employers have to provide information on each worker to the
national social security organization. Hence, at the central, level information is available on
each job in the formal sector. The following characteristics of workers and jobs are included:
age, gender, type of contract, starting date of contract, ending date (if a worker has left) and
pay. This data forms the backbone of the Dutch labour market information system. It may also
be a future option for Grenada.

52
Data on international migration
Grenada has been reported to have one of the highest rates of emigration among tertiary
educated persons.26 There is also a high rate of immigration, but the net migration rate was
estimated to be five thousand in 2008-2012.27 There is free movement of (skilled) labour
within the Eastern Caribbean. Migration to Grenada of skilled people, particularly of people
from the region, could also be seen as positive. One could see the Eastern Caribbean labour
market as the relevant labour market.
However, we could not take migration into account in the analysis for lack of access to
information on migration disaggregated by age, labour force status and educational
attainment.
It would be useful to collect this kind of information.
The educational system
One of the features of a proper labour market information system is that it contains
information on;
- educational attainment by age, gender and level and field of education;
- flows between the different parts of the educational system, like the number of students
moving from secondary to tertiary education broken down by age and gender;
- the number of students leaving education with or without a diploma broken down by age,
gender and level and field of education;
With the help of this type of information, it would be possible to make projections of the
number of young people leaving education broken down by age, gender and level and field of
education. These projections can then be confronted with the future number of job openings
available for young people. The latter could be projected using the labour information
provided by the Labour Force Survey and other sources of information about the labour
market.
It seems to be possible to obtain the information about education from administrative sources.
However, only little information could be obtained for this study. The government is not giving
a good example. This was also our experience with the survey among employers. In the private
sector the response rate was much higher than in the public sector.
26
In 2000, nearly 85 per cent of tertiary educated of 25 years and above emigrated to OECD countries, see http://wdi.worldbank.org/table/6.13 27
http://data.worldbank.org/indicator/SM.POP.NETM

53
Accessibility of data
It is highly important that existing information becomes quickly available for research and for
the public in general. Our experience is that data availability is not entirely satisfactory in
Grenada. Some important data like data on unemployment that was already processed more
than a year ago could not be used. Labour market information systems and applied research
that helps shaping and evaluation public policies will only work if this is changed.
Improving the system step by step
Developing and improving a labour market information system takes time. In our view, the first
step should be to have a Labour Force Survey of sufficient size each year. A lot of effort should
be invested in improving the quality of the Survey, making sure that the data is comparable
between different years.
We also advise to repeat the employers’ survey on a regular basis, perhaps every two years.
Finally, we recommend that school leaver surveys are conducted, to assess in which jobs
graduates end up and what the connection is between the knowledge and skills acquired in
education and the world of work.

54
Annex I: Terms of Reference 1. BACKGROUND INFORMATION ON THE PROJECT
Over the past years the rapid deterioration of the global economy has contributed to a
slowdown in the pace of economic activity in Grenada as experienced by most other countries
in the CARICOM region. This without a doubt has contributed to a high level of unemployment
in the country and an even higher unemployment rate among the youth. Notwithstanding this,
it is anticipated that the Grenadian economy will turn around and the economies will return to
economic robustness once more. With the anticipated turn around in the Grenadian economy
there will be greater employment opportunities for youth if they are trained with the right skill
sets.
In this regard, the Government of Grenada (GOG) is committed to addressing the need of
providing relevant skills for unemployed youth to enter the labor market, as well as further
opportunities for career advancement. The OECS emphasizes the need to enhance the skills of
its citizens and to generate sufficient quality job opportunities to reduce crime and violence
among youth and absorb a greater number into the labor force. The GOG is committed to
improving the employability of the unemployed youth and other marginalized sections of the
population with the relevant technical and life skills to enter the labor market and build a high
quality labor force through training/retraining and enterprise development initiatives. These
skills will enable youth to participate in opportunities where there is potential for job creation.
Consequently, the GOG has secured financing from the World Bank (International
Development Association) to implement the OECS Skills for Inclusive Growth Project (the
Project), which aims at increasing the employability of youth through demand-driven training
by equipping them with the skills, knowledge and attitudes sought by employers. The Project
particularly targets disadvantaged youth and focuses mainly on four sectors including
Agriculture, Construction, Hospitality and Tourism, and Marine, which had been identified as
key economic drivers.
The Project is consistent with the GOG's Education Strategy which includes increased emphasis
on the development of occupational skills. With Project support, the GOG will be able to
increase the employability of youth through the establishment of a competitive training
scheme that finances private sector-driven training, traineeships and the development of an
improved policy framework for delivering training by enhancing OECS collaboration and
introducing occupational standards to increase quality and value of training.
The Project is implemented jointly by the GNTA and the Project Coordination Unit (PCU) of the
Ministry of Finance and Economic Development. One of the components of the Project is to
strengthen the policy framework for delivering training, which includes the development of a
Policy Action Plan for Labour Market Needs Assessment. Currently, several government

55
agencies collect data on labor, economic development, tourism revenues, and educational
statistics.
Labor reports will discuss employment by sector but specific data drilling down to occupational
streams within sectors are lacking. Against this background a Labor Market Needs Assessment
is needed that will serve to analyse the needs and trends of the market place as well as to
provide more relevant information on the skill gaps to more effectively anticipate and plan for
skills training for youth and to improve the efficiency and effectiveness of technical and
vocational training in Grenada.
2. OBJECTIVE(S) OF THE ASSIGNMENT
The general objective of this assignment is to conduct a Labour Market Needs Assessment in
Grenada, which would identify the skills gaps, in the anticipated sectors for economic growth,
which include agriculture, agro processing, health and wellness renewable energy, ICT and
marine along with the targeted sectors, and the specific occupational streams within each
sector, for the period 2013-2018.
In conducting the assignment, the Consulting Firm is required to assess the employment gaps
in Grenada in all sectors with emphasis on the targeted economic sectors including
agriculture, agro processing, health and wellness renewable energy, ICT, marine, construction
and hospitality & tourism, and to identify the job opportunities for young persons (ages 16-40)
including vulnerable youth. The Labour Market Assessment should provide the GOG with
information on the specific employment needs in Grenada that would inform future training
plans and the formulation of policies and programs for skills training that correspond to the
current and projected labor market needs.
The specific objectives of this assignment are:
To an objective consultancy services in identifying the current and future employment gaps in all sectors (formal and informal) in the Grenadian economy with emphasis on the main sectors mentioned above.
To identify the occupational streams where skilled personnel are needed within the priority sectors mentioned above based on current and future projections.
To identify the levels and ranges of specific skills required and to forecast the quality and numbers of skilled persons that needs to be trained for wage and self-employment in the occupational streams for a five year period (2013 – 2018).
Assess the employment trends over the past five years based on workers’ qualifications and job experience and indicate demand for the coming five years;
Identify job opportunities available for the young people (ages 16-40) and other marginalized sections of the population.
Consistent with projected demand, outline occupational streams and levels for which new training programs should be facilitated and areas for further expansion of existing training programs.

56
To identify employers’ concerns regarding the deficiencies in the professional profile of applicants, new employees, or new entrants to the labour market and the nature of the deficiencies (i.e. experience alone or competency standards framework).
To develop a profile of employees who would meet the expectations of potential employers in the occupational streams of the priority sectors.
To examine the benefits, risks and challenges for implementing demand-driven skills training in Grenada this will include the willingness and interest from government, employers, training providers and youth through focus group consultations.
To provide recommendations or a guide to the government for updating this labor market assessment and how often it should be undertaken.
3. SCOPE OF WORK
The Consulting Firm will carry out the following activities, inter alia:
Be well versed on the current demographic, educational, socio-cultural and economic situation in Grenada.
Based on information collected above, summarize expected economic growth of key sectors in the Grenadian economy from existing Government reports for the period 2013-2018 and assess the related employment needs in the priority sectors divided into appropriate sub-sectors.
In consultation with the Department of Statistics in Grenada, develop a data collection strategy and a survey instrument. The design of the survey should be based on best practice for labor market needs assessments and be tested and pre-approved by the Government prior to initiating the survey. This instrument, at a minimum, should request the following types of basic information: - Type and size of the organization as well as its products and/or services; - Type and number of persons employed by the organization; - Wages/salaries for entry-levels; - Minimum level of education required and preferred for full-time employment; - Required work experience or certification for employment as an entry-level; - Degree of difficulty finding qualified personnel; - Projected number of full-time and part-time job openings and in what
occupational streams (2013-18); - Types of training/skills the organization would like its employees or prospective
employees to have (profile); and what training does the employer currently offer if any;
- Number of vacancies currently unfilled at the firm and the skills, experience and qualifications required filling these vacancies.
- The importance the employer places on life skills versus technical skills for potential employees at entry level and upper levels.
- Select a representative sample of potential employers proportional to sector size in the economy and establishment size. Potential employers in all major ISIC (International Standard Industrial Classification) sectors should be selected in consultation with the Department of Statistics for the quantitative study.
Test data collection instrument (survey) by conducting a pilot test of the survey instrument and process.

57
Utilize local survey/data gathering firm to conduct the surveys.
Supervise survey/data gathering firm to carry out the survey among (500) employers in the priority sectors and sub-sectors to:
Document the expected hires detailed into specific occupations for the next five years. This equally includes surveying employers about the desired skills (technical as well as soft/personal skills) for these hires. Further, the importance of each skill should be rated.
Receive feedback regarding the ability of the applicants, new employees, or new entrants to the labour market. This should be divided into education level skill level (technical and soft skills), and provide overall comments for improvements.
Assess the current challenges faced by employers in finding appropriately trained employees.
Indicate if employers are using competency standards or familiar with the profile of Level One certified persons in their sector.
Conduct industry-specific focus group discussions with stakeholders that may be comprised of employers, potential trainees, unemployed youth, training providers, appropriate line Ministries (e.g., Ministry of Education and Human Resources Development, department of Public Administration, Ministry of Finance and Economic Development, NTA, the Trade Union Council, Grenada Employers Federation, Labour Department, Statistics Department, National Insurance Scheme, Chamber of Commerce, Sector Associations, and consultants (sector specific resource persons) to collect qualitative data and understand contextual issues.
Conduct the data analysis and produce the report.
4. EXPECTED OUTCOMES
The outputs of the consultancy will comprise:
Inception Report to include:
- A detailed work plan developed in consultation with officials from the Project Coordination Unit and the National Training Agency on how the assignment will be conducted;
- A detailed plan for conducting the employers’ survey and analysis of the information generated
A summary of the findings of the initial meetings conducted with employers and relevant stakeholders;
A list of relevant information, documents required in order to complete the assignment;
A set of data collection tools, including the tested survey instrument agreed and cleared with the Government
Electronic copy of raw data collected
Reports from stakeholder consultations
Final reports to include: - Identification of existing and projected skill gaps for the period 2013-2018,
including identification of occupation streams within priority sectors with the highest demand for new employees and related skills;

58
- Identification of skill sets and a profile of employees who would meet the expectations of potential employers in the occupation streams identified above;
- Identification of key challenges currently faced by employers in finding the required skills, and recommendations for addressing these challenges;
- Recommendations on future skill training to be offered in Grenada, including the skill areas to be expanded, the options to stimulate and sustain greater investment in training by employers and individuals, or any other issues which would contribute to more relevant and responsive training provision in Grenada; and
- Assessment of capacity to deliver the proposed training, including the identification of the required training equipment and facilities,
All reports shall be submitted in English. Draft copies of reports may be submitted by
electronic mail. An electronic copy and three hard copies of the Final Report formatted in
Microsoft Word/Excel shall be submitted.
The Consulting Firm shall ensure the timely submission of these outputs to the Project Steering
Committee for review. The Committee will ensure the timely review and acceptance of the
reports, not more than two (2) weeks after the receipt of the reports from the Consulting Firm.
All reports and documents relevant to this Consultancy including field survey notes, computer
programmes, etc. shall become the property of the Government of Grenada.
The raw data, data analysis and final report will be the property of the Government of Grenada
at the completion of the assignment.

59
Annex II: List of persons met
Name Position Organisation
Mr. Jude Bernard Managing Director JBA Consulting
Ms. Peron Johnson Portfolio Manager Project Coordination Unit, Ministry of
Finance
Ms. Margaret Belfon Project Coordinator Project Coordination Unit, Ministry of
Finance
Mr. Lincoln Marlin CEO National Training Agency
Mr. Roderick Griffith Coordinator - Standards and Planning National Training Agency
Mrs. Marilyn Austin-Cadore Permanent Secretary Ministry of Education and Human
Resources (MEHR)
Mr. Andrew Augustine Chief Education Officer Ministry of Education and Human
Resources (MEHR)
Mr. Javan Williams Permanent Secretary Ministry of Labour
Ms. Sparkle Grenade
Courtney Labour Officer Ministry of Labour
Mrs. Elizabeth Cyrus Senior Labour Officer Ministry of Labour
Mr. Mike Sylvester Deputy Permanent Secretary Ministry of Finance, Planning, Energy &
Cooperatives
Ms. Annette Moore Assistant Coordinator Ministry of Youth
Ms. Nadine Let Skills training officer Ministry of Youth
Mr. Halim Brizan Director Central Statistical Office (CSO)
Mr. Lawrence Director GHTA
M. Pancy Cross Executive Secretary GHTA
Ms. Sandra James Project Coordinator/Director The Heritage Theatre Company/Grenada
Coalition of Performing Arts
Mr. Jason Fletcher Yard Manager Grenada Marine
Ms. Bridget Asing Representative Creative Designs (Sector Construction)
Ms. Sonia Roden CEO Grenada Investment Development
Corporation (GIDC)
Mr. Gordon Raeburn Representative The Grenada Technical and Allied Workers
Union (TAWU)
Mr. Abel Newton Executive Secretary Grenada Employers’ Federation (GEF)
Mr. Joseph Mitchell Representative Bank and General Workers Union (BGWU)
Mr. Justin Davis Representative Public Workers Union
Mr. David Flemming Dean TAMCC School of Continuing Education
Dr. Nigel Gravesande Registrar TAMCC
Ms. Eslyn Lewis Deputy Registrar TAMCC
Mr. Alan Robinson Project Coordinator CARCIP Ministry of ICT

60
Annex III: Methodology used for the projections
A3.1 Projecting GDP by industry
We want to project the GDP shares of the various industries. Industries will react differently on
economic growth. If the economy develops, the share of some industries will increase, but that
of other industries will decline. However, other factors, some of which are industry-specific,
may also affect the GDP shares of the various industries. Anyhow, there are no data about
these factors. We will therefore use a time trend to cover the influence of these factors. The
model used to explain the development of the GDP share of industry s (shgdp) is then:
where GDP stands for macro GDP, POP for population, and t for time. The α’s are unknown
coefficients.
In order to guarantee that the GDP shares add up to 1, we use one industry n as the
numéraire. So, the model to be estimated is:
t
We use the primary sector as the numéraire. The coefficients have been estimated by OLS. The
results are shown in Table A3.1.
Table A3.1 Results of OLS regressions for GDP shares (t-values in parentheses)
Constant term GDP per capita Time trend Adjusted R-Square
Secondary sector 120.7 (3.0) 0.339 (5.2) -0.062 (-3.1) 0.69
Trade, hotels and
restaurants
53.9 (2.2) 0.189 (4.8) -0.028 (-2.2) 0.66
Transport and
communication
60.4 (2.2) 0.256 (5.9) -0.032 (-2.3) 0.76
Financial sector 17.1 (0.7) 0.186 (4.4) -0.009 (-0.7) 0.70
Collective sector -73.3 (-3.5) 0.159 (4.7) 0.036 (4.7) 0.90

61
Given projections for macro GDP and population projections, the industry shares in GDP can
be made with the help of these regression results.
The following formulas can be derived from the previous one:
If we assume that the GDP share of the collective sector remains at its 2012 level (33 per cent),
then the formula for shgdpnt slightly changes. In that case, the summation does not include the
collective sector. Furthermore, the formula must be multiplied by 0.67.
A3.2 Projecting employment by industry
For 2001 and 2011 we dispose of data about production per worker for each industry.
Table A3.2 Production per worker: data (2001 and 2011) and projections (2012-2018)
Primary sector
Secondary sector
Trade, Hotels and Restaurants
Transport and communication
Financial sector
Collective sector
2001 0.020356 0.025339 0.02038 0.071411 0.140974 0.034625
2011 0.022111 0.033163 0.019622 0.069142 0.276107 0.033151
2012 0.022295 0.034067 0.019622 0.069142 0.295305 0.033151
2013 0.02248 0.034996 0.019622 0.069142 0.315838 0.033151
2014 0.022667 0.035951 0.019622 0.069142 0.337799 0.033151
2015 0.022856 0.036932 0.019622 0.069142 0.361287 0.033151
2016 0.023045 0.037939 0.019622 0.069142 0.386408 0.033151
2017 0.023237 0.038974 0.019622 0.069142 0.413276 0.033151
2018 0.02343 0.040037 0.019622 0.069142 0.442012 0.033151
For our projections, we assume that productivity is constant in the sector ‘Trade, hotel and
restaurants’, ‘Transport and communication’ and the collective sector. For these sectors we
assume that the 2011 level of productivity will not change between 2011 and 2018. For the
other sectors, we compute a trend on the basis of the 2001 and 2011 figures and extrapolate
this trend to the future.
Then employment can be computed by taking the ratio of productivity and production.

62
A3.3 Projecting employment by occupation and level of education
We explain the method used with the help of an example. Suppose there are 2 sectors (industries), 2 occupational groups and 2 educational and year 0 is the current period, while sectoral employment forecasts exist for years 1 and 2. The data used do not apply to Grenada. The results for Grenada can be found in Chapter 3.
Table A3.3 Employment forecasts (example: no real data)
Year Sector 1 Sector 2 Total employment
1 100 50 150
2 90 60 150
Now suppose that for the past we have observed the following occupational structure:
Table A3.4: Percentage shares of occupations in sectoral employment (example: hypothetical data)
Sector 1 Sec tor 2
Occupation 1 60% 20%
Occupation 2 40% 80%
100% 100%
So, 60 per cent of employment in sector 1 is made up by occupation 1 and 40 per cent by occupation 2. For sector 2, the percentages are 20 and 80, respectively. It is assumed that these percentages will also hold in the future. Now we can make the forecasts for employment in the two occupations in year 1 and 2:
Employment in occupation 1 in sector 1 in year 1 is: 60 per cent of 100 = 60.
Employment in occupation 1 in sector 2 in year 1 is 20 per cent of 50 = 10.
Hence, total employment in occupation 1 in year 1 is 70.
We can do the same for occupation 2 in year 1 and for both occupations in year 2. The results are given in Table A3.5.
Table A3.5: Employment forecasts by occupation (example: hypothetical data)
Occupation 1 Occupation 2 Total employment
Year 1 70 80 150
Year 2 66 84 150

63
Of course, for each year, adding up the figures for occupation 1 and 2 gives the same sum total as adding up the figures for the two sectors.
The step from occupation to education is similar to the one from sector to occupation. Suppose that in the past the following educational structure held for the occupations:
Table A3.6: Percentage shares of occupations in sectoral employment (example: hypothetical data)
Occupation 1 Occupation 2
Education level 1 50% 75%
Education level 2 50% 25%
100% 100%
So, half of the workers in occupation 1 have level 1 and the other half has level 2. For occupation 2, the corresponding figures are 75 and 25 per cent.
If we assume that this structure stays the same in the future, the projections of employment by level of education can be made as follows:
For level 1 in year 1: 50% of 70 plus 75% of 80=95
For level 2 in year 1: 50% of 70 plus 25% of 80=55
And we can do the same for year 2. The results are given in Table A3.7:
Table A3.7: Employment forecasts by level of education (example: hypothetical data)
Education level 1 Education level 2 Total employment
Year 1 95 55 150
Year 2 96 54 150
In this study we use six industries, five occupational groups and four educational levels.
Furthermore, the projection period is longer than two years. However, the method is exactly
the same.

64
Annex IV: Education and training in Grenada
The formal education system comprises pre-primary, primary and secondary education, as well
as education at post-secondary and tertiary level. Enrolment in primary schools has declined
since 2001, when it stood at nearly 20 thousand. Enrolment in secondary education remained
virtually unchanged at about 10 thousand in the period 2001-2011. The number of graduates
from secondary education fluctuated in that period, with a minimum of 1,537 in 2009/2010
and a record high of 2,096 in 2003/2004.28
The T.A. Marryshow Community College (TAMCC) and St. Georges University are the major
providers of secondary and post-secondary/tertiary education and training in Grenada.
TAMCC is a key provider of secondary and post-secondary/tertiary education and training in
Grenada. The College is a Government institution and receives a subvention from Government.
Previously it fell directly under the MEHR, but now it takes decisions independently, in
consultation with the sectors, etc. The Mission of the College is “…to cater to the needs of the
labour market …” However, it is important to keep in mind that labour market needs are
always dynamic.
There are three schools at TAMCC:
1. School of Arts, Science and Professional Studies (SASPS)
2. School of Applied Arts and Technology (SAAT)
3. School of Continuing Education (SCE).
Schools 1 and 2 primarily focus on providing educational certificates.29 School 1 has the
following departments:
- Nursery
- Pharmacy
- Business
- Natural Science
There are a specific number of places available. Regular programmes are run every year.
School 2 offers two-year programmes and has the following departments:
- Engineering
- Construction
- Hospitality & Tourism
28
Data provided by the Ministry of Education and Human Resources. 29
The Programme Catalogue 2013-2014 gives a brief description of the programmes that are offered (see http://www.tamcc.edu.gd/). Further details can be found in the description in http://www.tamcc.edu.gd/index.php/acedemics

65
Students graduate with an Associate degree. For some occupations, students graduate with an
Associate degree and CVQ.
School 3 provides extended services in areas that the other two schools provide, but part time
(in the evenings). The focus of the SCE is on competency-based TVET training (providing CVQs).
It has a close relationship with the NTA. It also provides full-time training to people who are
out of the formal education system, which caters persons of 16 years and above. The part-time
programme focuses more on employed persons. E.g., 22 persons of the Water and Sewerage
Authority participated. Now a second cohort is participating. When certified, they receive a
certificate of plumber at CVQ Level 3.
There is also an evening programme that targets unemployed persons, including
disadvantaged youth. This programme is sponsored and uses occupational standards approved
by the NTA. It provides opportunities for trainees to do an internship, which is a mandatory
component for NVQ/CVQ certification. It has three focus areas:
1. Agriculture
2. Hospitality & Tourism
3. Construction
According to evaluation, about 40% of persons were retained after apprenticeship in 2012. In
2013, the rate was somewhat less favourable, due to the market conditions.
In Schools 1 and 2 employers are involved as members of advisory groups. School 3 follows
Schools 1 and 2. Company staff is sometimes involved in delivering part of the training.
In the academic year 2012-2013, there were just over 2000 students in Schools 1 and 2 of
TAMCC. There has been a displacement of males by females in areas where males used to be
dominant. Table A4.1 shows the number of students enrolled in 2011-2012 and indicates that
about a fifth of the total is enrolled in the School of Continuing Education.
Table A4.1: Enrolment at TAMCC – Academic year 2011-2012
SASPS 1,437
SAAT 507
SCE (full time) 57
SCE (part-time) 316
SCE (evening classes) 29
TOTAL 2,346
Source: Authors’ elaboration based on data provided by TAMCC
Figure A4.1 shows that enrolment in TAMCC has increased since academic year 2000/2001.

66
Figure A4.1: Enrolment in TAMCC – 2000/2001 to 2011/2012
Source: Authors’ elaboration based on data received from MEHR
In one of the interviews it was said that TAMCC produced some 800 graduates last year, of
which some 200-250 in vocational education.
Graduation data are available for 2009 and 2010. Table A4.2 reveals that the total number of
graduates was nearly 800 in 2009 and about 900 a year later. Around 240 received a certificate
in these years and 500-600 an Associate degree.
Table A4.2: Number of Graduates from TAMCC
2009 2010
Certificate level 240 236
Diploma 0 12
Associate degree 534 656
Bachelor’s degree 8 0
TOTAL 782 904
Source: TAMCC, Annual Report 2008-2010, page 43
Five hundred (500) students graduated from the SASPS in 2009, and 578 in 2010 (Table A4.3).
In both years, around 200 students graduated from the SAAT with either a certificate or an
Associate degree (Table A4.4). The numbers presented in the tables 5.3-5.5 imply that
graduation from the School of Continuing Studies was respectively 70 and 130 in 2009 and
2010.
0
500
1000
1500
2000
2500
3000
20
00
/01
20
01
/02
20
02
/03
20
03
/04
20
04
/05
20
05
/06
20
06
/07
20
07
/08
20
08
/09
20
09
/10
20
10
/11
20
11
/12
School of Continuing Education
School of Applied Arts and Technology
School of Arts, Science & Professional Studies

67
Table A4.3: Number of Graduates from TAMCC - School of Arts, Sciences and Professional
Studies
2009 2010
Certificate in Agriculture 6
Diploma in Early Childhood 12
Other 500 560
TOTAL 500 578
Source: TAMCC, Annual Report 2008-2010, page 21
Table A4.4: Number of Graduates from TAMCC - School of Applied Arts and Technology
2009 2010
Certificate level 113 84
Associate degree 99 112
TOTAL 212 196
Source: TAMCC, Annual Report 2008-2010, page 14
Table A4.5 shows that both enrolment in and graduation from St. Georges University has
increased in recent years. Graduation from ICT-related studies also increased. This might have
helped to avoid (substantial) shortages of ICT specialists.

68
Table A4.5: Enrolment and Graduation from St. George’s University – Academic Years 2009-
2011
Enrolment Graduation
2009 2010 2011 2009 2010 2011
Accounting, Business, Management, Economics (SAS) 166 167 149 25 29 37
Doctor of Medicine, (SOM) Pre-Medicine (SAS) 4,553 4,858 5,254 640 761 942
Doctor of Veterinary Medicine, (SVM) Pre-Veterinary Medicine (SAS) 565 543 603 108 98 110
Information Technologies, Management Information (SAS) 133 115 91 24 29 27
Life Sciences(SAS) 158 170 179 26 28 49
Medical Sciences (SOM) 68 57 40 58 38 28
MPH, MSPH, MSC (SOM) MBA (SAS) 156 194 237 84 76 93
Other Program 345 294 239 31 68 33
PhD or Other Doctoral 3 5 6 - - -
Tourism and Hospitality (SAS) 22 31 16 2 4 4
Total 6169 6434 6814 998 1131 1323
Source: Authors’ elaboration based on data received from MEHR
Total enrolment in NEWLO has fluctuated somewhat over the years since academic year
2000/2001, but enrolment in the adolescent programme was more stable (Figure A4.2).
Figure A4.2: Enrolment in NEWLO – 2000/2001 to 2011/2012
Source: Authors’ elaboration based on data received from MEHR
0
100
200
300
400
500
600
700
Total Adolescent Development

69
In the area of training for unemployed people, the Ministry of Youth launched a large training
project for people in the age of 18 to 38 years called the new IMANI.30 The scheme is meant
for jobless people and basically tries to repair what is missing in initial education. It
furthermore provides vocational education and training. There is some overlap with training
provided by TAMCC. Employers are involved in the programme. Monitoring and evaluation of
the programme will be done.
Each participant is offered a three-month self-development course which concentrates on soft
skills. Career guidance is given during that course. After the three-month course, one or more
of the following options are available:
People may enter a skill training course offered through the NTA, which last one
month up to one year. Hence, there is a second-chance component.
They also may enrol in apprenticeships for two years.
There is a three months training for those who want to start a small business.
There is the possibility to be referred to the scholarship desk of the MEHR (to access
the loan programme).
Four thousand (4,000) participants have been selected already. The programme can
accommodate about 1,000 persons per batch. Every three months the inflow is planned to
equal 1,000 persons. The programme will last five years. It has a budget of EC$16 million
annually.
In terms of training, GIDC has an entrepreneurship development programme. The Granada
Employers’ Federation (GEF) does provide training, especially in industrial health and safety,
and banks also have good arrangements with workers in providing training.
The Grenada Hotel & Tourism Association (GHTA) recently completed a CARIBCERT
certification programme, which was launched in March 2011 in Grenada. The programme was
funded by DFID and administered by the Caribbean Development Bank. The objectives of this
programme are:31
1. Lift the standard of the service industry – to increase the competitiveness of Grenada’s
tourism product, and
2. Increase employee marketability and employment opportunities of workers in the
Grenada tourism sector in CARICOM
Nearly 500 CARIBCERT certificates had been awarded to management, supervisory and
operational staff in the hospitality industry in Grenada.32
The Contractors’ Association also provides training. However, currently there is no lack of
supply of technical staff, as engineers and architects are coming back from the United States.
30
It officially started on 1 July 2013 31 PowerPoint presentation CARIBCERT Study & Industry Quality Standards. Findings, Conclusions and
Recommendations prepared by Michael V. Julien, 24th
April 2013. 32
Joanne Glyde (2013). Grenada CARIBCERT Programme. Final Report 2013. Prepared for Caribbean Development Bank.

70
The projections in Chapter 3 also suggest that a shortage of technical staff is not likely to arise
in the construction industry, as employment in the secondary sector (of which construction
forms a part) is projected to decline until 2018.
In the marine sector there is a kind of apprenticeship training. The manufacturers and dealers
of engines provide training.
The GNTA develops occupational standards and provides technical and vocational education
and training (TVET) in Grenada in four sectors with potential demand for labour. The training is
provided in the framework of the OECS Skills for Inclusive Growth Project and is delivered by
selected pre-qualified training providers, among which the T.A. Marryshow Community College
(TAMCC). The aim was to train and certify 1,200 unemployed youth of 18 to 30 years of age,
over a three-year period. Two programmes were started in mid-December 2010, with 40
unemployed youth offered the opportunity to be trained in technical skills in the areas of Food
and Beverage Restaurant Service and Industrial Security Operations. Respectively 16 and 15
trainees completed the technical training in April/May 2011. Only some of them started (and
completed) the subsequent Traineeship period. The first 16 National Vocational Qualifications
were awarded in July 2011.
In the course of 2011, GNTA started with another seven training programmes in various
occupational areas in which 134 trainees enrolled (Table A4.6).
Table A4.6: Number of Trainees Enrolled in Second Cycle of GNTA Training
No. TRAINING PROVIDER OCCUPATIONAL AREA Start Date
NUMBER AT START
NUMBER AT CURRENT Drop Out
1 TAMCC FOOD & BEVERAGE: SERVER 24-Nov-11 20 14 6
2 TAMCC DATA OPERATIONS 17-Nov-11 17 12 5
3 TAMCC GENERAL OFFICE ADMINISTRATION 24-Nov-11 17 15 2
4 GREYS TYPING SCHOOL DATA OPERATIONS 13-Sep-11 20 18 2
5 TELFA CHARLES ELECTRICAL INSTALLATION 20-Sep-11 20 19 1
6 CHALENE SCHOOL OF COSMETOLOGY GENERAL COSMETOLOGY 8-Nov-11 20 20 0
7 STEPHEN JEROME FOOD & BEVERAGE: SERVER 19-Aug-11 20 12 8
TOTAL
134 110 24
Source: GNTA (2012). Annual Report 2011, page 16. St. George’s: National Training Agency (www.grenadanta.gd).
A third call for training proposals was issued in November 2011.

71
Annex V: Questionnaire for the 2013 Employer’s Survey
[to be added as separate document to final report]