greenwich township school district proposed budget 2009-2010 public hearing: april 2, 2009
TRANSCRIPT
Greenwich Township School District
Proposed Budget
2009-2010Public Hearing: April 2, 2009

Agenda
This presentation provides an overview of our financial expectations for the 2009-2010 school year.
The intention of this budget is to provide curriculum and instruction which will enable all students to achieve the Core Curriculum Standards and implement the proposed planning process as described in the District’s Annual Report.
Superintendent’s Comments
Budget Goals
Total Budget
Revenues
Expenditures
2009-2010 State Aid Summary
2008-2009 vs. 2009-2010
Local Tax Levy Analysis
Ratables
Budget Highlights for 2009-2010
Cost Saving Measures

Perfect Budget Storm
• State and County Pressure
• Loss of Ratables
• Current Economy
• Good News!
• Bad News
• Good News!

STATE BUDGET DOLLARS FOR EDUCATION
1. Hawaii 89.9%
2. Vermont
3. Arkansas
4. New Mexico
5. Minnesota
6. Delaware
7. Washington
8. Michigan
9. West Virginia
10. North Carolina
11. California
12. Nevada
13. Kentucky
14. Kansas
15. Alaska
16. Idaho
17. Alabama
18. Wisconsin
19. Oregon
20. Oklahoma
21. Utah
22. Mississippi
23. Indiana
24. Montana
25. Iowa
26. Arizona
27. South Carolina
28. Wyoming
29. Georgia
30. Massachusetts
31. Missouri
32. Tennessee
33. New York
34. Colorado
35. Ohio
36. Louisiana
37. Maine
38. New Jersey 41.3%
39. Florida
40. Rhode Island
41. Virginia
42. Maryland
43. New Hampshire
44. Connecticut
45. North Dakota
46. Pennsylvania
47. Texas
48. South Dakota
49. Illinois
50. Nebraska 31.5%

2009-2010 Budget Goals
• Continued emphasis on curriculum and instruction toward enhancing student achievement. The District has planned for the purchase of additional textbooks, maintaining the current level of classroom supplies, and increasing technology.
• Continued emphasis on the use of technology toward enhancing student achievement. The proposed budget includes plans to maintain educational programs and updating current technology.
• Continued emphasis on staff development toward enhancing student achievement. Five full day sessions for staff development are planned for 2009-2010.
• Continued emphasis on providing a safe and secure learning environment toward enhancing student achievement. The district has continued to make a commitment in the amounts budgeted in maintenance for both buildings.

2009-2010 Total Budget
General Fund: $11,015,050
Special Revenue Funds:
FEDERAL: No Child Left Behind (NCLB) Title I Part A, Title I I Part A & D, Title IV, IDEIA Part B Basic & Preschool
$ 230,193 STATE: Nonpublic Entitlements (Technology, Textbooks, Basic Skills, Speech, and Nursing)
$ 100,031 Total Special Revenue:
$ 330,224
TOTAL BUDGET $11,345,274
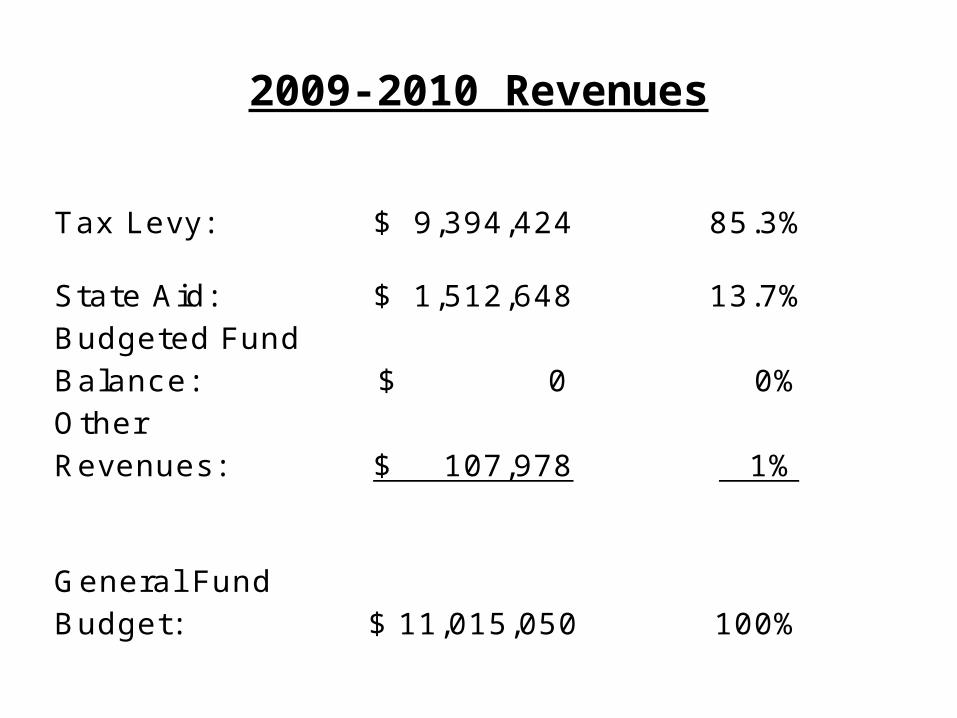
2009-2010 Revenues
Tax Levy: $ 9,394,424 85.3%
State Aid: $ 1,512,648 13.7% Budgeted Fund Balance: $ 0 0% Other Revenues: $ 107,978 1%
General Fund Budget: $ 11,015,050 100%

2009-2010 Revenues:Where the money comes from.
Fund Balance0%
Other Revenues1%
Tax Levy85.3%
State Aid13.7%
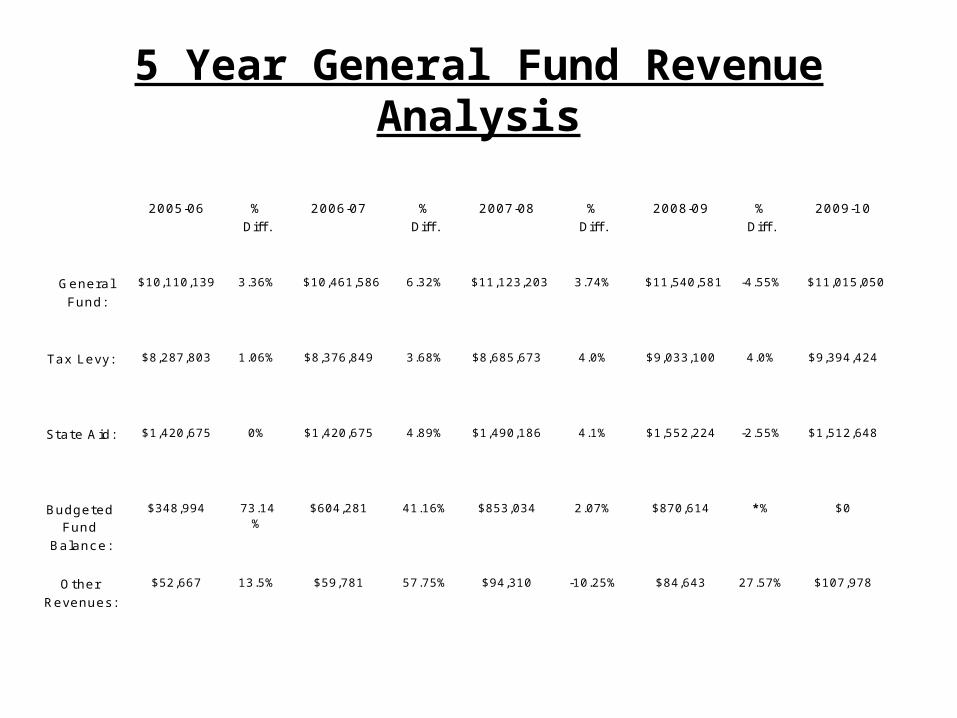
5 Year General Fund Revenue Analysis
2005-06 %
Diff .
2006-07 %
Diff .
2007-08 %
Diff .
2008-09 %
Diff .
2009-10
General
Fund:
$10,110,139 3.36% $10,461,586 6.32% $11,123,203 3.74% $11,540,581 -4.55% $11,015,050
Tax Levy: $8,287,803 1.06% $8,376,849 3.68% $8,685,673 4.0% $9,033,100 4.0% $9,394,424
State A id: $1,420,675 0% $1,420,675 4.89% $1,490,186
4.1% $1,552,224 -2.55% $1,512,648
Budgeted Fund
Balance:
$348,994 73.14%
$604,281 41.16% $853,034 2.07% $870,614 *% $0
Other
Revenues:
$52,667 13.5% $59,781 57.75% $94,310 -10.25% $84,643 27.57% $107,978

2009-2010 Expenditures
• Instructional Cost
• Employee Benefits
• Support Costs
• Maintenance/Operation
• Administrative/Business
• Transportation
• Capital Outlay
• Food Service
GENERAL FUND BUDGET
$5,306,577 48.2%
$2,051,636 18.6%
$1,329,938 12.1%
$1,051,621 9.5%
$ 651,940 5.8%
$ 480,342 4.4%
$ 3,000 <.1%
$ 139,996 1.3%
$11,015,050 100%

2009-2010 Expenditures:How the money is spent.
4.4%
12.1%
5.8%
9.5%
18.6%
48.2%
<.1%
1.3% Instruction
Benefits
Maint/Op
Admin/Bus
Support
Transport.
Food Service
Cap. Outlay

2009-2010 STATE AID SUMMARYAmount Percent Change
from 2008-2009
• Adjustment Aid $876,821 +35.54%
• Categorical Special Education Aid $320,808 +9.6%
• Equalization Aid $ 0 %
• Categorical Transportation Aid $245,382 +26.1%
• Categorical Security Aid $ 67,167 +1.8%
• Extraordinary Aid $ 2,470 -94.13%
• OVERALL CHANGE IN AID -$ 39,576 -2.55%
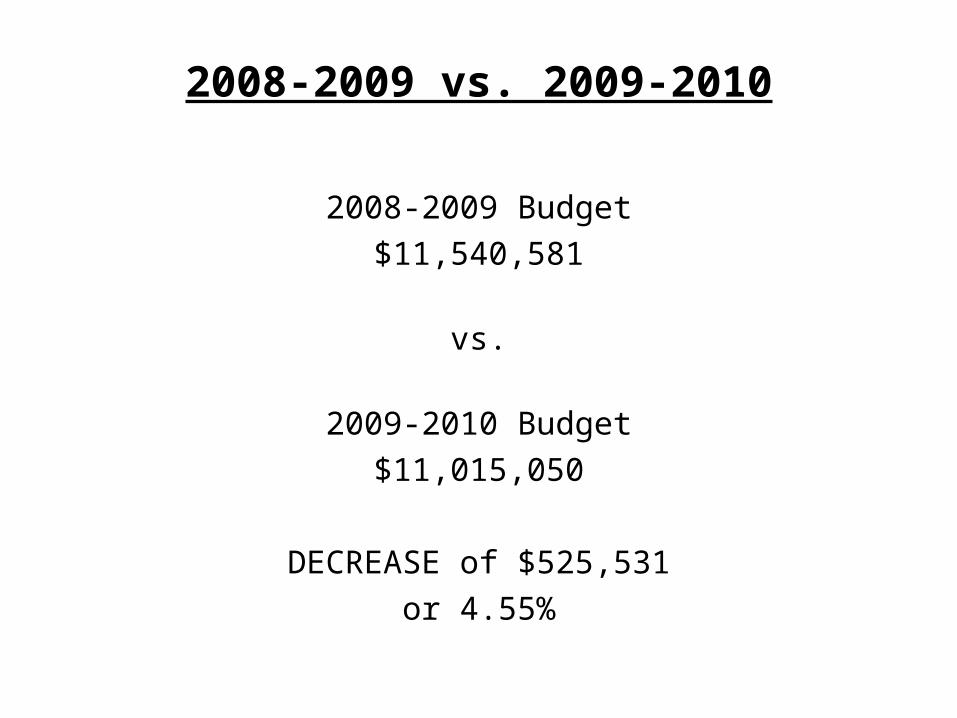
2008-2009 vs. 2009-2010
2008-2009 Budget
$11,540,581
vs.
2009-2010 Budget
$11,015,050
DECREASE of $525,531
or 4.55%
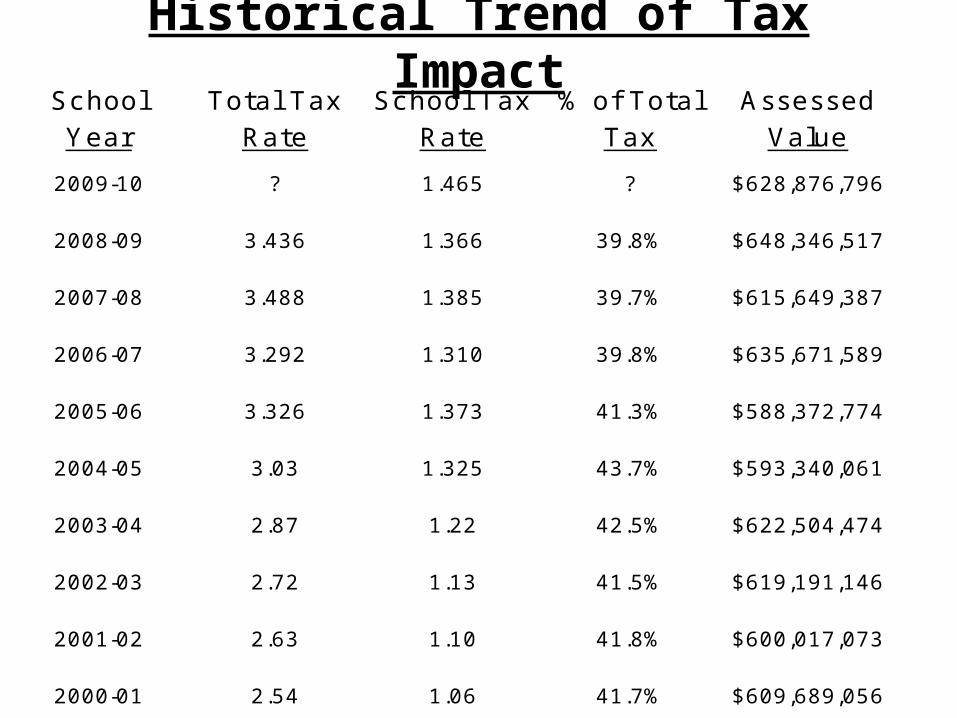
Historical Trend of Tax ImpactSchool Y ear
Total Tax Rate
School Tax Rate
% of Total Tax
Assessed Value
2009-10 ? 1.465 ? $628,876,796
2008-09 3.436 1.366 39.8% $648,346,517
2007-08 3.488 1.385 39.7% $615,649,387
2006-07 3.292 1.310 39.8% $635,671,589
2005-06 3.326 1.373 41.3% $588,372,774
2004-05 3.03 1.325 43.7% $593,340,061
2003-04 2.87 1.22 42.5% $622,504,474
2002-03 2.72 1.13 41.5% $619,191,146
2001-02 2.63 1.10 41.8% $600,017,073
2000-01 2.54 1.06 41.7% $609,689,056

Your 2008 General Tax Breakdown
Tax %Rate
County .774 22.54%
Co. Library .063 1.83%
Open Space .061 1.76%
Dist. School 1.366 39.76%
Local 1.172 34.11%
Total $3.436 100%
County
Library
Open Sp.
School
Local

As of 2008, the Greenwich Twp. School District HAS
THE FIFTH LOWEST* school tax rate in the
county!

2008 County Tax Rate Comparison(Sorted by lowest school tax rate to highest)
Munic ipality School Tax Rate Total Tax Rate % for Schools
Elk Newfield Wenonah Monroe Greenwich West Deptford Paulsboro Deptford Logan Twp. Franklin Twp. Woodbury Heights Harrison Twp. So. Harrison Twp. Clayton Glassboro Mantua Washington Twp. East Greenwich Woolwich Twp. Westville Pitman
1.120* 1.176* 1.324* 1.359* 1.366 1.883 1.895 1.953 1.959 2.145 2.296 2.381 2.391 2.455 2.524 2.635 2.681 2.700 2.768 2.768 2.808
2.199 2.204 2.373 2.549 3.436 4.084 4.752 3.784 3.375 3.980 4.259 3.875 3.562 4.758 5.110 4.684 4.726 4.237 4.605 5.282 5.073
50.93% 53.36% 55.79% 53.32% 39.76% 46.11% 39.88% 51.61% 58.04% 53.89% 53.91% 61.45% 67.13% 51.60% 49.39% 56.25% 56.73% 63.72% 60.11% 52.40% 55.35%

2008 County Tax Rate Comparison(Continued)
Munic ipality School Tax Rate Total Tax Rate % for Schools
Swedesboro Woodbury National Park
2.891 3.105 3.237
5.505 6.251 5.569
52.52% 49.67% 58.13%

School Tax Bill Comparison between 2008 and 2009
School Y ear School Tax Levy Total 2008
School Tax Levy
2008-2009 $9,033,100 1/2 $4,516,550.00
2009-2010 $9,394,424 1/2 $4,697,212.00
$9,213,762.00
2009 Net Valuation Taxable = $628,876,796
2008 School Tax Rate = $1.3665
2009 Proposed School Tax Rate = $1.4651 +9.86 cents

LOCAL TAX LEVY2000-2001 Tax Levy
2001-2002 Tax Levy
2002-2003 Tax Levy
2003-2004 Tax Levy
2004-2005 Tax Levy
2005-2006 Tax Levy
2006-2007 Tax Levy
2007-2008 Tax Levy
2008- 2009 Tax Levy
2009-2010 Tax Levy
Average Increase
$6,530,557
$6,607,888
$7,342,932
$7,851,103
$7,873,033
$8,287,803
$8,376,849
$8,685,673
$9,033,100
$9,394,424
$318,207

RATABLES
2000-2001 Assessed Value
2001-2002 Assessed Value
2002-2003 Assessed Value
2003-2004 Assessed Value
2004-2005 Assessed Value
2005-2006 Assessed Value
2006-2007 Assessed Value
2007-2008 Assessed Value
2008-2009 Assessed Value
2009-2010 Assessed Value
For 2009-2010, a penny is equal to:
$609,689,056
$600,017,073
$619,191,146
$622,504,474
$593,340,061
$588,372,774
$635,671,589
$615,649,387
$648,346,517
$628,876,796
$62,888

RATABLES(CONTINUED)
• If ratables remained the same as in 2008, the overall impact would be a 5.46 cent increase. ($1.3665 to $1.4211)
• With the decrease in ratables of $19,469,721 the overall impact is an increase of 9.86 cents. ($1.3665 to $1.4651) Remember, last year there was a tax decrease of 1.85 cents.

Budget Highlights 2009-2010
• Maintain Full Day Kindergarten.• Continue to provide field trip experiences to grades Pre-K to eight.• Maintain class size within State recommended levels in grades
kindergarten through eight as per NJQSAC.• Maintain the library program at NMS and Broad Street School.• Maintain all academic and extra-curricular activities.• Maintain district-wide technology capabilities.• Emphasis on curriculum and instruction through textbook purchases and
staff development.• Medical plan increase of 15% and Rx plan increase of 5%.• No increase on Property/Liability insurance.• 100% PERS obligation estimated in the amount of $136,879.• Increases in special education tuition and associated costs.• Continue to provide courtesy bussing.• Continue to provide maintenance in both buildings above what is
required as per N.J.A.C. 6:24. • Energy cost increases to operate both buildings.
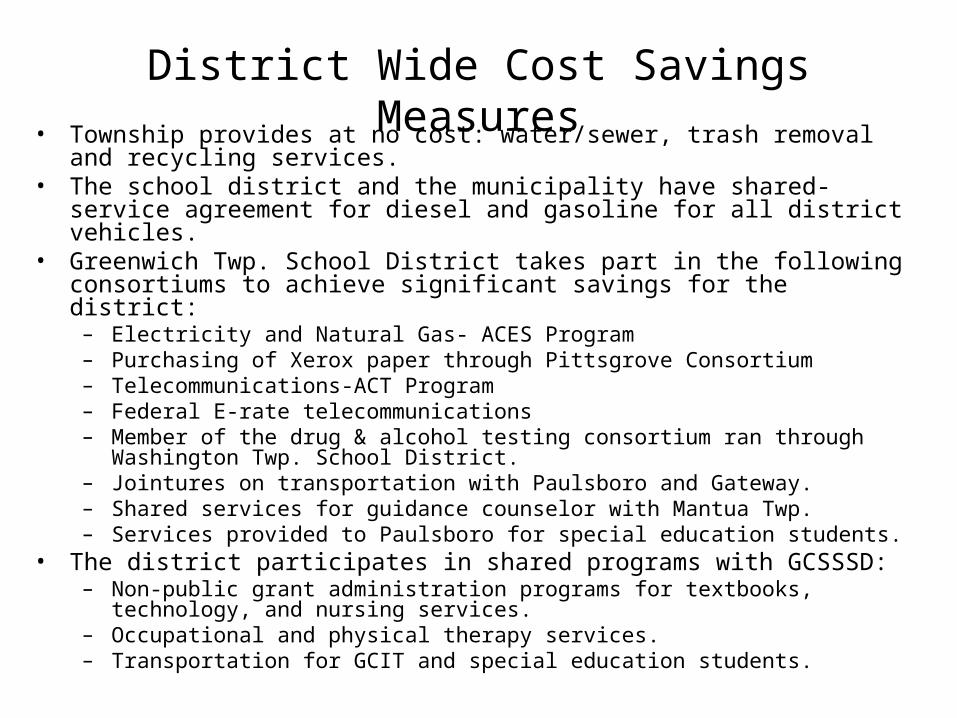
District Wide Cost Savings Measures• Township provides at no cost: water/sewer, trash removal and recycling
services.• The school district and the municipality have shared-service agreement for
diesel and gasoline for all district vehicles.• Greenwich Twp. School District takes part in the following consortiums to
achieve significant savings for the district:– Electricity and Natural Gas- ACES Program– Purchasing of Xerox paper through Pittsgrove Consortium– Telecommunications-ACT Program– Federal E-rate telecommunications– Member of the drug & alcohol testing consortium ran through Washington Twp.
School District. – Jointures on transportation with Paulsboro and Gateway.– Shared services for guidance counselor with Mantua Twp.– Services provided to Paulsboro for special education students.
• The district participates in shared programs with GCSSSD:– Non-public grant administration programs for textbooks, technology, and nursing
services.– Occupational and physical therapy services. – Transportation for GCIT and special education students.

Annual School Election
April 21, 2009
4:00 p.m. - 9:00 p.m.
Nehaunsey Middle School Gymnasium