greenland glacier albedo variability final report for … glacier albedo variability final report...
TRANSCRIPT

Greenland glacier albedo variability Final Report for NASA Grant NAG5-10600
Summary The program for Arctic Regional Climate Assessment (PARCA) is a NASA-
funded project with the prime goal of addressing the mass balance of the Greenland ice sheet. Since the formal initiation of the program in 1995, there has been a significant improvement in the estimates of the mass balance of the ice sheet. Results from this program reveal that the high-elevation regions of the ice sheet are approximately in balance, but the margins are thinning (Krabill et al., 2000). Laser surveys reveal significant thinning along 70 percent of the ice sheet periphery below 2000 m elevations, and in at least one outlet glacier, Kangerdlugssuaq in southeast Greenland, thinning has been as much as 10 d y r (Thomas et al., 2000). This study examines the albedo variability in four outlet glaciers to help separate out the relative contributions of surface melting versus ice dynamics to the recent mass balance changes. Analysis of AVHRR Polar Pathfinder albedo shows that at the Petermann and Jakobshavn glaciers, there has been a negative trend in albedo at the glacier terminus from 1981 to 2000, whereas the Stor+strommen and Kangerdlugssuaq glaciers show slightly positive trends in albedo. These findings are consistent with recent observations of melt extent from passive microwave data which show more melt on the western side of Greenland and slightly less on the eastern side. Significance of albedo trends will depend on where and when the albedo changes occur. Since the majority of surface melt occurs in the shallow sloping western margin of the ice sheet where the shortwave radiation dominates the energy balance in summer (e.g. Jakobshavn region) this region will be more sensitive to changes in albedo than in regions where this is not the case. Near the Jakobshavn glacier, even larger changes in albedo have been observed, with decreases as much as 20 percent per decade. Using a simple energy balance model to derive melt rates, a 20 percenvdecade decrease in albedo will result in 29 percent more melt at 500 m and 189 percent more
es Assessment of albedo n ffdf?$!fR:$%&r 8 , l O g g e n F a f at 5 m, an 5 e reen ices eet e g omasetal.,
from this program have revealed that the high- elevation regions of the ice sheet are approximately in balance, but the margins are rapidly thinning [Krabill and others, 20001. Laser surveys reveal significant thinning along 70% of the ice sheet periphery below 2000m elevations. At the same time, passive microwave-derived melt estimates show a l%/yr increase in melt area since 1979 [Abdalati et al., 20011. This melt is directly related to ablation through runoff and surface evaporation and indirectly linked to increased discharge through lubrication of
https://ntrs.nasa.gov/search.jsp?R=20040050637 2018-05-15T11:12:06+00:00Z

the be&ock/ice. Since the dominant source of energy for melting during summer comes from the absorption of solar radiation, the albedo becomes an important parameter in understanding melt. Unfortunately, there have been a limited number of studies on the variability of albedo of the Greenland ice sheet, in part because of the lack of reliable albedo estimates. Some studies have looked at the variability in albedo at certain locations around Greenland using satellite imagery [e.g. Stroeve,2002; and Kmp and Oerlemuns, 19961.
The Jakobshavn glacier is known to be one of the fastest discharge glaciers in the world, moving at a rate of approximately 7 km per year (-20 d d a y ) . This glacier is located in west Greenland (69.2”N, 49.8“w) and calves new icebergs into Disko Bay every day, some of which are several kilometers long. This greatest iceberg-producing glacier measures only 7 kilometers along its front and is 90 meters above sea level. Studies have shown that the total calving flux during summer is substantially greater than
anomalies [AbdQlati et al., 20011. However, Thomas et al. [2003] report sustained thinning of several meters per year within 20 km of the ice front since 1997. They conclude that the thinning since 1997 results from dynamic processes rather than increased melting or reduced snowfall. However, sustained changes in summer temperature will have an immediate impact on surface melt rates, which may affect glacier dynamics by lubrication of the bed by melt water. Therefore, an increase in
ik&@d&b6h8m&Mt---s for the Jakobshavn glacier and other glaciers, this study examined the albedo variability from April through September using satellite imagery at four outlet glaciers and 5 Automatic Weather Stations (AWS) sites near the Jakobshavn glacier. The longest, most consistent estimate of the surface albedo of polar regions comes from the Advanced Very High Resolution Radiometer (AVHRR) Polar Pathfinder (APP) data set. This product is used to examine albedo variability from 1981 to 2000. Data from the Moderate Resolution Imaging Spectro-Radiometer
d h l % b w m t i o n III discusses the albedo variability in the individual glaciers and the Jakobshavn region and shows how 2002 compares with the long term mean in western Greenland. Section IV discusses the significance of the albedo variability in western Greenland terms of changes in ablation and section V follows with a discussion as to some of the causes for the large reductions in albedo observed during 2002. 2. Data and Processing Steps 2.1 Study Region
s u l - € f l W m l b ~ 4 ~ ~ & e m 6 $ % # € ” a w & - Q s
( M ~ B ~ n $ ~ ~ ~ ~ ~ ~ ~ ~ ~ ~ ~ ~ ~ C ~ g ~ e
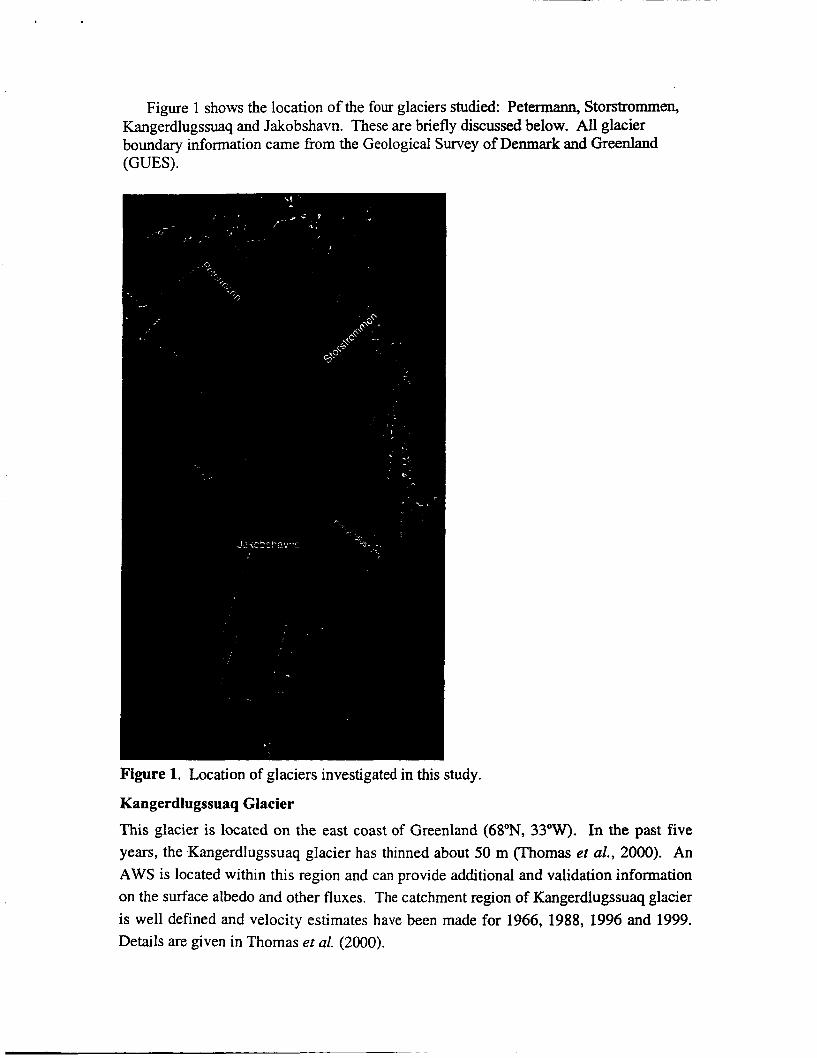
Figure 1 shows the location of the four glaciers studied: Petermann, Storstrommen, Kangerdlugssuaq and Jakobshavn. These are briefly discussed below. All glacier boundary information came from the Geological Survey of Denmark and Greenland (GUES).
Figure 1. Location of glaciers investigated in this study.
Kangerdlugssuaq Glacier
This glacier is located on the east coast of Greenland (68"N, 33"w). In the past five years, the Kangerdlugssuaq glacier has thinned about 50 m (Thomas et al., 2000). An AWS is located within this region and can provide additional and validation information on the surface albedo and other fluxes. The catchment region of Kangerdlugssuaq glacier is well defined and velocity estimates have been made for 1966, 1988, 1996 and 1999. Details are given in Thomas et al. (2000).

Storstremmen Glacier
Situated in northeast Greenland (77"N, 23"W) near Dove Bay and Danmarkshavn, this glacier has been quiescent in the past few years, after surging in the 1980s @@gild et al., 1994; Reeh et al., 1994). Thus, all current mass balance lossedgains at the stagnation point (77"N, 22.7"W) are attributable to ablation/accumulation variability. Petermann Glacier
Petermann glacier is a large glacier that is in a state of negative mass balance (Fhgnot et aZ., 1997). It has a catchment of 71,580 km2 and discharges at about 12 km3/yr. In 2002, there was about 1.5m ablation (K. Steffen, pers. comm.) A comprehensive new survey was performed in 2002 using the NASA airborne laser altimeter. These altimeter data have characterized both surface elevation and surface roughness and are new deployments of are planned for 2003 and into the future (W. Krabill, pers comm.). Moreover, Petermann is a very wide glacier with flat and shallow freeboard, and experiences a tremendous degree of basal melting - nearly ten times that of the ice shelves in Antarctica (Fhgnot, 1996). Thus, understanding the relative importance of *beg bas.melt is important for accurate interpretation of the balance mechanisms.
The Jakobshavn glacier (69.2"N, 49.8"W) in west Greenland is believed to by the fastest flowing glacier, with 7 km per year movement (2Odday). The glacier Jakobshavn catchment area lies within the dry-snow zone but a significant portion also includes the percolation and ablation regions with significant annual melt rates of several m 6' per year. Within this region of the ice sheet there are several automatic weather stations, which are part of the Greenland Climate Network (GC-Net) [Steffen e? al., 19961, starting with JAR 3 (69.2"N, 50.2W) at 323 m elevation, followed by JAR 2 (69.3"N, 49.5"W) at 650 m and JAR 1 (69.5"N, 49.7"W) at 962 m. At the equilibrium line altitude there is another AWS, the Swiss Camp (69.6"N, 49.3"W) at 1149 m. These stations provide data along the glacier and as such, they are useful for comparison with albedo estimates from
a o s a m acier
satellite imagery. Of all our study laciers, Jakobshavn is the one with the .most Fi ure shows aMIS i e of e J& hshavn lacier dra d ov adi 'tal levat c Apreiensive set OH a%%rne Eser aqtimeter %easurenKnts, %tinaLacE to MI. E!%\%%% altimeter mapping of the glacier took place in 1997, 1998, and 2002.

Figure 2. MISR image during May of the Jakobshavn glacier. The albedo is seen to be high surrounding the glacier tongue, albedo near 0.8, but on the glacier tongue the albedo is much lower, near 0.4 (bare ice).
2.1 AVHRR Polar Pathfinder Data
Pathfinder (APP) data set, archived and distributed by the National Snow and Ice Data Center (NSIDC). The data set is available twice daily at two different spatial resolutions, 1.25 km and 5 km. The 5 km data set spans July 1981 through December 2000, whereas the 1.25 km product only covers August 1993 through December 1998 for the northern hemisphere with significant gaps between 1993 and 1998. Product data include calibrated reflectances (visible channels) and temperatures (thermal channels) for five AVHRR channels, clear sky surface broadband albedo and skin temperature, solar zenith angle, satellite elevation angle, sun-satellite relative azimuth angle, surface type mask,
Clear sky surface albedo from 1981 to 2000 comes from the AVHRR Polar

cloud mask, orbit mask, and time of acquisition. The data have been composited onto two grids per day based on common local solar times and scan angle. Since the 1.25 km resolution data only have a limited temporal coverage, the coarser 5 km product was used instead.
For each station, as well as for the entire Jakobshavn drainage basin, clear sky surface albedo were extracted from the APP 5-km product. Although a cloud mask accompanies the APP data set, this cloud mask was found to be inadequate over Greenland [Stroeve, 20021. Therefore it was necessary to manually cloud filter all the albedo images. This was accomplished by visual inspection of the surface temperature and albedo images. Following filtering the images for clouds, monthly mean albedo were derived for each mo th f .A ril tfirou h Se tember. dnimum f 15 clear sk ima es wzj necessary to denve e on 1 ean albedo for each.&Sqqah n anrthe Agcfr r y o n composite $ (Reex$d&mages, discontmmes occur in #e surface e o si ce the albedo is dependent upon the solar zenith angle. To minimize this effect, all albedo were normalized to local solar noon, using a polynomial fit to modeled albedo simulations obtained using the Discrete Ordinates (DISORT) model [Stammes et al. 19881. In modeling the surface albedo a constant snow grain size of 250 microns was assumed. The e&F&-Ii WBEI&~&E@'MEW&%~F, a monthly departures from the mean (monthly anomalies) were calculated. The data were then resampled to 625-m using nearest neighbor sampling to overlay the albedo on a Digital Elevation Model @EM). The DEM used is an enhanced version of the DEM provided by KMS (Ekholm, with contributions from Bamber), using AVHRR images to improve the spatial detail of the interior of the Greenland ice sheet (no closer than 15km from the nearest rock exposure). The AVHRR images used in improving the DEM (approximately
35) HEXW$E~B&~ e ~ 8 M ~ ~ ' C e ~ ~ ~ ~ ~ ~ ~ ~ ~ ~ ~ ~ ~ e ~ ~ ~ ~ ~ ~ O f
@~@%&c?dk% situ-measured surface albedo at several AWS in Greenland, including two stations in the ablation region on the western margin of the ice sheet. Results from the study showed that the albedo was approximately 6% less (in terms of absolute albedo) than that measured at the AWS. In a more recent study, Ahlstrum (in press) compared APP albedo during 2000 in the ablation region along the western ice margin. Results indicated that the APP albedo was on average 4.2% (absolute albedo) less than that measured locally. The study also concluded that the narrow-to-broadband (NTB) model used in the APP product performed equally well over the entire range of broadband albedos from 0.09 to 0.63. This result is important to the present study since it %&%?@8~%@'%% 8&!!%@&now and ice albedo in the APP product.
To extend our study to include more recent years, the surface albedo for 2002 is derived for the Jakobshavn glacier using data from both MODIS and MISR flown on the Terra platform. Table 1 lists the number of clear-sky MISR and MODIS images processed. Surface albedo is derived from the MODIS Level 1B data gridded to the 1.25-
%.a8 d n , si ce hore ban one or 9 3 it is t IC ly uSed in &n k.e da&
plus

km EASE gnd using channels 1-5 following Stroeve and N o h [2003]. This method uses a linear combination of MODIS spectral channels 1-7 to derive the surface albedo. The MISR Level 1B data
Table 1. List
is used to derive the surface albedo at 275-m spatial resolution using a linear combination of the red channel multiangle measurements as described in Stroeve and N o h , 20021.
of Stroeve and N o h 12003; 20021 compare with in situ measurements available from some of the GC-Net AWS. In Figure 3(a), 53 MISR predicted albedo are compared with albedo measurements from 7 different AWS locations, including sites in the accumulation and ablation regions using MISR imagery acquired in 2000,2001 and 2002. Some large scatter is observed at low albedo values, which reflects the difficulty in
Figure 3(a) and (b) show how well the MISR and MODI 5: albedo using the methods
in the MODIS results than in the MISR results. Similar problems are observed in the AVHRR albedo and are in part a result of the accuracy of the Bidirectional Reflectance Distribution Function (BRDF) model used in converting from a directionally dependent satellite measurement to a hemispherical albedo measurement. When the satellite viewing angles are oblique, the BRDF model does not perform as well, and large errors in the surface albedo occur. Therefore, for the MODIS data, we limited the satellite
€i€W%&ned albedo from the MODIS 16-day (MOD43) albedo product [Schaafet aZ., 20023. This product includes black sky (direct beam directional hemispherical albedo) and white sky albedo (completely diffuse bihemispherical albedo) for the first seven spectral bands of the MODIS instrument as well as for three broadbands (0.3 - 0.7pm, 0.7-5.Opm, 0.3-5.0pm). Intercomparisons with in situ data at several of the AWS reveal that the MOD43 albedo is within 5% of the in situ albedo [Stroeve et al., submitted]. Here we use the MOD43 albedo product to examine the albedo from 2000-2002.
v i e ~ ~ ~ ~ ~ ~ ~ ~ ~ ~ ~ ~ ~ ~ ~ ~ ~ ~ ~ ~ ~ ~ l ~ ~ , W F

d
0.9 0.8 - 0.7 0.6 -
a Y
-- x * 6.
0.1 :::; 0 0 0.1 0.2 0.3 0.4 0.5 0.6 0.7 0.8 0.9 1
In Situ Albedo
Figure 3(a). Comparison between MISR-predicted and in situ measured surface albedo at several AWS sites in Greenland using data from 2000,2001 and 2002.
I 1 1 1
3 0.3
= 0.1 8 0.2
:::: 0 0 0.1 0.2 0.3 0.4 0.5 0.6 0.7 0.8 0.9 1
in Situ Albedo
Figure 3(b). Comparison between MODIS-predicted and measured surface albedo over Greenland using data from 2000 and 2001.
3. Results 3.1 Seasonal Variability of Albedo
The following figures summarize the seasonal variability in surface albedo for the drainage basin of the individual glaciers as defined by the comer points from GUES. Results are shown for three locations: at the glacier terminus, mid-way up the glacier and at the start of the drainage basin.
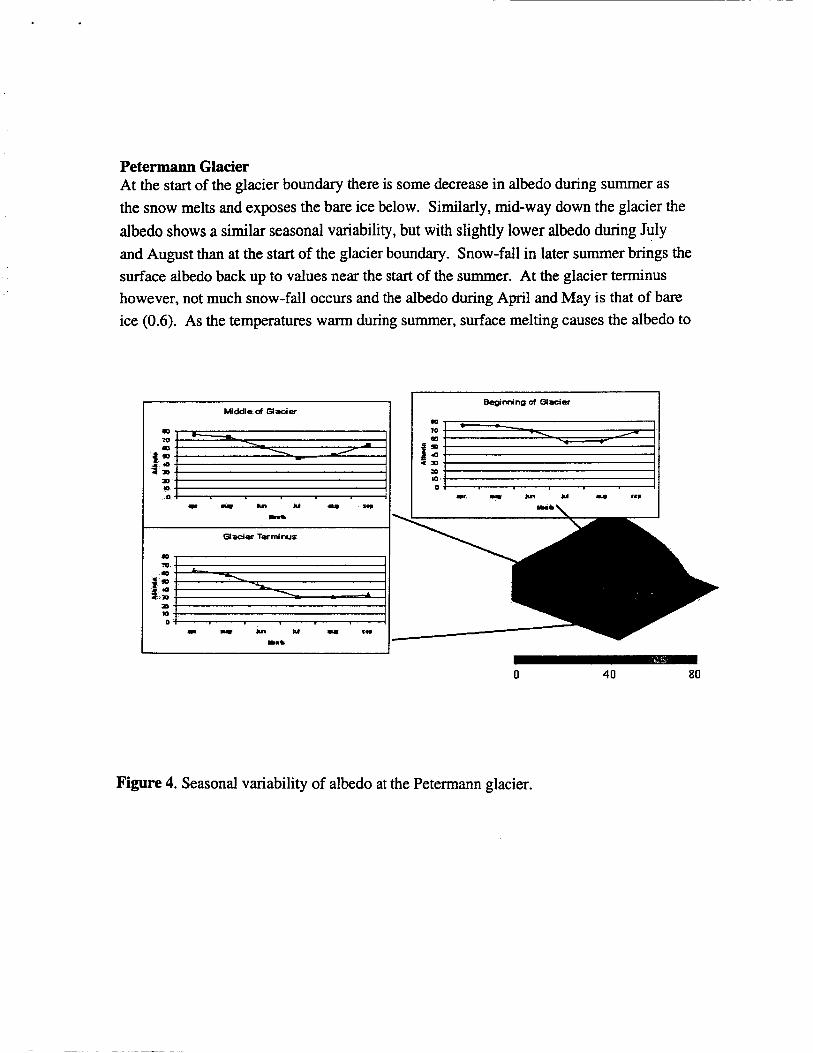
Petermann Glacier At the start of the glacier boundary there is some decrease in albedo during summer as the snow melts and exposes the bare ice below. Similarly, mid-way down the glacier the albedo shows a similar seasonal variability, but with slightly lower albedo during July and August than at the start of the glacier boundary. Snow-fall in later summer brings the surface albedo back up to values near the start of the summer. At the glacier terminus however, not much snow-fall occurs and the albedo during April and May is that of bare ice (0.6). As the temperatures warm during summer, surface melting causes the albedo to
I J
0 40 80
Figure 4. Seasonal variability of albedo at the Petermann glacier.

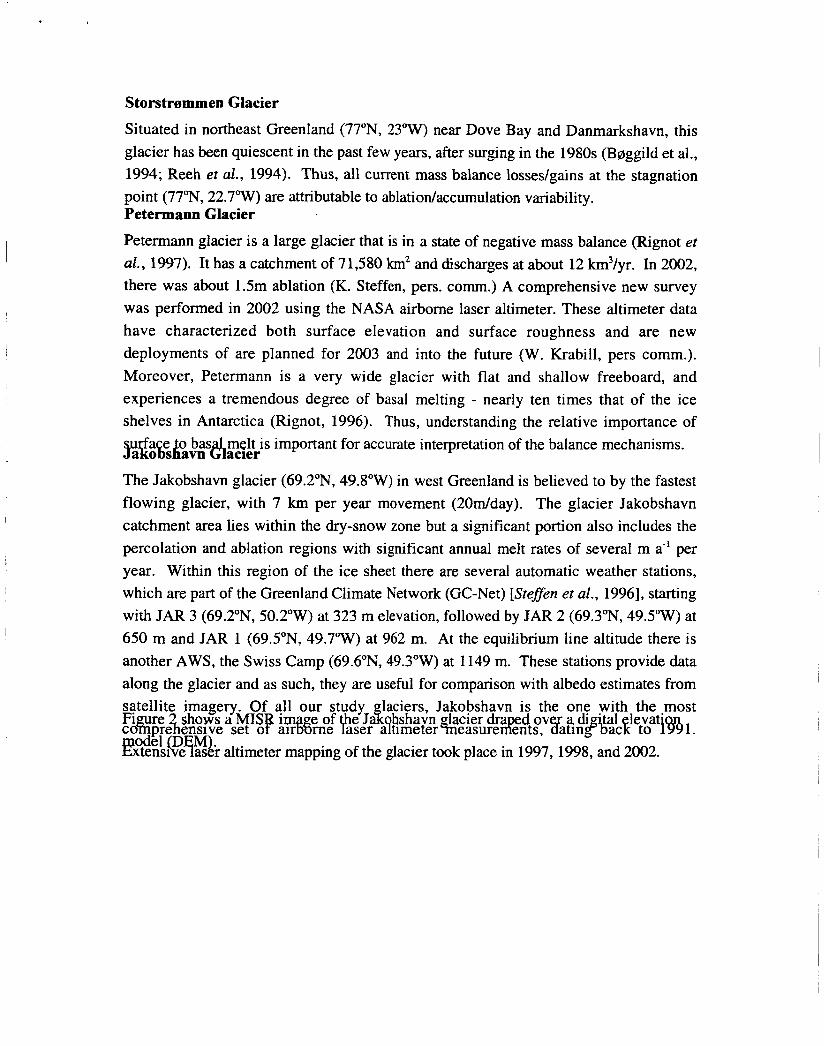
Kangerdlugssuaq Glacier The start of this glacier there is not much seasonal variability in the surface albedo. The elevations are above 2ooOm and thus little or no melt occurs. However, further downstream the snow does melt off the glacier during summer exposing the bare ice and at the glacier terminus the surface albedo remains low from July through September. In contrast to the Petermann glacier, the Kangerdlugssuaq glacier receives more snowfall whiph i c tpflerterl hw the hinher c i i r f i r ~ ilbrln x r i l i i e c rlnrinn A n r i l inrl AAov thrniinhniit
4 M d d r d Blbcia
I - 1 I I
Figure 5. Seasonal variability at the Kangerdlugssuaq glacier.
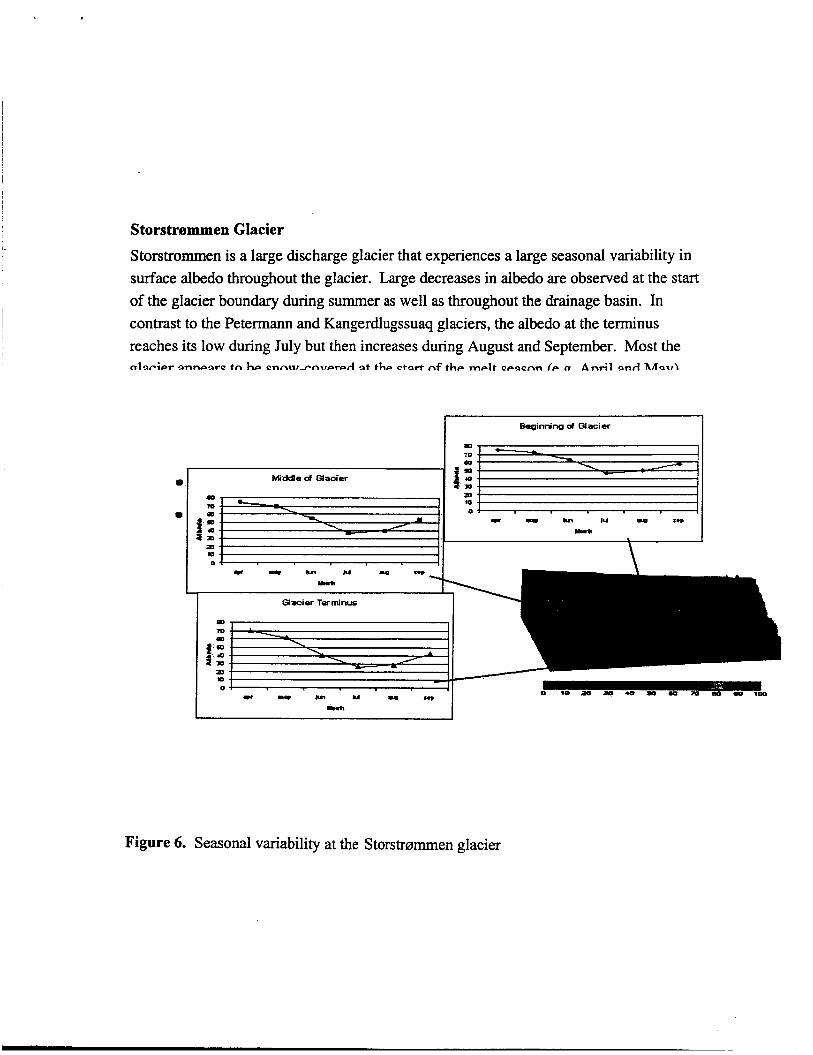
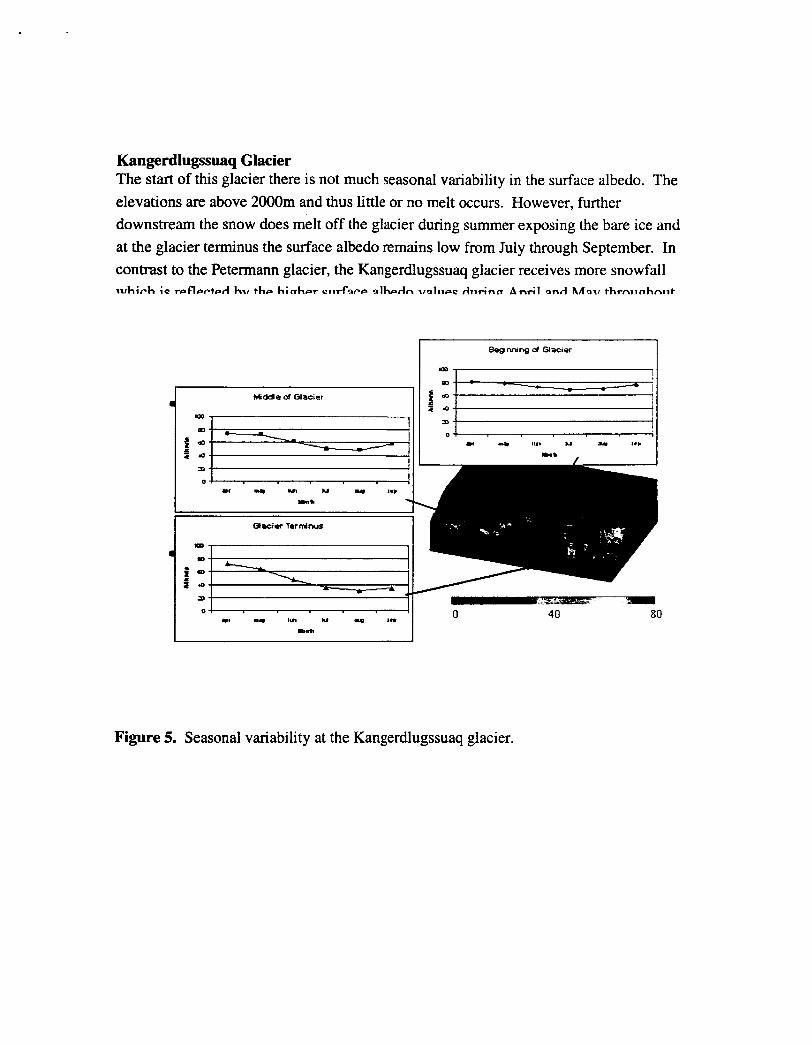
Storstrammen Glacier Storstrommen is a large discharge glacier that experiences a large seasonal variability in surface albedo throughout the glacier. Large decreases in albedo are observed at the start of the glacier boundary during summer as well as throughout the drainage basin. In contrast to the Petermann and Kangerdlugssuaq glaciers, the albedo at the terminus reaches its low during July but then increases during August and September. Most the nlarier an-arc tn hp cnnrrr - rnw=rml a t the c t a r t nf the melt ce-acnn f e m A n t i 1 and nAax1)
--
Figure 6. Seasonal variability at the Storstrmnmen glacier
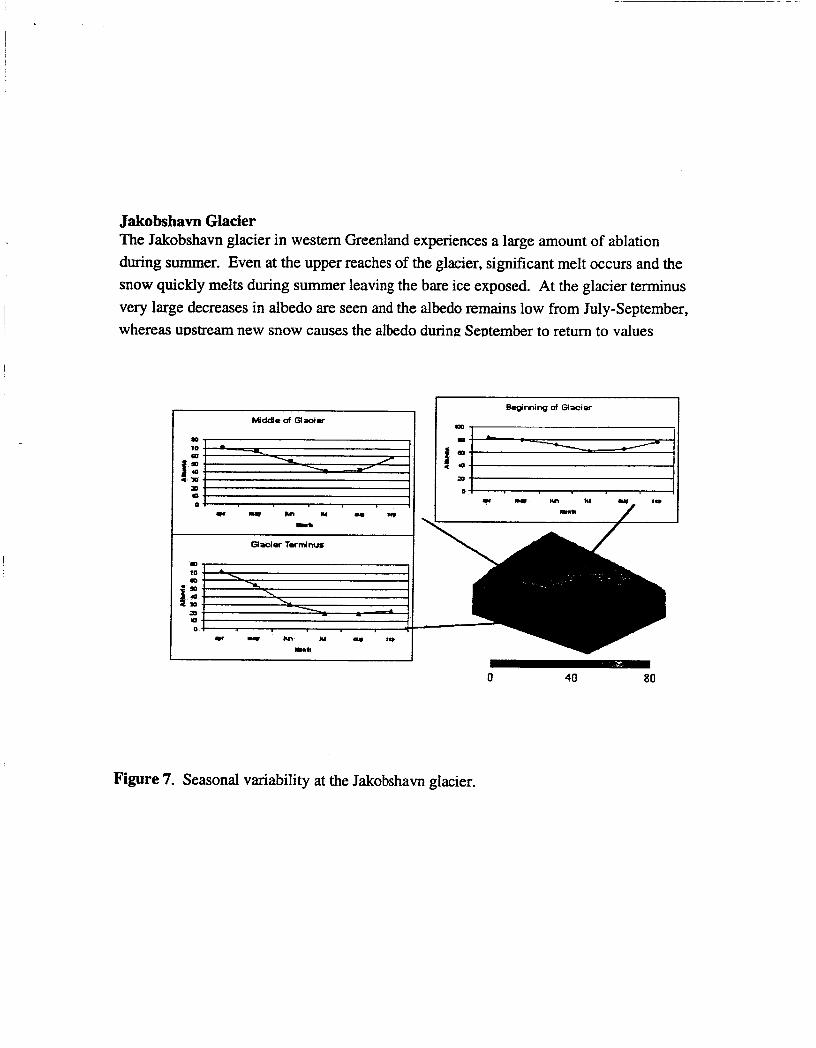
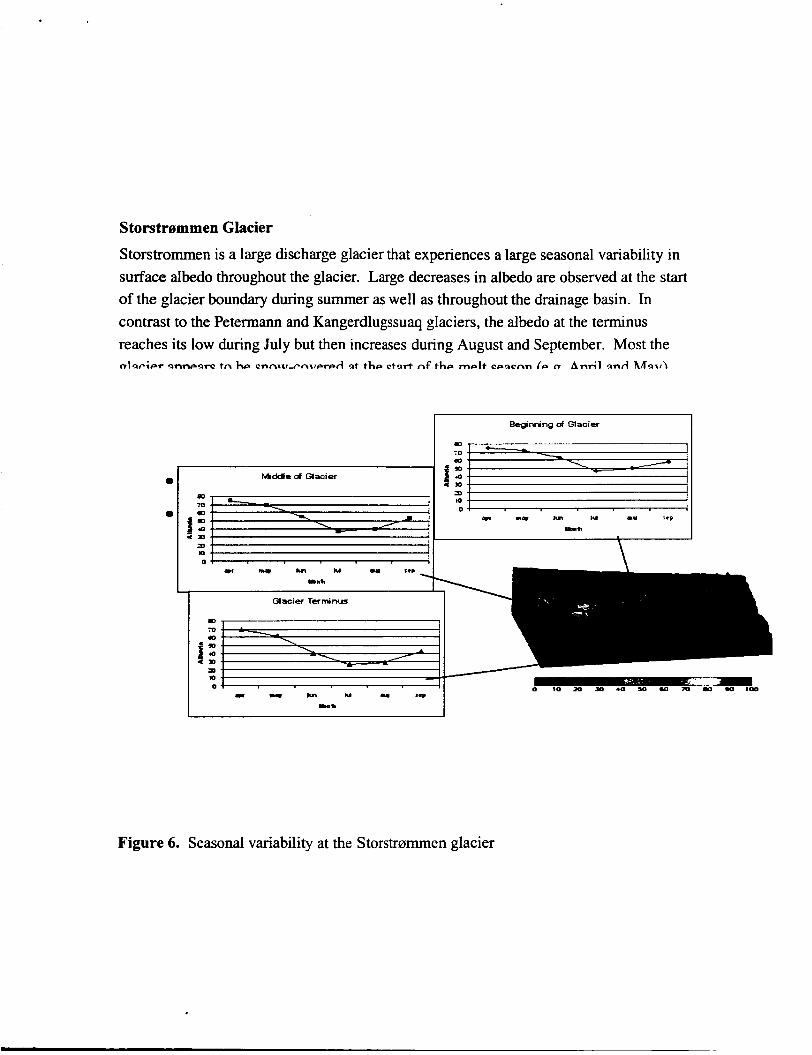
Jakobshavn Glacier The Jakobshavn glacier in western Greenland experiences a large amount of ablation during summer. Even at the upper reaches of the glacier, significant melt occurs and the snow quickly melts during summer leaving the bare ice exposed. At the glacier terminus very large decreases in albedo are seen and the albedo remains low from July-September, whereas uustream new snow causes the albedo during SeDtember to return to values
I Beginning of Glacier
0 40 80
Figure 7. Seasonal variability at the Jakobshavn glacier.

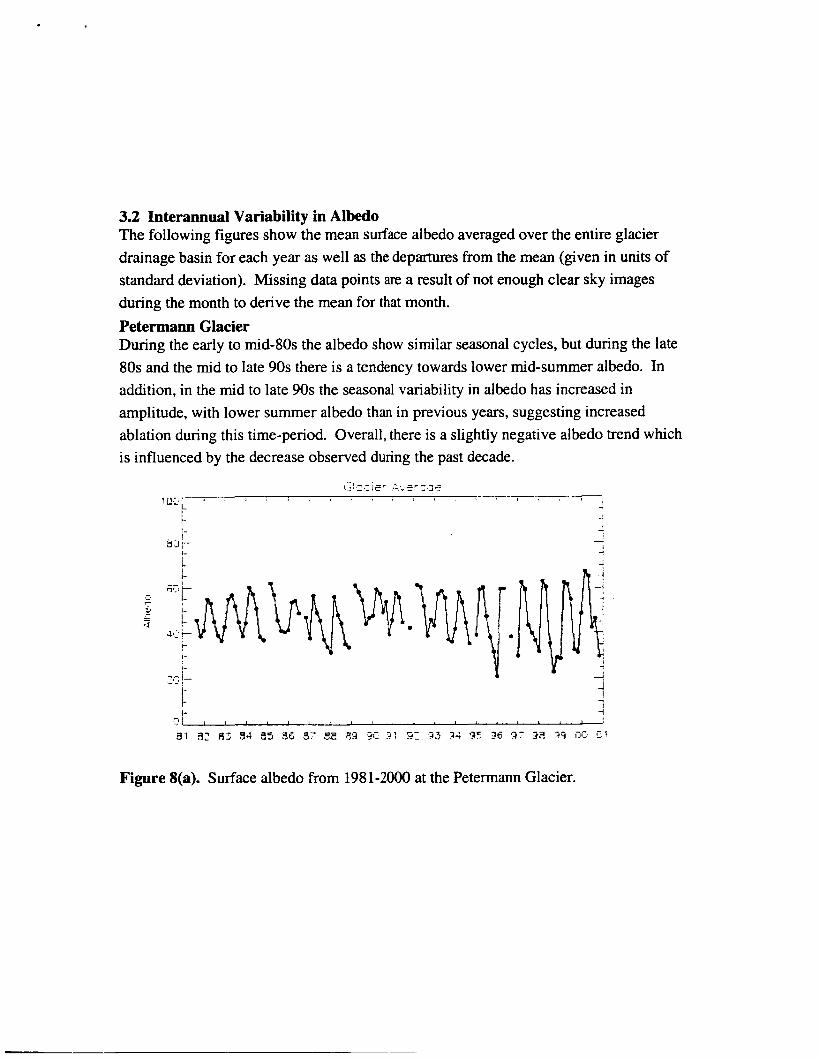
3.2 Interannual Variability in Albedo The following figures show the mean surface albedo averaged over the entire glacier drainage basin for each year as well as the departures from the mean (given in units of standard deviation). Missing data points are a result of not enough clear sky images during the month to derive the mean for that month. Petermann Glacier During the early to mid-80s the albedo show similar seasonal cycles, but during the late 80s and the mid to late 90s there is a tendency towards lower mid-summer albedo. In addition, in the mid to late 90s the seasonal variability in albedo has increased in amplitude, with lower summer albedo than in previous years, suggesting increased ablation during this time-period. Overall, there is a slightly negative albedo trend which is influenced by the decrease observed during the past decade.
Glacier Ciytnqe
Figure 8(a). Surface albedo from 1981-2000 at the Petermann Glacier.
5 6 2 3i
0
u
c D 0 z o
E E P 2
a - -2 6 e
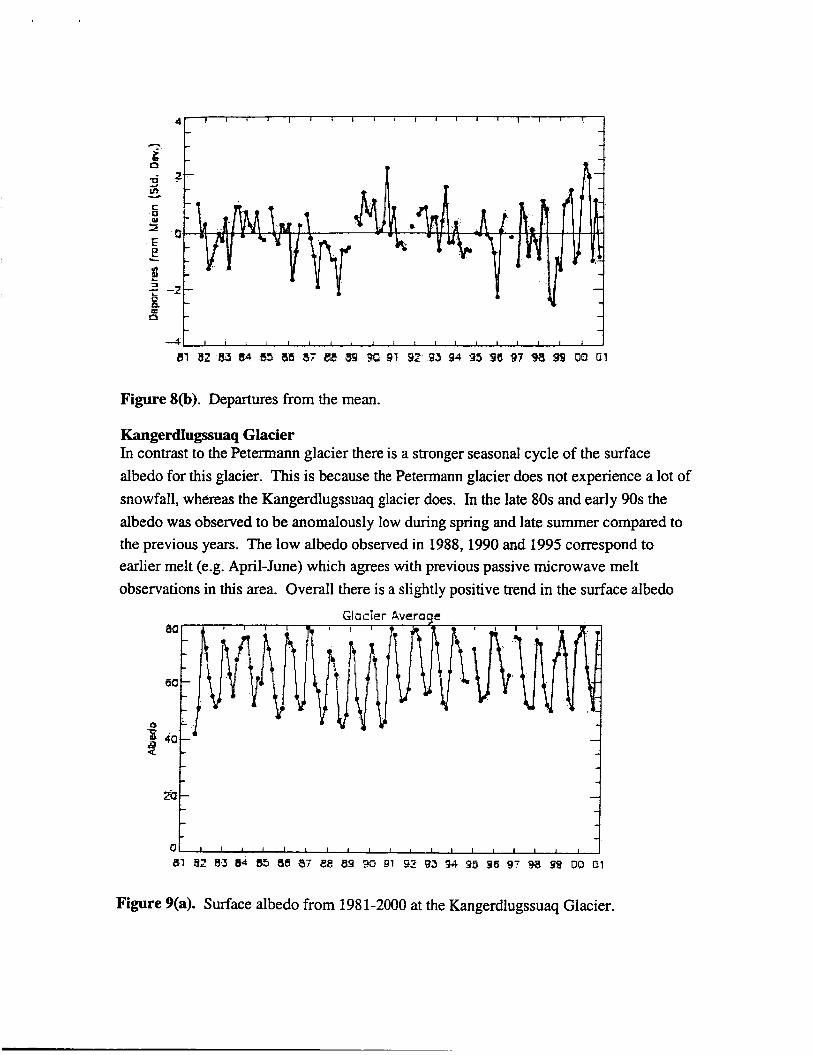
Figure 8(b). Departures from the mean.
Kangerdlugssuaq Glacier In contrast to the Petermann glacier there is a stronger seasonal cycle of the surface albedo for this glacier. This is because the Petennann glacier does not experience a lot of snowfall, whereas the Kangerdlugssuaq glacier does. In the late 80s and early 90s the albedo was observed to be anomalously low during spring and late summer compared to the previous years. The low albedo observed in 1988,1990 and 1995 correspond to earlier melt (e.g. April-June) which agrees with previous passive microwave melt observations in this area. Overall there is a slightly positive trend in the surface albedo
Glacier Avcraqe
t i
Figure 9(a). Surface albedo from 1981-2000 at the Kangerdlugssuaq Glacier.

Ti 6 v
C U 41 z E e L
1 L
-2
Figure 9(b). Departures from the mean.
Storstrammen Glacier
This glacier also experiences even larger seasonal variability than the Kangerdlugssuaq glacier. Anomalously low albedo were observed during the mid 80s when the glacier was surging, but since then, the trend has been towards an increase in the surface albedo, especially during the late 90s. Since the glacier is now known to be quiescent it is not sumrising that the albedo increased during the 90s comDared with the 80s.
Glacier Avcmge I 1 1 1 1 1 1 1 1 1 1 I I I O I I I
Figure 10(a). Surface albedo from 198 1-2000 at the Storstrsmmen Glacier
U 7
v % -
%Jt E
i -2
C 0
e t c
s
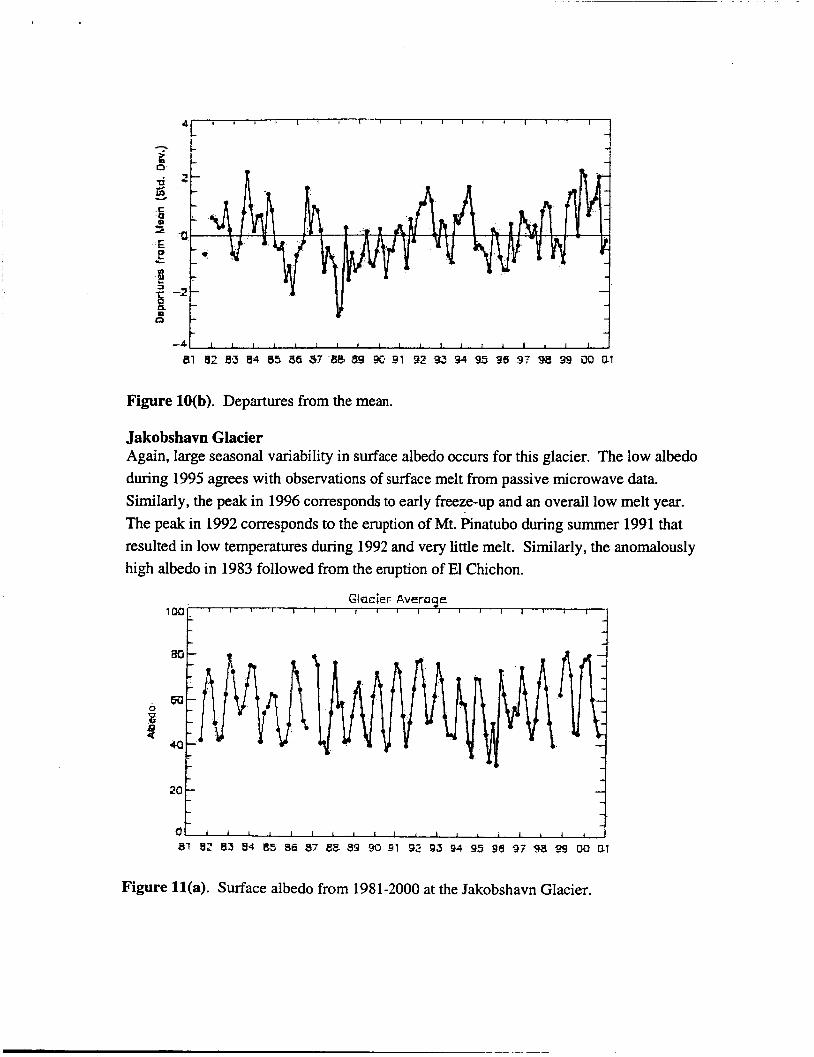
Figure 10(b). Departures from the mean.
Jakobshavn Glacier Again, large seasonal variability in surface albedo occurs for this glacier. The low albedo during 1995 agrees with observations of surface melt from passive microwave data. Similarly, the peak in 1996 corresponds to early freeze-up and an overall low melt year. The peak in 1992 corresponds to the eruption of Mt. Pinatubo during summer 1991 that resulted in low temperatures during 1992 and very little melt. Similarly, the anomalously high albedo in 1983 followed from the eruption of El Chichon.
Figure ll(a). Surface albedo from 1981-2000 at the Jakobshavn Glacier.

l i z is e
t
a f E e L
8 g -2
" I :
Figure ll(b). Departures from the mean.
3.3 Monthly Trends in Albedo The following figures show the individual monthly trends in surface albedo for each glacier together with the standard deviation. Results are given for at the glacier terminus, mid-way up the glacier, at the start of the drainage basin, and the average of the entire glacier drainage basin. Petermann Glacier No significant changes in albedo near the upper reaches of the glacier, except during September. However, there are decreases in albedo during June and July near the terminus of the glacier. Thus, some of the recent thinning at this glacier could be a result of increased surface melt, which appears to be governed by the large reductions in albedo observed during the late 90s. However, we remain cautious in interpreting trends at the glacier terminus because of the potential for contamination of the glacier pixel by the surrounding landwater. In general though, there is a tendency towards lower surface albedo throughout the drainage basin from June through September.

Terminus of Glocier a
5 -
a -
3 i Wr 4' Uoy .An Jul Aug Sap pc?
Month
t a 0
2 a - 0
pe
-6 ?!
c ._
c
Glacier Aramqc 10 I I I 4
-5 t 1
Figure 12. Monthly trends in albedo for the Petermann glacier.
Kangerdlugssuaq Glacier A large positive trend in September albedo is observed throughout the drainage basin but there is no significant trend in albedo during mid-summer months. In fact, for most of the glacier, the albedo trends are positive. We do not observe any significant decrease in albedo at the terminus of the glacier, although this glacier has been shown by laser altimeter flights to be retreating. Thus, it appears that the recent thinning at terminus is not a result of increased surface melting.
Beginning of Glacier
3-
5 -
3:
3:
3-
3 5l L
Terminus of Giocier 5k I
b a.
U c ._ V u -
a" 0 u
3
ti a 0
2 P 0
Middle of Glocier
-3
-IC1
-I5 i Mor
Glacier Auemge
1 5 3
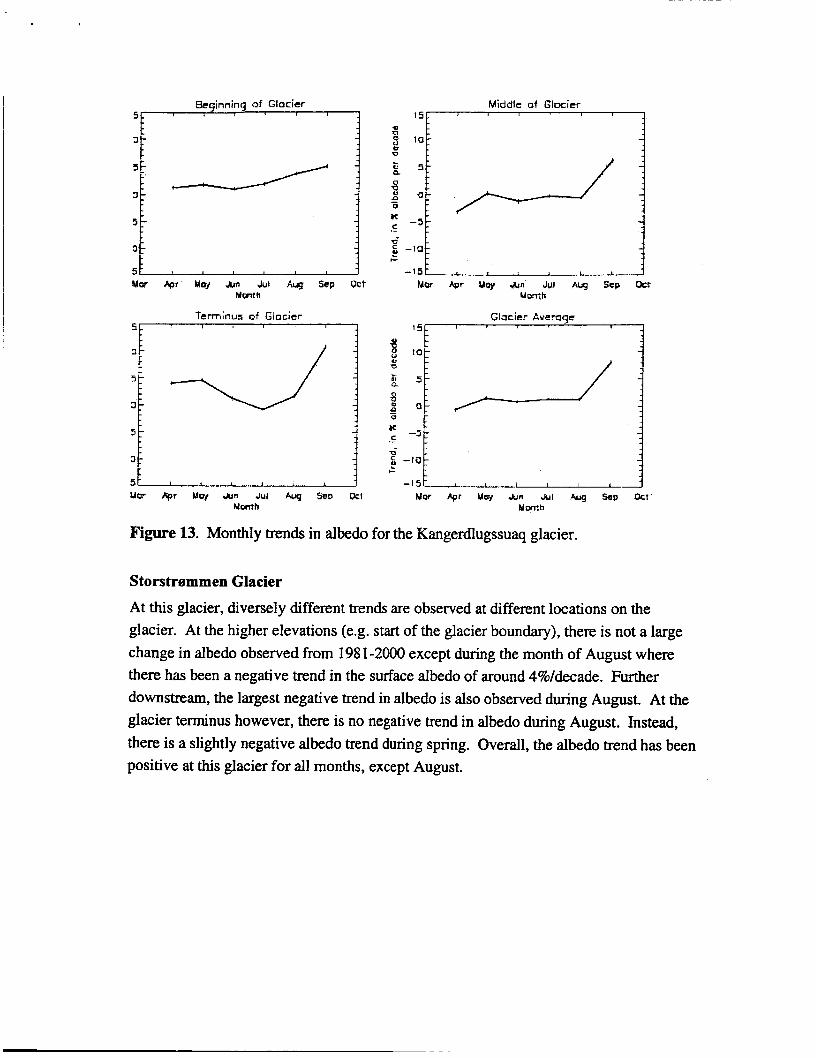
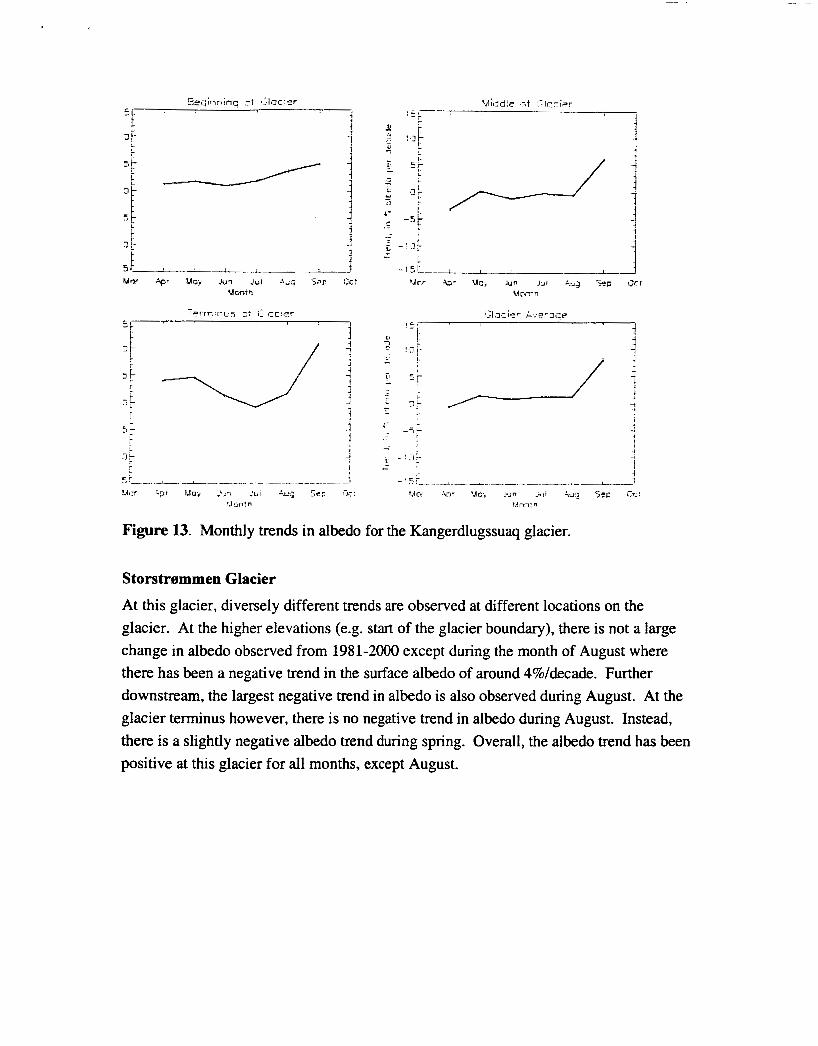
Figure 13. Monthly trends in albedo for the Kangerdlugssuaq glacier.
S tors trammen Glacier
At this glacier, diversely different trends are observed at different locations on the glacier. At the higher elevations (e.g. start of the glacier boundary), there is not a large change in albedo observed from 1981-2000 except during the month of August where there has been a negative trend in the surface albedo of around 4%/decade. Further downstream, the largest negative trend in albedo is also observed during August. At the glacier terminus however, there is no negative trend in albedo during August. Instead, there is a slightly negative albedo trend during spring. Overall, the albedo trend has been positive at this glacier for all months, except August.
5 -
3-
5 -
Middle of Glocier 1
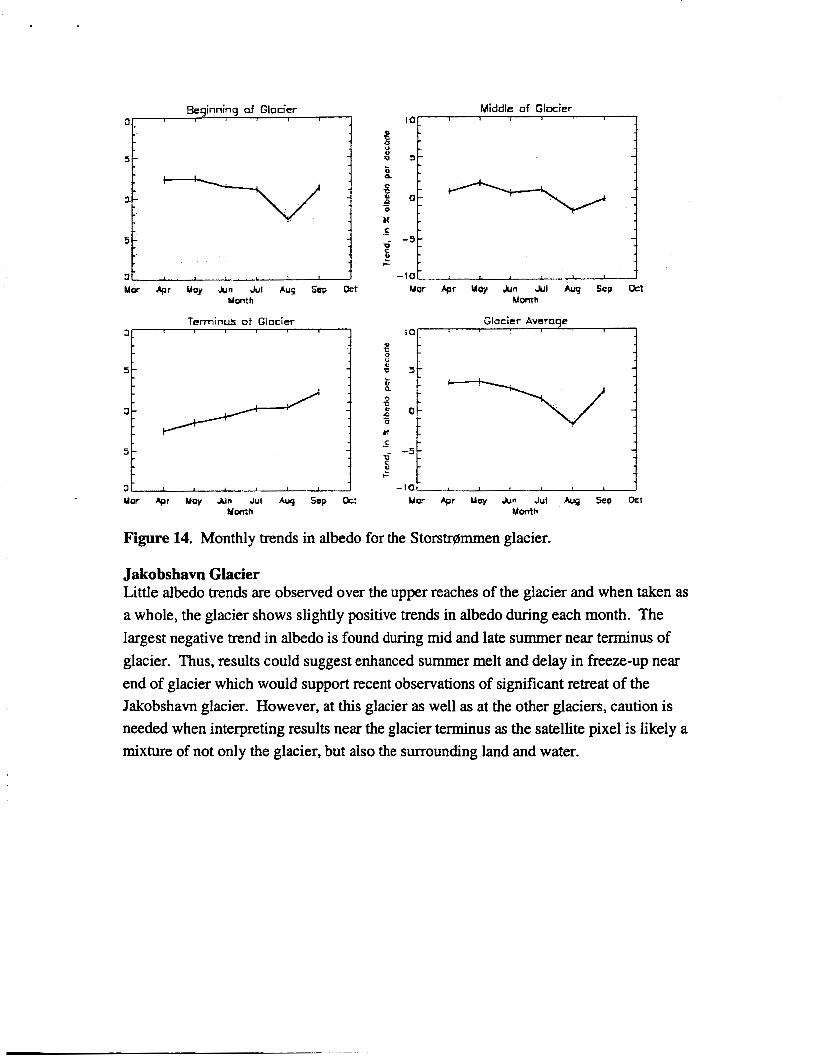
Figure 14. Monthly trends in albedo for the Storstrgmmen glacier.
Jakobshavn Glacier Little albedo trends are observed over the upper reaches of the glacier and when taken as a whole, the glacier shows slightly positive trends in albedo during each month. The largest negative trend in albedo is found during mid and late summer near terminus of glacier. Thus, results could suggest enhanced summer melt and delay in freeze-up near end of glacier which would support recent observations of significant retreat of the Jakobshavn glacier. However, at this glacier as well as at the other glaciers, caution is needed when interpreting results near the glacier terminus as the satellite pixel is likely a mixture of not only the glacier, but also the surrounding land and water.
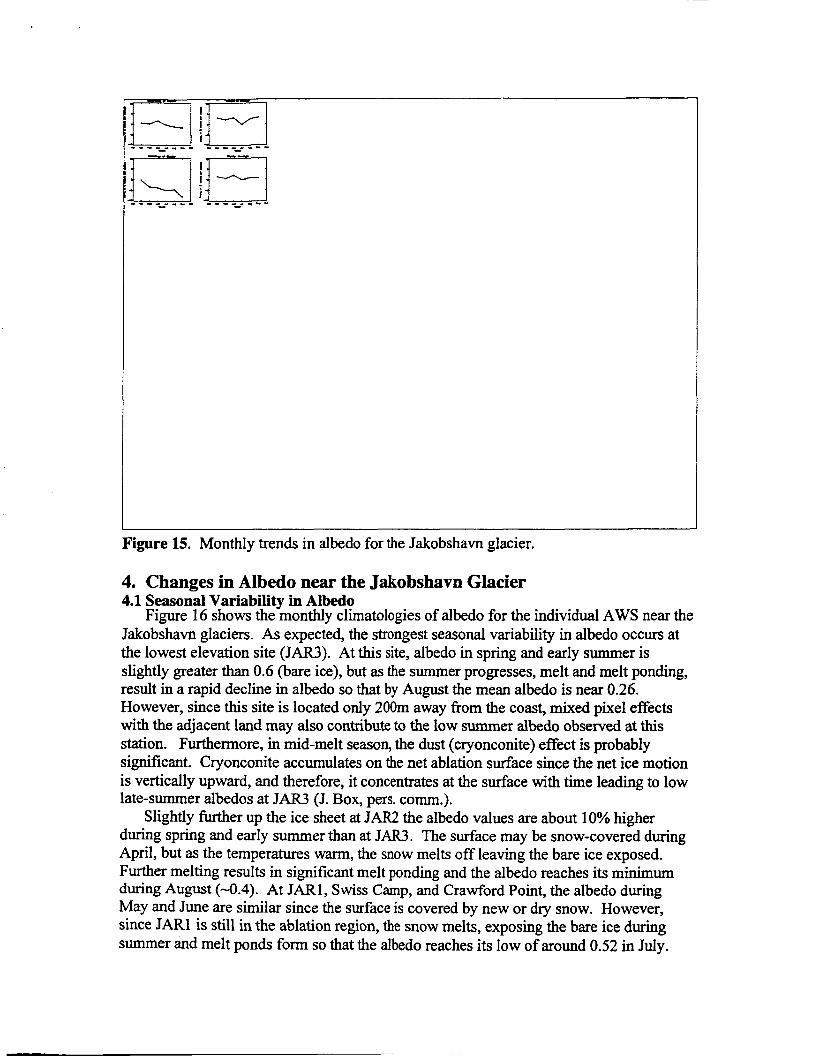
Figure 15. Monthly trends in albedo for the Jakobshavn glacier.
4. Changes in Albedo near the Jakobshavn Glacier 4.1 Seasonal Variability in Albedo
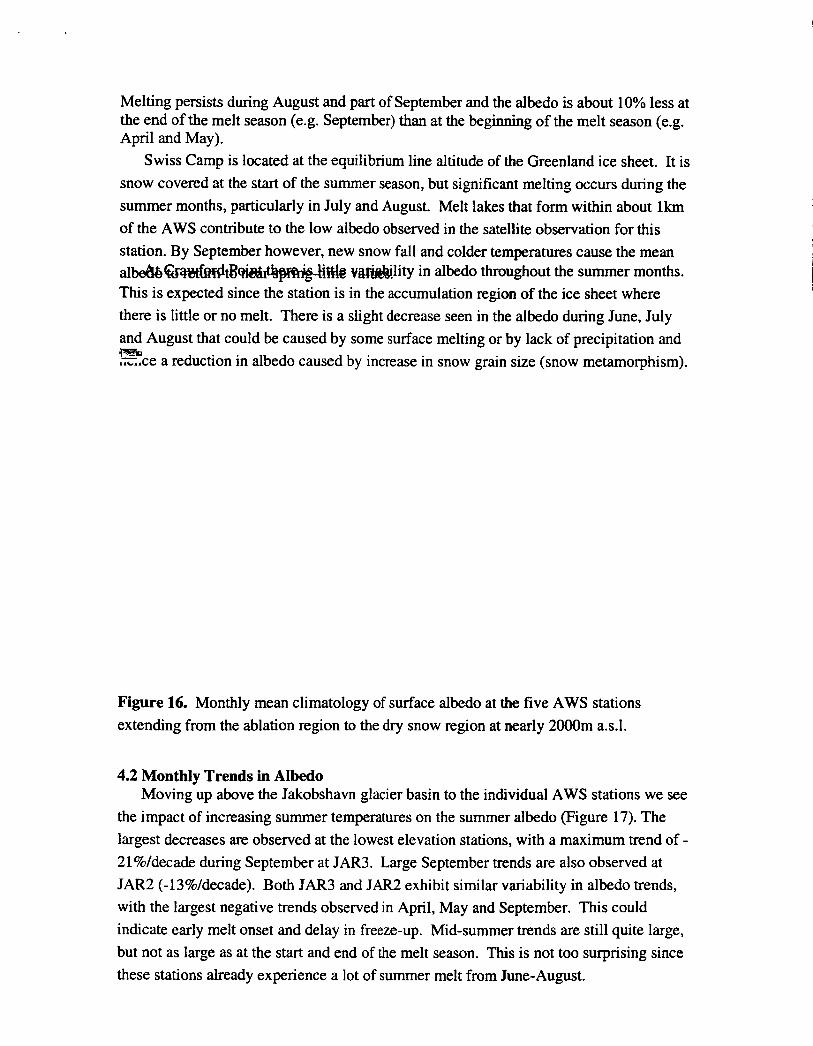
Jakobshavn glaciers. As expected, the strongest seasonal variability in albedo occurs at the lowest elevation site (JAR3). At this site, albedo in spring and early summer is slightly greater than 0.6 (bare ice), but as the summer progresses, melt and melt ponding, result in a rapid decline in albedo so that by August the mean albedo is near 0.26. However, since this site is located only 200m away from the coast, mixed pixel effects with the adjacent land may also contribute to the low summer albedo observed at this station. Furthermore, in mid-melt season, the dust (cryonconite) effect is probably significant. Cryonconite accumulates on the net ablation surface since the net ice motion is vertically upward, and therefore, it concentrates at the surface with time leading to low late-summer albedos at JAR3 (J. Box, pers. comm.).
Slightly M e r up the ice sheet at JAR2 the albedo values are about 10% higher during spring and early summer than at JAR3. The surface may be snow-covered during April, but as the temperatures warm, the snow melts off leaving the bare ice exposed. Further melting results in significant melt ponding and the albedo reaches its minimum during August (-0.4). At JARl, Swiss Camp, and Crawford Point, the albedo during May and June are similar since the surface is covered by new or dry snow. However, since JARl is still in the ablation region, the snow melts, exposing the bare ice during mnmer and melt ponds form so that the albedo reaches its low of around 0.52 in July.
Figure 16 shows the monthly climatologies of albedo for the individual AWS near the

Melting persists during August and part of September and the albedo is about 10% less at the end of the melt season (e.g. September) than at the beginning of the melt season (e.g. April and May).
Swiss Camp is located at the equilibrium line altitude of the Greenland ice sheet. It is snow covered at the start of the summer season, but significant melting occurs during the summer months, particularly in July and August. Melt lakes that form within about lkm of the AWS contribute to the low albedo observed in the satellite observation for this station. By September however, new snow fall and colder temperatures cause the mean alwQ-t&&&m& y-lity in albedo throughout the summer months. This is expected since the station is in the accumulation region of the ice sheet where there is little or no melt. There is a slight decrease seen in the albedo during June, July and August that could be caused by some surface melting or by lack of precipitation and %ce a reduction in albedo caused by increase in snow grain size (snow metamorphism).
Figure 16. Monthly mean climatology of surface albedo at the five AWS stations extending from the ablation region to the dry snow region at nearly 2000m a.s.1.
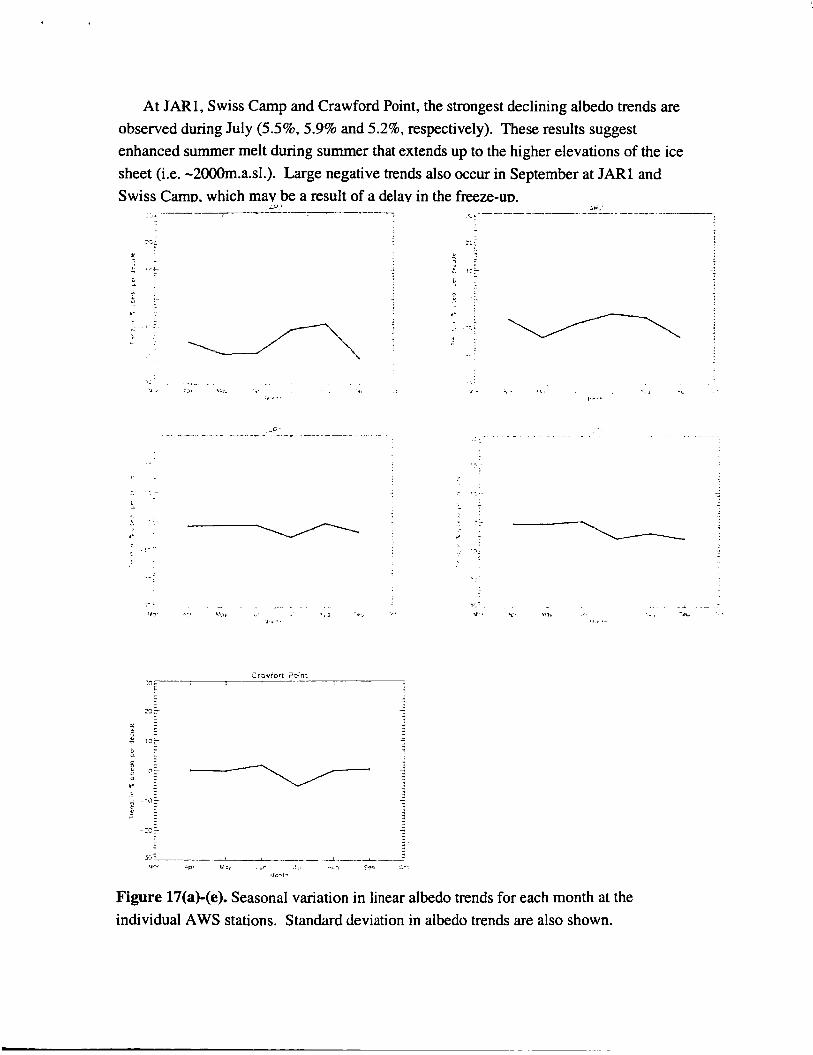
4.2 Monthly Trends in Albedo Moving up above the Jakobshavn glacier basin to the individual AWS stations we see
the impact of increasing summer temperatures on the summer albedo (Figure 17). The largest decreases are observed at the lowest elevation stations, with a maximum trend of - 2l%/decade during September at JAR3. Large September trends are also observed at JAR2 (-13Wdecade). Both JAR3 and JAR2 exhibit similar variability in albedo trends, with the largest negative trends observed in April, May and September. This could indicate early melt onset and delay in freeze-up. Mid-summer trends are still quite large, but not as large as at the start and end of the melt season. This is not too surprising since these stations already experience a lot of summer melt from June-August.

At JAR1, Swiss Camp and Crawford Point, the strongest declining albedo trends are observed during July (5.5%, 5.9% and 5.2%, respectively). These results suggest enhanced summer melt during summer that extends up to the higher elevations of the ice sheet (i.e. -2000m.a.sl.). Large negative trends also occur in September at JAR1 and Swiss Camo. which mav be a result of a delav in the freeze-uo.
jspz
g:: 3 f i
i 7 3 B f i l i ' 0 1 I E J ! f a : w' ' - .
: E g 1 : I * '1 4 - ' G I ~ 0 1 2-k
-9 - -4 t j i
! -a: i 1 t E
-a? e tw Jan Jul .r, P W 4w *4+ J*I CO b Ort
w a r YOrlb
Uor ' p r i n n JYI 4up rp OF1 Y n l h
Figure 17(a)-(e). Seasonal variation in linear albedo trends for each month at the individual AWS stations. Standard deviation in albedo trends are also shown.

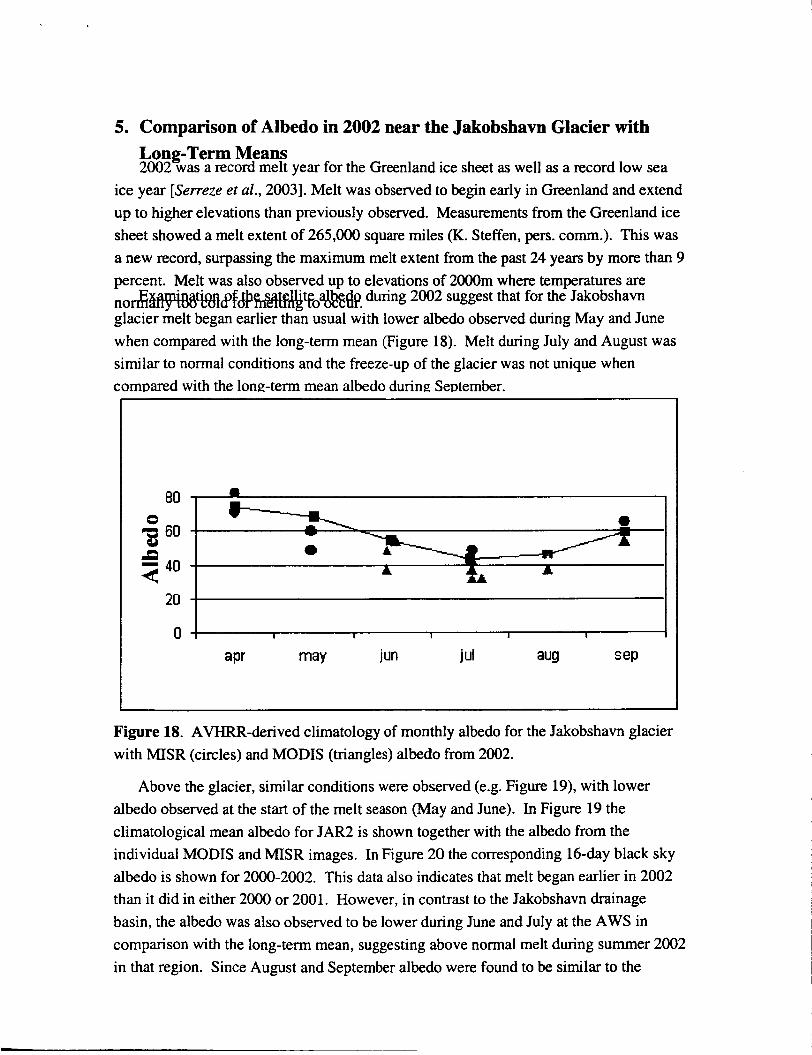
5. Comparison of Albedo in 2002 near the Jakobshavn Glacier with Long-Term Means 2002 was a record melt year for the Greenland ice sheet as well as a record low sea
ice year [Serreze et d., 20031. Melt was observed to begin early in Greenland and extend up to higher elevations than previously observed. Measurements from the Greenland ice sheet showed a melt extent of 265,000 square miles (K. Steffen, pers. corn.). This was a new record, surpassing the maximum melt extent from the past 24 years by more than 9 percent. Melt was also observed up to elevations of 20OOm where temperatures are n o & ~ ~ ~ & ~ ~ @ ~ ~ o a ) & & during 2002 suggest that for the Jakobshavn glacier melt began earlier than usual with lower albedo observed during May and June when compared with the long-term mean (Figure 18). Melt during July and August was similar to normal conditions and the freeze-up of the glacier was not unique when compared with the long-term mean albedo during September.
Figure 18. AVHRR-derived climatology of monthly albedo for the Jakobshavn glacier with MISR (circles) and MODIS (triangles) albedo from 2002.
Above the glacier, similar conditions were observed (e.g. Figure 19), with lower albedo observed at the start of the melt season (May and June). In Figure 19 the climatological mean albedo for JAR2 is shown together with the albedo from the individual MODIS and MISR images. In Figure 20 the corresponding 16-day black sky albedo is shown for 2000-2002. This data also indicates that melt began earlier in 2002 than it did in either 2000 or 2001. However, in contrast to the Jakobshavn drainage basin, the albedo was also observed to be lower during June and July at the AWS in comparison with the long-term mean, suggesting above normal melt during summer 2002 in that region. Since August and September albedo were found to be similar to the

I -
Figure 19. Climatology of monthly albedo for JAR2 with MISR (circles) and MODIS (triangles) albedo from 2002.
i f 3
Figure 20. Albedo from the MODIS (MOD43) 16-day albedo product for 2000 through 2002 at JAR2.
I .
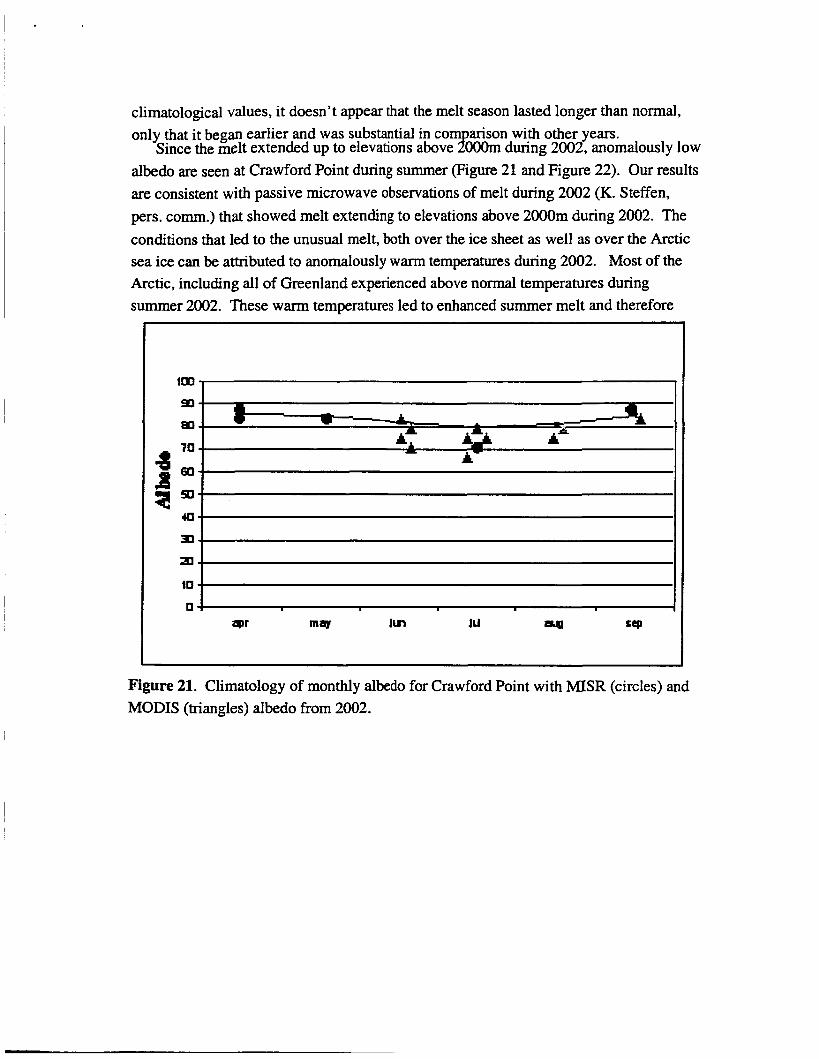
climatological values, it doesn't appear that the melt season lasted longer than normal, only that it began earlier and was substantial in com arison with other years.
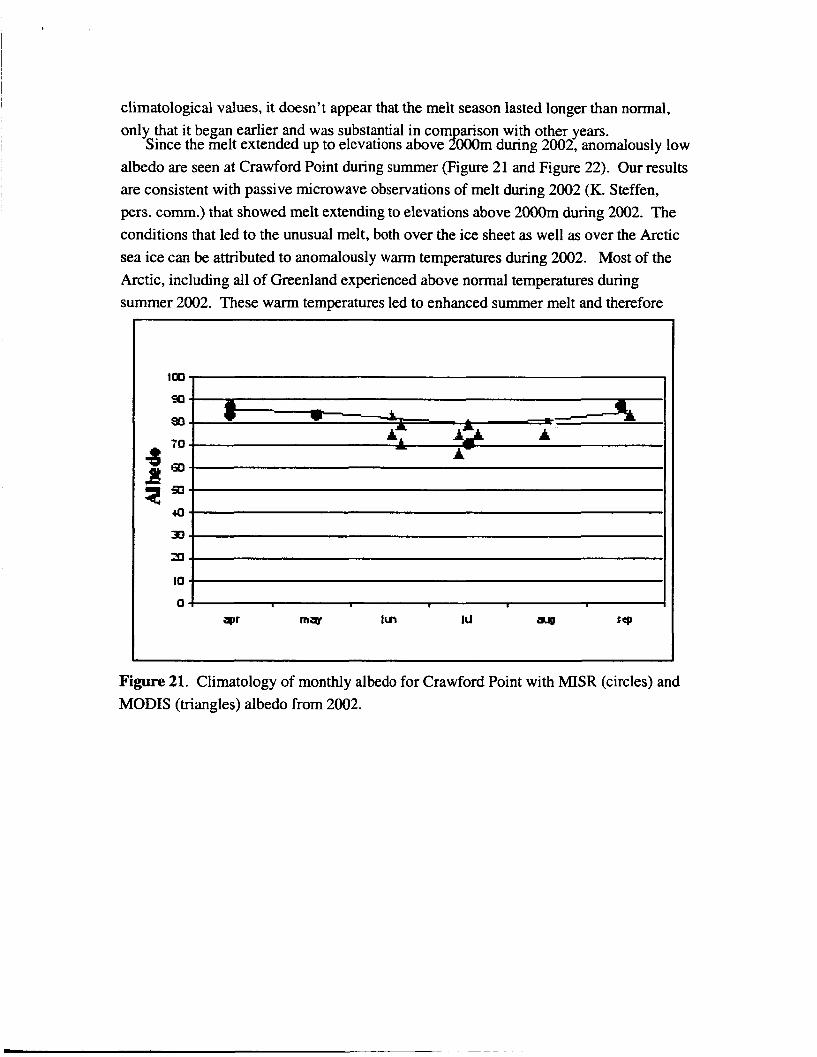
albedo are seen at Crawford Point during summer (Figure 21 and Figure 22). Our results are consistent with passive microwave observations of melt during 2002 (K. Steffen, pers. comm.) that showed melt extending to elevations above 2000m during 2002. The conditions that led to the unusual melt, both over the ice sheet as well as over the Arctic sea ice can be attributed to anomalously warm temperatures during 2002. Most of the Arctic, including all of Greenland experienced above normal temperatures during summer 2002. These warm temperatures led to enhanced summer melt and therefore
Since the melt extended up to elevations above J) Ooom during 2002, anomalously low
Figure 21. Climatology of monthly albedo for Crawford Point with MISR (circles) and MODIS (triangles) albedo ffom 2002.

Figure 22. Albedo from the MODIS (MOD43) 16-day albedo product for 2000 through 2002 at Crawford Point.
6. Significance of Results Using a simple energy-balance model gives a general idea of the significance of an
albedo change in terms of melt. We examined the significance of the albedo trends for the individual AWS using a simple energy balance model. This energy-balance model calculates melt M on an hourly basis as:
where pw is the density of water, Lf is the latent heat of fusion and a is the albedo taken from the mean monthly values derived from the APP data set as shown in Figure 16. The incoming shortwave radiation S and the incoming longwave radiation L- are both determined with parameterizatiok from Konzelmann and others [ 19941 established at E W C U camp. The longwave radiation L- emitted by the surface is calculated in accordance with the Stefan-Boltzmann law, whereas the sensible and latent heat fluxes, QH and QL, are calculated using the simple bulk transfer approach of Zuo and Oerlemans [ 19961. The last term, QG, is the change of heat of the thermally active part of the icehow surface which is calculated according to Oerlemans [ 199 11 as thermodynamically equivalent to a 2-m thick ice layer based on observations of Ambach [1963]. The annual variation in air temperature is prescribed as a cosine function, with a temporally varying lapse rate as presented by Stefen and Box [200 11 based on data from the Jakobshavn ablation area.
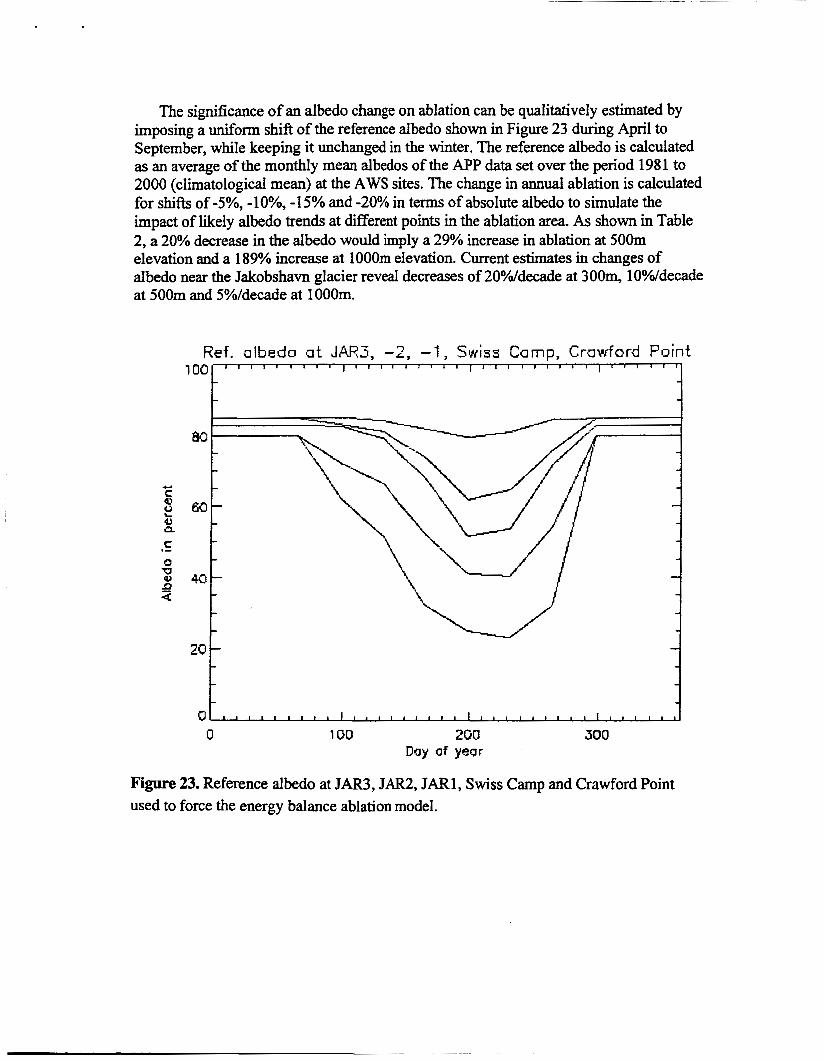
The significance of an albedo change on ablation can be qualitatively estimated by imposing a uniform shift of the reference albedo shown in Figure 23 during April to September, while keeping it unchanged in the winter. The reference albedo is calculated as an average of the monthly mean albedos of the APP data set over the period 198 1 to 2000 (climatological mean) at the AWS sites. The change in annual ablation is calculated for shifts of -5%, - 1 O%, - 15% and -20% in terms of absolute albedo to simulate the impact of likely albedo trends at different pints in the ablation area. As shown in Table 2, a 20% decrease in the albedo would imply a 29% increase in ablation at 50Om elevation and a 189% increase at 1 OOOm elevation. Current estimates in changes of albedo near the Jakobshavn glacier reveal decreases of 2OYddecade at 300m, 1OYddecade at 500m and 5%/decade at 1 OOOm.
100 ' ' ' ' ' ' ' ' ' I ' ' ' ' I ' ' ' ' I ' I I ' ' ' ' ' ' I ' ' ' ' ' - - -
c C Q) : Q
C I-
O U Q) 0 4
Figure 23. Reference albedo at JAR3, JAR2, JAR1, Swiss Camp and Crawford Point used to force the energy balance ablation model.

Table 2. Computation of annual ablation in meters given for hfferent % albedo changes. The reference case shows the annual ablation using the climatological mean summer
p% b3 kl b.25 b.03 I 2% 0%
6. Conclusions A change in the Greenland climate towards warmer temperatures will lead to an
increase in surface melting and a subsequent increase in the rate of ice flow through lubrication of the bed. Acceleration of the glaciers of a large ice sheet such as the Greenland ice sheet will significantly contribute to a rise in sea level, which is currently rising by approximately half an inch per decade. Enhanced runoff from the Greenland ice sheet, together with excessive melting of the sea ice has the potential to “cap” deep wat r convection i e No can r found .imp t lobal ean circgl tion f vesti ation o?$e s 2 c & i & t o at i iE Pour glaAers g n g t revezany signi#cant g r e a s e s in the albedo except at the terminus of the Petermann and Jakobshavn glaciers. However, since contamination of the satellite pixel by land and water is likely, not much confidence can be placed in the results at these locations. The Jakobshavn drainage basin does not reveal any significant decreases in albedo since 1981 that would help to explain recent thinning at this glacier in terms of increased surface melt. The same is true at the Kangerdlugssuaq glacier. Thus, even though coastal temperatures have increased significantly in recent years, the thinning of the Jakobshavn and Kangerdlugssuaq glaciers cannot be explained by ablation driven by surface energy balance. However, above the Jakobshavn drainage basin, large summer decreases in albedo have occurred over the past 20 years, which will have a considerable impact on the amount of ablation in the region. Large decreases in albedo are apparent at the AWS near the Jakobshavn glacier, particularly throughout most of the 1990s. The largest decreases in surface
d &mat!.

albedo were found during spring at the lower elevation sites and during mid summer at higher elevations, suggesting that melt is beginning earlier than normal near the coast and is extending up to higher elevations during summer. This is the scenario observed during the anomalously warm and extreme melt year of 2002.
they occur. It could be possible that the increases in surface melt above the drainage basin may influence glacier ice dynamics by transmission of surface melt water to the base of the Jakobshavn glacier. However, in order to fully assess the impact of albedo change during the period of thinning observed by Thomas et al. [2003] (1997-2002), a more detailed analysis of the albedo change and corresponding ablation change is needed in comparison to the period of 1981-1996. This will require collecting all the necessary data to do a full energy balance model of the Jakobshavn glacier which is out of the scope of this project. 7. References Abdalati, W. and 9 others, 2001. Outlet glacier and margin elevation changes: near-coastal thinning of the Greenland ice sheet, J. Geophys. Res., 106@24), 33,729-33,742.
Abdalati, W. and K. Steffen, 2001. Greenland ice sheet melt extent: 1979-1999, J. Geophys. Res., 106@24), 33,983-33,988.
The significance of the decreases in summer albedo will depend on when and where
Ambach, W., 1963. Untersuchungen zum Energieumsatz in der Ablationszone des gronlandischen Inlandeises, Meddelelser om Grcdnland ,174, (4), 50-64.
Knap, W. H. and J. Oerlemans, 1996. The surface albedo of the Greenland ice sheet: satellite-derived and in situ measurements in the Scdndre Strgmfjord area during the 1991 melt season, J. Gluciol.,.
Konzelmann, T., R.S. W. Van de Wal, W. Greuell, R. Bintanja, E.A.C. Henneken, A. Abe-Ouchi, 1994. Parameterization of global and longwave incoming radiation for the Greenland ice sheet, Global Planet. Change, 9, 143-164. Krabill, W.B., and 9 others. 2000. Greenland ice sheet: high-elevation balance and peripheral thinning. Science, 289(5478), 428-430.
Oerlemans, J., 1991. The mass balance of the Greenland ice sheet: sensitivity to climate change as revealed by energy-balance modeling, Holocene, 1(1), 40-49.
42(141), 364-374.
Schaaf, C. B., F. Gao, A. H. Strahler, W. Lucht, X. Li, T. Tsang, N. C. Strugnell, X. Zhang, Y. Jin, J.-P. Muller, P. Lewis, M. Barnsley, P. Hobson, M. Disney, G. Roberts, M.
F E i d t g a t & & M , d &e20 n emo an# t hadr B .Hu#. re ectanc Lianp pro ani ucts J. L from Priv B W , % e m o t e Sens. Environ., 83, 135-148.
Serreze, M.C., J. Maslanik, T.A. Scambos, F. Fetterer, J. Stroeve, K. Knowles, C. Fowler, S. Drobot, R. Barry and T.M. Haran, A recored minimum Arctic sea ice extent and area in 2002,2003. Geophysical Research Letters, 30(3), 1110-1 113.
Stamnes, K., S-C. Tsay, W. Wiscombe, and K. Jayaweera, 1988. Numerically stable
algorithm for discrete-ordinate-method radiative transfer in multiple scattering
and emitting layered media, Applied Optics, 27,2502-2509.
Steffen, K., J. E. Box, and W. Abdalati, 1996. Greenland Climate Network: C-Net, in Colbeck, S . C. Ed. CRREL 96-27 Special Report on Glaciers, Ice Sheets and Volcanoes, trib. to M. Meier, pp. 98-103.
Steffen, K. and J.E. Box, 2001. Surface climatology of the Greenland ice sheet: Greenland climate network 1995-1999, J. Geophys. Res., 106@24), 33,95 1-33,964.
Stroeve, J., Box, J., Gao, F., Liang, S.,Nolin, A., Schaaf C., Accuracy Assessment of the MODIS 16-day Albedo Product for Snow: Comparisons with Greenland in situ Measurements. Remote Sensing of the Environment, submitted Stroeve, J. and A. Nolin, 2003. Comparison of MODIS and MISR-derived surface albedo with in situ measurements in Greenland, EARSeL Proceedings, 2(1), 88-96.
Stroeve, J. 2002. Assessment of Greenland albedo variability from the AVHRR Polar Pathfinder Data set, Journal of Geophysical Research-Atmospheres, 106@24), 33,989- 34,005.
Stroeve, J. and A. Nolin, 2002. New Methods to Infer Snow Albedo from the MISR Instrument with Applications to the Greenland Ice Sheet, Transactions on Geoscience and Remote Sensing, 40(7), 1616-1625.
Stroeve, J.C., J.E. Box, C. Fowler, T. Haran, and J. Key, 2001. Intercomparison Between in situ and AVHRR Polar Pathfinder- derived Surface Albedo over Greenland, Remote Sens. Environ., 75(3), 360-374.

Thomas, R.H., W. Abdalati, E. Frederick, W.B. Krabill, S. Manizade, and K. Steffen, 2003. Investigation of surface melting and dynamic thinning on Jakobshavn Isbrae, Greenland, J. Glizciolog., 49( 165),
Zuo, Z. and J. Oerlemans, 1996. Modeling albedo and specific balance of the Greenland ice sheet: calculations for the Sondre Stromfjord transect, J. Glacial., 42(141), 305-317.
23 1-239.

Greenland glacier albedo variability Final Report for NASA Grant NAG540600
Summarv The program for Arctic Regional Climate Assessment (PARCA) is a NASA-
funded project with the prime goal of addressing the mass balance of the Greenland ice sheet. Since the formal initiation of the program in 1995, there has been a significant improvement in the estimates of the mass balance of the ice sheet. Results from this program reveal that the high-elevation regions of the ice sheet are approximately in balance, but the margins are thinning (Krabill et al., 2000). Laser surveys reveal significant thinning along 70 percent of the ice sheet periphery below 2000 m elevations, and in at least one outlet glacier, Kangerdlugssuaq in southeast Greenland, thinning has been as much as 10 d y r (Thomas et al., 2000). This study examines the albedo variability in four outlet glaciers to help separate out the relative contributions of surface melting versus ice dynamics to the recent mass balance changes. Analysis of AVHRR Polar Pathfinder albedo shows that at the Petermann and Jakobshavn glaciers, there has been a negative trend in albedo at the glacier terminus from 1981 to 2000, whereas the Stor+strommen and Kangerdlugssuaq glaciers show slightly positive trends in albedo. These findings are consistent with recent observations of melt extent from passive microwave data which show more melt on the western side of Greenland and slightly less on the eastern side. Significance of albedo trends will depend on where and when the albedo changes occur. Since the majority of surface melt occurs in the shallow sloping western margin of the ice sheet where the shortwave radiation dominates the energy balance in summer (e.g. Jakobshavn region) this region will be more sensitive to changes in albedo than in regions where this is not the case. Near the Jakobshavn glacier, even larger changes in albedo have been observed, with decreases as much as 20 percent per decade. Using a simple energy balance model to derive melt rates, a 20 percenddecade decrease in albedo will result in 29 Dercent more melt at 500 m and 189 Dercent more
elevation regions of the ice sheet are approximately in balance, but the margins are rapidly thinning [Krabill and others, 20001. Laser surveys reveal significant thinning along 70% of the ice sheet periphery below 2000m elevations. At the same time, passive microwave-derived melt estimates show a l%/yr increase in melt area since 1979 [Abdalati et al., 20011. This melt is directly related to ablation through runoff and surface evaporation and indirectly linked to increased discharge through lubrication of

the bedrockhce. Since the dominant source of energy for melting during summer comes from the absorption of solar radiation, the albedo becomes an important parameter in understanding melt. Unfortunately, there have been a limited number of studies on the variability of albedo of the Greenland ice sheet, in part because of the lack of reliable albedo estimates. Some studies have looked at the variability in albedo at certain locations around Greenland using satellite imagery [e.g. Stroeve,2002; and Knap and Oerlemans, 19961.
The Jakobshavn glacier is known to be one of the fastest discharge glaciers in the world, moving at a rate of approximately 7 km per year (-20 dday). This glacier is located in west Greenland (69.2"N, 49.8"W) and calves new icebergs into Disko Bay every day, some of which are several kilometers long. This greatest iceberg-producing glacier measures only 7 kilometers along its front and is 90 meters above sea level. Studies have shown that the total calving flux during summer is substantially greater than
anomalies [Abdalati et al., 20011. However, Thomas et al. [2003] report sustained thinning of several meters per year within 20 km of the ice front since 1997. conclude that the thinning since 1997 results from dynamic processes rather than increased melting or reduced snowfall. However, sustained changes in summer temperature will have an immediate impact on surface melt rates, which may affect glacier dynamics by lubrication of the bed by melt water. Therefore, an increase in
& @ d 4 h $ S $ 6 % G M t & m & % w s for the Jakobshavn glacier and other glaciers, this study examined the albedo variability from April through September using satellite imagery at four outlet glaciers and 5 Automatic Weather Stations (AWS) sites near the Jakobshavn glacier. The longest, most consistent estimate of the surface albedo of polar regions comes from the Advanced Very High Resolution Radiometer (AVHRR) Polar Pathfinder (APP) data set. This product is used to examine albedo variability from 198 1 to 2000. Data from the Moderate Resolution Imaging Spectro-Radiometer ( M ( ? @ & b # @ d $ & d ! d € . & ? d & ~ ~ ~ ~ & ~ q ~ ~ d###@@U&rtadhe t d h l 2 i b w m t i o n I11 discusses the albedo variability in the individual glaciers and the Jakobshavn region and shows how 2002 compares with the long term mean in western Greenland. Section IV discusses the significance of the albedo variability in western Greenland terms of changes in ablation and section V follows with a discussion as to some of the causes for the large reductions in albedo observed during 2002. 2. Data and Processing Steps 2.1 Study Region
They
&m&W& ~ e h § c t s

Figure 1 shows the location of the four glaciers studied: Petermann, Storstrommen, -
Kangerdlugssuaq and Jakobshavn. These are briefly discussed below. All glacier boundary information came from the Geological Survey of Denmark and Greenland (GUES).
Figure 1. Location of glaciers investigated in this study.
Kangerdlugssuaq Glacier
This glacier is located on the east coast of Greenland (68"N, 33"W). In the past five years, the Kangerdlugssuaq glacier has thinned about 50 m (Thomas et al., 2000). An AWS is located within this region and can provide additional and validation information on the surface albedo and other fluxes. The catchment region of Kangerdlugssuaq glacier is well defined and velocity estimates have been made for 1966, 1988, 1996 and 1999. Details are given in Thomas et al. (2000).
Storstremmen Glacier
Situated in northeast Greenland (77"N, 23"W) near Dove Bay and Danmarkshavn, this glacier has been quiescent in the past few years, after surging in the 1980s (Bgggild et al., 1994; Reeh et al., 1994). Thus, all current mass balance losses/gains at the stagnation point (77"N, 22.7"W) are attributable to ablation/accumulation variability. Petermann Glacier
Petermann glacier is a large glacier that is in a state of negative mass balance (Rignot et uZ., 1997). It has a catchment of 71,580 km2 and discharges at about 12 km3/yr. In 2002, there was about 1.5m ablation (K. Steffen, pers. comm.) A comprehensive new survey was performed in 2002 using the NASA airborne laser altimeter. These altimeter data have characterized both surface elevation and surface roughness and are new deployments of are planned for 2003 and into the future (W. Krabill, pers comm.). Moreover, Petermann is a very wide glacier with flat and shallow freeboard, and experiences a tremendous degree of basal melting - nearly ten times that of the ice shelves in Antarctica (Rignot, 1996). Thus, understanding the relative importance of j u p k e do bas&melt is important for accurate interpretation of the balance mechanisms. a o s avn acier
The Jakobshavn glacier (69.2"N7 49.8"W) in west Greenland is believed to by the fastest flowing glacier, with 7 km per year movement (20ndday). The glacier Jakobshavn catchment area lies within the dry-snow zone but a significant portion also includes the percolation and ablation regions with significant annual melt rates of several m a-' per year. Within this region of the ice sheet there are several automatic weather stations, which are part of the Greenland Climate Network (GC-Net) [Steflen et al., 19961, starting with JAR 3 (69.2"N7 50.2"W) at 323 m elevation, followed by JAR 2 (69.3"N, 49.5"W) at 650 m and JAR 1 (69.5"N7 49.7"W) at 962 m. At the equilibrium line altitude there is another AWS, the Swiss Camp (69.6"N, 49.3"W) at 1149 m. These stations provide data along the glacier and as such, they are useful for comparison with albedo estimates from satellite imagery. Of all our study laciers, Jakobshavn is the one with the .most Fi ure showsaMIS i e of eJ& hshavn lacierdra dov adi 'tal leva Eodel @EjM).
xtensi e aser altimeter mapping of the glacier took place in 1997, 1998, and 2002. co 9,Zl pre ensive set O B a z g r n e k e r aytimeter LeasureZnts, YatinzbacE to YB 1.

Figure 2. MISR image during May of the Jakobshavn glacier. The albedo is seen to be high surrounding the glacier tongue, albedo near 0.8, but on the glacier tongue the albedo is much lower, near 0.4 (bare ice).
2.1 AVHRR Polar Pathfinder Data
Pathfinder (APP) data set, archived and distributed by the National Snow and Ice Data Center (NSIDC). The data set is available twice daily at two different spatial resolutions, 1.25 km and 5 km. The 5 km data set spans July 1981 through December 2000, whereas the 1.25 km product only covers August 1993 through December 1998 for the northern hemisphere with significant gaps between 1993 and 1998. Product data include calibrated reflectances (visible channels) and temperatures (thermal channels) for five AVHRR channels, clear sky surface broadband albedo and skin temperature, solar zenith angle, satellite elevation angle, sun-satellite relative azimuth angle, surface type mask,
Clear sky surface albedo from 198 1 to 2000 comes from the AVHRR Polar

cloud mask, orbit mask, and time of acquisition. The data have been composited onto two gnds per day based on common local solar times and scan angle. Since the 1.25 km resolution data only have a limited temporal coverage, the coarser 5 km product was used instead.
For each station, as well as for the entire Jakobshavn drainage basin, clear sky surface albedo were extracted from the APP 5-km product. Although a cloud mask accompanies the APP data set, this cloud mask was found to be inadequate over Greenland [Stroeve, 20021. Therefore it was necessary to manually cloud filter all the albedo images. This was accomplished by visual inspection of the surface temperature and albedo images. Following filtering the images for clouds, monthly mean albedo were derived for each mo th f 4 ril throu h Se tember. i n imum 15 clew sk ima es wa necessary to denve t e ont 1 ean albedo for each.&S Ijf!c.ati n anrthe & a x - repon composite9 C?eenkdd?mages, discontinuities occur in txe surface albedo is dependent upon the solar zenith angle. To minimize this effect, all albedo were normalized to local solar noon, using a polynomial fit to modeled albedo simulations obtained using the Discrete Ordinates (DISORT) model [Stamrnes et al. 19881. In modeling the surface albedo a constant snow grain size of 250 microns was assumed. The ef%&m"af%?@?#& mim%h?~f~si!&??h8~%&~%d9 a departures from the mean (monthly anomalies) were calculated. The data were then resampled to 625-m using nearest neighbor sampling to overlay the albedo on a Digital Elevation Model (DEM). The DEM used is an enhanced version of the DEM provided by JSMS (Ekholm, with contributions from Bamber), using AVHRR images to improve the spatial detail of the interior of the Greenland ice sheet (no closer than 15km from the nearest rock exposure). The AVHRR images used in improving the DEM (approximately
35) M E M M E ~ B ~ ~ ~EHIB%J ~ ~ ~ ~ ~ ~ ~ ~ ~ ~ ~ ~ ~ ~ ~ ~ ~ e ~ ~ ~ ~ ~ . ~ ~ O f
! & ~ ~ d & ? & k % situ-measured surface albedo at several AWS in Greenland, including two stations in the ablation region on the western margin of the ice sheet. Results from the study showed that the albedo was approximately 6% less (in terms of absolute albedo) than that measured at the AWS. In a more recent study, Ahlstrom (in press) compared APP albedo during 2000 in the ablation region along the western ice margin. Results indicated that the APP albedo was on average 4.2% (absolute albedo) less than that measured locally. The study also concluded that the narrow-to-broadband (NTB) model used in the APP product performed equally well over the entire range of broadband albedos from 0.09 to 0.63. This result is important to the present study since it k&&%?!%f%&@!?% #&#!%&?&now and ice albedo in the APP product
To extend our study to include more recent years, the surface albedo for 2do2 is derived for the Jakobshavn glacier using data from both MODIS and MISR flown on the Terra platform. Table 1 lists the number of clear-sky MISR and MODIS images processed. Surface albedo is derived from the MODIS Level 1B data gridded to the 1.25-
fn.a&tign, since &ore phan one or % it is t ica y used in &n &e dairy o si ce the
climatology plus

km EASE grid using channels 1-5 following Strueve and Nulin [2003]. This method uses a linear combination of MODIS spectral channels 1-7 to derive the surface albedo. The MISR Level 1B data
Table 1. List
is used to derive the surface albedo at 275-m spatial resolution using a linear combination of the red channel multiangle measurements as described in [Strueve and Nulin, 20021.
of Strueve and Nulin [2003; 20021 compare with in situ measurements available from some of the GC-Net AWS. In Figure 3(a), 53 MISR predicted albedo are compared with albedo measurements from 7 different AWS locations, including sites in the accumulation and ablation regions using MISR imagery acquired in 2000,2001 and 2002. Some large scatter is observed at low albedo values, which reflects the difficulty in ma ‘D dir ct co
Figure 3(a) and (b) show how well the MISR and MODIS albedo using the methods
arisons be weeq satellite image? a n d g o i w B p p 2 e n t s in t an in situ %edo ore scatter is seen
%&re 3(b) s&%s results 8 rom intercom a n s n betw en ab1 ti0 re i9n dunng y m e r . Th root-m wi iQ.057. at t ie #u&t (accu u ation region? and at in the MODIS results than in the MISR results. Similar problems are observed in the AVHRR albedo and are in part a result of the accuracy of the Bidirectional Reflectance Distribution Function (BRDF) model used in converting from a directionally dependent satellite measurement to a hemispherical albedo measurement. When the satellite viewing angles are oblique, the BRDF model does not perform as well, and large errors in the surface albedo occur. Therefore, for the MODIS data, we limited the satellite
BQ@Whlined albedo from the MODIS 16-day (MOD43) albedo product [Schaafet al., 20021. This product includes black sky (direct beam directional hemispherical albedo) and white sky albedo (completely diffuse bihemispherical albedo) for the first seven spectral bands of the MODIS instrument as well as for three broadbands (0.3 - 0.7pm, 0.7-5.Opm, 0.3-5.Opm). Intercomparisons with in situ data at several of the AWS reveal that the MOD43 albedo is within 5% of the in situ albedo [Strueve et al., submitted]. Here we use the MOD43 albedo product to examine the albedo from 2000-2002.
v i e ~ ~ t t b ~ ~ ~ ~ ~ ~ ~ ~ ~ ~ ~ ~ ~ ~ ~ ~ ~ ~ ~ ~ ~ l ~ ~ , ~ F

1, 1
" I
0 0.1 0.2 0.3 0.4 0.5 0.6 0.7 0.8 0.9 1
In Situ Albedo
Figure 3(a). Comparison between MISR-predicted and in situ measured surface albedo at several AWS sites in Greenland using data from 2000,2001 and 2002.
I '1 I
0.5 E 0.4 - a U, 0.3 -
0.1 g 0.2
0 4 I 0 0.1 0.2 0.3 0.4 0.5 0.6 0.7 0.8 0.9 1
In Situ Albedo
Figure 3(b). Comparison between MODIS-predicted and measured surface albedo over Greenland using data from 2000 and 2001.
3. Results 3.1 Seasonal Variability of Albedo
The following figures summarize the seasonal variability in surface albedo for the drainage basin of the individual glaciers as defined by the comer points from GUES. Results are shown for three locations: at the glacier terminus, mid-way up the glacier and at the start of the drainage basin.

Petermann Glacier At the start of the glacier boundary there is some decrease in albedo during summer as the snow melts and exposes the bare ice below. Similarly, mid-way down the glacier the albedo shows a similar seasonal variability, but with slightly lower albedo during July and August than at the start of the glacier boundary. Snow-fall in later summer brings the surface albedo back up to values near the star t of the summer. At the glacier terminus however, not much snow-fall occurs and the albedo during April and May is that of bare ice (0.6). As the temperatures warm during summer, surface melting causes the albedo to
Middle of Glacier
m - , ' 0 . S '
z2n. I::, 3D'
0 m
* n u m n U I l l r - m*.
I Glacier Terminus
p- -7 0 40 80
Figure 4. Seasonal variability of albedo at the Petermann glacier.
Kangerdlugssuaq Glacier The start of this glacier there is not much seasonal variability in the surface albedo. The elevations are above 2000m and thus little or no melt occurs. However, further downstream the snow does melt off the glacier during summer exposing the bare ice and at the glacier terminus the surface albedo remains low from July through September. In contrast to the Petermann glacier, the Kangerdlugssuaq glacier receives more snowfall xxrhirh ic tpflerterl hrr th- himher c l t r f a r e a l b r l n x r c 1 1 1 i ~ c r l r t r i n n A n n 1 onrl hAa\r thrnttnhn~tt
Begimng d Glacier
I
Figure 5. Seasonal variability at the Kangerdlugssuaq glacier.
S tors tremmen Glacier
Storstrommen is a large discharge glacier that experiences a large seasonal variability in surface albedo throughout the glacier. Large decreases in albedo are observed at the start of the glacier boundary during summer as well as throughout the drainage basin. In contrast to the Petermann and Kangerdlugssuaq glaciers, the albedo at the terminus reaches its low during July but then increases during August and September. Most the nlarim- ann-arc tn he c n n s x i p n w e r d at the ctart nf the melt c e o c n n (e n Ant41 and Mow\
0
0
f i
w - k n k( a m S C .
Ln*
Glacier Terminus
--
Figure 6. Seasonal variability at the Storstrsmmen glacier
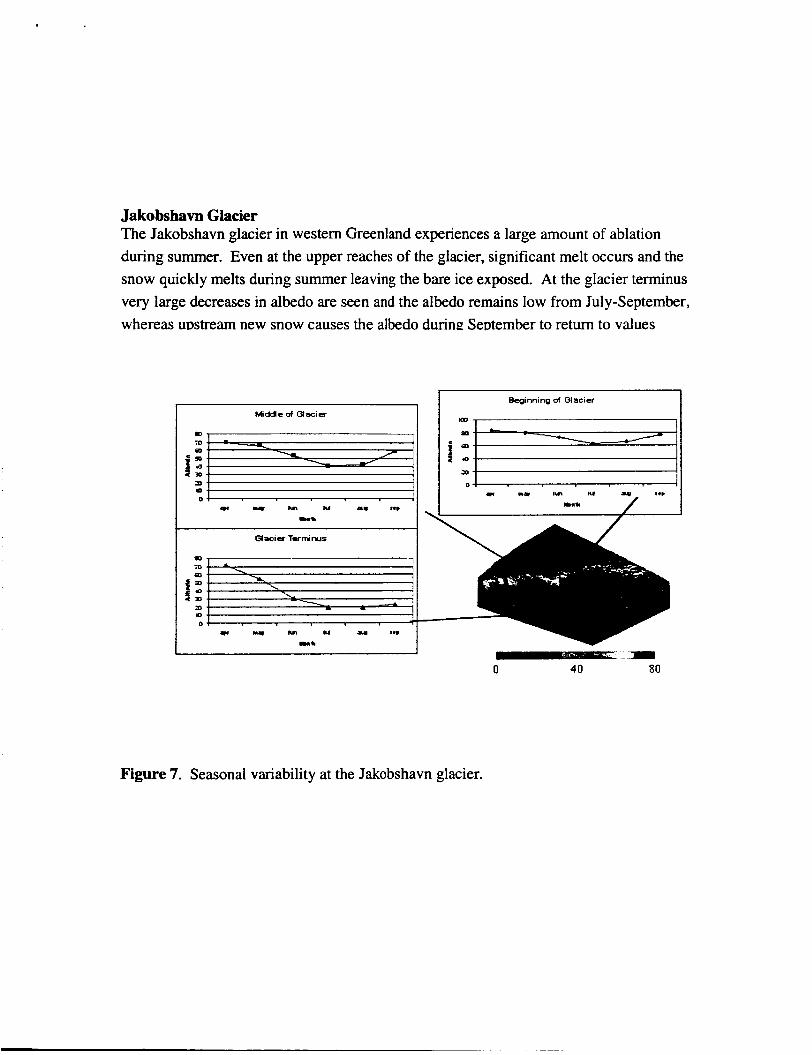
Jakobshavn Glacier The Jakobshavn glacier in western Greenland experiences a large amount of ablation during summer. Even at the upper reaches of the glacier, significant melt occurs and the snow quickly melts during summer leaving the bare ice exposed. At the glacier terminus very large decreases in albedo are seen and the albedo remains low from July-September, whereas uDstream new snow causes the albedo during SeDtember to return to values
Midde of Glacier
0 10 -
I - 1 I
0 40 80
Figure 7. Seasonal variability at the Jakobshavn glacier.
3.2 Interannual Variability in Albedo The following figures show the mean surface albedo averaged over the entire glacier drainage basin for each year as well as the departures from the mean (given in units of standard deviation). Missing data points are a result of not enough clear sky images during the month to derive the mean for that month. Petermann Glacier During the early to mid-80s the albedo show similar seasonal cycles, but during the late 80s and the mid to late 90s there is a tendency towards lower mid-summer albedo. In addition, in the mid to late 90s the seasonal variability in albedo has increased in amplitude, with lower summer albedo than in previous years, suggesting increased ablation during this time-period. Overall, there is a slightly negative albedo trend which is influenced by the decrease observed during the past decade.
Figure 8(a). Surface albedo from 1981-2000 at the Petermann Glacier.

i-
._ i .. !-
i -
i-
Figure 8(b). Departures from the mean.
Kangerdlugssuaq Glacier In contrast to the Petermann glacier there is a stronger seasonal cycle of the surface albedo for this glacier. This is because the Petermann glacier does not experience a lot of snowfall, whereas the Kangerdlugssuaq glacier does. In the late 80s and early 90s the albedo was observed to be anomalously low during spring and late summer compared to the previous years. The low albedo observed in 1988, 1990 and 1995 correspond to earlier melt (e.g. April-June) which agrees with previous passive microwave melt observations in this area. Overall there is a slightly positive trend in the surface albedo
- I
'L ::.e: L.v?rI;?
Figure 9(a). Surface albedo from 1981-2000 at the Kangerdlugssuaq Glacier.

r c - - c
f -i - I
1-
I_
f
t
Figure 9(b). Departures from the mean.
Storstrammen Glacier
This glacier also experiences even larger seasonal variability than the Kangerdlugssuaq glacier. Anomalously low albedo were observed during the mid 80s when the glacier was surging, but since then, the trend has been towards an increase in the surface albedo, especially during the late 90s. Since the glacier is now known to be quiescent it is not sumrising that the albedo increased during the 9 0 s compared with the 80s.
i- I- I r
t
i l-
L.. -+
a Figure 10(a). Surface albedo from 198 1-2000 at the Storstr~rmmen Glacier

Figure 10(b). Departures from the mean.
Jakobshavn Glacier Again, large seasonal variability in surface albedo occurs for this glacier. The low albedo during 1995 agrees with observations of surface melt from passive microwave data. Similarly, the peak in 1996 corresponds to early freeze-up and an overall low melt year. The peak in 1992 corresponds to the eruption of Mt. Pinatubo during summer 1991 that resulted in low temperatures during 1992 and very little melt. Similarly, the anomalously high albedo in 1983 followed from the eruption of El Chichon.
1: i- I
Figure ll(a). Surface albedo from 1981-2000 at the Jakobshavn Glacier.

Figure ll(b). Departures from the mean.
3.3 Monthly Trends in Albedo The following figures show the individual monthly trends in surface albedo for each glacier together with the standard deviation. Results are given for at the glacier terminus, mid-way up the glacier, at the start of the drainage basin, and the average of the entire glacier drainage basin. Petermann Glacier No significant changes in albedo near the upper reaches of the glacier, except during September. However, there are decreases in albedo during June and July near the terminus of the glacier. Thus, some of the recent thinning at this glacier could be a result of increased surface melt, which appears to be governed by the large reductions in albedo observed during the late 90s. However, we remain cautious in interpreting trends at the glacier terminus because of the potential for contamination of the glacier pixel by the surrounding landwater. In general though, there is a tendency towards lower surface albedo throughout the drainage basin from June through September.

i f
4
J
5 T
!.
Figure 12. Monthly trends in albedo for the Petennann glacier.
Kangerdlugssuaq Glacier A large positive trend in September albedo is observed throughout the drainage basin but there is no significant trend in albedo during mid-summer months. In fact, for most of the glacier, the albedo trends are positive. We do not observe any significant decrease in albedo at the terminus of the glacier, although this glacier has been shown by laser altimeter flights to be retreating. Thus, it appears that the recent thinning at terminus is not a result of increased surface melting.
3 f L
Figure 13. Monthly trends in albedo for the Kangerdlugssuaq glacier.
Storstrrrmmen Glacier
At this glacier, diversely different trends are observed at different locations on the glacier. At the higher elevations (e.g. start of the glacier boundary), there is not a large change in albedo observed from 1981-2000 except during the month of August where there has been a negative trend in the surface albedo of around 4%/decade. Further downstream, the largest negative trend in albedo is also observed during August. At the glacier terminus however, there is no negative trend in albedo during August. Instead, there is a slightly negative albedo trend during spring. Overall, the albedo trend has been positive at this glacier for all months, except August.

Figure 14. Monthly trends in albedo for the Storstrgmmen glacier.
Jakobshavn Glacier Little albedo trends are observed over the upper reaches of the glacier and when taken as a whole, the glacier shows slightly positive trends in albedo during each month. The largest negative trend in albedo is found during mid and late summer near terminus of glacier. Thus, results could suggest enhanced summer melt and delay in freeze-up near end of glacier which would support recent observations of significant retreat of the Jakobshavn glacier. However, at this glacier as well as at the other glaciers, caution is needed when interpreting results near the glacier terminus as the satellite pixel is likely a mixture of not only the glacier, but also the surrounding land and water.

Figure 15. Monthly trends in albedo for the Jakobshavn glacier.
4. Changes in Albedo near the Jakobshavn Glacier 4.1 Seasonal Variability in Albedo
Jakobshavn glaciers. As expected, the strongest seasonal variability in albedo occurs at the lowest elevation site (JAFU). At this site, albedo in spring and early summer is slightly greater than 0.6 (bare ice), but as the summer progresses, melt and melt ponding, result in a rapid decline in albedo so that by August the mean albedo is near 0.26. However, since this site is located only 200m away from the coast, mixed pixel effects with the adjacent land may also contribute to the low summer albedo observed at this station. Furthermore, in mid-melt season, the dust (cryonconite) effect is probably significant. Cryonconite accumulates on the net ablation surface since the net ice motion is vertically upward, and therefore, it concentrates at the surface with time leading to low late-summer albedos at JAR3 (J. Box, pers. corn.) .
Slightly further up the ice sheet at JAR2 the albedo values are about 10% higher during spring and early summer than at JAR3. The surface may be snow-covered during April, but as the temperatures warm, the snow melts off leaving the bare ice exposed. Further melting results in significant melt ponding and the albedo reaches its minimum during August (-0.4). At JARl , Swiss Camp, and Crawford Point, the albedo during May and June are similar since the surface is covered by new or dry snow. However, since JARl is still in the ablation region, the snow melts, exposing the bare ice during summer and melt ponds form so that the albedo reaches its low of around 0.52 in July.
Figure 16 shows the monthly climatologies of albedo for the individual AWS near the
Melting persists during August and part of September and the albedo is about 10% less at the end of the melt season (e.g. September) than at the beginning of the melt season (e.g. April and May).
Swiss Camp is located at the equilibrium line altitude of the Greenland ice sheet. It is snow covered at the start of the summer season, but significant melting occurs during the summer months, particularly in July and August. Melt lakes that form within about lkm of the AWS contribute to the low albedo observed in the satellite observation for this station. By September however, new snow fall and colder temperatures cause the mean alt&-t&&&-& v w j i t y in albedo throughout the summer months. This is expected since the station is in the accumulation region of the ice sheet where there is little or no melt. There is a slight decrease seen in the albedo during June, July and August that could be caused by some surface melting or by lack of precipitation and .!?%e a reduction in albedo caused by increase in snow grain size (snow metamorphism). ‘L
Figure 16. Monthly mean climatology of surface albedo at the five AWS stations extending from the ablation region to the dry snow region at nearly 2000m a.s.1.
4.2 Monthly Trends in Albedo Moving up above the Jakobshavn glacier basin to the individual AWS stations we see
the impact of increasing summer temperatures on the summer albedo (Figure 17). The largest decreases are observed at the lowest elevation stations, with a maximum trend of - 2l%/decade during September at JAR3. Large September trends are also observed at JAR2 (-13%/decade). Both JAR3 and JAR2 exhibit similar variability in albedo trends, with the largest negative trends observed in April, May and September. This could indicate early melt onset and delay in freeze-up. Md-summer trends are still quite large, but not as large as at the start and end of the melt season. This is not too surprising since these stations already experience a lot of summer melt from June-August.
At JAR1, Swiss Camp and Crawford Point, the strongest declining albedo trends are observed during July (5.5%, 5.9% and 5.2%, respectively). These results suggest enhanced summer melt during summer that extends up to the higher elevations of the ice sheet (i.e. -2000m.a.sl.). Large negative trends also occur in September at JAR1 and Swiss cam^. which may be a result of a delay in the freeze-uD.
-1. ---. ,_ ,_______ __- -. _I__-
J = _- -__ i...
-. ..: _- . >.. e -
1 . . .-:- i r I. , . L
1 .
A -
+ ., . . .
. .
.: . r ! r - .
.-
_ _ , i . . .... ~. .~
-p. V C , -r - 1 Y
a , > - , -
Figure 17(a)-(e). Seasonal variation in linear albedo trends for each month at the individual AWS stations. Standard deviation in albedo trends are also shown.
80 0 - 60 8 s 7 40
20
0
Figure 18. AVHRR-derived climatology of monthly albedo for the Jakobshavn glacier with MISR (circles) and MODIS (triangles) albedo from 2002.
Above the glacier, similar conditions were observed (e.g. Figure 19), with lower albedo observed at the start of the melt season (May and June). In Figure 19 the climatological mean albedo for JAR2 is shown together with the albedo from the individual MODIS and MISR images. In Figure 20 the corresponding 16-day black sky albedo is shown for 2000-2002. This data also indicates that melt began earlier in 2002 than it did in either 2000 or 2001. However, in contrast to the Jakobshavn drainage basin, the albedo was also observed to be lower during June and July at the AWS in comparison with the long-term mean, suggesting above normal melt during summer 2002 in that region. Since August and September albedo were found to be similar to the
a
I I I I I

Figure 19. Climatology of monthly albedo for JAR2 with MISR (circles) and MQDIS (triangles) albedo from 2002.
E 3
Figure 20. Albedo from the MODIS (MOD43) 16-day albedo product for 2000 through 2002 at JAR2.
climatological values, it doesn’t appear that the melt season lasted longer than normal, only that it began earlier and was substantial in com arison with other years.
albedo are seen at Crawford Point during summer (Figure 21 and Figure 22). Our results are consistent with passive microwave observations of melt during 2002 (K. Steffen, pers. comm.) that showed melt extending to elevations above 2ooOm during 2002. The conditions that led to the unusual melt, both over the ice sheet as well as over the Arctic sea ice can be attributed to anomalously wann temperatures during 2002. Most of the Arctic, including all of Greenland experienced above normal temperatures during summer 2002. These warm temperatures led to enhanced summer melt and therefore
Since the melt extended up to elevations above f OOOm during 2002, anomalously low
Figure 21. Climatology of monthly albedo for Crawford Point with MISR (circles) and MODIS (triangles) albedo from 2002.

Figure 22. Albedo from the MODIS (MOD43) 16-day albedo product for 2000 through 2002 at Crawford Point.
6. Significance of Results Using a simple energy-balance model gives a general idea of the significance of an
albedo change in terms of melt. We examined the significance of the albedo trends for the individual AWS using a simple energy balance model. This energy-balance model calculates melt M on an hourly basis as:
where pw is the density of water, Lf is the latent heat of fusion and a is the albedo taken fiom the mean monthly values derived from the APP data set as shown in Figure 16. The incoming shortwave radiation S- and the incoming longwave radiation L- are both determined with parameterizations fiom KonzeZmunn and others [ 19941 established at ETWCU camp. The longwave radiation L- emitted by the surface is calculated in accordance with the Stefan-Boltzmann law, whereas the sensible and latent heat fluxes, QH and QL, are calculated using the simple bulk transfer approach of Zuo and OerZemans [1996]. The last term, QG, is the change of heat of the thermally active part of the i cehow surface which is calculated according to OerZemans [ 199 13 as thermodynamically equivalent to a 2-m thick ice layer based on observations of Ambach [ 19631. The annual variation in air temperature is prescribed as a cosine function, with a temporally varying lapse rate as presented by Steflen and Box [2001] based on data from the Jakobshavn ablation area.

The significance of an albedo change on ablation can be qualitatively estimated by imposing a uniform shift of the reference albedo shown in Figure 23 during April to September, while keeping it unchanged in the winter. The reference albedo is calculated as an average of the monthly mean albedos of the APP data set over the period 1981 to 2000 (climatological mean) at the AWS sites. The change in annual ablation is calculated for shifts of -5%, -lo%, -15% and -20% in terms of absolute albedo to simulate the impact of likely albedo trends at different points in the ablation area. As shown in Table 2, a 20% decrease in the albedo would imply a 29% increase in ablation at 500m elevation and a 189% increase at 1 OOOm elevation. Current estimates in changes of albedo near the Jakobshavn glacier reveal decreases of 20%/decade at 300m, lO%/decade at 500m and 5%/decade at 1000m.
Figure 23. Reference albedo at JAR3, JAR2, JAR1, Swiss Camp and Crawford Point used to force the energy balance ablation model.

Table 2. Computation of annual ablation in meters given for different % albedo changes. The reference case shows the annual ablation using the climatological mean summer
6. Conclusions A change in the Greenland climate towards warmer temperatures will lead to an
increase in surface melting and a subsequent increase in the rate of ice flow through lubrication of the bed. Acceleration of the glaciers of a large ice sheet such as the Greenland ice sheet will significantly contribute to a rise in sea level, which is currently rising by approximately half an inch per decade. Enhanced runoff from the Greenland ice sheet, together with excessive melting of the sea ice has the potential to “cap” deep wat r convection i e No h At t‘c an r found1 imp ct lobal ean circql tion
n%t revezany signitcant %$Ak%% the albedo except at the terminus of the Petermann and Jakobshavn glaciers. However, since contamination of the satellite pixel by land and water is likely, not much confidence can be placed in the results at these locations. The Jakobshavn drainage basin does not reveal any significant decreases in albedo since 1981 that would help to explain recent thinning at this glacier in terms of increased surface melt. The same is true at the Kangerdlugssuaq glacier. Thus, even though coastal temperatures have increased significantly in recent years, the thinning of the Jakobshavn and Kangerdlugssuaq glaciers cannot be explained by ablation driven by surface energy balance. However, above the Jakobshavn drainage basin, large summer decreases in albedo have occurred over the past 20 years, which will have a considerable impact on the amount of ablation in the region. Large decreases in albedo are apparent at the AWS near the Jakobshavn glacier, particularly throughout most of the 1990s. The largest decreases in surface
Lyestigation o~ $e sulFace aEi/o at iie Pour glaJers
albedo were found during spring at the lower elevation sites and during mid summer at higher elevations, suggesting that melt is beginning earlier than normal near the coast and is extending up to higher elevations during summer. This is the scenario observed during the anomalously warm and extreme melt year of 2002.
they occur. It could be possible that the increases in surface melt above the drainage basin may influence glacier ice dynamics by transmission of surface melt water to the base of the Jakobshavn glacier. However, in order to fully assess the impact of albedo change during the period of thinning observed by Thomas et al. [2003] (1997-2002), a more detailed analysis of the albedo change and corresponding ablation change is needed in comparison to the period of 1981-1996. This will require collecting all the necessary data to do a full energy balance model of the Jakobshavn glacier which is out of the scope of this project. 7. References Abdalati, W. and 9 others, 2001. Outlet glacier and margin elevation changes: near-coastal thinning of the Greenland ice sheet, J. Geophys. Res., 106@24), 33,729-33,742.
Abdalati, W. and K. Steffen, 2001. Greenland ice sheet melt extent: 1979-1999, J. Geophys. Res., 106@24), 33,983-33,988.
The significance of the decreases in summer albedo will depend on when and where
Ambach, W., 1963. Untersuchungen zum Energieumsatz in der Ablationszone des gronlandischen Inlandeises, Meddelelser om Gronland ,174, (4), 50-64.
Knap, W. H. and J. Oerlemans, 1996. The surface albedo of the Greenland ice sheet: satellite-derived and in situ measurements in the Sondre Stromfjord area during the 1991 melt season, J. Glaciol.,.
Konzelmann, T., R.S. W. Van de Wal, W. Greuell, R. Bintanja, E.A.C. Henneken, A. Abe-Ouchi, 1994. Parameterization of global and longwave incoming radiation for the Greenland ice sheet, Global Planet. Change, 9, 143-164. Krabill, W.B., and 9 others. 2000. Greenland ice sheet: high-elevation balance and peripheral thinning. Science, 289(5478), 428-430.
42(141), 364-374.
Oerlemans, J., 1991. The mass balance of the Greenland ice sheet: sensitivity to climate change as revealed by energy-balance modeling, Holocene, 1( I), 40-49.
c
Schaaf, C. B., F. Gao, A. H. Strahler, W. Lucht, X. Li, T. Tsang, N. C. Strugnell, X. Zhang, Y. Jin, J.-P. Muller, P. Lewis, M. Barnsley, P. Hobson, M. Disney, G. Roberts, M.
IEdf!!?,%emote Lian , an J. L Priv Rrst underdale operation C BM, a&o an8 nadr re2ctancgproiucts from Sens. Environ., 83, 135-148.
d' nt emo t, B .Hu
Serreze, M.C., J. Maslanik, T.A. Scambos, F. Fetterer, J. Stroeve, K. Knowles, C. Fowler, S . Drobot, R. Bany and T.M. Haran, A recored minimum Arctic sea ice extent and area in 2002,2003. Geophysical Research Letters, 30(3), 11 10-1 113.
Stamnes, K., S-C. Tsay, W. Wiscombe, and K. Jayaweera, 1988. Numerically stable
algorithm for discrete-ordinate-method radiative transfer in multiple scattering
and emitting layered media, Applied Optics, 27,2502-2509.
Steffen, K., J. E. Box, and W. Abdalati, 1996. Greenland Climate Network: C-Net, in Colbeck, S . C. Ed. CRREL 96-27 Special Report on Glaciers, Ice Sheets and Volcanoes, trib. to M. Meier, pp. 98-103.
Steffen, K. and J.E. Box, 2001. Surface climatology of the Greenland ice sheet: Greenland climate network 1995-1999, J. Geophys. Res., 106@24), 33,951-33,964.
Stroeve, J., Box, J., Gao, F., Liang, S.,Nolin, A., Schaaf C., Accuracy Assessment of the MODIS 16-day Albedo Product for Snow: Comparisons with Greenland in situ Measurements. Remote Sensing of the Environment, submitted Stroeve, J. and A. Nolin, 2003. Comparison of MODIS and MISR-derived surface albedo with in situ measurements in Greenland, EARSeL Proceedings, 2( l), 88-96.
Stroeve, J. 2002. Assessment of Greenland albedo variability from the AVHRR Polar Pathfinder Data set, Journal of Geophysical Research-Atmospheres, 106@24), 33,989- 34,005.
Stroeve, J. and A. Nolin, 2002. New Methods to Infer Snow Albedo from the MISR Instrument with Applications to the Greenland Ice Sheet, Transactions on Geoscience and Remote Sensing, 40(7), 1616-1625.
Stroeve, J.C., J.E. Box, C. Fowler, T. Haran, and J. Key, 2001. Intercomparison Between in situ and AVHRR Polar Pathfinder- derived Surface Albedo over Greenland, Remote Sens. Environ., 75(3), 360-374.

Thomas, R.H., W. Abdalati, E. Frederick, W.B. Krabill, S. Manizade, and K. Steffen, 2003. Investigation of surface melting and dynamic thinning on Jakobshavn Isbrae, Greenland, J. GZucioZog., 49( 165),
Zuo, Z. and J. Oerlemans, 1996. Modeling albedo and specific balance of the Greenland ice sheet: calculations for the Sondre Stromfjord transect, J. GZucioZ., 42(141), 305-317.
23 1-239.
. ._ .