greening the region using stormwater infrastructure may 7, 2014 jim simmonds king county water and...
TRANSCRIPT

1
Greening the Region Using Stormwater
Infrastructure
May 7, 2014
Jim Simmonds
King County Water and Land Resources Division
[email protected]/7/2014
2
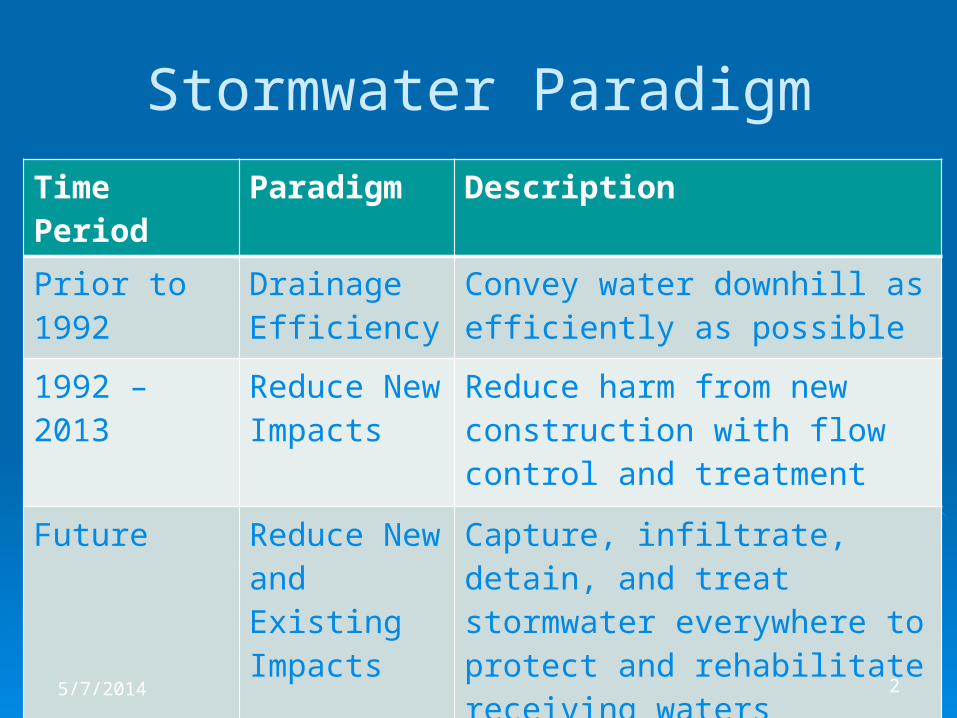
Stormwater Paradigm
Time Period Paradigm Description
Prior to 1992 Drainage Efficiency
Convey water downhill as efficiently as possible
1992 – 2013 Reduce New Impacts
Reduce harm from new construction with flow control and treatment
Future Reduce New and Existing Impacts
Capture, infiltrate, detain, and treat stormwater everywhere to protect and rehabilitate receiving waters
5/7/2014

3
Parcels Built Before
Stormwater Controls Required
About three-fourths of urban lands lack stormwater facilities5/7/2014
4
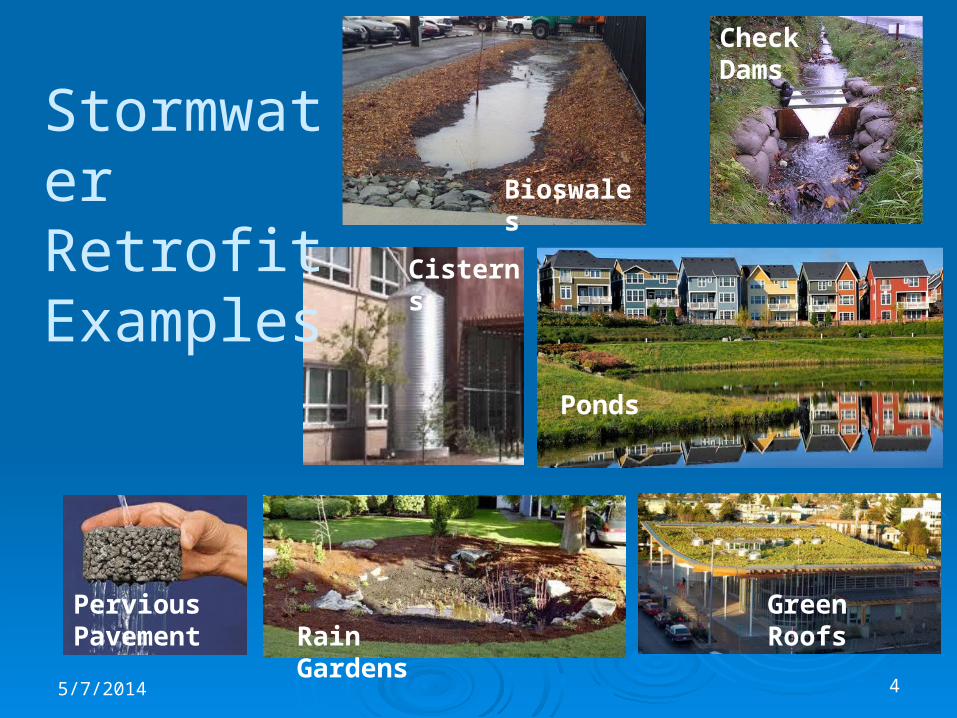
Stormwater Retrofit Examples
5/7/2014
Ponds
Bioswales
Check Dams
Cisterns
Pervious Pavement Rain Gardens
Green Roofs

5
Estimated Stormwater Needs
$3B - $15B for treatment in Puget Sound Capital costs, no O&M, no land costs
$1.4B for Juanita Creek basin (7 sq miles) Full lifecycle cost
$1.1B for 64 small basins in unincorporated King County Full lifecycle costs
5/7/2014
6
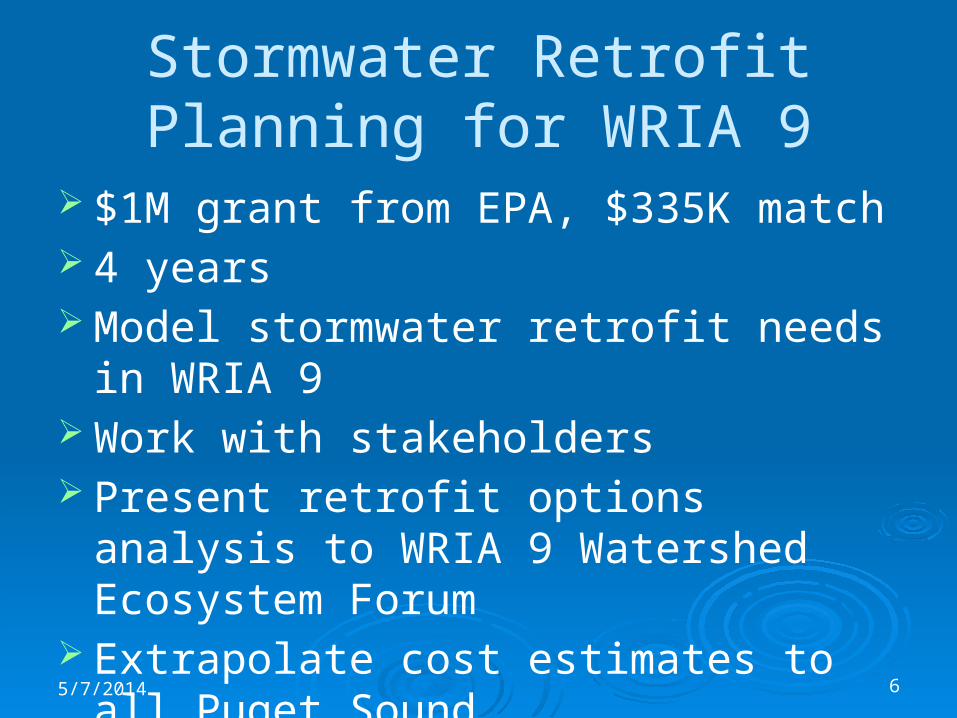
Stormwater Retrofit Planning for WRIA 9
$1M grant from EPA, $335K match 4 years Model stormwater retrofit needs in WRIA 9 Work with stakeholders Present retrofit options analysis to WRIA 9
Watershed Ecosystem Forum Extrapolate cost estimates to all Puget
Sound
5/7/2014
7
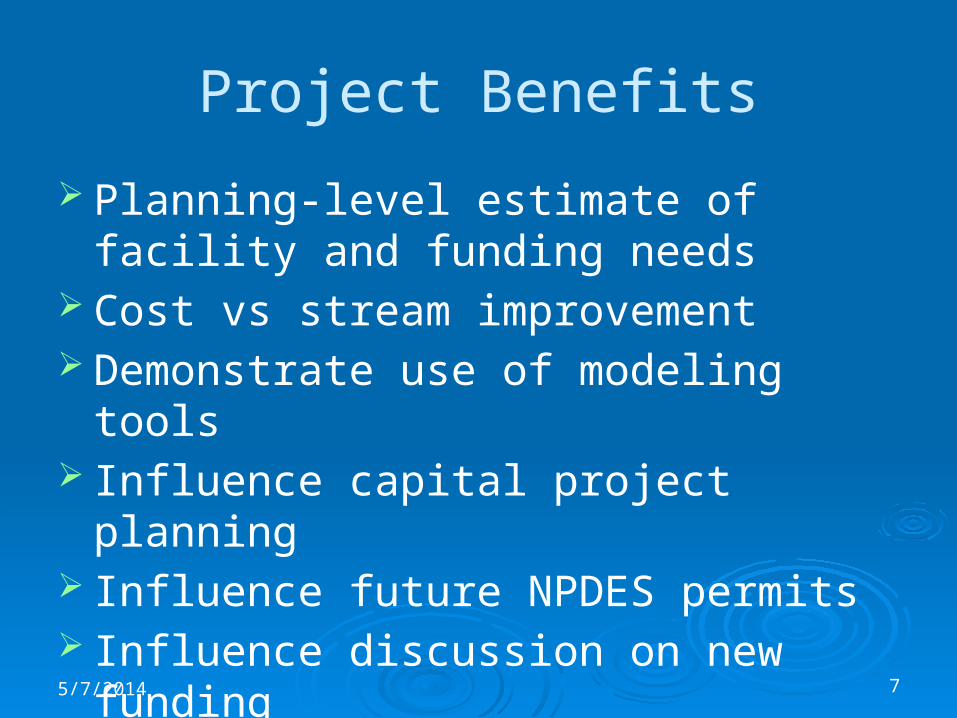
Project Benefits
Planning-level estimate of facility and funding needs
Cost vs stream improvement Demonstrate use of modeling tools Influence capital project planning Influence future NPDES permits Influence discussion on new funding
5/7/2014

8
Approach
Gather geospatial data about existing stormwater facilities, soil, precipitation
patterns, slope, impervious area, development type, land costs, stream channels
Conduct hydrologic modeling Model hydrologic improvements with
stormwater facilities
5/7/2014

9
Future Development2007 Satellite-Derived Land Use (UW 2007)
2040 Simulated Land Use (Alberti 2009)
5/7/2014
10
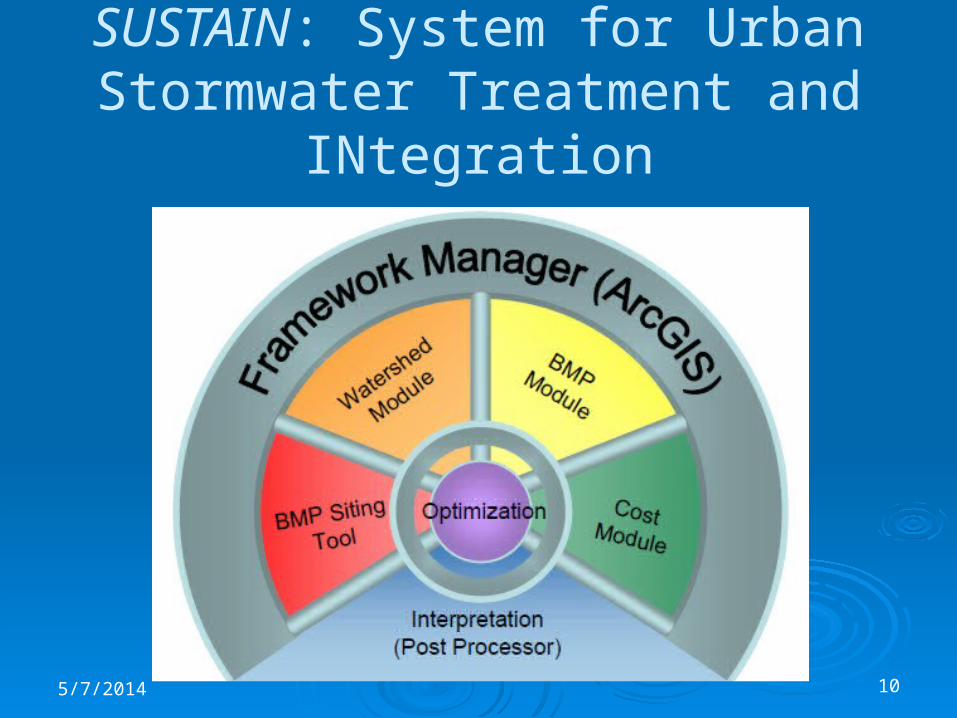
SUSTAIN: System for Urban Stormwater Treatment and INtegration
5/7/2014

11
Modeling Approach
Study area: 278 mi2, 446 catchments Model 135 hypothetical 100-acre catchments
representing combinations of: 5 generic land uses 3 soil types 2 slopes 3 precipitation zones 2 land costs
5/7/2014

12
SUSTAIN Optimization Target: Reduce Stream Flashiness
High Pulse Count: Number of times mean daily flows ≥ high-flow threshold set at 2 X long-term mean daily flow rate
5/7/2014
13
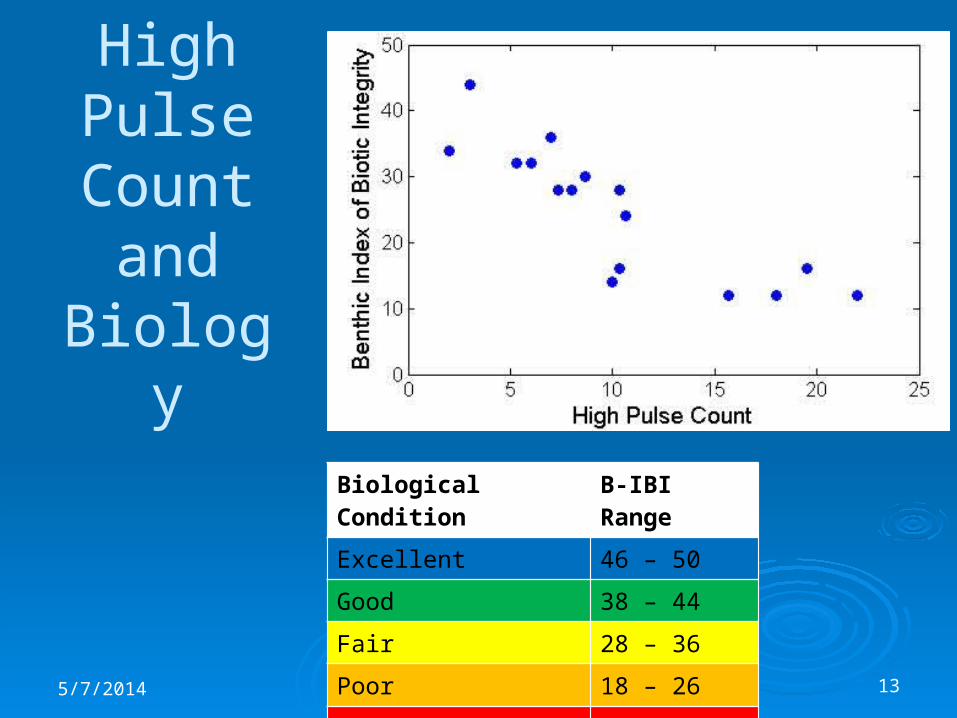
High Pulse Count and
Biology
5/7/2014
Biological Condition B-IBI Range
Excellent 46 – 50
Good 38 – 44
Fair 28 – 36
Poor 18 – 26
Very Poor 10 – 16
14
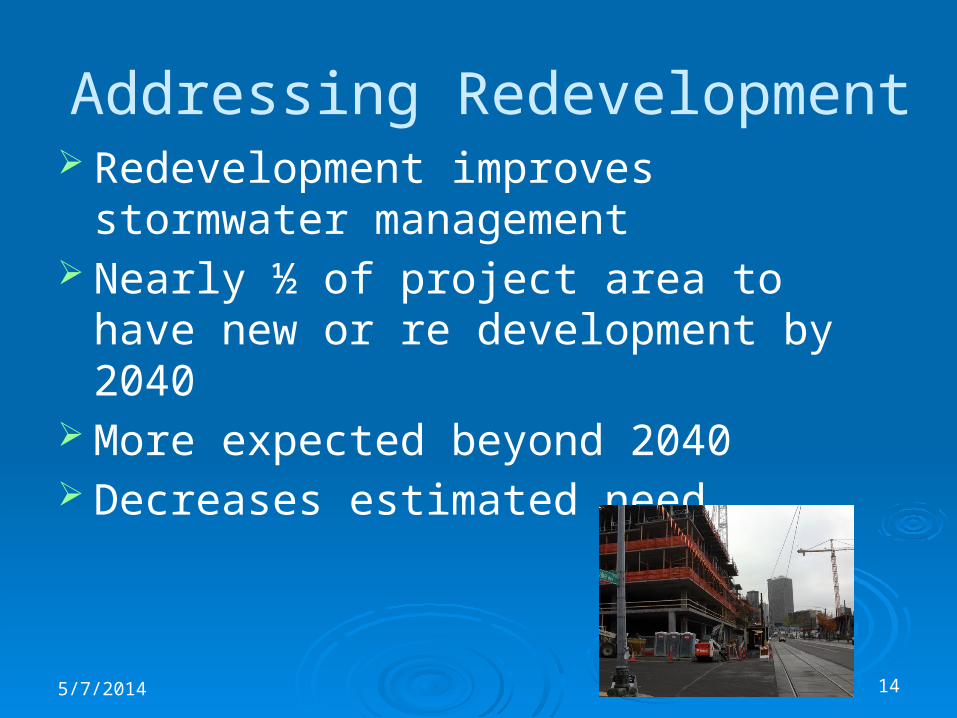
Addressing Redevelopment Redevelopment improves stormwater
management Nearly ½ of project area to have new or re
development by 2040 More expected beyond 2040 Decreases estimated need
5/7/2014
15
Addressing Climate Change
Three approaches for assessing impacts Analysis of precipitation patterns for
downscaled global climate model output Impacts of climate change on hypothetical
pond sizing Impacts of climate change on high pulse
count in hypothetical basin Likely need about 10% more flow control,
but model variability is large
5/7/2014
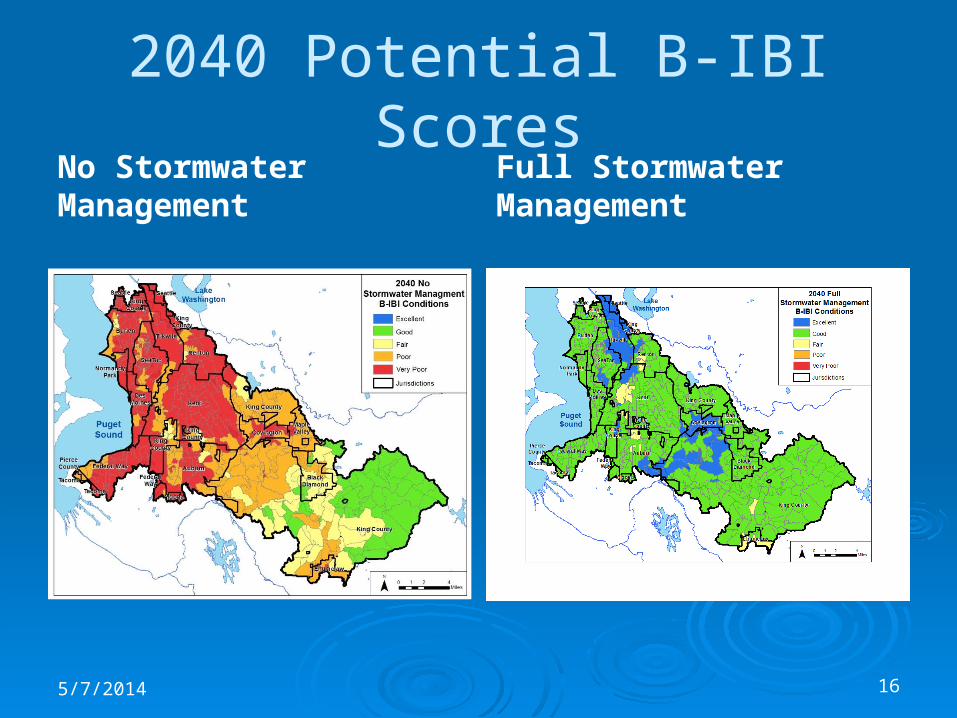
16
2040 Potential B-IBI ScoresNo Stormwater Management
Full Stormwater Management
5/7/2014
17
Policy and Planning Horizon are Everything
How stringent are stormwater requirements for redevelopment?
How aggressively do public programs build facilities?
How long in the future do we aim for success?
5/7/2014

18
What If?
Assume new and redevelopment builds on-site facilities and developers contributes funds to build off-site facilities (ponds)
Assume public funds used to build everything else
Assume all stormwater facilities built within either 30 years
5/7/2014

19
Annual Public Costs
Capital Operation and Maintenance
Inspection and Enforcement
New and Re-Development
$88M $4M $320M
Roads and Highways
$21M $19M $28M
Everything Else
$98M $89M $170M
Total $207M $112M $518M
5/7/2014

20
The Big Questions
How quickly do we want to improve stream flows and water quality?
To what degree do we want to improve stream flows and water quality?
Where does capital funding come from? Where does operating funding come from?
5/7/2014
21
Project Team Don Robinett, SeaTac
Ben Parrish, Covington
Chris Thorn, Auburn
Jeff, Burkey, Curtis DeGasperi, David Funke, Larry Jones, Chris Knudson, Beth leDoux, Doug Navetski, Elissa Ostergaard, Giles Pettifor, Dan Smith, Allison Vasallo, Mark Wilgus, Olivia Wright, King County
Rich Horner, Erkan Istanbullouglu, UW
Ed O’Brien, Mindy Roberts, Ecology
Dino Marshalonis, Michelle Wilcox, EPA
Tamie Kellogg, Kellogg Consulting5/7/2014