greening effect of spatio-temporal power sharing policies
TRANSCRIPT
1
Greening Effect of Spatio-Temporal Power SharingPolicies in Cellular Networks with Energy Constraints
Jeongho Kwak, Student Member, IEEE, Kyuho Son, Member, IEEE,Yung Yi, Member, IEEE and Song Chong, Member, IEEE
Abstract—Greening effect in interference management (IM), away of enhancing spectrum sharing via intelligent transmit powercontrol, can be achieved by the fact that as BSs moderatelyreduce their transmit powers, the performance degradationdecreases slower than linearly, yet a considerable overall energysaving is expected due to transmit powers’ exerting influenceon operational power. This paper investigates the impact ofdifferent spatial and/or temporal power sharing policies for agiven system-wide power budget in IM schemes. We developan optimization-theoretic IM framework on cellular networkgreening, from which we first develop four IM schemes governedby different power sharing: no sharing, only temporal sharing,only spatial sharing, and both spatial and temporal sharing.Through extensive simulations, including a real BS deploymentin Manchester city, United Kingdom, we obtain the followinginteresting observations: (i) the gains both from performanceand power saving are obtained by adopting the spatial and/ortemporal power sharing policies, (ii) tighter greening regulation(i.e., smaller total power budget) leads to higher spatio-temporalpower sharing gain than IM gain, (iii) spatial power sharingsignificantly excels temporal one in terms of power saving, and(iv) higher greening efficiency can be achieved as the cell sizebecomes smaller.
Index Terms—Greening effect; interference management (IM);power budget; spatial power sharing; temporal power sharing;energy-saving regulations; power allocation; user scheduling;greening efficiency; different cell size;
I. INTRODUCTION
Information and Communication Technology (ICT) is oneof the industries consuming a significant amount of energy,reported to amount to about 2-10% of the world-wide energyconsumption [2]. In particular, the energy expended on theoperation of cellular networks reaches 25% of the total ICTenergy consumption [3], where base stations (BSs) are thedominant components consuming 60-80% of total energyusage in the whole cellular networks [2].
In a typical macro BS, the amount of transmit power isin fact low (e.g., 10-20W), compared to the total operationalpower (e.g., 500-2000W). However, the transmit power exertssubstantial influence on the required power for amplifiers,
This research was supported in part by the MKE(The Ministry ofKnowledge Economy), Korea, under the ITRC(Information Technology Re-search Center) support program supervised by the NIPA(National IT IndustryPromotion Agency) (NIPA-2012-(H0301-12-1003)) and in part by BasicScience Research Program through the National Research Foundation ofKorea (NRF) funded by the Ministry of Education, Science and Technology(2012-0003580). Some part of this work was presented at WiOpt 2011,Princeton, NJ, USA [1].
J. Kwak, Y. Yi and S. Chong are with the Department of ElectricalEngineering, Korea Advanced Institute of Science and Technology (KAIST),Daejeon 305-701, Korea (e-mail: [email protected], {yiyung, song-chong}@kaist.edu).
K. Son is with the Department of Electrical Engineering, Viterbi Schoolof Engineering, University of Southern California, Los Angeles, CA 90089(e-mail: [email protected]).
BS transmit power
SIN
R
Noise Limited
Interference
Limited
(a) SINR vs. transmit power
SINR
Ach
ieva
ble
Ra
te
Low SINR
High SINR
(b) Achievable rate vs. SINR
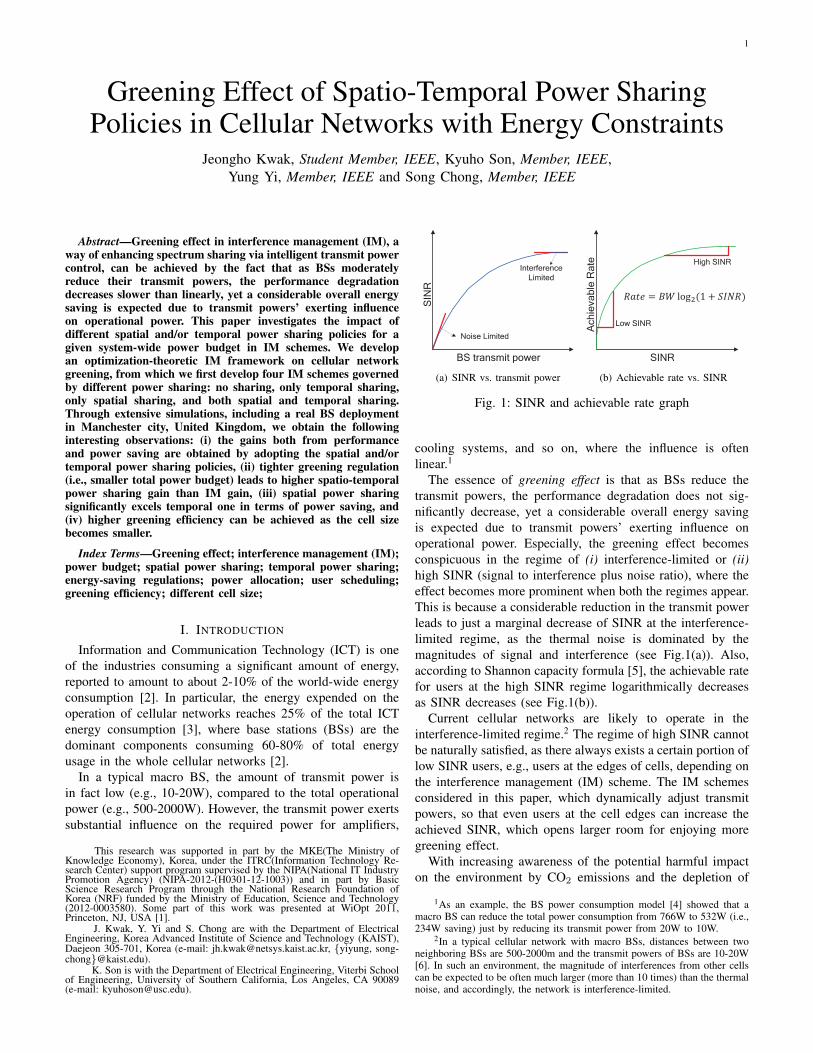
Fig. 1: SINR and achievable rate graph
cooling systems, and so on, where the influence is oftenlinear.1
The essence of greening effect is that as BSs reduce thetransmit powers, the performance degradation does not sig-nificantly decrease, yet a considerable overall energy savingis expected due to transmit powers’ exerting influence onoperational power. Especially, the greening effect becomesconspicuous in the regime of (i) interference-limited or (ii)high SINR (signal to interference plus noise ratio), where theeffect becomes more prominent when both the regimes appear.This is because a considerable reduction in the transmit powerleads to just a marginal decrease of SINR at the interference-limited regime, as the thermal noise is dominated by themagnitudes of signal and interference (see Fig.1(a)). Also,according to Shannon capacity formula [5], the achievable ratefor users at the high SINR regime logarithmically decreasesas SINR decreases (see Fig.1(b)).
Current cellular networks are likely to operate in theinterference-limited regime.2 The regime of high SINR cannotbe naturally satisfied, as there always exists a certain portion oflow SINR users, e.g., users at the edges of cells, depending onthe interference management (IM) scheme. The IM schemesconsidered in this paper, which dynamically adjust transmitpowers, so that even users at the cell edges can increase theachieved SINR, which opens larger room for enjoying moregreening effect.
With increasing awareness of the potential harmful impacton the environment by CO2 emissions and the depletion of
1As an example, the BS power consumption model [4] showed that amacro BS can reduce the total power consumption from 766W to 532W (i.e.,234W saving) just by reducing its transmit power from 20W to 10W.
2In a typical cellular network with macro BSs, distances between twoneighboring BSs are 500-2000m and the transmit powers of BSs are 10-20W[6]. In such an environment, the magnitude of interferences from other cellscan be expected to be often much larger (more than 10 times) than the thermalnoise, and accordingly, the network is interference-limited.

2
Instantaneous
Cell-level
Network-level
Average
Only temporal sharingNo sharing
Power
Time
BS 3
BS 4
BS 2
BS 1
(S,T)=(0,1)
Power
Time
BS 1
BS 2
BS 4
BS 3
(S,T)=(0,0)
Power
TimeSpatio-temporal sharing
BS 1
BS 2
BS 4
BS 3
(S,T)=(1,1)
Power
TimeOnly spatial sharing
BS 1
BS 2
BS 4
(S,T)=(1,0)
BS 3
Fig. 2: Four spatio-temporal power sharing policies and constraints.
non-renewable energy sources, there has been a consensuson the need to limit per-nation CO2 emission, e.g., Kyotoprotocol [7]. In the near future, a government is likely torelay such energy-saving pressure to all industries in thecountry. Pushed by the demand for a greening regulation,wireless service providers (WSPs) may be given the totalenergy budget, say, per year or month. A brute-force approachis just to decrease the instantaneous power constraint of eachindividual BS by some portion according to the regulation.However, such an approach seems inefficient because it cannotfully consider the spatial load difference over a space and thetemporal channel variation of users. Therefore, one of the mostimportant challenges for WSPs is how to efficiently share thegiven energy budget.
In this paper, we consider two power sharing policies, (i)spatial sharing and (ii) temporal sharing, and study theirgreening effect in the context of IM schemes. In the spatialsharing, we adaptively distribute the power budget across BSsin the network, depending on the variation of arrival traffic.In the temporal sharing, the power budget at each BS isadaptively changed over time, depending on the time-varyingchannel conditions of users. The time scale of spatial profileis slower than that of temporal profile because the trafficdistribution varies depending on the number of users in thesystem and their locations that is changing relatively slowlycompared to the fast channel variation. Fig. 2 depicts fourpossible combinations of power sharings: (i) no sharing, (ii)only temporal sharing, (iii) only spatial sharing, and (iv) bothspatio-temporal sharing. We also investigate the impact of fourpower sharings on the overall operational power in cellular net-works based on a realistic BS power consumption model [8].
For radio resource management in downlink cellular net-works, throughput or utility maximization objectives subjectto given transmit power constraints per each BS [9]–[14]
mostly have been considered rather than power minimizationobjectives subject to the quality of service (QoS) constraintsfor users [15]. This is because the power consumption on BSsrelatively had not been a major concern so far.
Recently, however, there have been efforts to conserve theenergy consumption at BSs, which includes [2], [16]–[20] ondifferent control time scales. For example, (i) the authors in[16] studied an energy-efficient BS deployment strategy thatis an issue of a long time-scale. It is natural that once BSsare deployed, it is hard to change their locations in at leastmonths or even years. (ii) In [2], [17], [18], load and location-aware BS switching on/off algorithms were proposed thatoperate with a fast time-scale (e.g., an order of hours) than thedeployment. (iii) In [19], the authors considered to incoporatea component-level deceleration with a faster time-scale, calledspeed-scaling, that is more conservative than turning off BSs,yet can conserve dynamic power effectively. (iv) The IMschemes can also bring energy savings, where IM refers toa technology that BSs dynamically control transmit powerson the order of time slots (e.g., an order of milliseconds) toincrease the efficiency of spectrum sharing by mitigating inter-cell interference. However, the conventional studies on IMhave focused on improving a system performance [10]–[14].In particular, Venturino et al. [10] presented several centralizedIM schemes that maximize the sum of long-term utilities ofusers, and Son et al. [13] further proposed a low-complexand fully distributed practical IM algorithm in heterogeneousmulti-cell networks.
There was also a greening approach based on IM in thecontext of wired DSL (Digital Subscriber Line) networks.Tsiaflakis et al. [21] proposed a fair-greening framework andshowed that when the power of each DSL line is fairly reducedto the half, respectively, the sum of rates can be achieved tomore than 85% if appropriate power control algorithms are

3
adopted. It is worthwhile mentioning that these works on wiredDSL networks can be interpreted as a special case of wirelessmulti-cell network, i.e., there is only one user in the cell, souser scheduling is fixed by the user and the wireless channelis fixed for a long time. Accordingly, the greening of wirelessmulti-cell networks becomes much more challenging than thatof wired DSL networks due to the additional user schedulingand stochastic channel variation issues.
The main contributions of this paper are as follows.1) We exhaustively investigate exploiting the network-wide
total BS power budget (including power consumptionof power amplifier, cooling system, signal processing,battery power, etc.) in the IM domain under consideringgreening policy of the government.
2) We suggest four spatial and/or temporal total BS powersharing constraints under the utility maximization frame-work, and develop joint user scheduling and power al-location per each time slot. To this end, we inherit theideas of convex approximation in the DSL network [22]at all of policies and greedy primal dual algorithm [23]at the temporal power sharing policies ((S,T)=(0,1) and(S,T)=(1,1)).
3) We observe the several key impacts of IM and spatio-temporal power sharing on the cellular greening: (i)the gains both from performance and power saving areobtained by adopting the spatial and/or temporal powersharing policies and the power saving gain of the spatialand/or temporal power sharing is larger than performancegain (i.e., percentage of reduced power consumption ishigher than that of increased throughput) due to thegreening effect, (ii) the tighter greening regulation (i.e.,the smaller total power budget) leads to the higher spatio-temporal power sharing gain in terms of performance,(iii) spatial power sharing significantly excels temporalone in terms of power saving, and (iv) as the cell sizebecomes smaller, greening effects are greater as well asthe greening efficiencies in all policies are larger. Theseobservations suggest that as more greening pressure isgiven to WSPs, it is important for them to distribute thegiven power budget spatially to conserve the network-wide BS operational power, especially in a trend whichthe cell size becomes smaller.
In the rest of this paper, we begin with a description ofthe system model in Section II. Next, in Section III, wemathematically investigate the impact of different cell sizes onthe greening under general power control schemes. In SectionIV, we propose greening IM schemes with four different powersharing policies. In Section V, we demonstrate the impactof IM with four power sharing policies on cellular networkgreening under various topologies and scenarios. Finally, weconclude this paper in Section VI.
II. SYSTEM MODEL
A. Network and traffic model
We consider a downlink wireless cellular network with mul-tiple cells. There are N BSs, and K users (or mobile stations),and denote by N .
= {1, . . . , N} and K .= {1, . . . ,K} the set
of BSs and users, respectively. Each of them has one transmitand one receive antenna. Each user can be associated with asingle BS. Denote by Kn the set of users associated with BSn, i.e., K = K1 ∪ · · · ∪KN and Kn ∩Km = ø for n ̸= m. Allof the adjacent BSs are assumed to communicate with eachother via high-speed wired and dedicated backhauls througha centralized BS controller (BSC) for the exchange of controlmessages.
We assume that each BS has an infinite buffer and alwayshas data for transmission to all associated users. We consideran OFDMA (Orthogonal Frequency Division Multiple Access)system where a subchannel is a group of subcarriers as thebasic unit of resource allocation. We further assume that thereis no interference across the subchannels. Denote by S .
={1, . . . , S} the set of subchannels, and each BS can use all thesubchannels for data transmissions, i.e., universal frequencyreuse.
B. Resource and Allocation Model
Consider a time-slotted system indexed by t = 0, 1, . . ..During a slot, the channels are assumed to be invariant.Each BS selects only one user for scheduling and determinesthe power allocation on each subchannel. Denote byIs
.= [Ik,ns : k ∈ K, n ∈ N ] the vector of user scheduling
indicators across all users and subchannels, where Ik,ns = 1if BS n schedules user k on subchannel s, and Ik,ns = 0otherwise. Denote by k(n, s) the user scheduled by BS n onsubchannel s. In order to reflect an OFDMA constraint thatat most only one user can be selected in each subchannel foreach BS, we should have:
• User scheduling constraint:∑k∈Kn
Ik,ns ≤ 1, ∀n ∈ N , s ∈ S. (1)
Let pns be the transmit power of BS n on subchannel s. Thevector containing transmit power of all BSs on subchannel s isps
.= [p1s, . . . p
Ns ]T . In parallel, the vector containing transmit
powers of all subchannels for BS n is pn .= [pn1 , . . . p
nS ]
T .There exists a limitation on the maximum level of transmitpower at each BS due to a hardware constraint (e.g., poweramplifier capability) or regulations from government agenciessuch as Ofcom in United Kingdom [6], or FCC (FederalCommunications Commission) in United States [24] due toharmful effect to human being. In our system model, suchlimitations are captured by the following constraint:
• Transmit power constraint:∑s∈S
pns (t) ≤ p̂n,licensed, ∀n ∈ N , (2)
where p̂n,licensed is the maximum permitted transmit powerlevel of BS n. We will consider additional power budgetconstraints later for various power sharing policies in the nextsection.

4
C. Link model
We do not consider interference cancelation techniques, andhence users treat the sum of received signal powers from otherBSs as a noise in each subchannel. For a power allocationvector ps, the received SINR (signal to interference plus noiseratio) from BS n to user k on subchannel s is denoted by
ηk,ns (ps) =gk,ns pns∑
m ̸=n gk,ms pms + σk
s
, (3)
where gk,ns and σks are channel gain from BS n to user k on
subchannel s and thermal noise of user k on subchannel s,respectively. The channel gain takes into account fast fadingand path loss. Following Shannon’s capacity formula [5],the potential data rate of user k associated with BS n onsubchannel s is given by
rk,ns (ps) =B
Slog2
(1 + ηk,ns (ps)
), (4)
where B is the entire system bandwidth. Note that rk,ns is themeaningful data rate for user k when the user k is selectedfor service by BS n on subchannel s and actual data rateof the user k becomes 0 when another user is selected. i.e.,rk,ns (ps, Is) = Ik,ns · rk,ns (ps). For notational simplicity, weomit B/S throughout the paper unless explicitly needed.
III. GREENING EFFECT UNDER DIFFERENT CELL SIZE
As the user demand of data traffic grows, the coverage ofBSs tends to become smaller to increase the capacity by en-joying a spatial reuse gain. This section examines the greeningeffect of general power control schemes under different cellsize through the mathematical analysis. Suppose that there aremulti-cells with radius r. Denote by pn,max
s the transmit powergiven by any power allocation scheme when the full powerbudget is given to the BSs. Now, we define following SINRratio (SR) to analyze the greening effect.
γ(θn, ϕn)k,ns =
gk,ns (r)pn,maxs θn
σks +
∑m ̸=n g
k,ms (r)pm,max
s ϕn
, (5)
SR(θn, ϕn)k,ns =
γ(θn, ϕn)
γ(θn = 1, ϕn = 1)=
θnϕn
(1 + hk,ns (r))
1ϕn
+ hk,ns (r)
, (6)
where hk,ns =
∑m ̸=n g
k,ns (r)pm,max
s /σks ; 0 ≤ θn < 1 and
0 ≤ ϕn < 1 represent the transmit power ratio of BS nand interference ratio from neighboring BSs to scheduled userassociated in BS n, respectively.
If the system uses an equal power allocation (EQ) scheme(i.e., all subchannels equally use the transmit power withoutany information about wireless environment), θn and ϕn foreach BS are the same. Under the same greening regulation,θn and ϕn per each BS are determined by each power allo-cation scheme (e.g., EQ or IM with any power sharing), thusSR(θn, ϕn)
k,ns are determined by only the noise-normalized
interference hk,ns (r). From the path loss channel model [5],
as the cell size becomes smaller, hk,ns (r) macroscopically
becomes higher, consequentially, SR(θn, ϕn)k,ns increases due
to the fact that 1ϕn
is always bigger than 1. This implies thatthe cellular system is operated at more interference-limited
region. In brief, the smaller cell size is, the larger greeningeffect can be expected under any power allocation scheme.
IV. GREENING INTERFERENCE MANAGEMENT SCHEMESWITH POWER SHARING POLICIES
A. Objective and Power Sharing Constraint
Our objective is to develop a slot-by-slot resource alloca-tion, consisting of user scheduling and BS power control,(p(t), I(t))∞t=0, whose long-term user rates are the solutionof an optimization problem with the constraints on schedulingand power budget with greening considered. The optimizationproblem is chosen such that
max∑k∈K
Uk(xk), s.t. x ∈ R(β), (7)
where Uk(xk) is the long-term utility function of user k whichis continuously differentiable and strictly increasing concavefunction3 and R(β) is the rate region (a set of all achievablerate vectors by any joint user scheduling and power control).The parameter β ∈ (0, 1], referred to as greening factor, playsan important role in saving power. It controls the amount ofpower budget reduction ratio based on a greening regulationpolicy. For instance, when β=1 (no regulation), BSs can usetheir maximum available powers, however, as β decreases,their power budget is reduced by a factor of β.
Several power sharing policies can be reflected in the aboveoptimization framework as constraints. The power budget con-straints of four different power sharing policies are presentedin Fig. 2. To refer to each power sharing policy, we henceforthuse the notation (S,T) = {(0,0), (0,1), (1,0), (1,1)}. The An
and Bn are the terms for modeling BS operational powerconsumption [8], which does and does not depend on thetransmit power of BS n, respectively.4
The P̂n,max and P̄n,max are instantaneous and averagepower constraints for BS n, respectively. Note that for a givengreening factor β, all power sharing policies guarantee to workunder the same long-term system-wide power budget. Eachpower sharing policy can be classified into network-level andcell-level power constraints spatially, and time average andinstantaneous power constraints temporally.
B. CASH: Centralized IM Algorithms with Different PowerSharing Policies
Our objective is to develop a slot-by-slot joint user schedul-ing and BS power control (p(t), I(t))∞t=0 for different powersharing constraints. To this end, we apply a stochastic gradient-based and greedy primal-dual techniques [23], [26] to a long-term utility maximization problem in (7). Then, solving thefollowing optimization problem at each time slot can lead tothe asymptotic solution for the original problem in (7). Fromnow on, we suppress the slot index t unless explicitly neededfor notational simplicity.
3We adopt the general α-proportional fair utility function [25]: Uk(xk) =(1− α)−1x1−α
k if α ≥ 0, α ̸= 1, and log xk if α = 1.4Typically, An and Bn for macro GSM/UMTS BSs depend on the
number of sectors, the number of power amplifiers per sector, power amplifierefficiency, cooling loss, battery backup, and so on [8].

5
(Slot-by-Slot) :maxp,I
∑k∈K
wk
∑s∈S
rk,ns (pns , Ins )−
∑n∈N
∑s∈S
AVE(pns ), (8)
subject to∑k∈Kn
Ik,ns ≤ 1,∀n ∈ N , ∀s ∈ S, (9)∑s∈S
pns (t) ≤ p̂n,licensed,∀n ∈ N , (10)
∑s∈S
Anpns (t)+Bn≤βP̂n,max, ∀n ∈ N , if (S,T) = (0,0), (11)∑
n∈N
(∑s∈S
Anpns (t)+Bn
)≤β
∑n∈N
P̂n,max, if (S,T) = (1,0),(12)
where wk is the derivative of utility dUk(Rk)dRk
|Rk=Rk(t) foruser k; AVE(pns ) is γ1p
nsQ
pcn for (S,T) = (0,1), γ2pnsQ
pn for(S,T) = (1,1) and 0 otherwise; Here, γ1 and γ2 are the step sizevalues which determine tradeoff between the required time forthe convergence and the optimality of algorithms. Finally, thevirtual queue lengths Qpc
n (t) and Qpn(t) can be updated asfollows:
Qpcn (t+ 1) =
[Qpc
n (t)− βP̄n,max −Bn
An
+∑s∈S
pns
]+, ∀n ∈ N ,
(13)
Qpn(t+ 1) =[Qpn(t)− (β
∑n
P̄n,max −∑n
Bn)
+∑n∈N
∑s∈S
Anpns
]+.
(14)
The key idea is in inheriting spatial power sharing con-straints, in conjunction with the scheduling constraint in (9)and the transmit power constraint in (10) [26]. Although thetime scale of spatial profile is slower than that of temporalprofile, spatial power allocation should be controlled per eachtime slot due to the scheduling constraint [27]. For temporalconstraints, we use the idea of a greedy primal dual algorithm[23] to construct a virtual queue, which is added to theobjective function as a penalty function AVE(pns ), i.e., if thetime-averaged constraint is more violated, then the penaltyincreases.
We now present CASH (Centralized IM Algorithms withdifferent BS power budget SHaring policies) for user schedul-ing and power control that can achieve a sub-optimal solutionsolving (Slot-by-Slot) that determines (p(t), I(t))∞t=0. Sincethe number of available joint power allocation and userscheduling combinations is huge, we take an approach tosolve the user scheduling problem for a given power allocationand the power allocation problem for a given user schedulingiteratively until they converge or the maximum number ofiteration is reached.5
5Unfortunately, the convergence of joint user scheduling and powerallocation cannot be guaranteed since the problem is a mixed-integer nonlinearprogramming (MINLP) and has local optima that may not be global optima.However, this technique is as widely accepted in recent literature [10], [13],where the authors proposed similar algorithms with our algorithm.
Lemma IV.1. For any feasible power allocation p, the prob-lem (Slot-by-Slot) can be decomposed into N×S independentintra-cell optimizations for each BS n and subchannel s.
Proof: For the given power allocation p, we can rewrite(8) as follows:∑
n∈N
∑k∈Kn
[wk
∑s∈S
Ik,ns · rk,ns (ps)− AVE(pns )
]
=∑n∈N
∑s∈S
[ ∑k∈Kn
wk · Ik,ns · rk,ns (ps)− AVE(pns )
].
(15)
As wk, rk,ns (pns ) and AVE(pns ) are given parameters, weonly have to consider dependencies among Ik,ns . Since theconstraint (1) do not play a role across different BSs andsubchannels (i.e., independent with the other BSs and sub-channels), the original problem is equivalent to independentlysolving the N × S subproblems for each BS and subchannel.Hence, the user scheduling at each BS can be representedas follows.
Ik,ns =
{1, if k=k(n, s)=argmaxk∈Kn
wkrk,ns (ps),
0, otherwise,(16)
This completes the proof of Lemma IV.1.On the other hand, for a given user scheduling I(t), the
problem (Slot-by-Slot) can be reduced to the following powerallocation problem:
maxp
∑n∈N
∑s∈S
[wklog2
(1+ηk,ns (ps)
)− AVE(pns )
], (17)
subject to(10) for all policies,(11) for (S,T) = (0, 0),(12) for (S,T) = (1, 0),
(18)
Unfortunately, even though a user scheduling is given, it isknown in [28] that the problem is computationally intractablesince the system objective is tightly coupled by the powers ofall BSs and nonlinear (neither convex nor concave) function.However, there exist several approximation techniques in liter-ature, see, e.g., [13], [22] and the references therein. With thehelp of CA-DSB algorithm [22] which is known to be a near-optimal power allocation algorithm in the DSL networks, weapply the similar concave approximation to the non-concaveobjective function in (17). Please refer to Appendix for moredetailed derivation of concave approximation.
For given user scheduling and the concave optimizationproblem, now we can derive the closed form power allocationby applying Karush-Kuhn-Tucker (KKT) conditions [29].
(User Scheduling and Power Allocation):
Ik,ns =
{1, if k = k(n, s) = arg max
k∈Kn
wkrk,ns (ps),
0, otherwise,(19)
pns =
[wk(n,s)/ ln 2
λn + taxns + V
−∑
m ̸=n gn,ms pms + σn
s
gns
]+0
, (20)
where V = {0, µ, γ1Qpcn , γ2Q
pn}for (S,T) = {(0, 0), (1, 0), (0, 1), (1, 1)},
(21)

6
taxns =
∑m ̸=n
wm|gn,ms |2/ ln 2∑
q ̸=n |gn,qs |2pqs + σn
s
−∑m ̸=n
wmgm,ns / ln 2∑
p gm,ps pps + σm
s
,
(22)
where taxns is the taxation term of BS n on subchannel s
taking into account that the power of BS n on subchannel swill give interference to the scheduled users in the neighboringcells. We assume that a BSC obtains all parameters related tothe taxation term such as interference and channel gains ofeach user from each BS. λn and µ are non-negative Lagrangemultipliers associated with the cell-level and network-levelinstantaneous BS power constraints, and these two multipli-ers must be chosen such that the following complementaryslackness conditions are satisfied, respectively:
λn
(∑s∈S
Anpns +Bn − βP̂n,max
)= 0, for (S,T) = (0, 0),
λn
(∑s∈S
pns − p̂n,licensed)= 0, for (S,T) = (0, 1) or (S,T) = (1, 1),
λn
(∑s∈S
pns − p̂n,licensed)= 0 and
µ( ∑
n∈N
(∑s∈S
Anpns +Bn
)− βP̂max
)= 0, for (S,T) = (1, 0).
Given all the other parameters, the closed form equation ofpns in (20) is a function of λn and µ. Thus, starting fromthe initial λn, µ and the initial power allocation, we cancalculate pns for all subchannels and BSs. We iteratively repeatthe calculation of pns until the above complementary slacknessconditions are satisfied. The proposed CASH algorithm worksas follows.
BS Algorithm
1: Estimate channel gains gk,ns and gk,m ̸=ns , ∀k, s,m
2: Send gk,ns and interference, ∀k, s to BSC3: Receive transmit power pn and user scheduling In from BSC
BSC Algorithm1: Initialize transmit power pn, taxation taxn
s
and receive channel gains from BSs2: Update virtual queues Qpc
n (t) (for (S,T)=(0,1)), Qpn(t) (for(S,T)=(1,1)) and user weights wk ∀k, n, s based on previousallocated transmit powers
3: Repeat (user scheduling loop):4: Determine the user scheduling In
per each cell by (19)5: Determine the Lagrange multipliers
λn (for all policies), µ (for (S,T)=(1,0))in the closed form power allocation (20)
6: Update taxation taxns , ∀n, s
7: Until user schedulings for all BSs are convergedor maximum number of iteration is reached
8: Send the allocated transmit power pn
and user scheduling In to each BS
Our CASH algorithm is a centralized algorithm, so the BSCschedules users and allocates powers, then sends its decisionto each BS per each time slot. Each BS sends the estimatedchannel gain and interferences from its associated users tothe BSC per each time slot. Given the feedback information
from the BSs and an initial power allocation, the BSC firstdetermines users to schedule per each cell by the equation(19). Then, by solving the equation (20), we can obtain powerallocation given user scheduling. In the same manner, the BSCiteratively updates powers and scheduled users of each BSuntil they converge or the maximum number of iteration isreached.
V. GREENING EVALUATION
A. Simulation SetupWe consider a two-tier macro-cell network composed of
hexagonal 19 cells where the distances between BSs are 2km.A wrap around technique is applied in the cells for the sameinterference environment. We refer to the some parameters andchannel model on OFDMA cellular networks from a 802.16mEMD document [30]. The number of subchannels and theregulated (licensed) transmit powers per BS are set to be 8and 40W, respectively. The total BS power budget for entiresystem (i.e., 19 BSs) is 14559W.6 We consider only 7 BSs (i.e.,BSs in the 1-tier cells) for the power control. Assume that theother 12 BSs (i.e., BSs in the 2-tier cells) use the fixed transmitpower (i.e., 20W per each BS). Maximum instantaneous oraverage transmit power per each BS under no spatial sharingpolicies are set to be 20W, respectively. All users who areasymmetrically distributed in 1-7 cells (1-tier) (10 users in 1-3 cell, 20 users in 4-7 cell) are assumed to have a logarithmicutility function, i.e., logRk. The random shadowing with 8dBdeviation and Rayleigh fading and ITU PED-B path lossmodel (−16.62−37.6 log10 d[m]) are adopted in modeling thechannel. Noise figure of a receive antenna -5dB is added intothermal noise in order to obtain more accurate performancecurve with greening factor β. The system bandwidth is 10MHzat 2.3GHz center frequency and the time slot is 1ms.
We verify the rate-power tradeoff of the proposed frame-work under interference management (IM) with four powersharing policies and conventional equal power allocation (EQ)without any power sharing policies as a baseline. The EQequally allocates the transmit power for all subchannels with(S,T)=(0,0) and uses proportional fair user scheduling. As aperformance metric, the geometric average user throughput(GAT in [Mbps]) is considered since maximizing this metricis equivalent to our system objective. The greening efficiency(GE in [bps/Hz/joule]) is also considered to see how we canenergy-efficiently use the total BS power budget in terms ofour system objective. Due to limited space, we only providehere our main simulation results about the greening effect ofpower sharing policies. However, more results are available inour technical report [27], such as the comparison with otherIM algorithms, the time scale of spatial profile, the effects ofpower sharing under the different user density and fairness,etc.
B. Greening Effect of Power Sharing PoliciesIn Fig. 3, we investigate the GAT and GE performance of
different polices by varying the greening factor β. From this
6This total power budget is obtained from the real GSM BS powerconsumption parameters [8] when the average transmit power of BSs is 20W,i.e., An = 23.4051, Bn = 298.1815.

7
0.5 0.6 0.7 0.8 0.9 11
1.2
1.4
1.6
1.8
2
2.2
2.4
2.6
2.8
BETA[Greening Factor]
GA
T [
Mbps]
EQ + (S,T) = (0,0)
IM + (S,T) = (0,0)
IM + (S,T) = (0,1)
IM + (S,T) = (1,0)
IM + (S,T) = (1,1)
~25%~34%
~39%
~23.8%
~77%
~66.8%
~35%
(a) GAT-power tradeoff
0.4 0.5 0.6 0.7 0.8 0.9 11
1.5
2
2.5
3
3.5
4
4.5
5
5.5x 10
-4
BETA[Greening Factor]
Gre
enin
g E
ffic
iency [
bps/H
z/joule
] EQ + (S,T) = (0,0)
IM + (S,T) = (0,0)
IM + (S,T) = (0,1)
IM + (S,T) = (1,0)
IM + (S,T) = (1,1)
(b) Greening efficiency
Fig. 3: Greening effects of different power sharing policies(cell radius: 2km)
simulation results, we made four interesting observations.
(Obs.1) The gains both from performance and power savingare obtained by adopting the spatial and/or temporal powersharing policies. Especially, the power saving gain (e.g., at thesame GAT of 2.27Mbps, power reduction of IM+(S,T)=(0,0)to IM+(S,T)=(1,1): 35%) excels the performance gain (e.g.,at the same greening factor of β=1, GAT increment ofIM+(S,T)=(0,0) to IM+(S,T)=(1,1): 20%) since the network isoperating in the interference-limited and high SINR regimesin Fig. 1, i.e., enjoying greening effects.
(Obs.2) As greening regulation is tighter (i.e., smaller β) bythe government, the spatio-temporal power sharing becomesmore important than IM. As the power budget decreases,the spatio-temporal power sharing gain (i.e., increment ofEQ+(S,T)=(0,0) to IM+(S,T)=(1,1)) increases (66.8% to 77%)whereas the IM gain (i.e., EQ+(S,T)=(0,0) to IM+(S,T)=(0,0))decreases (39% to 23.8%). These facts occur mainly due tothe following two reasons. If total power budget is graduallyreduced, interferences from the other cells also decrease.
Hence, the benefit that can be achieved by the inter-cellinterference management is marginal. On the other hand, thetighter total power budget we have, the higher spatio-temporalpower sharing gain can be expected. This is because the effectof exploiting the different states among cells and time slotswould be more important, similar to the philosophy of standardwater-filling algorithm.7
(Obs.3) Using only spatial power sharing is enough toobtain the most of the power saving gain. We further examinehow much gain of each spatial and temporal sharing canbring and which sharing is more important. To this end, weconsider the GAT of IM+(S,T)=(0,0) with full power budget(β=1.0) as a baseline performance, and investigate how muchpower saving can be achieved while guaranteeing the baselineperformance through either only temporal IM+(S,T)=(0,1) orspatial sharing IM+(S,T)=(1,0) and both temporal and spatialsharing IM+(S,T)=(1,1). As can be seen in Fig. 3(a), we canreduce 25% or 34% of total power budget by only temporalor spatial sharing, respectively. Interestingly, adopting bothtemporal and spatial sharing gives us a marginal benefit (from34% to 35%) compared to the spatial sharing only. Theseremarks come from the fact that the channel variation dueto the spatial profile (i.e., their relative distances to the BS) isgreater than that of temporal profile (i.e., random shadowingand fast fading).
(Obs.4) IM and power sharing (especially, spatial sharing)are significantly helpful to increase the greening efficiency.As shown in Fig. 3(b), all schemes have a peak GE point,and greening factors in peak GE of EQ and IM schemes witheach power sharing policy are as follows. EQ+(S,T)=(0,0): 0.6,IM+(S,T)=(0,0): 0.6, IM+(S,T)=(0,1): 0.6, IM+(S,T)=(1,0):0.55, IM+(S,T)=(1,1): 0.55. From these results, it is reasonableto expect that IM schemes with spatial sharing save morepower budget with achieving maximal greening efficiency aswell as obtain more GE performance than other policies.
C. Greening Effect on Different Cell SizeIn this subsection, we run simulations for IM with power
sharing policies on different cell size and validate the accuracyof mathematical analysis, developed in Section III. We simplyconsider a linear two cell scenario. The number of users areset to be 20 and 10 at each cell, respectively and those whoare asymmetrically distributed. All simulation settings are thesame as the earlier (e.g., BS power budget, power sharingpolicy) except for the cell size (500m, 1000m, 1500m, 2000m).
Fig. 4 shows the GAT differences among different power al-location schemes (i.e., EQ+(S,T)=(0,0) to IM+(S,T)=(0,0) andIM+(S,T)=(0,0) to IM+(S,T)=(1,1)) with full power budget(i.e., β = 1), power saving ratio with fixed GAT performance(i.e., reference performance: IM+(S,T)=(0,0) with β = 1) andthe peak greening efficiencies of different power allocationschemes under the different cell size environment. We couldfind key observations from these results:
1) As the cell size becomes smaller, greening effects aregreater (e.g., lower power budget at peak GE) as well
7When the overall power available is less, the effect of exploitingfrequency selectivity across subcarriers would be greater.

8
500 1000 1500 20000
0.5
1
1.5
2
2.5
3
Cell radius [m]
GA
T d
iffe
rence [
Mbps]
( =
1)
EQ+(S,T)=(0,0) to IM+(S,T)=(0,0)
IM+(S,T)=(0,0) to IM+(S,T)=(1,1)
(a) GAT difference among power allocation schemes
500 1000 1500 20000
5
10
15
20
25
30
Cell radius [m]
Pow
er
savin
g r
atio [
%]
(GAT : 6.988Mbps)(GAT : 5.398Mbps)
(GAT : 4.19Mbps)
(GAT : 3.202Mbps)
(b) Power saving ratio (IM+(S,T)=(0,0) toIM+(S,T)=(1,1))
500 1000 1500 2000
4
6
8
10
12
14
16
x 10-4
Cell radius [m]
Pe
ak g
ree
nin
g e
ffic
ien
cy [
bp
s/H
z/jo
ule
]
EQ + (S,T) = (0,0)
IM + (S,T) = (0,0)
IM + (S,T) = (0,1)
IM + (S,T) = (1,0)
IM + (S,T) = (1,1)
( = 0.44)
( = 0.44)
( = 0.5)
( = 0.55)
( = 0.65)
( = 0.5)
( = 0.6)
( = 0.55)
( = 0.55)
( = 0.49)
( = 0.44)
( = 0.55)( = 0.65)
( = 0.65)
( = 0.7)
( = 0.65)
( = 0.49)
( = 0.44)
( = 0.45)
( = 0.49)
(c) Peak greening efficiency
Fig. 4: Simulation results on different cell size
(a) Real BS deployment map
0.5 0.6 0.7 0.8 0.9 10
0.5
1
1.5
2
2.5
3
3.5
BETA[Greening Factor]
GA
T [
Mbps]
EQ + (S,T) = (0,0)
IM + (S,T) = (0,0)
IM + (S,T) = (0,1)
IM + (S,T) = (1,0)
IM + (S,T) = (1,1)
(b) GAT-power tradeoff
0.5 0.6 0.7 0.8 0.9 10
0.1
0.2
0.3
0.4
0.5
0.6
0.7
0.8
0.9
1x 10
-3
BETA[Greening Factor]
Gre
en
ing
Eff
icie
ncy [
bp
s/H
z/jo
ule
] EQ + (S,T) = (0,0)
IM + (S,T) = (0,0)
IM + (S,T) = (0,1)
IM + (S,T) = (1,0)
IM + (S,T) = (1,1)
(c) Greening efficiency
Fig. 5: Real BS environment simulations
as the greening efficiencies in all policies are larger (seeFig. 4(c)).
2) As the cell size became smaller, IM had a major influenceon the improvement of performance gain (see Fig. 4(a)).
3) Even though a contribution of power sharing policy to theperformance gain (i.e., improvement of IM+(S,T)=(0,0)to IM+(S,T)=(1,1) in terms of performance) is marginalwhen the cell size is small (e.g., 500m), power sharingstill has a big contribution to the power saving gain(i.e., total power budget reduction under the same per-formance) (see Fig. 4(b)).
In summary, IM and power sharing become more important asthe cell size decreases in terms of performance, power savingand greening efficiency.
D. Real UK BS Topology Evaluation
In order to provide more realistic simulation results, wealso investigate the greening performance under the partof the macro BS deployment topology in Manchester city,United Kingdom [6]8, as shown in Fig. 5(a). We carry outour simulation under 15 number of BSs (in 3km × 2.5km)
8The parameters used in this section V-D for real BS deployment environ-ment can be acquired from Sitefinder [6], where wireless service operator inUK voluntarily provide their BS information, such as BS deployment, transmitpower per each BS and maximum licensed transmit power per each BS.
which are owned by T-Mobile Corporation. Maximum licensedtransmit power per BS is 63W, and each BS use differenttransmit power depending on BS location and user density.We assume that the average number of users per cell is almostsimilar because a small cell covers a region which users aredensely distributed and a large cell covers a region which usersare sparsely distributed. Under this assumption, we generateusers one-by-one in the rectangular area and attach them tothe closest BS until each BS will have 10 users.
We investigate the GAT and GE performance at the samemanner with the previous simulations (see Fig. 5(b), 5(c)). Wecould find two interesting remarks in the simulation results: (i)a difference of GAT performance between IM with no sharingand spatio-temporal sharing is much higher (e.g., with thefull power budget (β=1.0), increment of IM+(S,T)=(0,0) toIM+(S,T)=(1,1): 200%) than the previous regular BS deploy-ment case. (ii) The tighter greening regulation is enforced, thegreater GE gain is achieved in power sharing policy comparedto the previous regular BS deployment case (e.g., with the50% of full power budget, power sharing gain (i.e., no sharingto spatio-temporal power sharing) ratio of irregular case overregular case is 2.9586, whereas with the full power budget,power sharing gain ratio is 2.4882). These remarks come fromthe fact that real BSs are irregularly deployed depending onspatial profile (e.g., user densities and distributions), so the

9
TABLE I: Micro cell effectMetrics Macro cell Micro cell
EQ + GAT (Mbps) 0.786 1.15(S,T)=(0,0) GE (bps/Hz/joule) 1.03× 10⁻⁴ 1.50× 10⁻⁴
IM + GAT (Mbps) 1.15 7.23(S,T)=(0,0) GE (bps/Hz/joule) 1.50× 10⁻⁴ 9.44× 10⁻⁴
IM + GAT (Mbps) 1.31 7.59(S,T)=(0,1) GE (bps/Hz/joule) 1.71× 10⁻⁴ 9.91× 10⁻⁴
IM + GAT (Mbps) 1.40 8.23(S,T)=(1,0) GE (bps/Hz/joule) 1.83× 10⁻⁴ 10.74× 10⁻⁴
IM + GAT (Mbps) 1.47 8.59(S,T)=(1,1) GE (bps/Hz/joule) 1.92× 10⁻⁴ 11× 10−4
difference of user distribution among cells in real environmentis bigger than regular BS deployment case. Therefore, thedegree of freedom exploiting power sharing can be larger inreal BS deployment case than regular BS deployment case.
E. Micro Cell Effect
In this subsection, in order to clearly see the impact of themicro cell in terms of greening performance on the WSP’sperspective, we consider the following two different scenarios:(i) macro cell (where the distances between macro BSs are1km and the operational power parameters with An= 23.4051and Bn= 298.1815 [8]) and (ii) micro cell (where the distancesbetween micro BSs are 354m and An= 5.238, Bn= 28.86 [8]).The same total BS power per unit area (0.244mW/m2) and thesame number of users per same area (e.g., 64 in a macro cell)are used for a fair comparison. The power consumption modelsand parameters for macro and micro BS are obtained from [8].
As shown in Table I, (i) we can see more greening gain(i.e., GAT and GE) in micro-cell scenario than in macro-cellscenario for all schemes, (ii) furthermore, the greening gaingrowth (i.e., macro-cell to micro-cell performance increase)of the IM with spatio-temporal power sharing is greater thanthe EQ with no power sharing. For example, in terms ofGAT and GE, there are fourfold (from 1.87 = 1.47/0.786to 7.47 = 8.59/1.15 and from 1.8703 = 1.9184/1.0257 to7.3294 = 11/1.5008) increments, respectively. In conclusion,WSPs would be eager to deploy more micro BSs and usethe IM scheme with power sharing than to deploy fewermacro BSs and use the EQ without power sharing at the samecoverage in terms of BS operating power consumption.
VI. CONCLUDING REMARKS
With increasing energy-saving pressure to WSPs due toharmful impact on the environment by CO2 emissions, weseriously considered to maximally exploit given power budgetof BSs. The main focus of the paper is to analyze the greeningeffect of interference management (IM) scheme with fourcombinations of spatial and temporal power budget sharingon multi-cell cellular networks. We formulated optimizationtheoretic IM frameworks with greening and developed jointpower allocation and user scheduling algorithms for differentpower sharing policies: no sharing, only temporal sharing, onlyspatial sharing, and both spatial and temporal sharing. Throughextensive analytical and simulation studies, we made several
important observations, which provide WSPs with guidelineshow to energy-efficiently manage their power budget. First,the smart IM with spatial and temporal power sharing has twotypes of gains: performance and power saving gains. Second,such gains become conspicuous in the near future as thegreening regulation would be tighter and/or the cell size ofnetworks would become smaller. Third, the spatial sharing ismore important than temporal one in terms of power saving.
APPENDIX: CONCAVE APPROXIMATION
A. Derivation of concave approximation for (17)
maxp
∑n∈N
∑s∈S
[wklog2
(1+ηk,ns (ps)
)− AVE(pns )
], (23)
= maxp
∑n∈N
∑s∈S
[wk log2
(∑m∈N
gk,ms pms + σks
)
−wk log2
∑m ̸=n
gk,ms pms + σks
− AVE(pns )
],
(24)
≥ maxp
∑n∈N
∑s∈S
[wk log2
(∑m∈N
gk,ms pms + σks
)
−wk
∑m ̸=n
ak,ms pms + cks
− AVE(pns )
],
(25)
For a given user scheduling I(t), this approximation issimilar to the CA-DSB algorithm [22] except for that weshould additionally consider time-averaged power constraints.Fortunately, as the virtual queue is fixed during the time slot,so the AVE(pns ) is a linear function of pns , and accordingly, itdoes not affect the concavity of the given function (23). Sincethe second term of (24) is non-concave (i.e., convex) functionwhile the first and third terms are concave and linear function,respectively, we can approximate the second term of (24) by alower bound hyperplane in (25). The second term of right partof the equation (25) is the combination of the linear equations,where ak,ms is the slope of each linear equation, and cks is aconstant.
First, given an initial power allocation, we can obtain initialak,ms by partially differentiating the second terms of (24) and(25) on pms for all scheduled users in each cell. Then, weinsert calculated ak,ms into the equation (25) and obtain powerallocation by applying Karush-Kuhn-Tucker (KKT) conditions[29]. Next, we can determine ak,ms given power allocation. Inthe same manner, we can obtain the power allocation untilconvergence (since the second term of the equation (24) isconvex function, it should converge). Additionally, there is nonecessity for knowing cks since we do not use cks to calculatethe power allocation (20) and (22).
REFERENCES
[1] J. Kwak, K. Son, Y. Yi, and S. Chong, “Impact of spatio-temporalpower sharing policies on cellular network greening,” in Proc. WiOpt,Princeton, USA, May 2011, pp. 167–174.
10
[2] M. Marsan, L. Chiaraviglio, D. Ciullo, and M. Meo, “Optimal energysavings in cellular access networks,” in Proc. of the first InternationalWorkshop on Green Communications (GreenComm), Dresden, Germany,Jun. 2009, pp. 1–5.
[3] G. Fettweis and E. Zimmermann, “ICT energy consumption-trendsand challenges,” in Proc. of the International Symposium on WirelessPersonal Multimedia Communications, Lapland, Finland, Sep. 2008, pp.1–4.
[4] A. Fehske, F. Richter, and G. Fettweis, “Energy efficiency improvementsthrough micro sites in cellular mobile radio networks,” in Proc. ofthe second International Workshop on Green Communications (Green-Comm), Honolulu, HI, USA, Dec. 2009, pp. 1–5.
[5] A. Goldsmith, Wireless communications. Cambridge Univ. Press, 2005.[6] “Sitefinder: Mobile phone base station database.” [Online]. Available:
http://www.sitefinder.ofcom.org.uk/[7] “Kyoto protocol to the united nations framework convention on
climate change.” [Online]. Available: http://unfccc.int/resource/docs/convkp/kpeng.pdf/
[8] O. Arnold, F. Richter, G. Fettweis, and O. Blume, “Power consumptionmodeling of different base station types in heterogeneous cellular net-works,” in Proc. of the 19th Future Network & MobileSummit, Florence,Italy, Jun. 2010, pp. 1–8.
[9] K. Son, S. Chong, and G. de Veciana, “Dynamic association for loadbalancing and interference avoidance in multi-cell networks,” IEEETrans. Wireless Commun., vol. 8, no. 7, pp. 3566–3576, Jul. 2009.
[10] L. Venturino, N. Prasad, and X. Wang, “Coordinated scheduling andpower allocation in downlink multicell OFDMA networks,” IEEE Trans.Veh. Technol., vol. 58, no. 6, pp. 2835–2848, Jul. 2009.
[11] A. Stolyar and H. Viswanathan, “Self-organizing dynamic fractionalfrequency reuse for best-effort traffic through distributed inter-cellcoordination,” in Proc. IEEE INFOCOM, Rio de Janeiro, Brazil, Apr.2009, pp. 1–9.
[12] K. Son, Y. Yi, and S. Chong, “Utility-optimal multi-pattern reuse inmulti-cell networks,” IEEE Trans. Wireless Commun., vol. 10, no. 1,pp. 142–153, Jan. 2011.
[13] K. Son, S. Lee, Y. Yi, and S. Chong, “REFIM: A practical interferencemanagement in heterogeneous wireless access networks,” IEEE J. Sel.Areas Commun.: Special Issue on Distributed Broadband WirelessCommunications, vol. 29, no. 6, pp. 1260–1272, Jun. 2011.
[14] N. Vaidhiyan, R. Subramanian, and R. Sundaresan, “Interference plan-ning for multicell OFDM downlink (invited paper),” in Proc. of COM-SNETS, Bangalore, Karnataka, India, Jan. 2011, pp. 1–10.
[15] C. Wong, R. Cheng, K. Lataief, and R. Murch, “Multiuser OFDM withadaptive subcarrier, bit, and power allocation,” IEEE J. Select. AreasCommun., vol. 17, no. 10, pp. 1747–1758, Oct. 1999.
[16] K. Son, E. Oh, and B. Krishnamachari, “Energy-aware hierarchical cellconfiguration: from deployment to operation,” in Proc. IEEE INFOCOMWorkshop on Green Communications and Networking, Shanghai, China,Apr. 2011, pp. 289–294.
[17] O. Holland, V. Friderikos, and A. Aghvami, “Green spectrum manage-ment for mobile operators,” in Proc. IEEE GLOBECOM Workshops,Miami, FL, USA, Dec. 2010, pp. 1458–1463.
[18] K. Son, H. Kim, Y. Yi, and B. Krishnamachari, “Base station operationand user association mechanisms for energy-delay tradeoffs in greencellular networks,” IEEE J. Sel. Areas Commun.: Special Issue onEnergy-Efficient Wireless Communications, vol. 29, no. 8, pp. 1525–1536, 2011.
[19] K. Son and B. Krishnamachari, “Speedbalance: Speed-scailing-awareoptimal load balancing for green cellular networks,” in Proc. of INFO-COM, Orlando, FL, USA, Mar. 2012, pp. 1–5.
[20] K. Son, H. Kim, Y. Yi, and B. Krishnamachari, “Toward energy-efficientoperation of base station in cellular wireless networks,” a book chapterof green communications: theoretical fundamentals, algorithms, andapplications (ISBN:978-1-4665-0107-2), CRC Press, Taylor & Francis,LLC, 2012.
[21] P. Tsiaflakis, Y. Yi, M. Chiang, and M. Moonen, “Fair greening of broad-band access: spectrum management for energy-efficient DSL networks,”EURASIP Journal on Wireless Communications and Networking, vol.2011, no. 1, pp. 140–157, 2011.
[22] P. Tsiaflakis, M. Diehl, and M. Moonen, “Distributed spectrum man-agement algorithms for multiuser DSL networks,” IEEE Trans. SignalProcessing, vol. 56, no. 10, pp. 4825–4843, Oct. 2008.
[23] A. Stolyar, “Greedy primal-dual algorithm for dynamic resource allo-cation in complex networks,” Queueing Systems, vol. 54, no. 3, pp.203–220, Nov. 2006.
[24] “FCC regulations, part 27. miscellaneous wireless communica-tions services.” [Online]. Available: http://www.gpo.gov/fdsys/pkg/CFR-2009-title47-vol2/pdf/CFR-2009-title47-vol2-part27.pdf
[25] J. Mo and J. Walrand, “Fair end-to-end window-based congestioncontrol,” IEEE/ACM Trans. Networking, vol. 8, no. 5, pp. 556–567, Oct.2000.
[26] A. Stolyar, “On the asymptotic optimality of the gradient schedulingalgorithm for multiuser throughput allocation,” Operations Research,vol. 53, no. 1, pp. 12–25, Jan. 2005.
[27] J. Kwak, K. Son, Y. Yi, and S. Chong, “Greening effect ofspatio-temporal power sharing policies in cellular networks withenergy constraints,” Technical Report, Apr. 2012. [Online]. Available:http://netsys.kaist.ac.kr/publication/papers/Resources/R5
[28] R. Cendrillon, W. Yu, M. Moonen, J. Verlinden, and T. Bostoen,“Optimal multiuser spectrum balancing for digital subscriber lines,”IEEE Trans. Commun., vol. 54, no. 5, pp. 922–933, May 2006.
[29] S. Boyd and L. Vandenberghe, Convex optimization. Cambridge Univ.Press, 2004.
[30] R. Srinivasan, J. Zhuang, L. Jalloul, R. Novak, and J. Park, “IEEE 802.16m evaluation methodology document (EMD),” 2008.
Jeongho Kwak (S’11) received his B.S. degree inthe Division of Electrical and Computer Engineeringfrom Ajou University, South Korea, in 2008, and hisM.S. degree in the Department of Electrical Engi-neering from Korea Advanced Institute of Scienceand Technology (KAIST), South Korea, in 2011.He is currently a Ph.D. student in the Departmentof Electrical Engineering at KAIST. His currentresearch interests are in the areas of green cellularnetworking, energy efficient device localization andnetwork selection in heterogeneous networks.
Kyuho Son (S’03-M’10) received his B.S., M.S. andPh.D. degrees all in the Department of Electrical En-gineering from Korea Advanced Institute of Scienceand Technology (KAIST), Daejeon, Korea, in 2002,2004 and 2010, respectively. From 2004 to 2005, hewas a visiting researcher at Wireless Networking andCommunication Group in the Department of Elec-trical and Computer Engineering at the Universityof Texas at Austin. From 2010 to 2012, he was apost-doctoral research associate in the Department ofElectrical Engineering at the University of Southern
California, CA. He is currently a senior engineer at T-Mobile, USA. Hiscurrent research interests lie in the design, analysis and optimization of greennetworks and smart grid, with a focus on energy-efficiency and renewableenergy. He is a founding member of TSGCC (Technical Subcommitteeof Green Communications and Computing) within IEEE CommunicationsSociety.

11
Yung Yi (S’04-M’06) received his B.S. and the M.S.in the School of Computer Science and Engineer-ing from Seoul National University, South Koreain 1997 and 1999, respectively, and his Ph.D. inthe Department of Electrical and Computer Engi-neering at the University of Texas at Austin in2006. From 2006 to 2008, he was a post-doctoralresearch associate in the Department of ElectricalEngineering at Princeton University. Now, he is anassociate professor at the Department of ElectricalEngineering at KAIST, South Korea. He has been
serving as a TPC member at various conferences Including ACM Mobihoc,Wicon, WiOpt, IEEE Infocom, ICC, Globecom, and ITC. His academicservice also includes the local arrangement chair of WiOpt 2009 and CFI2010, the networking area track chair of TENCON 2010, and the publicationchair of CFI 2010, and a guest editor of the special issue on Green Networkingand Communication Systems of IEEE Surveys and Tutorials. He also servesas the co-chair of the Green Multimedia Communication Interest Groupof the IEEE Multimedia Communication Technical Committee. His currentresearch interests include the design and analysis of Computer networking andwireless systems, especially congestion control, scheduling, and interferencemanagement, with applications in wireless ad hoc networks, broadband accessnetworks, economic aspects of communication networks economics, andgreening of network systems.
Song Chong (M’93) received the B.S. and M.S.degrees in control and instrumentation engineeringfrom Seoul National University, Seoul, Korea, in1988 and 1990, respectively, and the Ph.D. degreein electrical and computer engineering from theUniversity of Texas at Austin in 1995. Since March2000, he has been with the Department of ElectricalEngineering, Korea Advanced Institute of Scienceand Technology (KAIST), Daejeon, Korea, wherehe is a Professor and was the head of the Com-munications and Computing Group. Prior to joining
KAIST, he was a Member of Technical Staff with the Performance AnalysisDepartment, AT&T Bell Laboratories, Holmdel, NJ. He has published morethan 100 papers in international journals and conferences. His current researchinterests include wireless networks, future Internet, and human mobilitycharacterization and its application to mobile networking. He is an Editorof Computer Communications and the Journal of Communications andNetworks. He has served on the Technical Program Committee of a numberof leading international conferences including IEEE INFOCOM and ACMCoNEXT. He serves on the Steering Committee of WiOpt and was the GeneralChair of WiOpt 2009.