greenhouse gas from moving bed based ... function in the same reactor, denitrification in the...
TRANSCRIPT

X Simposio Internazionale di Ingegneria Sanitaria Ambientale SIDISA2016
XIII Simposio Italo-Brasiliano di Ingegneria Sanitaria Ambientale SIBESA 016
Session C05: GHG emission quantification C05/4-1
GREENHOUSE GAS FROM MOVING BED BASED INTEGRATED FIXED FILM ACTIVATED SLUDGE MEMBRANE BIOREACTORS
G. MANNINA*, M. CAPODICI*, A. COSENZA*, D. DI TRAPANI*, V.A. LAUDICINA**, H. ØDEGAARD***
* Dipartimento di Ingegneria Civile, Ambientale, Aerospaziale, dei Materiali, Università di Palermo, Palermo, Italy
** Dipartimento di Scienze Agrarie e Forestali, Università di Palermo, Palermo, Italy
*** Norwegian University of Science and Technology, Department of Hydraulic and Environmental Engineering,
Trondheim, Norway
Keywords: Nitrous oxide; Emission factor; IFAS; MBR; UCT;
Abstract. The present paper reports the results of a nitrous oxide production investigation in a moving bed
based integrated fixed film activated sludge (IFAS) membrane bioreactor (MBR) pilot plant designed in
accordance with the UCT layout for biological phosphorous removal. Samples of gas and liquid were collected in
order to measure the gaseous, as well as the dissolved concentration of N2O. Furthermore, the gas flow rate
from each reactor was measured and the gas flux was estimated. The results confirmed that the anoxic reactor
represents the main source of nitrous oxide production. A significant production of N2O was, however, also found
in the anaerobic reactor, thus indicating a probable occurrence of the DPAOs activity.
1. Introduction
Nitrous oxide (N2O) is a significant greenhouse gas (GHG) due to its high global warming potential (GWP),
298 times higher than that of carbon dioxide (CO2), and to its capability to react with stratospheric ozone causing
the layer depletion (IPCC, 2007). The requirement to protect the ozone layer led the governments worldwide to
issue specific regulations and guidelines focused on the reduction of anthropogenic N2O emissions. In this
context N2O emissions from wastewater treatment has received increasing attention in recent years.
N2O can be produced and directly emitted from wastewater treatment plants (WWTPs). Specifically, N2O
generation mainly occurs in biological nitrogen removal (BNR) via nitrification and denitrification processes as
both autotrophic and heterotrophic bacteria can be responsible for N2O production during BNR (Kampschreur et
al., 2009).
It is widely accepted that N2O can be produced by ammonia oxidizing bacteria (AOB) via two main pathways
(Kampschreur et al., 2009): i. the reduction of NO2- as terminal electron acceptor to N2O (AOB denitrification)
(Kim et al., 2010; Yu et al., 2010; Wrange et al., 2001; Stuven et al.,1992); ii. incomplete oxidation of
hydroxylamine (NH2OH) to NO2- (Law et al., 2012; Chandran et al., 2011). Furthermore, N2O may be produced
Session C05: GHG emission quantification C05/4-2
as an intermediate of the incomplete heterotrophic denitrification (Lu and Chandran, 2010).
As it is generally recognized that the anoxic heterotrophic denitrification is the dominant process compared
with aerobic denitrification and autotrophic denitrification, it is still a need to asses if this rank remains also for
N2O emission (Kampschreur et al., 2009). In the last years many efforts have been spent towards the
understanding of the key mechanisms involved in N2O production and emission (Kampschreur et al., 2009). As a
consequence, several parameters that might favor N2O production/emission have been identified: low dissolved
oxygen concentrations, nitrite accumulation, dynamic conditions as well as low carbon-to-nitrogen (C/N) ratio
values during denitrification. Moreover, the technical literature highlights that in processes aimed at the
simultaneous nitrogen and phosphorous removal (SNPR), the role of polyphosphate accumulating organisms
(PAOs) in the production of N2O cannot be disregarded (among others, Zhou et al., 2012).
Furthermore, in a hybrid biological system (IFAS-system) where suspended as well as attached biomass is
in function in the same reactor, denitrification in the biofilm even under aerobic reactor conditions, could
contribute significantly to N2O-production and emission.
In the last years, the hybrid systems have been proposed for SNPR. Hybrid systems maximize the
nitrification by means of high solid retention time (SRT) of the biofilm, but having the potential of operating the
suspended growth phase with a relatively short SRT. Moreover, in a hybrid system, the biofilm and the
suspended biomass may function differently referring to either nitrogen or phosphorus removal. This aspect can
be of importance with respect to N2O emissions from SNPR in hybrid systems. Among the hybrid systems, the
joint use of membrane bioreactors (MBRs) and moving bed biofilm reactors (MBBRs) in an IFAS-system, where
the secondary is replaced by a membrane module, was recently proposed and referred to as moving bed
membrane bioreactor (MB-MBR) (Di Trapani et al., 2014) or an IFAS-MBR. Up to now, only few studies (Lo et
al., 2010) examined the relative effects of the biofilm and the suspended sludge on N and P removal efficiencies
and N2O emission in a hybrid SNPR system. Therefore, a better understanding of the mechanisms involved in
N2O production from hybrid systems aimed at nutrient removal is the goal of this study.
Bearing in mind such considerations, the aim of the present study was to investigate the N2O emissions from
a University of Cape Town IFAS-MBR (UCT- -IFAS-MBR) pilot plant. The UCT- -IFAS-MBR pilot plant consisted
of one anaerobic, one anoxic and one aerobic compartments in series, according to the UCT scheme (Ekama et
al., 1983. Particularly, the reactors were provided of specific funnel shaped covers that allowed to sample and
quantify the gas flux stripped in each reactor head space.
2. Materials and methods
2.1. Pilot plant lay-out
The lay-out of the UCT- IFAS-MBR pilot plant is shown in Fig.1; it was operated for 51 days.
In details, the pilot plant consisted of anaerobic (volume: 62 L), anoxic (volume: 102 L) and aerobic (volume:
211 L) compartments (Cosenza et al., 2013). The solid-liquid separation phase was achieved by means of an
ultrafiltration hollow fibre membrane module (PURON®). The membrane module was located inside a dedicated
aerated compartment (referred to as the MBR tank, with a 36 L volume). An oxygen depletion reactor (ODR)
allowed oxygen removal in the mixed liquor recycled from the MBR tank to the anoxic tank (QRAS). The

Session C05: GHG emission quantification C05/4-3
Anaerobic Tank Anoxic Tank Aerobic Tank
MBR Tank
Clean In Place Tank
ODR
Qin
Qout
QR2
QR1
QRAS
Gas
Funnel
Gas
Funnel
Gas
Funnel
Gas
FunnelSuspended
Carriers
Figure 1. Lay-out of the UCT – IFAS-MBR pilot plant
membrane was periodically backwashed (every 9 min for a period of 1 min) by pumping a volume of permeate
back through the membrane fibres from the Clean In Place (CIP) tank. The influent flow rate was set equal to 20
L h-1
(Qin). During the pilot plant operation, a 20 L h-1
recycle flow (QR1) was continuously pumped from the
anoxic to the aerobic tank. Furthermore, a recycle flow of 100 L h-1
mixed liquor (QR2) was pumped from the
aerobic to the MBR tank. A net permeate flow rate of 20 L-1
was extracted (QOUT) through the membrane.
Therefore, the recycled activated sludge (QRAS) from the MBR to the anoxic tank through the ODR tank was
equal to 80 L h-1
. The anaerobic, anoxic, aerobic and MBR reactors were equipped with specific funnel shape
covers that guaranteed gas accumulation in the headspace to perform the gas sampling.
Furthermore, the anoxic and aerobic compartments were filled with suspended carriers (Amitech s.r.l.) with a
15 and 40% filling fraction respectively, corresponding to a net surface area of 75 and 205 m2 m
-3, respectively.
2.2. Operative conditions and experimental performances
During the experimental campaign the pilot plant was operated with no sludge withdrawal.. As the report of
the present paper deals with the pilot plant gas production, the mean values of operational parameters are only
briefly summarized in Table 1.
Table 1. Mean values of operational parameters
CODin
[mg L-1
]
TNin
[mg L-1
]
PO4-Pin
[mg L-1
]
TSSanaerobic
[g L-1
]
TSSanoxic
[g L-1
]
TSSaerobic
[g L-1
]
TSSMBR
[g L-1
]
VSS/TSS mean
-
577 60 9 1.96 3.83 3.97 4.75 0.86
On average the mean COD removal efficiency was high (>95%), the nitrification efficiency was almost
complete (>95%), the denitrification efficiency was 62% and the phosphorus removal was 25%.
2.3. Gas sampling and measurements

Session C05: GHG emission quantification C05/4-4
The liquid and gaseous samples were withdrawn from the anaerobic, anoxic, aerobic and MBR tanks and
analysed to determine the N2O-N concentration. Furthermore, the N2O-N fluxes (gN2O-N m-2
h-1
) from all the
compartments were quantified by measuring the gas flow rates, QGAS (L min-1
).
2.3.1. Gas flux assessment
Text Gas flow rate, expressed as QGAS was measured in accordance to Equation 1.
AvQ GASGAS [1]
where A represents the outlet section of the sampling funnel (m2) and VGAS (m s
-1) is the gas velocity,
measured by using an hot wire anemometer.
Thus, the gas flux was assessed by applying the Equation 2.
A
QCF GAS
GAS [2]
where FGAS represents the gas flux emitted from the sampled reactor (mgN2O-N h-1
m-2
), ρ is the gas density
at the recorded temperature (mol m-3
), C is the measured gas concentration (mg L-1
), QGAS is the gas flow rate
(m3 h
-1) and A represents the emitting surface of each sampled reactor (m
2).
2.3.2. Gas phase sampling
Gas produced due to biological activities of biomass accumulated inside the head space of each reactor
funnel and was collected by withdrawing samples (9 ml) by means of commercial syringes and thus transferred
into glass vials where the vacuum was previously created. Samples from the anaerobic, anoxic, aerobic and
MBR reactors were collected two times per week with tree replicates for each sampling section. Gas samples
were analysed with GC equipped with ECD detector to assess the Nitrous Oxide concentration.
2.3.3. Dissolved phase sampling
The measure of gas dissolved in the liquid phase was conducted on the basis of the head space gas method
derived from Kimochi et al. (1998). In detail, 70 mL of supernatant (after 5 min of centrifugation at 8000 rpm)
were sealed into 125 mL glass bottles. To prevent any biological reaction, 1 mL of 2N H2SO4 was added. After
24 h of gentle stirring, the bottles were left for 1 h without moving.
Thereafter, the gas accumulated in the headspace of the bottles was collected similarly to the gas sampling
procedure. Finally, by applying Henry’s Law, the dissolved gas concentration at equilibrium with the headspace
gas was calculated. Samples of liquid phase were collected from the anaerobic, anoxic, aerobic, MBR and ODR
reactors two times per week with tree replicates for each sampling section; furthermore liquid samples of the
MBR permeate were also collected and analysed in order to assess the N2O concentration discharged with the
pilot plant effluent.
2.3.4. N2O emission factor and mass balance
Session C05: GHG emission quantification C05/4-5
For each compartment, the evaluation of the N2O-N emission factors, expressed as the percentage of N2O-N
emitted compared to the inlet nitrogen loading rates, was conducted by means of the following Equation 3
derived by Tsuneda et al., 2005:
HRT
TN
HRT
NON
HRT
NON
EFIN
Dissolved
HS
Gas
22
[3]
where EF represents the N2O emission factor [%];N2O-NGas is the nitrous oxide concentration in the gas
phase (mg N2O-N L-1
), HRTHS is the hydraulic retention time of the head space of the sampled reactor, assessed
by taking into account the head space volume and the gas flow rate, (h); N2O-NDissolved is the liquid phase gas
concentration (mg N2O-N L-1
); HRT is the hydraulic retention time of the pilot plant (h) and TNIN is the total
nitrogen concentration fed to the pilot plant (mgN L-1
).
Furthermore, in order to evaluate the gas production or consumption inside each reactor, the nitrous oxide
mass balance was performed in accordance to Equation 4.
cpOUTGasOUTDissolvedINDissolved NONNONNONNON ,2,2,2,2 [4]
where N2O-NDissolved,IN and N2O-NDissolved,OUT represent the influent and effluent amount of dissolved nitrous
oxide respectively (mg N2O-N h-1
); N2O-NGas,OUT is the effluent gaseous N2O-N (mg N2O-N h-1
) and N2O-Np,c (mg
N2O-N h-1
) represents the amount of N2O-N produced (in case of negative sign, therefore consider only subscript
“p”) or consumed (in case of positive sign, therefore consider only subscript “c”) inside the tank.
3. Results and discussion
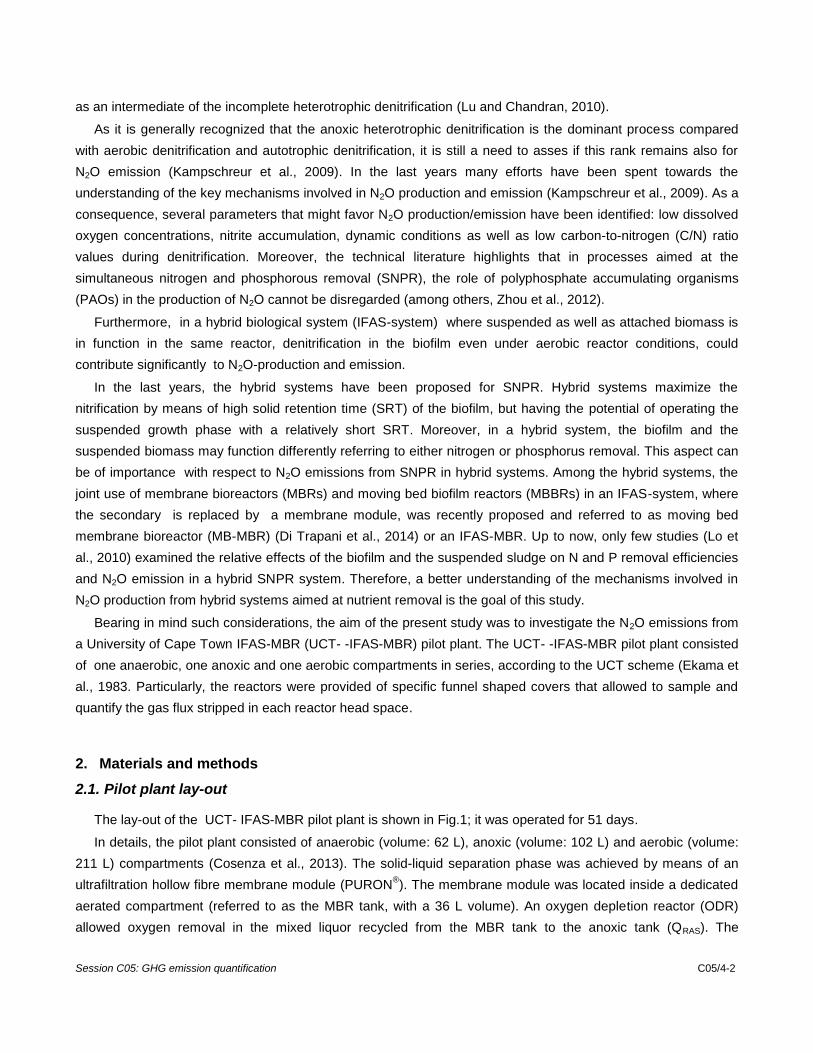
The recorded gas phase concentrations are shown in Figure 2. The N2O gas concentration remained quite
constant during the experimental period except for in the anoxic reactor gas concentration varied considerably
as compared to the others reactors. On the 25th experimental day, the gas concentration in the anoxic reactor
started to increase progressively up to the maximum value of 210 μg N2O-N L-1
on the 32th experimental day.
This result is likely due to an incomplete denitrification that occurred during those days, with nitrate concentration
in the permeate flow ranging from 33.6 to 41 mg NO3-N L-1
. This affected the gas production in the anoxic
reactor, where denitrification takes place, in agreement with data in the literature where incomplete denitrification
is identified as one of the causes that can lead to the N2O production (Kampschreur et al., 2009). Several
authors agree in identifying the anoxic reactor as the main N2O producer (Otte et al., 1996; Kampschreur et al.,
2009).
On average the average gas concentrations during the experimental period, measured in each reactor, were
equal to 15.40 μg N2O-N L-1
, 29.11 μg N2O-N L-1
, 13.97 μg N2O-N L-1
and 12.50 μg N2O-N L-1
for anaerobic,
anoxic, aerobic and MBR reactor respectively.
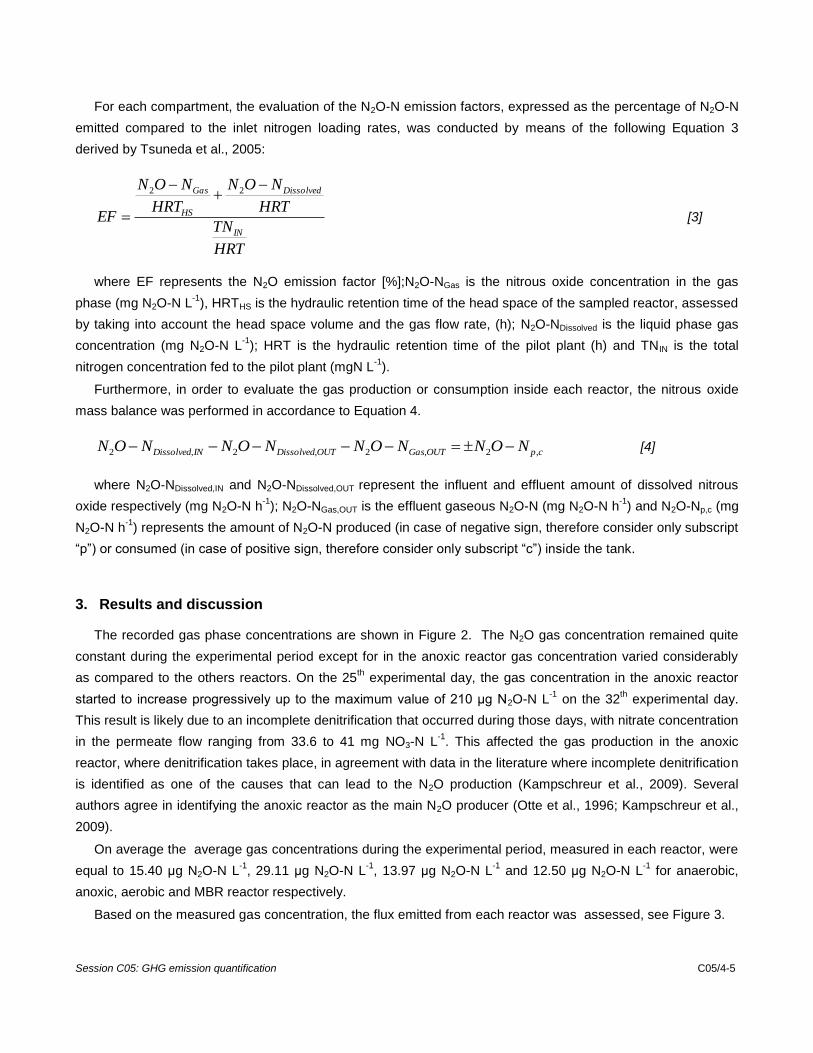
Based on the measured gas concentration, the flux emitted from each reactor was assessed, see Figure 3.
Session C05: GHG emission quantification C05/4-6
Figure 1 – concentrazione gas
0
50
100
150
200
912
1618
2325
3032
3739
4446
51
Conce
ntr
atio
n [μ
g N
2O
-N L
-1]
Time [d]
Figure 2. Gas phase concentrations
0
10000
20000
30000
40000
912
1618
2325
3032
3739
4446
51
Flu
x [μ
g N
2O
-N m
-2h
-1]
Time [d]
(a)
0
50
100
150
200
912
1618
2325
3032
3739
4446
51
Flu
x [μ
g N
2O
-N m
-2h
-1]
Time [d]
(b)
0
10000
20000
30000
40000
912
1618
2325
3032
3739
4446
51
Flu
x [μ
g N
2O
-N m
-2h
-1]
Time [d]
(a)
0
50
100
150
200
912
1618
2325
3032
3739
4446
51
Flu
x [μ
g N
2O
-N m
-2h
-1]
Time [d]
(b)
Figure 3. N2O-N Flux emitted from aerated reactors (a) and not aerated reactors (b)
Figure 3. N2O-N Flux emitted from aerated reactors (a) and not aerated reactors (b)
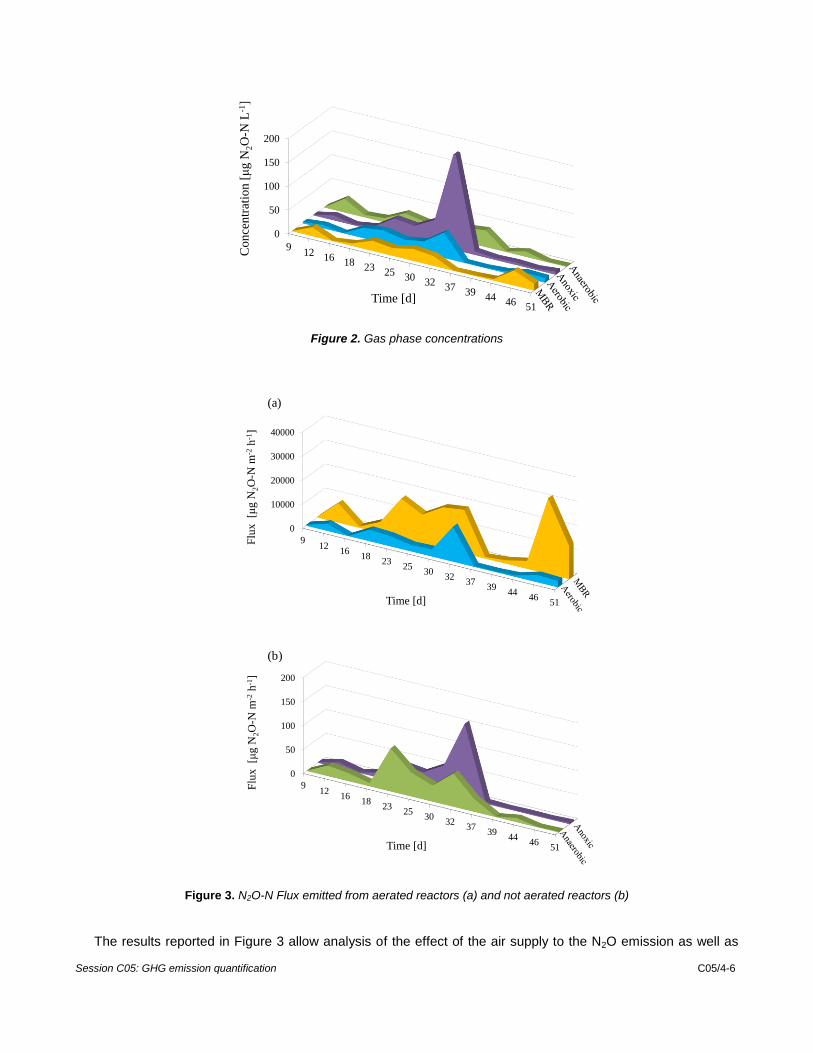
The results reported in Figure 3 allow analysis of the effect of the air supply to the N2O emission as well as
Session C05: GHG emission quantification C05/4-7
the effect of the carriers. The flux measured in the aerated reactors (Figure 3a) was two orders of magnitude
higher than the flux measured in the not aerated reactors (Figure 3b). The air supplied to the aerobic reactor (to
guarantee the aerobic environment) and to the MBR reactor (in order to mitigate the membrane fouling)
enhances the physical stripping of the gas from the liquid phase. The average fluxes measured in each reactor
were found to be 25.39 μg N2O-N m-2
h-1
, 25.01 μg N2O-N m-2
h-1
, 3092 μg N2O-N m-2
h-1
and 9872 μg N2O-N m-
2 h
-1 for anaerobic, anoxic, aerobic and MBR reactor respectively.
The nitrous oxide flux emitted from the MBR reactor resulted on average three time higher than the flux
emitted in the aerobic reactor. This result is emphasized since the scientific literature consider the nitrogen
transformation process as the main source of nitrous oxide (Kampschreur et al., 2009; Law et al., 2012; Zhao et
al., 2014) while in the MBR reactor, due to the low HRT (0.36 h), very little biological activity is expected to
occur. The presence in the aerobic reactor of both biomasses, suspended and attached, may have enhanced
the gas production both contributing to the flux emission. The reason for the huge emission from the MBR
reactor is likely due to the high value of QR2 (100 L h-1
) that is constantly pumped from aerobic to MBR reactor
and thus acting as a recycle of dissolved nitrous oxide produced in the aerobic reactor. Dissolved nitrous oxide
conveyed to the MBR reactor pass into the gas phase by stripping, due to the intensive aeration provided for
membrane fouling mitigation, and hence contributing to the large flux emitted from MBR.
The circumstance that the physical effect of the aeration significantly affect the gas concentration is also
noticeable from the dissolved gas concentrations measured in the reactors of the pilot plant (see Figure 4).
The results reported in Figure 4 provide an opposite situation for the dissolved phase as compared to the gas
phase and the emitted flux of nitrous oxide. Due to the absence of the air supply, the measured concentration in
the non aerated reactors (Figure 4a) resulted in an order of magnitude higher concentration than the one
measured in the aerated reactors and in the permeate flow (Figure 4b). The average concentrations measured
in each reactor and in the permeate flow were 100 μg N2O-N L-1
, 50.30 μg N2O-N L-1
, 12.25 μg N2O-N L-1
, 13.12
μg N2O-N L-1
and 14.63 μg N2O-N L-1
for the anaerobic, anoxic, aerobic and MBR reactor and for the permeate
flow respectively. The circumstance that the highest dissolved concentration were retrieved in the anaerobic
reactor is likely ascribable to the low biological phosphorus removal efficiency achieved during the
experimentation (25% on average). Indeed if anoxic conditions can prevail inside the anaerobic reactor, the
denitrifying phosphate accumulating organisms (DPAOs) can denitrify during a denitrifying P removal process
leading to a low P removal efficiency. Several studies reported that N2O rather than N2 was the major
denitrification product when DPAOs used poly-β-hydroxyalkanoates (PHA) as a carbon source for denitrification
during denitrifying P removal process (Lemaire et al., 2006; Jia et al., 2012; Wang et al., 2015). In such a
context, N2O production can be expected to be significantly influenced as the amount of anaerobic PHA
synthesis is affected by influent quality variation. Hence N2O generation during denitrifying P removal processes
should also be noticed (Wang et al., 2015).
With reference to the anoxic reactor the measured N2O concentration appears consistent with previous
studies that identified the anoxic reactor as one of the major contributors to N2O-N production (Otte et al., 1996;
Kampschreur et al., 2009).
On the contrary the results reported in Figure 4b confirm that the stripping effect exerted by the air supply on
the aerobic and MBR reactor is very important with respect to the flux of N2O-N emitted. The permeate flow
Session C05: GHG emission quantification C05/4-8
An…
0
200
400
600
800
912
1618
2325
3032
3739
4446
51
Co
nce
ntr
atio
n [μ
g N
2O
-N L
-1]
Time [d]
(a)
Ae…
0
20
40
60
912
1618
2325
3032
3739
4446
51
Co
nce
ntr
atio
n [μ
g N
2O
-N L
-1]
Time [d]
Aerobic Permeate MBR
(b)
An…
0
200
400
600
800
912
1618
2325
3032
3739
4446
51
Co
nce
ntr
atio
n [μ
g N
2O
-N L
-1]
Time [d]
(a)
Ae…
0
20
40
60
912
1618
2325
3032
3739
4446
51
Co
nce
ntr
atio
n [μ
g N
2O
-N L
-1]
Time [d]
Aerobic Permeate MBR
(b)
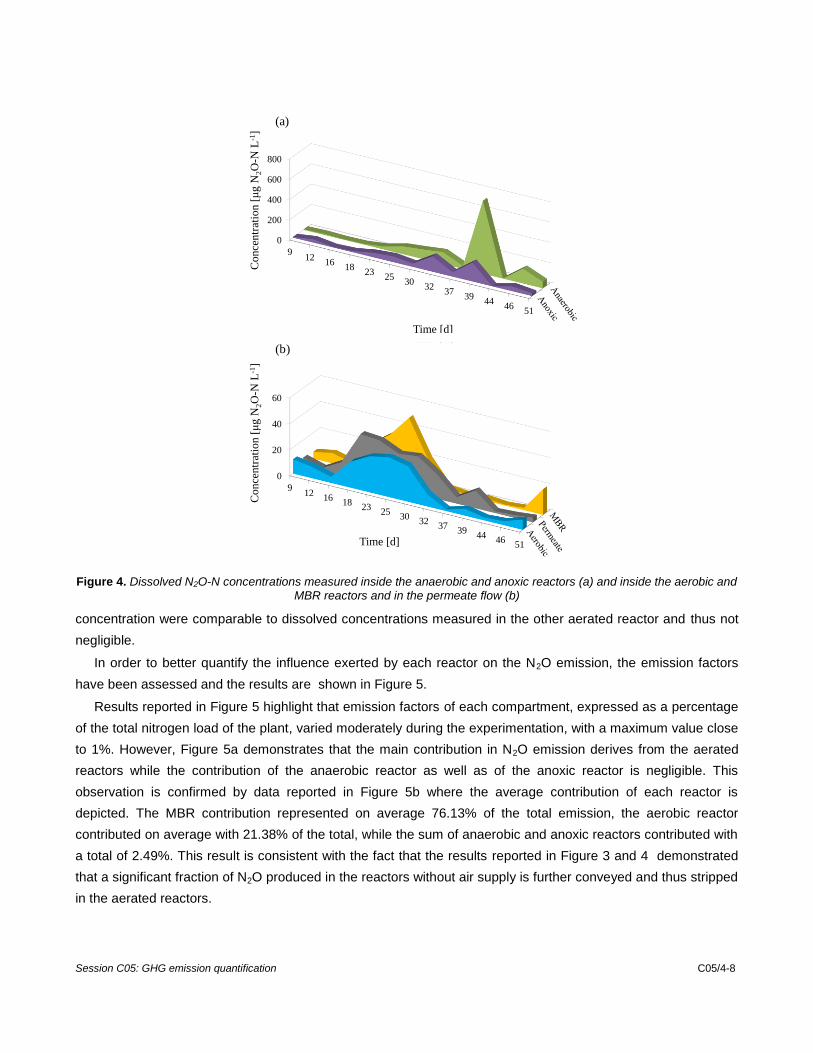
Figure 4. Dissolved N2O-N concentrations measured inside the anaerobic and anoxic reactors (a) and
inside the aerobic and MBR reactors and in the permeate flow (b)
Figure 4. Dissolved N2O-N concentrations measured inside the anaerobic and anoxic reactors (a) and inside the aerobic and MBR reactors and in the permeate flow (b)
concentration were comparable to dissolved concentrations measured in the other aerated reactor and thus not
negligible.
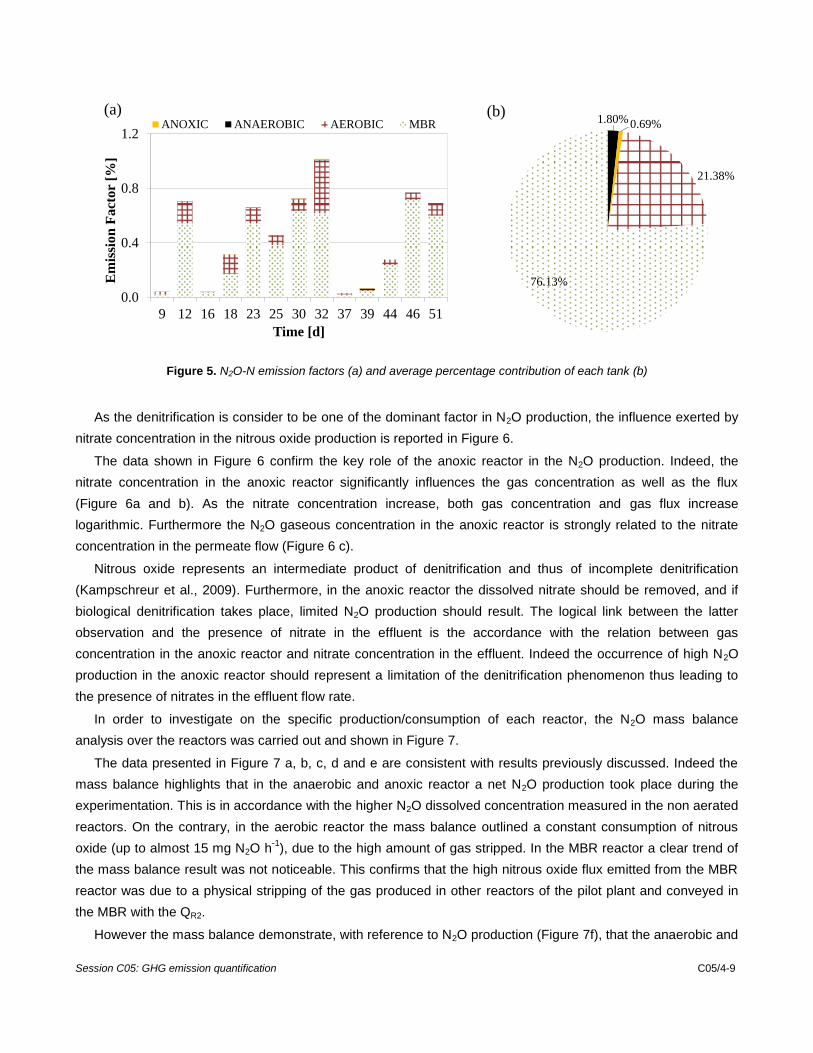
In order to better quantify the influence exerted by each reactor on the N2O emission, the emission factors
have been assessed and the results are shown in Figure 5.
Results reported in Figure 5 highlight that emission factors of each compartment, expressed as a percentage
of the total nitrogen load of the plant, varied moderately during the experimentation, with a maximum value close
to 1%. However, Figure 5a demonstrates that the main contribution in N2O emission derives from the aerated
reactors while the contribution of the anaerobic reactor as well as of the anoxic reactor is negligible. This
observation is confirmed by data reported in Figure 5b where the average contribution of each reactor is
depicted. The MBR contribution represented on average 76.13% of the total emission, the aerobic reactor
contributed on average with 21.38% of the total, while the sum of anaerobic and anoxic reactors contributed with
a total of 2.49%. This result is consistent with the fact that the results reported in Figure 3 and 4 demonstrated
that a significant fraction of N2O produced in the reactors without air supply is further conveyed and thus stripped
in the aerated reactors.
Session C05: GHG emission quantification C05/4-9
1.80% 0.69%
21.38%
76.13%
0.0
0.4
0.8
1.2
9 12 16 18 23 25 30 32 37 39 44 46 51
Em
issi
on
Facto
r [%
]
Time [d]
ANOXIC ANAEROBIC AEROBIC MBR(a) (b)
Figure 5. N2O-N emission factors (a) and average percentage contribution of each tank (b)
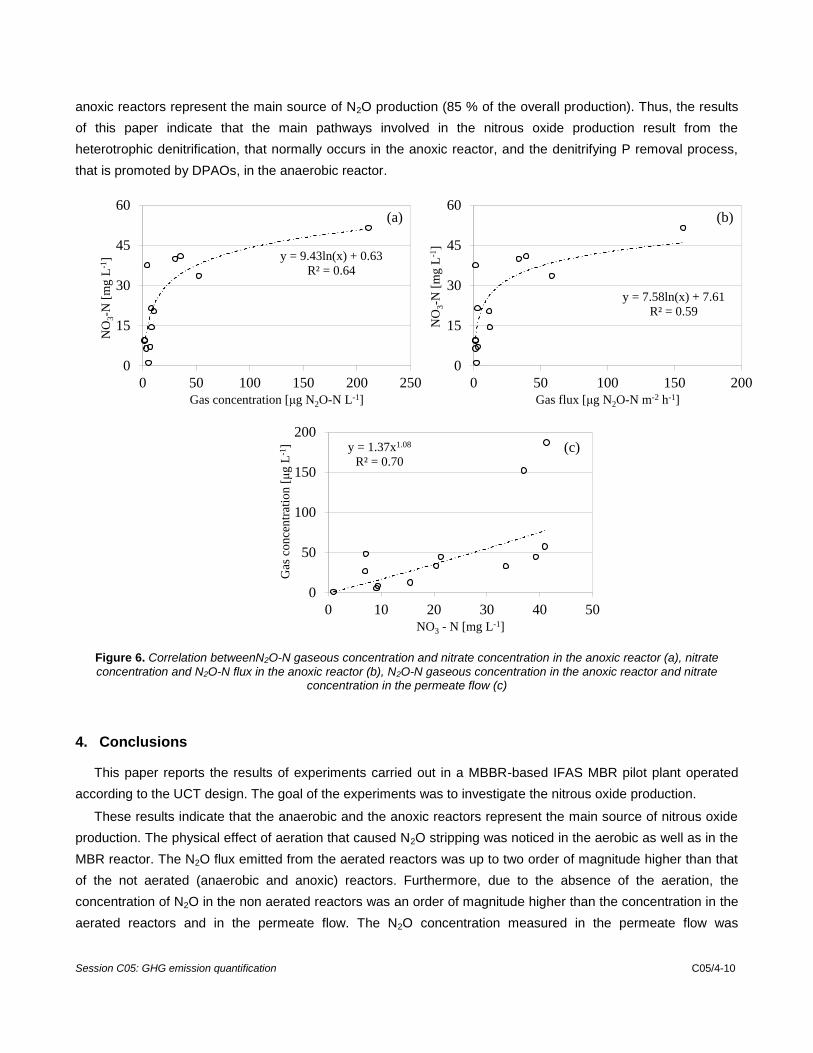
As the denitrification is consider to be one of the dominant factor in N2O production, the influence exerted by
nitrate concentration in the nitrous oxide production is reported in Figure 6.
The data shown in Figure 6 confirm the key role of the anoxic reactor in the N2O production. Indeed, the
nitrate concentration in the anoxic reactor significantly influences the gas concentration as well as the flux
(Figure 6a and b). As the nitrate concentration increase, both gas concentration and gas flux increase
logarithmic. Furthermore the N2O gaseous concentration in the anoxic reactor is strongly related to the nitrate
concentration in the permeate flow (Figure 6 c).
Nitrous oxide represents an intermediate product of denitrification and thus of incomplete denitrification
(Kampschreur et al., 2009). Furthermore, in the anoxic reactor the dissolved nitrate should be removed, and if
biological denitrification takes place, limited N2O production should result. The logical link between the latter
observation and the presence of nitrate in the effluent is the accordance with the relation between gas
concentration in the anoxic reactor and nitrate concentration in the effluent. Indeed the occurrence of high N2O
production in the anoxic reactor should represent a limitation of the denitrification phenomenon thus leading to
the presence of nitrates in the effluent flow rate.
In order to investigate on the specific production/consumption of each reactor, the N2O mass balance
analysis over the reactors was carried out and shown in Figure 7.
The data presented in Figure 7 a, b, c, d and e are consistent with results previously discussed. Indeed the
mass balance highlights that in the anaerobic and anoxic reactor a net N2O production took place during the
experimentation. This is in accordance with the higher N2O dissolved concentration measured in the non aerated
reactors. On the contrary, in the aerobic reactor the mass balance outlined a constant consumption of nitrous
oxide (up to almost 15 mg N2O h-1
), due to the high amount of gas stripped. In the MBR reactor a clear trend of
the mass balance result was not noticeable. This confirms that the high nitrous oxide flux emitted from the MBR
reactor was due to a physical stripping of the gas produced in other reactors of the pilot plant and conveyed in
the MBR with the QR2.
However the mass balance demonstrate, with reference to N2O production (Figure 7f), that the anaerobic and
Session C05: GHG emission quantification C05/4-10
anoxic reactors represent the main source of N2O production (85 % of the overall production). Thus, the results
of this paper indicate that the main pathways involved in the nitrous oxide production result from the
heterotrophic denitrification, that normally occurs in the anoxic reactor, and the denitrifying P removal process,
that is promoted by DPAOs, in the anaerobic reactor.
y = 9.43ln(x) + 0.63
R² = 0.64
0
15
30
45
60
0 50 100 150 200 250
NO
3-N
[m
g L
-1]
Gas concentration [μg N2O-N L-1]
y = 1.37x1.08
R² = 0.70
0
50
100
150
200
0 10 20 30 40 50
Gas
co
nce
ntr
atio
n [μ
g L
-1]
NO3 - N [mg L-1]
y = 7.58ln(x) + 7.61
R² = 0.59
0
15
30
45
60
0 50 100 150 200
NO
3-N
[m
g L
-1]
Gas flux [μg N2O-N m-2 h-1]
(a) (b)
(c)
Figure 6. Correlation betweenN2O-N gaseous concentration and nitrate concentration in the anoxic reactor (a), nitrate
concentration and N2O-N flux in the anoxic reactor (b), N2O-N gaseous concentration in the anoxic reactor and nitrate concentration in the permeate flow (c)
4. Conclusions
This paper reports the results of experiments carried out in a MBBR-based IFAS MBR pilot plant operated
according to the UCT design. The goal of the experiments was to investigate the nitrous oxide production.
These results indicate that the anaerobic and the anoxic reactors represent the main source of nitrous oxide
production. The physical effect of aeration that caused N2O stripping was noticed in the aerobic as well as in the
MBR reactor. The N2O flux emitted from the aerated reactors was up to two order of magnitude higher than that
of the not aerated (anaerobic and anoxic) reactors. Furthermore, due to the absence of the aeration, the
concentration of N2O in the non aerated reactors was an order of magnitude higher than the concentration in the
aerated reactors and in the permeate flow. The N2O concentration measured in the permeate flow was

Session C05: GHG emission quantification C05/4-11
-20
-15
-10
-5
0
5
10
15
20
9 12 16 18 23 25 30 32 37 39 44 46 51
Pro
du
ced
(-)
or
con
sum
ed (
+)
N-N
2O
[m
g N
2O
-N h
-1]
Time [d]
(a)
-20
-15
-10
-5
0
5
10
15
20
9 12 16 18 23 25 30 32 37 39 44 46 51
Pro
du
ced (
-) o
r co
nsu
med
(+
)
N-N
2O
[m
g N
2O
-N h
-1]
Time [d]
(b)
-20
-15
-10
-5
0
5
10
15
20
9 12 16 18 23 25 30 32 37 39 44 46 51
Pro
du
ced (
-) o
r co
nsu
med
(+
)
N-N
2O
[m
g N
2O
-N h
-1]
Time [d]
(c)
-20
-15
-10
-5
0
5
10
15
20
9 12 16 18 23 25 30 32 37 39 44 46 51
Pro
du
ced
(-)
or
con
sum
ed (
+)
N-N
2O
[m
g N
2O
-N h
-1]
Time [d]
(d)
Anaerobic Anoxic
Aerobic MBR
-20
-15
-10
-5
0
5
10
15
20
Anaerobic Anoxic Aerobic MBR
Pro
du
ced
(-)
or
con
sum
ed (
+)
N-N
2O
[m
gN
2O
-N h
-1]
max
average
min
(e)
44%
41%
6%
9%
Anaerobic Anoxic Aerobic MBR
(f)
Figure 7. N2O-N mass balance for anaerobic (a), anoxic (b), aerobic (c) and MBR reactors (d); maximum, minimum and
mean value of N2O-N production/consumption over the reactors (e); mean percentage of N2O-N production over the reactors (f)
comparable to the concentrations measured in the aerobic and MBR reactors and thus not negligible. The
emission factor assessment showed that only around 1% of the influent nitrogen was emitted as N2O from the
whole pilot plant.
By taking into account the biological parameters of the pilot plant, the nitrate concentration within the anoxic
reactor turned out to be a key factor in the influence of the N2O production. The experiments demonstrate that
further studies are required in order to better understand the influence of the operational parameters, as well as
of the biomass feature, in the N2O production. Indeed, in the reported experiments a net contribution of the
attached biomass or of the suspended biomass was not noticeable.

Session C05: GHG emission quantification C05/4-12
Acknowledgements
This work forms part of a research project supported by grant of the Italian Ministry of Education, University
and Research (MIUR) through the Research project of national interest PRIN2012 (D.M. 28 dicembre 2012 n.
957/Ric − Prot. 2012PTZAMC) entitled “Energy consumption and GreenHouse Gas (GHG) emissions in the
wastewater treatment plants: a decision support system for planning and management −
http://ghgfromwwtp.unipa.it” in which the first author of this paper is the Principal Investigator.
References:
[1] Chandran, K., Stein, L.Y., Klotz, M.G., van Loosdrecht, M.C.M., 2011. Nitrous oxide production by
lithotrophic ammonia oxidizing bacteria and implications for engineered nitrogen-removal systems. Biochem.
Soc. Trans. 39, 1832-1837.
[2] Cosenza, A., Di Bella, G., Mannina, G., Torregrossa, M., Viviani, G. 2013. Biological Nutrient Removal and
Fouling Phenomena in a University of Cape Town Membrane Bioreactor Treating High Nitrogen Loads . J.
Environ. Eng. 139, 773-780.
[3] Di Trapani, D., Di Bella, G., Mannina, G., Torregrossa, M., Viviani, G., 2014. Comparison between moving
bed-membrane bioreactor (MB-MBR) and membrane bioreactor (MBR) systems: Influence of wastewater
salinity variation. Bioresour. Technol. 162, 60–69.
[4] Ekama, G.A., Siebritz, I.P., Marais, G.R., 1983. Considerations in the process design of nutrient removal
activated sludge processes. Wat. Sci. Tech. 15 (3-4), 283 – 318.
[5] IPCC, 2007. Changes in atmospheric constituents and in radiative forcing. In: Solomon, S. et al. (Eds.),
Climate Change 2007: The Physical Science Basis. Contribution of Working Group I to the Fourth
Assessment Report of the Intergovernmental Panel on Climate Change. Cambridge University Press,
Cambridge, pp. 114–143.
[6] Jia, W.L., Zhang, J., Xie, H.J., Yan, Y.J., Wang, J.H., Zhao, Y.X., Xu, X.L., 2012. Effect of PHB and oxygen
uptake rate on nitrous oxide emission during simultaneous nitrification denitrification process. Bioresour.
Technol. 113, 232–238.
[7] Kampschreur, M.J., Temmink, H., Kleerebezem, R., Jetten, M.S.M., van Loosdrecht, M.C.M., 2009. Nitrous
oxide emission during wastewater treatment. Water Res. 43, 4093–4103.
[8] Kim, S.W., Miyahara, M., Fushinobu, S., Wakagi, T., Shoun, H., 2010. Nitrous oxide emission from nitrifying
activated sludge dependent on denitrification by ammonia oxidizing bacteria. Bioresour. Technol. 101, 3958-
3963.
[9] Kimochi, Y., Inamori, Y., Mizuochi, M., Xu, K.-Q., and Matsumura, M., 1998. Nitrogen removal and N2O
emission in a full-scale domestic wastewater treatment plant with intermittent aeration. J. Ferment. Bioeng.
86, 202–206.
[10] Law, Y., Ni, B.J., Lant, P., Yuan, Z., 2012. N2O production rate of an enriched ammonia-oxidising bacteria
culture exponentially correlates to its ammonia oxidation rate. Water Res. 46, 3409-3419.

Session C05: GHG emission quantification C05/4-13
[11] Lemaire, R., Meyer, R., Taske, A., Crocetti, G.R., Keller, J., Yuan, Z.G., 2006. Identifying causes for N2O
accumulation in a lab-scale sequencing batch reactor performing simultaneous nitrification, denitrification
and phosphorus removal. J. Biotechnol. 122, 62–72.
[12] Lo, I.W., Lo, K.W., Mavinic, D.S., Shiskowski, D., Ramey, W., 2010. Contributions of biofilm and suspended
sludge to nitrogen transformation and nitrous oxide emission in hybrid sequencing batch system. Journal of
Environmental Sciences, 22(7) 953–960.
[13] Lu, H., Chandran, K., 2010. Factors promoting emissions of nitrous oxide and nitric oxide from denitrifying
sequencing batch reactors operated with methanol and ethanol as electron donors. Biotechnology and
Bioengineering 106 (3), 390-398.
[14] Mannina G., Ekama, G., Caniani, D., Cosenza, A., Esposito, G., Gori, R., Garrido-Baserba, M., Rosso, D.,
Olsson, G. 2016. Greenhouse gases from wastewater treatment — A review of modelling tools. Science of
The Total Environment, 551–552, 254-270.
[15] Otte, S., Grobben, N.G., Robertson, L.A., Jetten, M.S.M., Kuenen, J. G., 1996. Nitrous oxide production by
Alcaligenes faecalis under transient and dynamic aerobic and anaerobic conditions. Applied and
Environmental Microbiology 62 (7), 2421–2426.
[16] Stuven, R., Vollmer, M., Bock, E., 1992. The impact of organic matter on nitric oxide formation by
Nitrosomonas europaea. Archives of Microbiology 158 (6), 439-443.
[17] Tsuneda, S., Mikami, M. and Kimochi, Y., 2005. Effect of salinity on nitrous oxide emission in the biological
nitrogen removal process for industrial wastewater, J. Hazard Mater. 119, 93–98.
[18] Wang, Z., Meng, Y., Fan, T., Du, Y., Tang, J., Fan, S., 2015. Phosphorus removal and N2O production in
anaerobic/anoxic denitrifying phosphorus removal process: Long-term impact of influent phosphorus
concentration. Bioresource Technology 179 (2015) 585–594
[19] Wrage, N., Velthof, G.L., van Beusichem, M.L., Oenema, O., 2001. Role of nitrifier denitrification in the
production of nitrous oxide. Soil Biology and Biochemistry 33 (12-13), 1723-1732.
[20] Yu, R., Kampschreur, M.J., Loosdrecht, M.C.M., Chandran, K., 2010. Mechanisms and specific directionality
of autotrophic nitrous oxide and nitric oxide generation during transient anoxia. Environ. Sci. Technol. 44,
1313-1319.
[21] Zhao, W., Wang, Y., Lin, X., Zhou, D., Pan, M., Yang, J., 2014. Identification of the salinity effect on N2O
production pathway during nitrification: Using stepwise inhibition and 15N isotope labeling methods. Chem.
Eng. J. 253, 418–426.
[22] Zhou, Y., Lim, M., Harjono, S., Ng, W.J., 2012. Nitrous oxide emission by denitrifying phosphorus removal
culture using polyhydroxyalkanoates as carbon source. J. Environ. Sci. 24, 1616–1623.