greenhouse gas and carbon profile of the u.s. forest
TRANSCRIPT

Greenhouse Gas and Carbon Profile of the U.S. Forest Industry Value Chain
SUPPORTING INFORMATION
LINDA S. HEATH, VAN MALTBY, REID MINER, KENNETH E. SKOG, JAMES E. SMITH, JAY UNWIN, and BRAD UPTON
Supporting Information: Below we present detailed information on forest ecosystems and carbon, and greenhouse gas emissions from forest products manufacturing facilities.

Supporting Information for: Heath et al. 2010. Greenhouse Gas and Carbon Profile of the U.S. Forest Industry Value Chain. Environmental Science and Technology
S2
1. Forest Ecosystem Carbon
Table S1 shows the trend of forest carbon ecosystem by subset of owner group and productivity through 2040 using the FORCARB2 model (1). The model runs at 5-year increments for the South and 10-year increments for other regions. Output was interpolated between the 10-year increments in the other regions to report by 5-year increments. Aboveground live tree biomass only is shown because we have the most certainty in these estimates. This indicates that forest carbon stocks change over time, but private forests and forests overall are expected to continue to sequester carbon, although perhaps at a reduced rate. The value for industry-owned lands for the period 2000–2005 is very similar to the value for all non-soil forest pools because some of the additional pools sequester carbon whereas others are release carbon. The projections support the notion that growth and removals on forest industry-owned lands are balanced, or perhaps even sequester a small amount, over the long-term.
Table S1. Average annual forest stock change by period, aboveground live tree biomass pool only (TgCO2/yr). Negative number indicates sequestration into forest.
Productivity-Owner Perioda
2000-2005
2005-2010
2015-2020
2025-2030
2035-2040
All US forests -290.0 -321.9 -305.4 -259.6 -222.9 All timberland -229.5 -258.5 -228.8 -184.8 -154.4 All private timberland -86.5 -119.5 -106.7 -73.0 -53.5 All Industry-owned timberland
11.4 -22.7 -27.9 -23.5 -22.7
a For brevity, not all periods are shown.
2. Greenhouse Gas Emissions from Forest Products Manufacturing Facilities
Manufacturing facilities contribute emissions from sources: direct emissions associated with fuel combustion; CH4 emissions associated with treatment and disposal of liquid and solid mill wastes; wastewater treatment operations; landfills receiving mill wastes; and emissions associated with final manufacturing operations. Specific methods for each category are presented below.
2.1 Direct Emissions Associated with Fuel Combustion
Almost all direct greenhouse gas (GHG) emissions from forest products industry manufacturing facilities are the result of fossil fuel combustion. However, the industry satisfies much of its energy requirements by burning large quantities of biomass fuels, but the CO2 released from this biomass combustion is not included in GHG totals because it contains biogenic carbon. This

Supporting Information for: Heath et al. 2010. Greenhouse Gas and Carbon Profile of the U.S. Forest Industry Value Chain. Environmental Science and Technology
S3
biogenic carbon is addressed via the calculations on the stocks and flows of forest carbon, described elsewhere. Small amounts of nitrous oxide (N2O) and methane (CH4) are released during combustion of biomass fuels and fossil fuels. Although some may categorize these emissions as emissions from product use, we include these in this element. Total direct GHG emissions from fuel combustion were estimated separately for the pulp and paper sector and the wood products sector due to differing data sources.
2.1a Pulp and Paper Sector
Pulp and paper sector energy consumption during 1990 and 2004 is presented in Table S2.
TABLE S2. Energy Consumption Data for the U.S. Pulp and Paper Industrya Parameter
1990b
(PJ LHV) 2004c
(PJ LHV) Spent liquor solids 969.21 1,046.93 Biomassd 379.12 392.09 Coal 338.81 287.01 Distillate fuel oil (#2) 6.91 12.07 Gasoline — 0.31 Kerosene — 0.71 Liquid propane gas 3.36 1.71 Natural gas 381.40 299.86 Other fuele 5.43 7.41 Residual fuel oil (#5, 6) 151.19 136.20 Rubber tire chips — 9.07 Purchased electricity 167.51 170.92 Sold electricity 35.43 19.92 a American Forest and Paper Association (AF&PA), unpublished data, converted from HHV to LHV using the approximations: LHV=0.95*HHV for solid and liquid fossil fuels (including LPG and tire chips) and biomass LHV=0.9*HHV for natural gas b The results of AF&PA’s 1990 survey responses represented 91.4% of U.S. production. The totals were scaled to total U.S. production by AF&PA, and the scaled data are displayed. c The results of AF&PA’s 2004 survey responses represented 83% of U.S. production. We scaled those data to total U.S. production by multiplying the totals by 1.2088, and the scaled data are displayed. d Treated like wood. e Treated like distillate fuel oil.
Emission factors per energy consumption unit are shown in Table S3. Greenhouse gas emission estimates are expressed as CO2 equivalents (CO2-eq.) and include CO2, CH4, and N2O, including CH4 and N2O from combustion of biomass fuels. Global warming potentials (GWPs) of 21 and 310 were used for converting CH4 and N2O, respectively, to CO2-eq. (Note: although most accepted GHG reporting programs require GWPs of 21 and 310 for CH4 and N2O, respectively, these will likely be changed to 25 and 298 at some point in the future due to updated information.)

Supporting Information for: Heath et al. 2010. Greenhouse Gas and Carbon Profile of the U.S. Forest Industry Value Chain. Environmental Science and Technology
S4
TABLE S3. Greenhouse Gas Emission Factors for Fossil and Biomass Fuelsa
Fuel CO2 Factor
(kg/GJ LHV) CH4 Factorb
(kg/MJ LHV) N2O Factorb
(kg/MJ LHV) Gasoline 68.6 2 0.6 Kerosene 71.1 2 0.6 Distillate oil (and diesel) 73.3 2 0.6 Residual fuel oil 76.6 2 0.6 LPG (propane) 62.4 2 0.6 Natural gas 55.8 5 0.1 Coal (assumed bituminous) 92.7 10 1 Tires and tire derived fuel 85.6c 10 1 Wood and wood waste 0d 12e 4e
Pulping liquors 0d 2.5e 2e a Emission factors are from IPCC (1997) (2), corrected for unoxidized carbon as recommended, unless otherwise noted. b CH4 and N2O emission factors are IPCC (1997) (2) Tier 1, unless otherwise noted. c CO2 factor for tires and tire-derived fuel is from the Energy Information Administration (EIA) (2006) (3), not corrected for unoxidized carbon d Emission factor for biomass-derived CO2 is zero because carbon in biomass fuels is accounted for in the assessment of forest carbon (i.e., including CO2 emissions from biomass combustion in direct emission estimates would result in double counting). e CH4 and N2O factors for biomass fuels are from NCASI (2005a) (4).
Multiplying through the component estimates and summing, pulp and paper industry manufacturing direct emissions from fuel consumption were 66.9 TgCO2-eq. in 1990 and 57.7 TgCO2-eq. in 2004, while total pulp and paper production increased during the same period, from 91.1 TgCO2-eq. in 1990 to 102.3 TgCO2-eq. in 2004. The decrease in direct emissions may result from implementation of energy efficiency measures and increased reliance on low-emitting biomass fuels (which displace fossil fuels). Similar estimates were produced by the Department of Energy’s Energy Information Administration (5). The 2002 data yielded an emissions estimate of 62.1 TgCO2-eq. and the preliminary 2006 data yielded an estimate of 50.5 TgCO2-eq.
2.1b Wood Products Sector
Energy consumption by the wood products sector in 1991 was estimated using data from (6), shown in Table S4. The GHG emission factors in Table S3 were multiplied by energy consumption data (table S4) to estimate direct emissions from fuel combustion of 4.4 TgCO2-eq. in 1991.
Supporting Information for: Heath et al. 2010. Greenhouse Gas and Carbon Profile of the U.S. Forest Industry Value Chain. Environmental Science and Technology
S5
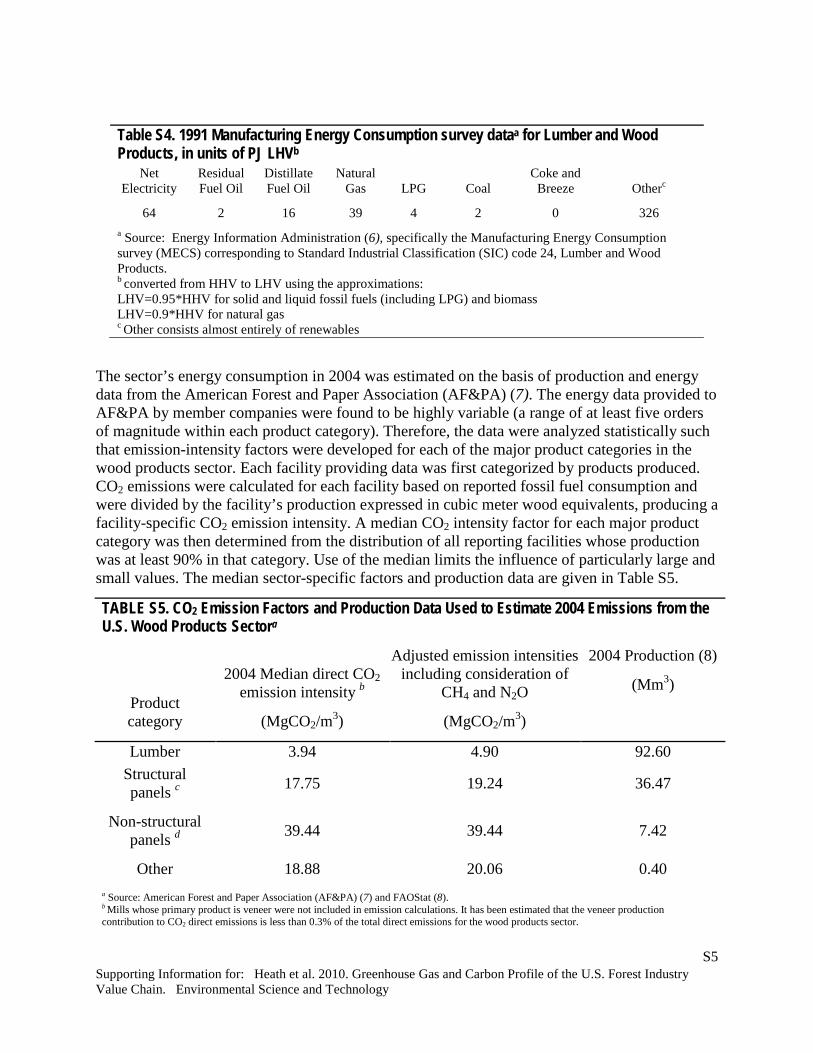
Table S4. 1991 Manufacturing Energy Consumption survey dataa for Lumber and Wood Products, in units of PJ LHVb
Net Electricity
Residual Fuel Oil
Distillate Fuel Oil
Natural Gas LPG Coal
Coke and Breeze Otherc
64 2 16 39 4 2 0 326 a Source: Energy Information Administration (6), specifically the Manufacturing Energy Consumption survey (MECS) corresponding to Standard Industrial Classification (SIC) code 24, Lumber and Wood Products. b converted from HHV to LHV using the approximations: LHV=0.95*HHV for solid and liquid fossil fuels (including LPG) and biomass LHV=0.9*HHV for natural gas c Other consists almost entirely of renewables
The sector’s energy consumption in 2004 was estimated on the basis of production and energy data from the American Forest and Paper Association (AF&PA) (7). The energy data provided to AF&PA by member companies were found to be highly variable (a range of at least five orders of magnitude within each product category). Therefore, the data were analyzed statistically such that emission-intensity factors were developed for each of the major product categories in the wood products sector. Each facility providing data was first categorized by products produced. CO2 emissions were calculated for each facility based on reported fossil fuel consumption and were divided by the facility’s production expressed in cubic meter wood equivalents, producing a facility-specific CO2 emission intensity. A median CO2 intensity factor for each major product category was then determined from the distribution of all reporting facilities whose production was at least 90% in that category. Use of the median limits the influence of particularly large and small values. The median sector-specific factors and production data are given in Table S5.
TABLE S5. CO2 Emission Factors and Production Data Used to Estimate 2004 Emissions from the U.S. Wood Products Sectora
Product category
2004 Median direct CO2 emission intensity b
(MgCO2/m3)
Adjusted emission intensities including consideration of
CH4 and N2O
(MgCO2/m3)
2004 Production (8)
(Mm3)
Lumber 3.94 4.90 92.60 Structural panels c 17.75 19.24 36.47
Non-structural panels d 39.44 39.44 7.42
Other 18.88 20.06 0.40 a Source: American Forest and Paper Association (AF&PA) (7) and FAOStat (8). b Mills whose primary product is veneer were not included in emission calculations. It has been estimated that the veneer production contribution to CO2 direct emissions is less than 0.3% of the total direct emissions for the wood products sector.

Supporting Information for: Heath et al. 2010. Greenhouse Gas and Carbon Profile of the U.S. Forest Industry Value Chain. Environmental Science and Technology
S6
c Category includes oriented strandboard (OSB), softwood plywood, and engineered wood products. d Category includes hardwood plywood, medium-density fiberboard (MDF), particleboard, hardboard, and fiberboard.
CO2 emission-intensity factors for each major product category were adjusted to include the other pertinent GHGs (CH4 and N2O) in the current analysis. A ratio of total GHG emissions (including CO2 from fossil fuels and CH4 and N2O from all fuels) to fossil fuel CO2 emissions was developed for each production category and applied to the appropriate category median CO2 factors (see Table S5). Total wood products sector emissions were estimated by multiplying each of the category-specific emission intensities by total 2004 U.S. production in the category (8), and were summed across categories.
The resulting estimate of direct fuel combustion GHG emissions from the U.S. wood products sector in 2004 was 1.8 TgCO2-eq. This value is notably lower than that for 1991 (4.4 TgCO2-eq.). A comparison of the two estimates is complicated by the underlying uncertainty in the data and the different data sources and estimation methods used. As a check on these estimates, EIA (5) data yields 6.0 TgCO2-eq. for 1998; 4.9 TgCO2-eq. for 2002; and for preliminary 2006 data, an estimate of 7.6 TgCO2-eq. These differences are likely due in large part to the difficulty of obtaining a representative sample of this sector of the industry, which is characterized by a very large number of small facilities. However, these emissions are small compared with those from the pulp and paper sector, so the uncertainty in the wood products sector emissions has little effect on the overall emissions estimate for the forest products industry. Consequently, to be consistent with the estimates for pulp and paper, the American Forest and Paper Association (AF&PA) data-derived estimates were used for 2004.
In summary, total direct GHG emissions related to fossil fuel combustion at forest products industry facilities (not including pulp and paper sector converting operations) are estimated to have been 71.3 TgCO2-eq. in 1990 and 59.5 TgCO2-eq. in 2004. The 2004 result represents about 1% of total U.S. energy-related GHG emissions, estimated at 6,150 TgCO2-eq. (9). Although we did not derive an estimate of the uncertainty for these estimates, U.S. EPA (9) reported that energy-related CO2 emissions estimates in the U.S. national inventory are characterized by an uncertainty range of about ± 15% for industrial sources.
2.2 Emissions Associated with Treatment and Disposal of Liquid and Solid Mill Wastes
There are two potential sources of GHGs associated with management of mill wastes: CH4 emissions from mill landfills, and CH4 emissions from wastewater treatment operations experiencing anaerobic conditions. The data available for estimating these emissions are sparse, so the National Council for Air and Stream Improvement, Inc. (NCASI) recently completed studies to improve these estimates. The studies, described below, found these emissions to be relatively small (compared with other emissions sources) and highly variable. The reasons for the variability are not yet understood. Given the small size of these emissions, a median value was used for developing estimates of total industry emissions. The reader is cautioned, however, that the approaches discussed herein will not generate accurate estimates of individual mill emissions.
2.2a Emissions from Wastewater Treatment Operations
NCASI, Inc. studies have confirmed that primary treatment such as mechanical clarifiers and aerobic biological treatment systems with high-intensity mixing, such as activated sludge

Supporting Information for: Heath et al. 2010. Greenhouse Gas and Carbon Profile of the U.S. Forest Industry Value Chain. Environmental Science and Technology
S7
treatment systems, do not generate significant amounts of CH4. The data by mill from these studies are shown in Tables S6.
TABLE S6. Measured Methane Emissions by Treatment (Methods Described in Crawford, 2008 (10))
Mill Treatment Methane emissions (MgCH4/y)
Methane emissions (MgCO2-eq./y)
B Primary 0.54 11 B Primary 0.57 12 D Primary 3.7 77 F Primary 5.3 110 F Activated sludge plant 6.3 130
Anaerobic treatment systems are known to generate CH4, but there are very few biological treatment systems in the U.S. forest products industry that are designed to provide treatment via the anaerobic decomposition of organic matter. There are, however, operations that can contain zones that become anaerobic, including aerated stabilization basins (ASBs), primary settling basins, and post-aeration basins.
2.2a1 Aerated Stabilization Basin Emissions
The year 2004 was used in these calculations because 2004 data were the most current available from AF&PA surveys of the industry’s wastewater discharges. Several sources of information were used to identify 125 U.S. mills operating ASBs and the final effluent biochemical oxygen demand (BOD) loads from these systems. The sum of annual final effluent BOD from all mills with ASBs was used to derive an estimate on incoming BOD loads by assuming a treatment efficiency of 94% across the ASBs. Studies involving measurements of CH4 emissions from industry ASBs suggest that, although there is large unexplained variability between systems, on average about 1% of incoming BOD is converted to CH4. Using these data, the annual mass emitted from ASBs was calculated to be 4,600 MgCH4, or approximately 0.10 TgCO2-eq. The data used to develop the 1% ratio are shown in Table S7.
TABLE S7. Methane Emissions Measured from Aerated Stabilization Basins (Methods Described in Crawford (2008) (10))
Mill Methane emissions (g/s) BOD removal (g/s) Ratio A 3.9 419 0.9% D 1.90 124 1.5% E 5.8 474 1.2%

Supporting Information for: Heath et al. 2010. Greenhouse Gas and Carbon Profile of the U.S. Forest Industry Value Chain. Environmental Science and Technology
S8
Because of limited information for 1990, it was necessary to use a slightly different approach. The sum of annual final effluent BOD for all mills with ASBs in 1990 was scaled back from 2004 by multiplying the 2004 mass by the ratio of 1990 total production to 2004 total production. The total final effluent BOD discharged by mills with ASBs was calculated using an estimated industry-wide final effluent BOD loading (2.99 kgCH4/Mg effluent) for 1990 obtained by interpolation from AF&PA data (11). A treatment plant efficiency statistic for 1990 was obtained and used to estimate the mass of BOD removed (12). Finally, the ASB fraction of the total BOD removed was used to calculate the amount of BOD removed by ASBs. As with the 2004 data, 1% of incoming BOD was converted to CH4. Using these data, the 1990 annual mass emitted from ASBs was calculated to be 6,300 MgCH4, or approximately 0.13 TgCO2-eq.
2.2a2 Settling Pond Emissions
In lieu of mechanical clarifiers, some mills use earthen primary settling ponds to remove suspended solids from wastewater prior to entering an ASB or activated sludge treatment system. Temporary storage of solids in these ponds can result in anaerobic conditions and subsequent release of CH4. Statistics from U.S. EPA (13) indicate that approximately 10% of U.S. production is at mills with such ponds. Based on this information, we assumed that 10% of the industry’s wastewater loading had the potential to cause CH4 emissions in these ponds. The CH4 generation rate (MgCH4/y/ m3 wastewater) used for this calculation was developed in one study for a primary settling pond. The data generated at this mill are shown in Table S8.
TABLE S8. Methane Emissions Measured from a Settling Pond Treatment (Methods Described in Crawford, (2008) (11)) Test period 1 Test period 2
Mill Settling pond number CH4 emissions
(Mg/y) Wastewater
flow(Ml/day) CH4 emissions
(Mg/y) Wastewaterflow
(Ml/day) E 1 441.50 121.0 409.97 106.0
Overall production data for 2004 and 1990 were the same as those used for ASB CH4 emissions. The 2004 annual mass of CH4 emitted from settling ponds was calculated to be 5,100 Mg, or approximately 0.11 TgCO2-eq. The 1990 annual mass of CH4 emitted from settling ponds was calculated to be 4,400 Mg, approximately 0.09 TgCO2-eq.
2.2a3 Post-Aeration Basins
The majority of mills that operate ASBs use a post-ASB (quiescent) basin to allow suspended solids to settle out. In some situations where mills do not have a separate quiescent basin, they use a non-aerated tail end portion of the ASB to settle solids. In either arrangement, the mixing energy is low enough that solids settle into a blanket on the bottom of the basins. Storage of solids in these ponds can result in anaerobic conditions and subsequent release of CH4.
Methane emission measurements from post-aeration basins are limited to one study by NCASI conducted at a southern kraft mill that used a quiescent basin to settle solids prior to final discharge. The data are shown in Table S9.

Supporting Information for: Heath et al. 2010. Greenhouse Gas and Carbon Profile of the U.S. Forest Industry Value Chain. Environmental Science and Technology
S9
TABLE S9. Methane Emissions Measured from a Post Aeration Basin (Methods Described in Crawford, 2008 (10))
Mill Methane emissions
(Mg/y) Methane emissions
(GgCO2-eq./y) B 63 1.3
Using annual CH4 emission rates for the quiescent basin and the annual production of the mill (432 kt/y), methane emitted was calculated on a per tonne basis. This emission rate was multiplied by the sum of the production for all mills operating ASBs. The resulting sum of CH4 produced by solids in quiescent basins was 9.50 kt in 2004, equal to approximately 0.2 TgCO2-eq.
Methane emissions for 1990 were calculated in a manner similar to the 1990 ASB CH4 emission rates, in that a ratio of 1990 to 2004 total production was determined and used to scale back the total production of all mills with ASBs. The CH4/t emission rate of product for 1990 was assumed to be the same as in 2004. The resulting sum of CH4 produced by solids in settling ponds was 8.2 kt in 1990, or approximately 0.17 TgCO2-eq.
2.2a4 Total Wastewater Management-Related Emissions
Combined emissions of CH4 from industry wastewater management systems are estimated to have been 0.40 TgCO2-eq. in both 1990 and 2004 (Table S10). EPA (14) has estimated that these emissions are approximately 10 times larger: 4.1 TgCO2-eq. However, EPA’s estimates use generic emission factors whereas our estimates use measurement-based factors. Thus, we assume our estimates are more accurate.
TABLE S10. Annual Treatment Plant Methane Releases (ktCH4) Treatment source 1990 2004
Aerated stabilization basin 6.3 4.6 Primary settling pond 4.4 5.1 Post-aeration pond 8.2 9.5 Total as methane 18.9 19.2 Total (TgCO2-eq.) 0.40 0.40
2.2b Emissions from Landfills Receiving Mill Wastes
Survey information on the quantity of solid waste generated and the fraction of that waste that is landfilled was used to derive an industry-wide estimate of the quantities each year from 1970 through 2005. These were used in a first-order decay equation, along with appropriate k and Lo values, to calculate 1990, 2004, and 2005 forest products industry landfill CH4 emissions using a GHG calculation tool (15). Separate estimates were made for pulp and paper mills and wood products plants.
Supporting Information for: Heath et al. 2010. Greenhouse Gas and Carbon Profile of the U.S. Forest Industry Value Chain. Environmental Science and Technology
S10
2.2b1 Pulp and Paper Mills
For pulp and paper mills, wastewater treatment residuals and ash constitute the vast majority of the solid residuals landfilled (16). Ash is essentially inert so only wastewater treatment plant (WWTP) residuals were considered. Residuals collected in primary treatment alone degrade in landfills very slowly or not at all (17), probably because of a lack of essential nutrients (particularly phosphorus and nitrogen) to support anaerobic biological activity. Only after 1970, when the practice of combining biological solids with primary solids prior to disposal started to become more common, did landfilled WWTP residuals have much potential to produce methane. Therefore, only residuals landfilled since 1970 were considered.
Survey data relevant to landfilling of WWTP residuals are available as far back as 1979 (12,16, 18, 19). The quantity landfilled was calculated as the product of the quantity of WWTP residuals generated and the landfilling rate. Where the quantity generated was not known, it was estimated from the product of the generation rate and the total paper, paperboard, and market pulp production for the year (20). For years in which the quantity generated was unknown and could not be estimated from the generation rate, it was estimated by interpolation between the most recent values before and after that year. Quantities before 1975 were extrapolated from values in 1985 and 1975. Where the landfilling rate was unknown it was obtained by interpolation. The landfilling rate in 1970 was assumed to be 95%.
2.2b2 Wood Products Facilities
Wood products facilities almost never have WWTPs as such, so the vast majority of solid residuals they produce result from handling and processing wood. Available data for quantities landfilled by these facilities are sparse and the record is not as long as for pulp and paper mills (11). As with pulp and paper mills, the quantity generated was calculated as the product of the generation rate and the total wood products production of lumber and panels (8). For years between 1999 and 2006 for which generation rates were unknown, they were estimated by interpolation between the nearest known values. For years prior to 1999, generation rates were assumed to be the same as those documented in 1999. For years between 1999 and 2006 for which landfilling rates were unknown, they were estimated by interpolation. For years prior to 1999, landfilling rates were estimated by interpolation between the 1999 rate and an assumed rate in 1970 of 10%. The 1970-assumed landfilling rate is so much lower than the 95% assumed for pulp and paper mills because it is longstanding common practice for wood products mills either to burn their solid waste or to provide it to pulp mills as a fiber source.
Methane Emissions Calculations
As noted, CH4 emissions were estimated using a first order decay model (21). The first order model requires estimates of the first order generation rate constant (k) in units of inverse years, and the ultimate CH4 generation potential (Lo) in units of standard cubic meters of methane per dry megagram of deposited material. NCASI studied four different pulp and paper mill WWTP residuals both in the laboratory and in the field to learn what values to use for these coefficients. The coefficients have been found to be highly variable between residuals for reasons that are not yet understood. For purposes of this study, the average observed values for k (0.013year-1) and Lo (80.5 m3/Mg) were used for both WWTP residuals and wood products residuals. It was

Supporting Information for: Heath et al. 2010. Greenhouse Gas and Carbon Profile of the U.S. Forest Industry Value Chain. Environmental Science and Technology
S11
assumed for all years that 10% of CH4 generated was oxidized before it was released to the atmosphere (21) and that there was no collection or burning of landfill methane.
Results
Estimates of CH4 released from landfills receiving forest products solid wastes are shown in Table S11. A global warming potential of 21 was used to convert CH4 to CO2-eq. Methane releases in 1990 were estimated to have been approximately 1.6 TgCO2-eq., increasing to 2.2 TgCO2-eq. in 2005. These emissions are offset, to some degree, by carbon storage in these same landfills.
TABLE S11. Estimated Methane and Equivalent Carbon Dioxide Emissions from Forest Products Industry Landfills
Year Methane (kt) (TgCO2-eq.) 1990 74.2 1.56 2004 103.1 2.17 2005 10 2.18
2.3 Emissions Associated with Secondary (Converting) Manufacturing Operations
Primary pulp and paper products are often further processed to yield final products. In most cases, however, these operations (converting and assembly) emit low quantities of GHGs compared with primary manufacturing. A lifecycle study of magazines in North America, for instance, found that GHG emissions attributable to printing were 3%–7% of those from pulp and paper manufacturing (22). A European study of corrugated box manufacturing found that CO2 emissions associated with assembling multi-layer corrugated board from paperboard represented approximately 13% of the cradle-to-gate emissions of fossil fuel-derived CO2 (23). For some paper products, copy paper for instance, almost no additional GHGs are generated in converting the primary product (e.g., converting rolls of paper into cut sheets). Lifecycle studies of houses have found that emissions resulting from house construction (not including worker transport) are less than 10% of embodied GHG emissions in the building materials (24). In total, the available information suggests that for purposes of developing the forest products industry’s GHG profile, it is reasonable to assume that secondary manufacturing operations are responsible for emissions on the order of 10% of those from primary manufacturing, evenly divided between direct and indirect emissions (e.g., corresponding to purchased electricity).
In the current analysis, emissions in 1991 associated with pulp and paper industry converting operations were estimated based on energy consumption data (Table S12), and multiplied by the emission factors presented in Table S3. Emissions were 2.8 TgCO2-eq. in 1991 and 2.5 TgCO2-eq. in 2002.

Supporting Information for: Heath et al. 2010. Greenhouse Gas and Carbon Profile of the U.S. Forest Industry Value Chain. Environmental Science and Technology
S12
Table S12. 1991 and 2002 Manufacturing Energy Consumption survey data for Printing and Publishing, in units of PJ LHVa
Net
Electricity Residual Fuel Oil
Distillate Fuel Oil
Natural Gas LPG Coal
Coke and
Breeze
Other (consists almost
entirely of renewables)
1991b
(SIC 27) 56 <0.5 2 46 1 0 0 4
2002c
(NAICS 323) 53 <0.5 <0.5 44 1 0 0 1 a converted from HHV to LHV using the approximations: LHV=0.95*HHV for solid and liquid fossil fuels (including LPG) and biomass LHV=0.9*HHV for natural gas b EIA (6), specifically MECS corresponding to SIC code 27, printing and publishing. c EIA (25) corresponding to North American Industry Classification Standard (NAICS) code 323, printing and related support
3. GHG Emissions Associated with Producing Fiber
Harvesting and burning are the other significant sources of GHG emissions related to obtaining forest fiber. Sonne (26) found that fuel consumption by harvesting equipment emits 8.3 kg CO2-eq./m3 for harvested wood. In 1990, approximately 427.20 Mm3 of industrial round wood were harvested in the United States, whereas the harvest in 2005 was approximately 423.46 Mm3 (8). These values suggest that approximately 3.5 TgCO2-eq. were emitted during harvesting in 1990 and 2005. N2O emissions related to fertilizer use in U.S. forests were 0.1 TgCO2-eq. in 1990 and 0.3 TgCO2-eq./yr from 2004 to 2006 (9). Other pre-harvest emissions are not as significant (26).
Pile burning is sometimes used to clear harvest debris and prepare a site for replanting and regeneration. Where it is used, it can generate CH4 and N2O emissions that are 60% of those associated with fuel combustion in harvesting equipment (25). In western Washington and Oregon, pile burning is used about 20% of the time (26). Applying these two factors to harvesting emissions estimates yields at 0.4 TgCO2-eq./yr of emissions associated with pile burning. Pile burning may be more or less prevalent in other parts of the country, but these emissions are so small that additional precision is not necessary for purposes of this study.
Overall, therefore, it appears that producing virgin fiber in 1990 and 2005 resulted in emissions of 4.0 TgCO2-eq. and 4.2 TgCO2-eq., respectively. Although some minor emissions may be associated with sorting recovered fiber, most of the emissions from recovered fiber can be attributed to transport. These are included in the transport section.
4. GHG Emissions Associated with Producing Non-Fiber Inputs and Fuels
To estimate the upstream emissions associated with non-fiber, non-fuel inputs, lists of amounts of inputs used in paper, paperboard, market pulp and panel production were compiled. The lists for paper, paperboard and market pulp were supplied by Fisher International, based on their
Supporting Information for: Heath et al. 2010. Greenhouse Gas and Carbon Profile of the U.S. Forest Industry Value Chain. Environmental Science and Technology
S13
proprietary database (Fisher International, 50 Water Street, South Norwalk, CT 06854 USA). The lists included all non-fiber inputs representing at least 1% of the total mass of all mill inputs. In several cases, these lists were lengthened to include additional chemicals, based on expert judgment and consultation of the ecoinvent® lifecycle database (The Swiss Centre for Life Cycle Inventories, Swiss Federal Laboratories for Materials Testing and Research, Überlandstrasse 129 CH-8600 Dübendorf, Switzerland). The inputs to panel manufacturing (primarily resins) were obtained from the ecoinvent® database. The upstream loads for pulp, paper, market pulp and panel manufacturing were obtained from the ecoinvent® database.
After examining these data, we assumed that the upstream loads associated with non-wood, non-fuel inputs were 100 kgCO2/t for paper, paperboard and market pulp and 200 kgCO2/t for panels. The non-fiber, non-fuel inputs to sawn wood are so small that they are effectively zero.
These factors were applied to the relevant 1990 and 2005 production quantities (presented in the discussion of transport-related emissions in Supporting Information, section 6.). The resulting non-fiber, non-fuel upstream emissions for paper, paperboard, and market pulp produced in 1990 and 2005 were 8 and 9 tCO2-eq., respectively. Those for panel production in 1990 and 2005 were 4 and 5 MtCO2-eq., respectively. The totals, therefore, were 12 and 14 MtCO2-eq. in 1990 and 2005, respectively.
For upstream emissions associated with fossil fuels, data were obtained from the SS_FuelsandEnergyPrecombustion module of the U.S. Life-Cycle Database maintained by the U.S. DOE National Renewable Energy Laboratory (27). Based on these data, the upstream emissions for coal, residual oil, distillate oil, and natural gas were estimated to be 6.0, 12.8, 12.9, and 12.3 kgCO2-eq./GJ LHV, respectively. Using information on the pulp and paper sector’s fuel consumption in 1990 and 2004 (primarily coal, residual oil, and natural gas), weighted average factors were developed indicating that upstream emissions related to production and transport of fossil fuels were approximately equal to 15% of the combustion-related emissions in both years. A similar analysis was performed based on information on the wood products sector’s fuel consumption in 1991 (primarily natural gas and distillate oil), with results indicating that upstream fossil fuel emissions are approximately 21% of combustion emissions (this relation was applied in estimating pre-combustion fuel emissions related to wood products production for both 1991 and 2004). The upstream fuel emission factor for natural gas was used in estimating these emissions from final manufacture of paper and board products (22% of combustion emissions). Accordingly, the total upstream fuel-related emissions from all three of these sectors were estimated to be 11.6 TgCO2-eq. in 1990 and 9.6 TgCO2-eq. in 2004.
In total, therefore, upstream emissions associated with non-fiber inputs to manufacturing are estimated to be 24 TgCO2-eq. in 1990 and in 2005.
5. Indirect Emissions Associated with Purchases of Electricity
Emissions associated with purchased electricity were derived from data on electricity purchases and sales, combined with a national average purchased electricity emission factor. The CO2 emission factor used (169 kgCO2/GJ) is from the Energy Information Administration (EIA) (28), specifically U.S. DOE’s Updated State-Level Greenhouse Gas Emission Coefficients for Electricity Generation 1998–2000, and represents a 3-year weighted average for electrical

Supporting Information for: Heath et al. 2010. Greenhouse Gas and Carbon Profile of the U.S. Forest Industry Value Chain. Environmental Science and Technology
S14
utilities in the U.S. CH4 and N2O are not included in this factor (if included would increase the factor < 0.5%).
The pulp and paper sector energy consumption data from AF&PA (see Table S2) included information on amounts of purchased electricity and amounts of sold or exported electricity. From this information it was possible to calculate net electricity purchases (purchases minus exports). These data were used to calculate indirect emissions associated with net electricity purchases of 22.2 TgCO2-eq. in 1990 and 25.4 TgCO2-eq. in 2004. The approach is described in more detail in AF&PA (7). There are several potential reasons for the apparent increase in indirect emissions between 1990 and 2004, including: a strategic decision by mills to reduce self generation and increase purchases of power to achieve either lower direct GHG emissions or better economics (e.g., through pricing incentives for purchased power) or perhaps a shift in production grades from those whose manufacturing processes do not require high amounts of electricity (e.g., kraft) to those with a high demand for electricity combined with limited opportunity to self generate (e.g., mechanical).
The statistical method of estimating wood products sector direct emissions from fuel combustion (discussed in Section 2.1b) was applied to estimate indirect emissions associated with the sector’s net electricity purchases in 2004. The sector-level emission factors developed from AF&PA electricity consumption data are shown Table S13.
TABLE S13. Indirect CO2 Emission Factors Used to Estimate Emissions from the U.S. Wood Products Sector (7)
Product category 2004 Median indirect CO2 emission intensity
(tCO2/m3) Lumber 42.3 Structural panelsa 73.3 Non-structural panelsb 110. Otherc 93.0 a Category includes oriented strandboard (OSB), softwood plywood, and engineered wood products. b Category includes hardwood plywood, medium density fiberboard (MDF), particleboard, hardboard, and fiberboard. c Intensity factor for “Lumber” category was used in 2002 and 2000 because less than 35% and 10% of “Other” production was represented in 2002 and 2000, respectively. Also, a production weighted average of the 2004 and 2002 median CO2 emission-intensity factors was used to calculate the emission factor for 2006 because of the small number of mills reporting energy data for the other wood products category in 2006.
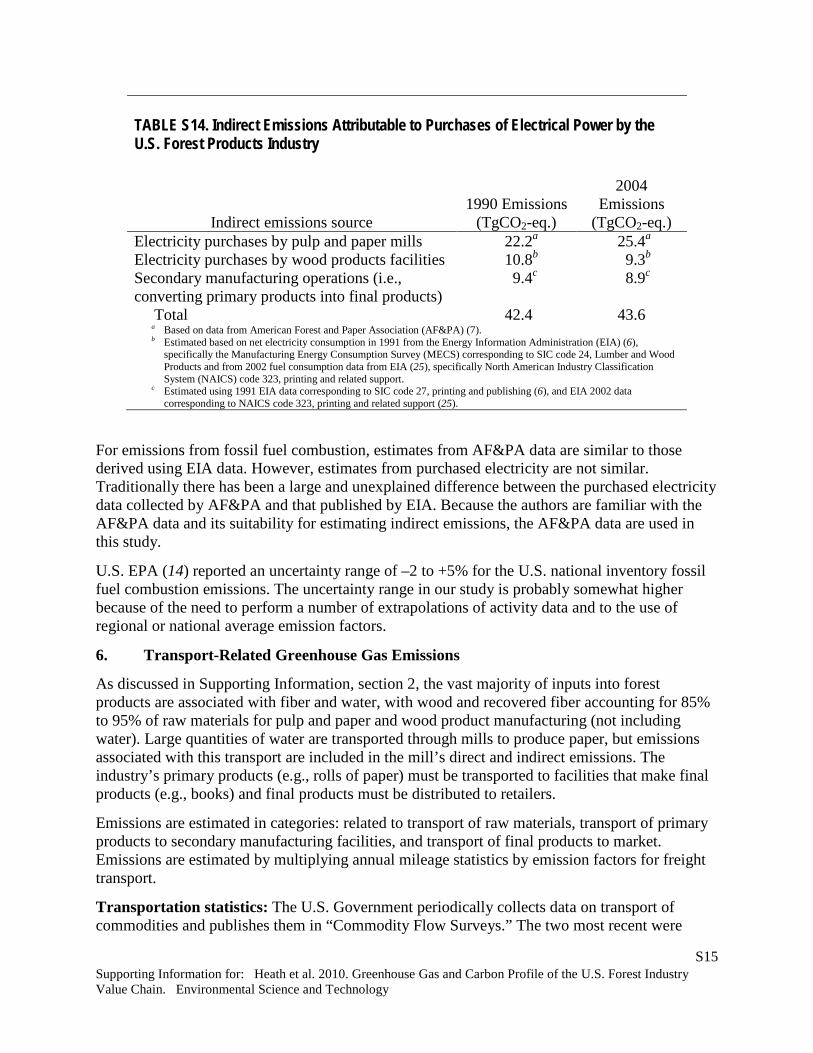
Indirect emissions estimated from these electricity consumption data were 10.8 TgCO2-eq. in 1991 and 9.3 TgCO2-eq. in 2004. Indirect emissions from all sources yields an estimated 42.4 TgCO2 eq. associated with purchased electricity in 1990, and 43.6 TgCO2-eq. in 2004. (Forest products indirect emissions associated with electricity purchases represents about 0.7% of U.S. energy-related greenhouse gas emissions in 2004, estimated at 6,150 TgCO2-eq. (9)). The industry’s indirect emissions from purchases of electrical power are summarized in Table S14.
Supporting Information for: Heath et al. 2010. Greenhouse Gas and Carbon Profile of the U.S. Forest Industry Value Chain. Environmental Science and Technology
S15
TABLE S14. Indirect Emissions Attributable to Purchases of Electrical Power by the U.S. Forest Products Industry
Indirect emissions source 1990 Emissions
(TgCO2-eq.)
2004 Emissions
(TgCO2-eq.) Electricity purchases by pulp and paper mills 22.2a 25.4a Electricity purchases by wood products facilities 10.8b 9.3b Secondary manufacturing operations (i.e., converting primary products into final products)
9.4c 8.9c
Total 42.4 43.6 a Based on data from American Forest and Paper Association (AF&PA) (7). b Estimated based on net electricity consumption in 1991 from the Energy Information Administration (EIA) (6),
specifically the Manufacturing Energy Consumption Survey (MECS) corresponding to SIC code 24, Lumber and Wood Products and from 2002 fuel consumption data from EIA (25), specifically North American Industry Classification System (NAICS) code 323, printing and related support.
c Estimated using 1991 EIA data corresponding to SIC code 27, printing and publishing (6), and EIA 2002 data corresponding to NAICS code 323, printing and related support (25).
For emissions from fossil fuel combustion, estimates from AF&PA data are similar to those derived using EIA data. However, estimates from purchased electricity are not similar. Traditionally there has been a large and unexplained difference between the purchased electricity data collected by AF&PA and that published by EIA. Because the authors are familiar with the AF&PA data and its suitability for estimating indirect emissions, the AF&PA data are used in this study.
U.S. EPA (14) reported an uncertainty range of –2 to +5% for the U.S. national inventory fossil fuel combustion emissions. The uncertainty range in our study is probably somewhat higher because of the need to perform a number of extrapolations of activity data and to the use of regional or national average emission factors.
6. Transport-Related Greenhouse Gas Emissions
As discussed in Supporting Information, section 2, the vast majority of inputs into forest products are associated with fiber and water, with wood and recovered fiber accounting for 85% to 95% of raw materials for pulp and paper and wood product manufacturing (not including water). Large quantities of water are transported through mills to produce paper, but emissions associated with this transport are included in the mill’s direct and indirect emissions. The industry’s primary products (e.g., rolls of paper) must be transported to facilities that make final products (e.g., books) and final products must be distributed to retailers.
Emissions are estimated in categories: related to transport of raw materials, transport of primary products to secondary manufacturing facilities, and transport of final products to market. Emissions are estimated by multiplying annual mileage statistics by emission factors for freight transport.
Transportation statistics: The U.S. Government periodically collects data on transport of commodities and publishes them in “Commodity Flow Surveys.” The two most recent were
Supporting Information for: Heath et al. 2010. Greenhouse Gas and Carbon Profile of the U.S. Forest Industry Value Chain. Environmental Science and Technology
S16
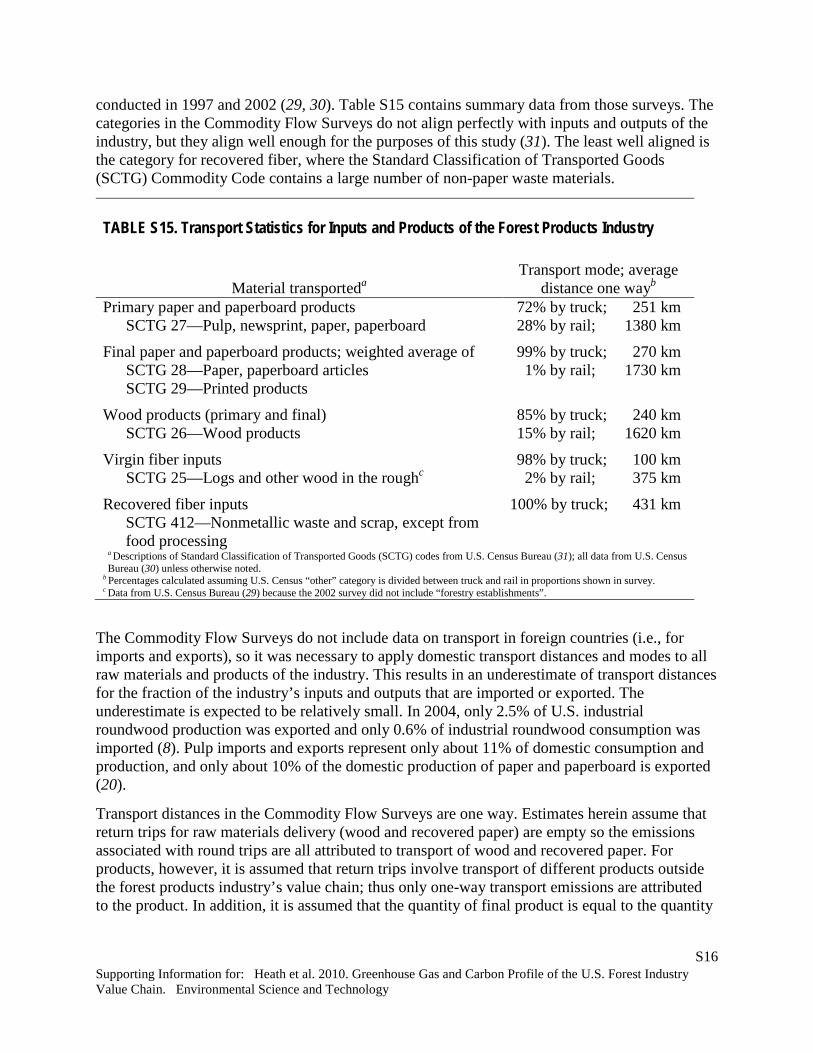
conducted in 1997 and 2002 (29, 30). Table S15 contains summary data from those surveys. The categories in the Commodity Flow Surveys do not align perfectly with inputs and outputs of the industry, but they align well enough for the purposes of this study (31). The least well aligned is the category for recovered fiber, where the Standard Classification of Transported Goods (SCTG) Commodity Code contains a large number of non-paper waste materials.
TABLE S15. Transport Statistics for Inputs and Products of the Forest Products Industry
Material transporteda Transport mode; average
distance one wayb Primary paper and paperboard products
SCTG 27—Pulp, newsprint, paper, paperboard 72% by truck; 251 km 28% by rail; 1380 km
Final paper and paperboard products; weighted average of SCTG 28—Paper, paperboard articles SCTG 29—Printed products
99% by truck; 270 km 1% by rail; 1730 km
Wood products (primary and final) SCTG 26—Wood products
85% by truck; 240 km 15% by rail; 1620 km
Virgin fiber inputs SCTG 25—Logs and other wood in the roughc
98% by truck; 100 km 2% by rail; 375 km
Recovered fiber inputs SCTG 412—Nonmetallic waste and scrap, except from food processing
100% by truck; 431 km
a Descriptions of Standard Classification of Transported Goods (SCTG) codes from U.S. Census Bureau (31); all data from U.S. Census Bureau (30) unless otherwise noted.
b Percentages calculated assuming U.S. Census “other” category is divided between truck and rail in proportions shown in survey. c Data from U.S. Census Bureau (29) because the 2002 survey did not include “forestry establishments”.
The Commodity Flow Surveys do not include data on transport in foreign countries (i.e., for imports and exports), so it was necessary to apply domestic transport distances and modes to all raw materials and products of the industry. This results in an underestimate of transport distances for the fraction of the industry’s inputs and outputs that are imported or exported. The underestimate is expected to be relatively small. In 2004, only 2.5% of U.S. industrial roundwood production was exported and only 0.6% of industrial roundwood consumption was imported (8). Pulp imports and exports represent only about 11% of domestic consumption and production, and only about 10% of the domestic production of paper and paperboard is exported (20).
Transport distances in the Commodity Flow Surveys are one way. Estimates herein assume that return trips for raw materials delivery (wood and recovered paper) are empty so the emissions associated with round trips are all attributed to transport of wood and recovered paper. For products, however, it is assumed that return trips involve transport of different products outside the forest products industry’s value chain; thus only one-way transport emissions are attributed to the product. In addition, it is assumed that the quantity of final product is equal to the quantity

Supporting Information for: Heath et al. 2010. Greenhouse Gas and Carbon Profile of the U.S. Forest Industry Value Chain. Environmental Science and Technology
S17
of primary product (i.e., there is no loss of material in converting primary products into final products).
Energy intensity factors and diesel fuel emission factors used to convert energy intensity into GHG intensity are shown in Table S16. Methane and N2O emissions are not estimated because they are small compared with the uncertainty in the estimates of CO2 emissions. Quantities of material transported are described in Table S17.
TABLE S16. Energy Intensity and Carbon Dioxide Emission Factors for Freight Transport
Fuel intensity
(MJ LHVa/t-km)b CO2 Emissions
(kg/t-km)c Transport mode 1990 2004 1990 2004 Combination truckd 1.723 1.745 0.128 0.129 Rail 0.247 0.202 0.018 0.015 a Lower heating value. b From U.S. DOE 2006 (32), with units converted. c Based on emission factor for diesel fuel of 74,100 kg CO2/TJ NCV (33). d Defined by Bureau of Transportation statistics as “A power unit (truck tractor) and one or more trailing units (a semitrailer or trailer)”.
TABLE S17. Wood Products Quantities Transported in 1990 and 2005
mass of material (Mt) Material 1990 2005 Source of information
Pulp, paper, paperboard (primary products)
79.95 92.26 AF&PA Annual Statistics Reportsa
Pulp, paper, paperboard (final products)
79.95 92.26 AF&PA Annual Statistics Reportsb
Wood products 73.91 85.08 FAO statistics databasec
Wood (virgin fiber) 233.32 239.89 FAO statistics databased
Recovered fiber 19.76 30.86 AF&PA Annual Statistics Reportse a Total of paper and paperboard shipments and market pulp production, AF&PA unpublished data, also (20). b Assumed to equal quantity of primary products, AF&PA unpublished data, also (20). c Total of sawn wood and wood-based panels from (9); assumed mass density 0.585 t/m3 (average of saw timber and panels); from (FAO
2009 (34). d Total industrial round wood consumption estimated as production plus imports minus exports from (9); assumed mass density 0.575
t/m3 (average of pulpwood and saw logs); from FAO 2009 (34). e Recovered paper used at pulp and paper mills in U.S, AF&PA unpublished data, also (20).
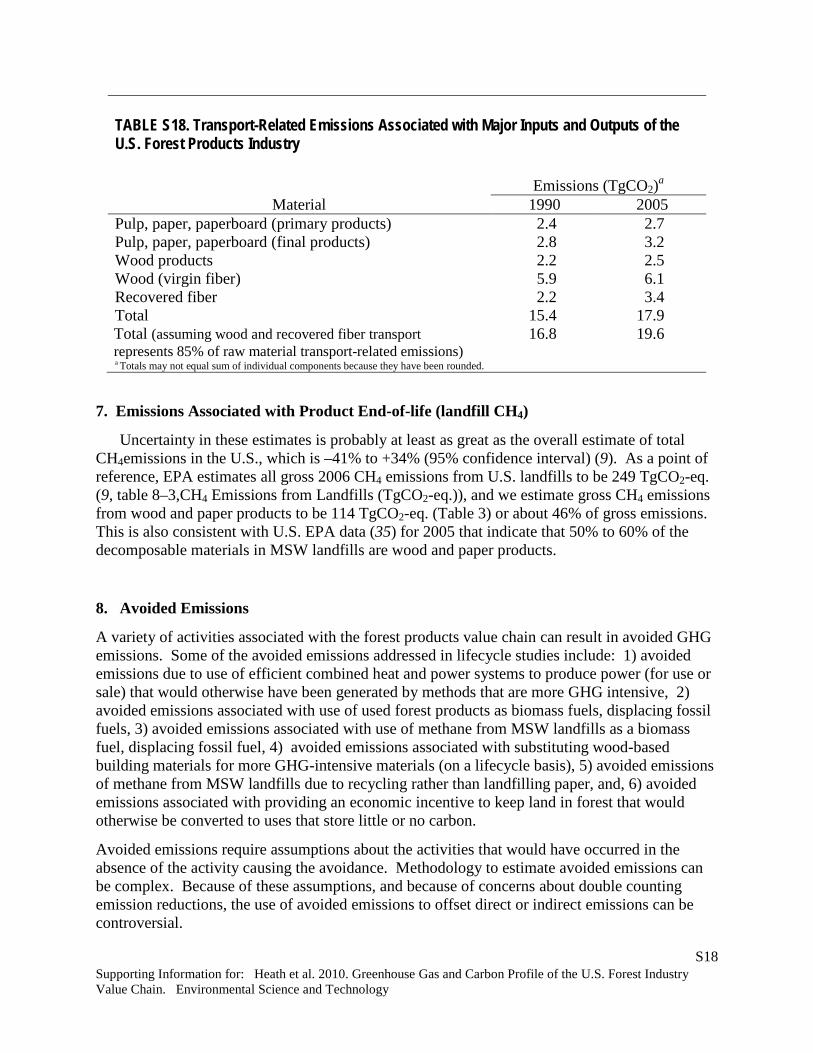
a Multiplying the relevant factors together and summing, and assuming that wood and recovered fiber are responsible for 85% of raw material transport-related emissions, the total transport-related emissions for 1990 and 2004 are estimated to be 16.8 and 19.6 TgCO2/y, respectively. Details are shown in Table S18.
Supporting Information for: Heath et al. 2010. Greenhouse Gas and Carbon Profile of the U.S. Forest Industry Value Chain. Environmental Science and Technology
S18
TABLE S18. Transport-Related Emissions Associated with Major Inputs and Outputs of the U.S. Forest Products Industry
Emissions (TgCO2)a
Material 1990 2005 Pulp, paper, paperboard (primary products) 2.4 2.7 Pulp, paper, paperboard (final products) 2.8 3.2 Wood products 2.2 2.5 Wood (virgin fiber) 5.9 6.1 Recovered fiber 2.2 3.4 Total 15.4 17.9 Total (assuming wood and recovered fiber transport represents 85% of raw material transport-related emissions)
16.8 19.6 a Totals may not equal sum of individual components because they have been rounded.
7. Emissions Associated with Product End-of-life (landfill CH4)
Uncertainty in these estimates is probably at least as great as the overall estimate of total CH4emissions in the U.S., which is –41% to +34% (95% confidence interval) (9). As a point of reference, EPA estimates all gross 2006 CH4 emissions from U.S. landfills to be 249 TgCO2-eq. (9, table 8–3,CH4 Emissions from Landfills (TgCO2-eq.)), and we estimate gross CH4 emissions from wood and paper products to be 114 TgCO2-eq. (Table 3) or about 46% of gross emissions. This is also consistent with U.S. EPA data (35) for 2005 that indicate that 50% to 60% of the decomposable materials in MSW landfills are wood and paper products.
8. Avoided Emissions
A variety of activities associated with the forest products value chain can result in avoided GHG emissions. Some of the avoided emissions addressed in lifecycle studies include: 1) avoided emissions due to use of efficient combined heat and power systems to produce power (for use or sale) that would otherwise have been generated by methods that are more GHG intensive, 2) avoided emissions associated with use of used forest products as biomass fuels, displacing fossil fuels, 3) avoided emissions associated with use of methane from MSW landfills as a biomass fuel, displacing fossil fuel, 4) avoided emissions associated with substituting wood-based building materials for more GHG-intensive materials (on a lifecycle basis), 5) avoided emissions of methane from MSW landfills due to recycling rather than landfilling paper, and, 6) avoided emissions associated with providing an economic incentive to keep land in forest that would otherwise be converted to uses that store little or no carbon.
Avoided emissions require assumptions about the activities that would have occurred in the absence of the activity causing the avoidance. Methodology to estimate avoided emissions can be complex. Because of these assumptions, and because of concerns about double counting emission reductions, the use of avoided emissions to offset direct or indirect emissions can be controversial.

Supporting Information for: Heath et al. 2010. Greenhouse Gas and Carbon Profile of the U.S. Forest Industry Value Chain. Environmental Science and Technology
S19
Because studies existed that were relevant to the level of this work, we included 2 types of avoided emissions. We give more details here on the one category of avoided emissions associated with decreased methane emissions attributable to recycling. Paper that is no longer being put in landfills in the US is being recycled or burned for energy, displacing fossil fuels in many cases. These changes were estimated using the U.S. Environmental Protection Agency’s Waste Reduction Model (WARM). WARM includes algorithms and parameter values which allowed us to examine the CH4 differences between recycling and average existing end-of-life management in terms of the effect on end-of-life emissions and storage on a lifecycle basis (36).
The model examines the effects of recycling by considering a range of lifecycle impacts. For forest products that are kept out of landfills, the model considers reduced methane emissions and reduced carbon storage. For forest products that are recycled, the model considers the difference in GHG intensity of virgin and recycled manufacturing processes as well as the additional carbon that is stored in the forest as a result of reducing the demand for virgin fiber. For forest products that are burned for energy, the model considers the effects of displacing fossil fuels.
An examination of WARM reveals that the most important factors associated with increased recycling are additional storage of carbon in the forest, and reduced methane emissions and reduced carbon storage associated with keeping forest products out of landfills. The modeling of effects in the forest is highly sensitive to assumptions about the export of recovered fiber and does not address a variety of market-related impacts that would affect the decisions of forest owners. The model does not, for instance, consider potential effects related to land owner decisions to convert pulpwood stands to saw timber stands or to other non-forest uses in the face of diminished demand for pulpwood. Thus the modeling of these effects is considered less robust than other aspects of the model, and results of the analysis are expressed herein as a range (corresponding to estimates made with and without the benefits of additional forest carbon). The range of benefits associated with recycling the recovered paper used by US mills in 2006 is 13 to 115 TgCO2-eq., depending on whether model estimates for increased forest carbon are included.
Literature Cited (1) Smith, J. E.; Heath, L. S. Carbon stocks and projections on public forestlands in the United States, 1952–2040. Environ. Mgmt. 2004, 33(4): 433–442.
(2) Intergovernmental Panel on Climate Change (IPCC). Revised 1996 IPCC guidelines for national greenhouse gas inventories: Reference manual (Vol. 3). IPCC National Greenhouse Gas Inventory Program. 1997, IPCC Website; ://www.ipcc-nggip.iges.or.jp/public/gl/invs6.htm (March 2008).
(3) Energy Information Administration (EIA). Instructions for Form EIA-1605; Voluntary reporting of greenhouse gases. Washington, DC: U.S. Department of Energy. 2006, EIA Website; ://ftp.eia.doe.gov/pub/oiaf/1605/cdrom/pdf/FormEIA-1605_2005_Instructions.pdf. (March 31, 2008).
(4) National Council for Air and Stream Improvement, Inc. (NCASI). Calculation tools for estimating greenhouse gas emissions from pulp and paper mills. (Report ver. 1.1). Research Triangle Park, NC: NCASI, published under the World Resources Institute and World Business

Supporting Information for: Heath et al. 2010. Greenhouse Gas and Carbon Profile of the U.S. Forest Industry Value Chain. Environmental Science and Technology
S20
Council for Sustainable Development Greenhouse Gas Protocol Initiative. 2005a, NCASI Website; .ghgprotocol.org.
(5) Energy Information Administration (EIA). Preliminary U.S. Manufacturing Fuel Consumption 2006. Washington, DC: U.S. Department of Energy. 2009, EIA Website; ( ://www.eia.doe.gov/emeu/mecs/contents.html).
(6) Energy Information Administration (EIA). Manufacturing consumption of energy 1991. Washington, DC: U.S. Department of Energy. 1994, EIA Website; ://tonto.eia.doe.gov/FTPROOT/consumption/051291.pdf. (March 31, 2008).
(7) American Forest and Paper Association (AF&PA). Monitoring progress toward the AF&PA Climate VISION commitment. Washington, DC: AF&PA. May 2008, access available with permission via Website; ://www.ncasi.org/programs/areas/climate/footprint.aspx.
(8) Food and Agriculture Organization of the United Nations (FAO). FAOSTAT forest products data base. Rome: U.N. FAO. 2008, FAO Website; ://faostat.fao.org. (March 31, 2008).
(9) U.S. Environmental Protection Agency (EPA). Inventory of U.S. greenhouse gas emissions and sinks: 1990–2006. Washington DC: U.S. EPA. 2008, 394 pp.
(10) Crawford, R. J.; Crapo, A. M.; Jain, A. K. Reduced sulfur compound emissions from kraft pulp and paper mill wastewater treatment plants. Proceedings of the Water Environment Federation, WEF/A&WMA Odors and Air Emissions 2008: (21) 777-797.
(11) American Forest and Paper Association (AF&PA). AF&PA Environmental, health and safety verification program. (Biennial report). Washington, DC: AF&PA. 2008
(12) Miner, R.; Unwin, J. Progress in reducing water use and wastewater loads in the U.S. paper industry. TAPPI J. 1991, 74(8).
(13) U.S. Environmental Protection Agency (EPA). Development document for the pulp, paper, and paperboard category effluent limitations guidelines, pretreatment standards, and new source performance standards. Washington, DC: Engineering and Analysis Division, Office of Science and Technology. EPA Report 821R93019, 1993. [911 pp].
(14) U.S. Environmental Protection Agency (EPA). Inventory of U.S. greenhouse gas emissions and sinks: 1990–2007. Washington DC: U.S. EPA. 2009, 441 pp.
(15) National Council for Air and Stream Improvement, Inc. (NCASI). Calculation tools for estimating greenhouse gas emissions from pulp and paper mills. (Spreadsheet ver. 1.2). Research Triangle Park, NC: NCASI, published under the World Resources Institute and World Business Council for Sustainable Development Greenhouse Gas Protocol Initiative. 2005b, NCASI Website; .ghgprotocol.org.
(16) National Council for Air and Stream Improvement, Inc. (NCASI). Solid waste management practices in the U.S. paper industry—1995. Technical Bulletin No. 0793. Research Triangle Park, NC: NCASI. 1999, 48 pp. http://www.ncasi.org//Publications/Detail.aspx?id=1147
(17) National Council for Air and Stream Improvement, Inc. (NCASI). Compilation of alternative landfill cover experience using wastewater treatment plant residuals. Technical Bulletin No. 900. Research Triangle Park, NC: NCASI. 2005c, 69 pp. Available at http://www.ncasi.org/Publications/Detail.aspx?id=2771
Supporting Information for: Heath et al. 2010. Greenhouse Gas and Carbon Profile of the U.S. Forest Industry Value Chain. Environmental Science and Technology
S21
(18) National Council for Air and Stream Improvement, Inc. (NCASI). A compilation of data on the nature and performance of wastewater management systems in the pulp and paper industry. Special Report No. 83–09. Research Triangle Park, NC: NCASI. 1983, 81 pp. Available at http://www.ncasi.org//Publications/Detail.aspx?id=578
(19) National Council for Air and Stream Improvement, Inc. (NCASI). A review of variability in effluent quality discharged by selected pulp and paper industry sources. Technical Bulletin No. 355. Research Triangle Park, NC: NCASI. 1991, 68 pp. Available at ://www.ncasi.org//Publications/Detail.aspx?id=524
(20) American Forest and Paper Association (AF&PA) 2007 Statistics, data through 2006; Paper, paperboard, and wood pulp. Washington, DC: AF&PA. 2007
(21) Intergovernmental Panel on Climate Change (IPCC). In: Climate Change 2007: Fourth Assessment Report of the Intergovernmental Panel on Climate Change (Synthesis report). Cambridge, UK and New York, NY: Cambridge University Press. 2007, 104 pp.
(22) Gower, S. T.; McKeon-Ruediger, A.; Reitter, A.; Bradley, M.; Refkin, D.; Tollefson, T.; Souba, F. J.; Taup, A.; Embury-Williams, L.; Schiavone, S.; Weinbauer, J.; Janetos, A. C.; Jarvis, R. Following the paper trail—The impact of magazine and dimensional lumber production on greenhouse gas emissions: A case study. Washington, DC: H. John Heinz III Center for Science. 2006, 102 pp. http://www.heinzctr.org/publications/index.shtml#papertrail
(23) Fédération Européenne des Fabricants de Carton Ondule (European Federation of Corrugated Board Manufacturers) (FEFCO). European database for corrugated board life cycle studies 2006. Brussels, BE: FEFCO. 2006, FEFCO Website; ://www.fefco.org/fileadmin/Fefco/pdfs___words/Publications/lca2006.pdf. 40 pp.
(24) Cole, R. J. Energy and greenhouse gas emissions associated with the construction of alternative structural systems. Building and Environment 1999, 34(3): 335–348.
(25) Energy Information Administration (EIA). 2002 Manufacturing energy consumption survey (MECS). Washington, DC: U.S. Department of Energy. 2005, EIA Website; ://www.eia.doe.gov/emeu/mecs/mecs2002/data02/shelltables.html.
(26) Sonne, E. Greenhouse gas emissions from forestry operations: A life cycle assessment. Journal of Environmental Quality 2006, 35: 1439-1450.
(27) U.S. Department of Energy. U.S. Life-Cycle Database. National Renewable Energy Laboratory. 2008, DOE Website; http://www.nrel.gov/lci/database/default.asp. (June 20, 2008).
(28) Updated state-level greenhouse gas emission coefficients for electricity generation, 1998–2000. Washington, DC: U.S. Department of Energy. 2002, EIA Website; ://tonto.eia.doe.gov/ftproot/environment/e-supdoc-u.pdf. (March 31, 2008).
(29) U.S. Census Bureau. 1997 Economic census: Transportation–1997 commodity flow survey. Publication No. EC97TCF-US. Washington, DC: U.S. Department of Commerce. 1999, 169 pp.
(30) U.S. Census Bureau. 2002 Economic census: Transport–2002 commodity flow survey. Publication No. EC02TCF-US. Washington, DC: U.S. Department of Commerce. 2004, 160 pp.

Supporting Information for: Heath et al. 2010. Greenhouse Gas and Carbon Profile of the U.S. Forest Industry Value Chain. Environmental Science and Technology
S22
(31) U.S. Census Bureau. 2007 Commodity flow survey commodity codes. Publication No. CFX-1200. Washington, DC: U.S. Department of Commerce. 2006. 18 pp. Available at ://www.census.gov/svsd/www/cfsdat/cfs071200.pdf.
(32) U.S. Department of Energy. Energy intensity indicators—Transportation sector spreadsheet. Office of Energy Efficiency and Renewable Energy. 2006, DOE Website; ( ://www1.eere.energy.gov/ba/pba/intensityindicators/trend_data.html) (May 15, 2008).
(33) Intergovernmental Panel on Climate Change (IPCC). 2006 IPCC guidelines for national greenhouse gas inventories. Hayama, Kanagawa, Japan: IPCC, Institute for Global Environmental Strategies. 2006.
(34) FAO 2009. FAO Corporate Document Repository—Converting Factors. Originally published FAO. 1947. Converting factors. Unasylva 1(3). ://www.fao.org/docrep/x5341e/x5341e0g.htm
(35) U.S. Environmental Protection Agency. Municipal Solid Waste in the United States: 2005 Facts and Figures. EPA 530–R–06–011. Office of Solid Waste (5306P): Washington, DC, 2006; U.S. Environmental Protection Agency Website; ://www.epa.gov/msw/msw99.htm. (36) U.S. Environmental Protection Agency. Inventory of U.S. Greenhouse Gas Emissions and Sinks: 1990–2005. EPA: Washington, DC, 2007.