greenhouse gas and air quality 13 - bhp
TRANSCRIPT
Olympic Dam Expansion Draft Environmental Impact Statement 2009 373
13
Greenhouse Gas and air quality 13
13.1 introductionThe proposed expansion would increase ore throughput and
introduce a new open pit mine. As a result, the operation would
consume more energy and the number of potential emission
sources would increase. This chapter describes the effect of the
proposed expansion on air quality and public amenity values,
and quantifies the emissions of greenhouse gases, particulates
and other gaseous emissions and their impacts on ambient air
quality. Greenhouse gases are described separately to other
emissions in Section 13.2.
The potential effects of airborne emissions from the proposed
expansion on wildlife and on human health and safety are
addressed in Chapter 15, Terrestrial Ecology, and Chapter 22,
Health and Safety, respectively. Climate change is discussed in
Chapter 8, Meteorological Environment and Climate, and
provides a context to the assessment of greenhouse gas
emissions and air quality in this chapter. The assessment of
existing and predicted radon and radionuclide concentrations is
in Chapter 22, Health and Safety.
13.2 Greenhouse Gas assessment
13.2.1 introduction
As a result of the expansion, energy consumption would
increase, particularly electricity and diesel. This would
increase greenhouse gas emissions and necessitate additional
greenhouse gas management. The overall approach to
greenhouse gas management for the proposed expansion would
be to:
apply a goal of reducing greenhouse gas emissions •
(reportable under the National Greenhouse and Energy
Reporting (Measurement) Determination 2008) to an amount
equivalent to at least a 60% reduction (to an amount equal
to or less than 40%) of 1990 emissions, by 2050
constructing an on-site cogeneration power station •
(250 MW capacity) for recovering waste heat
sourcing renewable energy (35 MW capacity) via the •
national electricity market for the seawater desalination
plant
producing an annual ‘road map’ that quantifies emission •
reduction opportunities and achievements.
This chapter reviews the current legislative environment as it
applies to greenhouse gases and assesses the greenhouse gas
emissions for the proposed expansion in the context of
emissions from the existing operation, and compares them to
projected emissions from South Australia, Australia and the rest
of the world. Potential mitigation measures are also identified.
13.2.2 assessment methods
The emissions generated from the following sources were used
to assess the potential greenhouse gas footprint of the
expanded operation:
stationary energy emissions (i.e. from fuel burning •
equipment like furnaces)
transport fuel emissions•
emissions associated with using electricity•
emissions associated with changes to land use (such as •
land clearing)
emissions associated with oxidation reactions within the •
metallurgical process, the rock storage facility (RSF) and
the tailings storage facility (TSF).
The scope of the greenhouse gas assessment was the entire
expansion project including the export of concentrate via the
Port of Darwin as outlined in Chapter 5, Description of the
Proposed Expansion. The assessment estimated emissions from
electricity purchased through the national electricity market
(NEM) as a worst case. The addition of an on-site combined
cycle gas turbine (CCGT) power station would reduce the
emissions estimated in Section 13.2.5.
Olympic Dam Expansion Draft Environmental Impact Statement 2009374
Greenhouse gases
Greenhouse gases include gases such as water vapour, carbon
dioxide, methane, chlorofluorocarbons (CFCs) and
hydrochlorofluorocarbons (HCFCs) that absorb and re-emit
infra-red radiation (heat), which warm Earth’s surface and
contribute to climate change. The greenhouse effect, which is
synonymous with climate change and global warming, has
recently been defined as ‘any change in climate over time,
whether due to natural variability or as a result of human
activity’ (IPCC 2007).
The impact of greenhouse gas emissions on the atmosphere is
the combined effect of the radiative properties of the gases
(that is, their ability to absorb solar and infra-red radiation)
and the time that it takes for those gases to be removed from
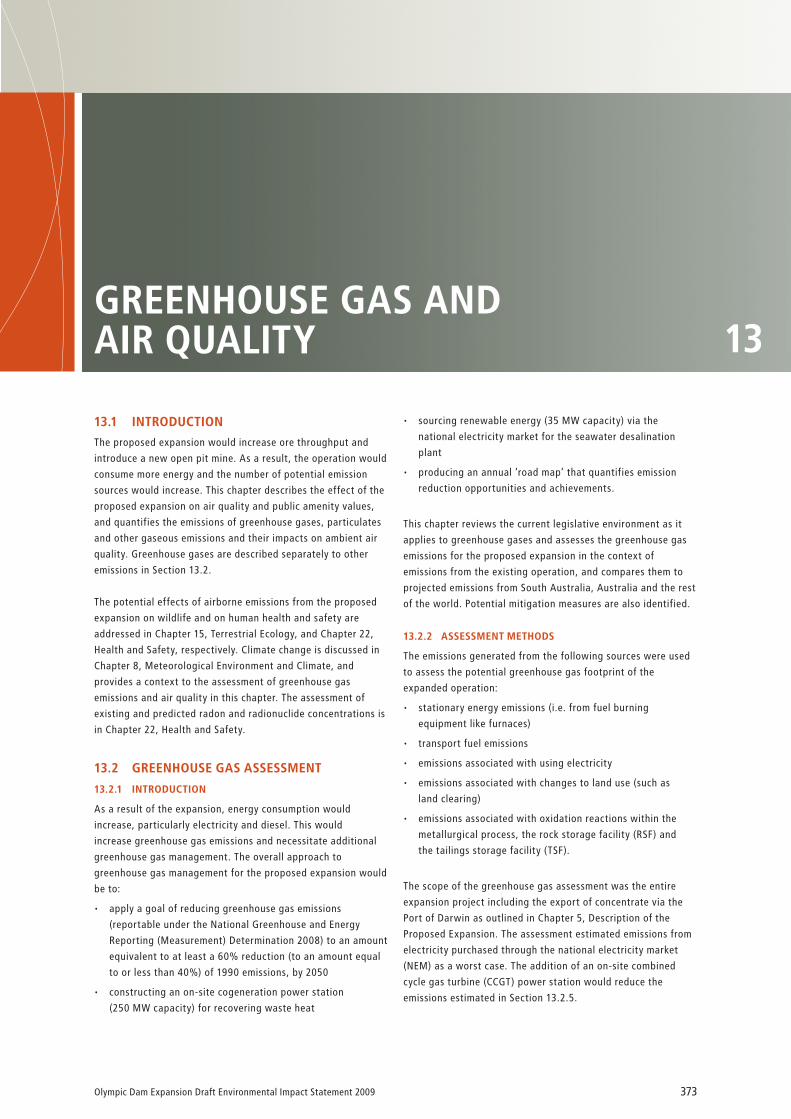
the atmosphere by natural processes. In order to compare the
relative effects of different gases over a particular time period,
Global Warming Potentials (GWP) are used, referenced in units
of carbon dioxide equivalents (CO2-e); carbon dioxide is used as
the base reference, and has a GWP of 1. There are six major
groups of greenhouse gases, which are listed in Table 13.1. The
table also shows the GWP for each of the gases, calculated over
a 100-year time scale. The table indicates, for example, that an
emission of 1 kg of methane has the same global warming
potential as an emission of 21 kg of carbon dioxide: if 1 kg of
carbon dioxide is emitted together with 1 kg of methane, the
total emission would be valued at 22 kg of CO2-e (see
Figure 13.1).
Source: UNFCCC Synthesis and Assessment Report on the Greenhouse Gas Inventories 2008
Carbon dioxide (CO2)72.5%
Methane (CH4)21.5%
Nitrous oxide(N2O)5%
Other1%
Figure 13.1 Contribution of various greenhouses gases toAustralia’s overall greenhouse gas emissions
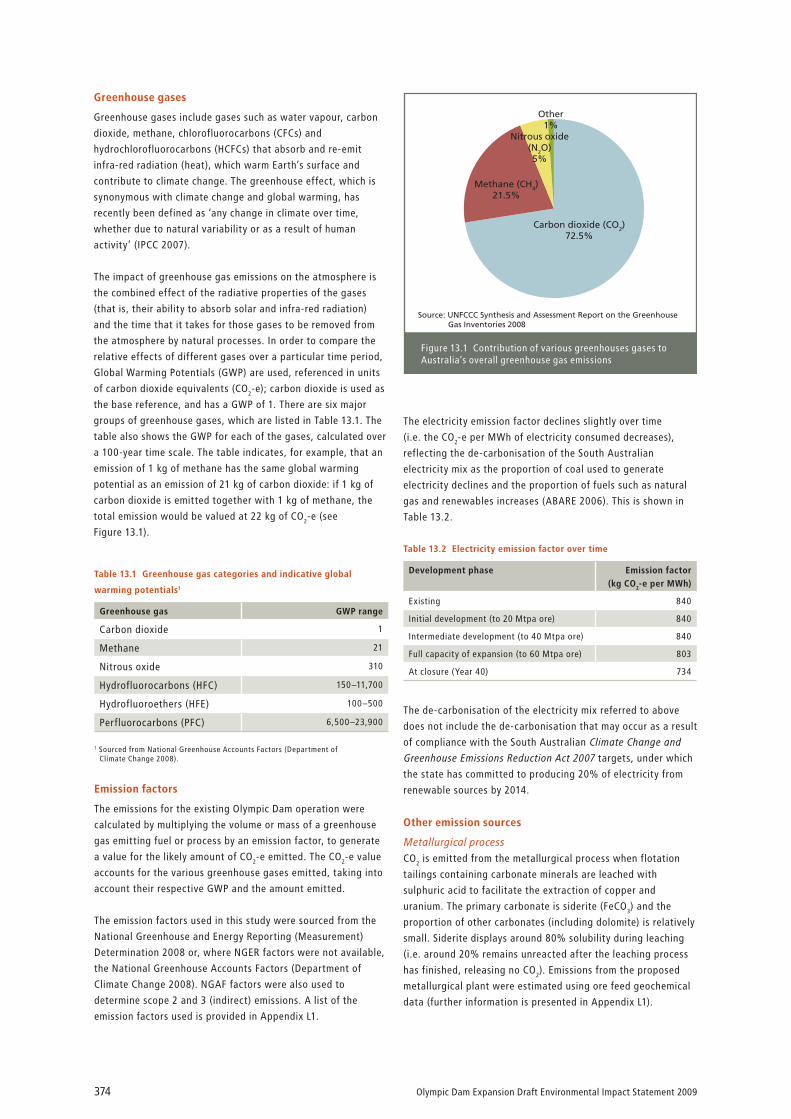
table 13.1 Greenhouse gas categories and indicative global
warming potentials1
Greenhouse gas GWP range
Carbon dioxide 1
Methane 21
Nitrous oxide 310
Hydrofluorocarbons (HFC) 150–11,700
Hydrofluoroethers (HFE) 100–500
Perfluorocarbons (PFC) 6,500–23,900
1 Sourced from National Greenhouse Accounts Factors (Department of Climate Change 2008).
table 13.2 electricity emission factor over time
development phase emission factor (kg co2-e per mWh)
Existing 840
Initial development (to 20 Mtpa ore) 840
Intermediate development (to 40 Mtpa ore) 840
Full capacity of expansion (to 60 Mtpa ore) 803
At closure (Year 40) 734
emission factors
The emissions for the existing Olympic Dam operation were
calculated by multiplying the volume or mass of a greenhouse
gas emitting fuel or process by an emission factor, to generate
a value for the likely amount of CO2-e emitted. The CO2-e value
accounts for the various greenhouse gases emitted, taking into
account their respective GWP and the amount emitted.
The emission factors used in this study were sourced from the
National Greenhouse and Energy Reporting (Measurement)
Determination 2008 or, where NGER factors were not available,
the National Greenhouse Accounts Factors (Department of
Climate Change 2008). NGAF factors were also used to
determine scope 2 and 3 (indirect) emissions. A list of the
emission factors used is provided in Appendix L1.
The electricity emission factor declines slightly over time
(i.e. the CO2-e per MWh of electricity consumed decreases),
reflecting the de-carbonisation of the South Australian
electricity mix as the proportion of coal used to generate
electricity declines and the proportion of fuels such as natural
gas and renewables increases (ABARE 2006). This is shown in
Table 13.2.
The de-carbonisation of the electricity mix referred to above
does not include the de-carbonisation that may occur as a result
of compliance with the South Australian Climate Change and
Greenhouse Emissions Reduction Act 2007 targets, under which
the state has committed to producing 20% of electricity from
renewable sources by 2014.
other emission sources
Metallurgical processCO2 is emitted from the metallurgical process when flotation
tailings containing carbonate minerals are leached with
sulphuric acid to facilitate the extraction of copper and
uranium. The primary carbonate is siderite (FeCO3) and the
proportion of other carbonates (including dolomite) is relatively
small. Siderite displays around 80% solubility during leaching
(i.e. around 20% remains unreacted after the leaching process
has finished, releasing no CO2). Emissions from the proposed
metallurgical plant were estimated using ore feed geochemical
data (further information is presented in Appendix L1).

Olympic Dam Expansion Draft Environmental Impact Statement 2009 375
13
Tailings storage facilityThe emission of CO2 from the tailings storage facility (TSF)
occurs as acidic seepage is neutralised by the underlying
limestone in the following series of reactions:
H+ + CaCO3 ∑ Ca2+ + HCO3-
The bicarbonate that forms reacts further as follows:
HCO3- + H+ ∑ H2CO3∑ H2O + CO2
For the purpose of this assessment, a seepage rate from the TSF
of 3,200 m3/d, at an acidity of 43 g CaCO3 eq/L, has been used
to estimate potential CO2 generation. This equates to about
22,230 tonnes of CO2 per cell per annum while the tailings are
actively deposited in the cell. Thereafter the rate of generation
would decrease as percolation decreases. See Appendix L1 for
further details.
Rock storage facilityIn a process similar to that occurring within the metallurgical
plant, acidic liquor generated within the rock storage facility
(RSF) (as a result of reactions between rainfall and reactive
mine rock) would react with carbonates in the mine rock, and
release CO2. The CO2 would permeate the RSF and be emitted to
atmosphere. The volume of CO2 emitted would depend on a
number of factors including the volume of rainfall entering the
RSF, the reaction kinetics that generate acid and subsequently
the potential of the acidic leachate to contact carbonate
materials. It would be many years before the RSF begins
emitting CO2 and the process would continue for at least one or
two hundred years after closure as the water within the pores
of the RSF percolates through the facility. Emission estimates
from the RSF were provided by ENSR Australia Pty Ltd (ENSR)
based on geochemical information from the RSF geochemical
studies (see Chapter 12, Groundwater, and Appendices K4 and
K5 for details).
Land use changeIn addition to the above-mentioned sources, land use change
associated with land clearing for infrastructure results in one-
off greenhouse gas emissions. Emissions from changes to land
use were estimated by applying the FullCam model from the
National Greenhouse Accounting Toolkit to the areas of land
that would be cleared over the life of the expanded operation,
as discussed in Chapter 15, Terrestrial Ecology. The assumptions
used in the model are outlined in greater detail in Appendix L1.
scope 1, 2 and 3 emissions
Emissions are reported in terms of scope, which defines how
and where the greenhouse gases are generated within an
organisation. Scope 1, 2 and 3 emissions are included in this
assessment, and are defined in Table 13.3 and detailed further
in Appendix L1.
The exact boundaries of scope 3 emissions are subjective.
However, for the purpose of this greenhouse gas assessment,
scope 3 is considered to include all transport-related emissions
generated within Australia, but does not include emissions
from the end use of products produced at Olympic Dam, or
overseas transport.
Greenhouse gas regulation and policy
The regulation of greenhouse gases and associated policy can
be broadly divided into five areas:
international•
national•
state•
the BHP Billiton Group•
BHP Billiton (i.e. the Olympic Dam operation).•
Each of these is summarised below and discussed in greater
detail in the Appendix L1.
InternationalThe major international agreement is the Kyoto Protocol, which
Australia ratified in 2007. The protocol caps Australian
greenhouse gas emissions to 108% of 1990 levels during the
first commitment period (2008–2012). Australia was one of only
three countries – the other two being Norway and Iceland –
granted an increase to its emission levels over its 1990 base
year. In contrast, other developed countries collectively agreed
to reduce their aggregate greenhouse gas emissions by at
least 5% from 1990 levels in the first commitment period
(2008–2012).
The ‘Bali Roadmap’ was an outcome of the 2007 United Nations
Framework Convention on Climate Change conference, and
outlines actions to be undertaken after the first commitment
period of the Kyoto Protocol ends. For developed countries, this
is likely to necessitate quantitative commitments to cap
greenhouse gas emissions.
table 13.3 Greenhouse gas emission scopes
scope description
1 Direct emissions from sources within the boundary of an organisation (e.g. fuel used on-site)
2 Indirect emissions from the consumption of purchased electricity
3 All other indirect emissions associated with the activities of an organisation
Olympic Dam Expansion Draft Environmental Impact Statement 2009376
NationalThe National Greenhouse Strategy was developed in 1998 as
Australia’s response to climate change, providing a strategic
framework without specifying state or project-specific targets.
The Australian Greenhouse Office (now the Department of
Climate Change) was established to coordinate Commonwealth
action on climate change matters.
Greenhouse Challenge was initiated as a voluntary program
between the Australian Government and industry to abate
greenhouse gas emissions and increase energy efficiency.
Greenhouse Challenge Plus builds on the Greenhouse Challenge
program, integrating other initiatives (such as Generator
Efficiency Standards and the Greenhouse Friendly program) into
a single industry program. The aim of the voluntary Greenhouse
Challenge Plus program is to:
reduce greenhouse gas emissions (including promotion of •
awareness of greenhouse gas abatement opportunities in
industry)
accelerate the uptake of energy efficiency opportunities•
integrate greenhouse issues into business decision making•
provide more consistent reporting of greenhouse gas •
emissions.
Mandatory reporting requirements for sizable emitters was
introduced in the National Greenhouse and Energy Reporting
Act 2007 (NGER Act) from July 2008. The NGER Act has been
designed to provide robust data as a foundation for an
Australian Emissions Trading Scheme, and to thereby facilitate
the reporting of abatement and offsets before an emissions
trading scheme commences. A timeline for introducing the
emissions trading scheme, released in March 2008, indicates a
national emissions trading scheme is likely to commence in 2010.
The NGER system will provide company-level information on
greenhouse and energy efficiency performance to the public
and create a single online entry point for reporting. Reporting
will be administered by the Australian Government Department
of Climate Change.
The Energy Efficiency Opportunities Act 2006 was developed to
improve the method of identifying and evaluating energy
efficiency opportunities. The Act requires organisations to
submit five-year plans that set out proposals for assessing their
energy usage and to identify efficiency projects.
South AustralianThe South Australian Government has developed a South
Australian greenhouse strategy for tackling climate change
based heavily on the Climate Change and Greenhouse
Emissions Reductions Act 2007.
The key objectives of the legislation are:
to reduce greenhouse emission levels by 60% (to 40% •
of 1990 levels) by 2050
to increase the proportion of renewable electricity •
generated so that it comprises at least 20% of electricity
generated in South Australia by 2014
to increase the proportion of renewable electricity consumed •
so that it comprises at least 20% of electricity consumed in
South Australia by 2014.
The legislation also aims to promote action within South
Australia by developing specific targets for various sectors of
the state’s economy, and developing policies and programs to
reduce greenhouse gas emissions.
BHP Billiton is currently negotiating a Sector Agreement with
the South Australian Government, specifically for the Olympic
Dam expansion. Sector Agreements are voluntary agreements
between the Minister for Sustainability and Climate Change and
a business or industry grouping. They may set out the objectives
and strategies for greenhouse emission abatement, as well as
covering intended research, development and innovation in
technologies or industry practices. The Agreement would be
entered into on a voluntary basis for the purposes of facilitating
strategies to meet targets set under the Climate Change and
Greenhouse Emissions Reductions Act 2007.
Northern TerritoryThe Northern Territory Strategy for Greenhouse Action 2006
(Northern Territory EPA 2006) was prepared in line with the
goals and principles of the NT Government’s Greenhouse Policy
Framework released in 2002. The strategy describes the
following objectives:
provide leadership to the community by demonstrating how •
the NT Government is addressing greenhouse gas emissions
generated by its own activities
minimise greenhouse gas emissions by managing savanna •
burning
minimise greenhouse gas emissions from agriculture and •
land use changes and encourage the enhancement of
carbon sinks
minimise greenhouse gas emissions by improving •
management of transport and urban land use
minimise greenhouse gas emissions from the supply and use •
of electricity
minimise greenhouse gas emissions from industry and waste•
support efforts to increase our understanding of likely •
climate change and the actions needed to adapt to the
changing climate.
The BHP Billiton GroupIn June 2007, the BHP Billiton Group released its Climate
Change Position. The position is a multifaceted approach to
tackling climate change. It aims to:
understand emissions from the full life cycle of the products •
the BHP Billiton Group produces
improve the management of energy and greenhouse gas •
emissions across the BHP Billiton Group businesses
Olympic Dam Expansion Draft Environmental Impact Statement 2009 377
13
commit US$300m over five years to support the •
development of low emissions technology, energy
excellence projects within the company and encourage
emissions abatement by employees and local communities
use technical capacity and experience of the BHP Billiton •
Group to assist governments and other stakeholders to
design effective and equitable climate change policies,
including market-based mechanisms such as emissions
trading.
Olympic Dam expansionThe Olympic Dam expansion is implementing the BHP Billiton-
wide position goals as part of its Greenhouse Gas and Energy
Management Plan. To date, a number of studies have been
conducted that review the potential greenhouse gas footprint
of the proposed expansion and analyse potential mitigation
measures. These are summarised in Sections 13.2.3 and 13.2.5
of this chapter.
As well as complying with BHP Billiton’s Climate Change
Position, BHP Billiton has set additional goals and targets
specific to the proposed expansion in order to minimise
potential impacts. These are to:
apply a goal of reducing greenhouse gas emissions •
(reportable under the National Greenhouse and Energy
Reporting (Measurement) Determination 2008) to an amount
equivalent to at least a 60% reduction (to an amount equal
to or less than 40%) of 1990 emissions, by 2050
constructing an on-site cogeneration power station •
(250 MW capacity) for recovering waste heat
sourcing renewable energy (35 MW capacity) via the national •
electricity market for the seawater desalination plant
producing an annual ‘road map’ that quantifies emission •
reduction opportunities and achievements.
The company would establish specific short-term targets to
reduce greenhouse gas emissions in its Environmental
Management Programs (EM Programs) at Olympic Dam in
accordance with the International Standard AS/NZS 14001:
2004 Environmental Management Systems guidelines. BHP
Billiton would also develop a detailed Greenhouse Gas and
Energy Management Plan for Olympic Dam that would:
establish modelling to project the likely emissions from •
the expanded Olympic Dam operation from commencement
to 2050
establish targets and timelines for greenhouse gas reduction •
identify greenhouse gas reduction strategies and projects.•
The Greenhouse Gas and Energy Management Plan would be
reviewed annually.
13.2.3 existinG environment
The most significant emissions from both the existing and
proposed Olympic Dam operation are carbon dioxide, related to
the indirect combustion of hydrocarbons to produce electricity,
and the direct combustion of hydrocarbons in vehicles and
furnaces. Minor emissions of methane and nitrous oxide are
generated as a result of some chemical processes and the
decomposition of putrescible wastes in the on-site waste
management facility.
Some HFCs and PFCs are currently used on-site, and this would
continue; HFCs are used for on-site refrigeration and PFCs (in
particular sulphur hexafluoride, SF6) are used in electrical
switchyards and transformers.
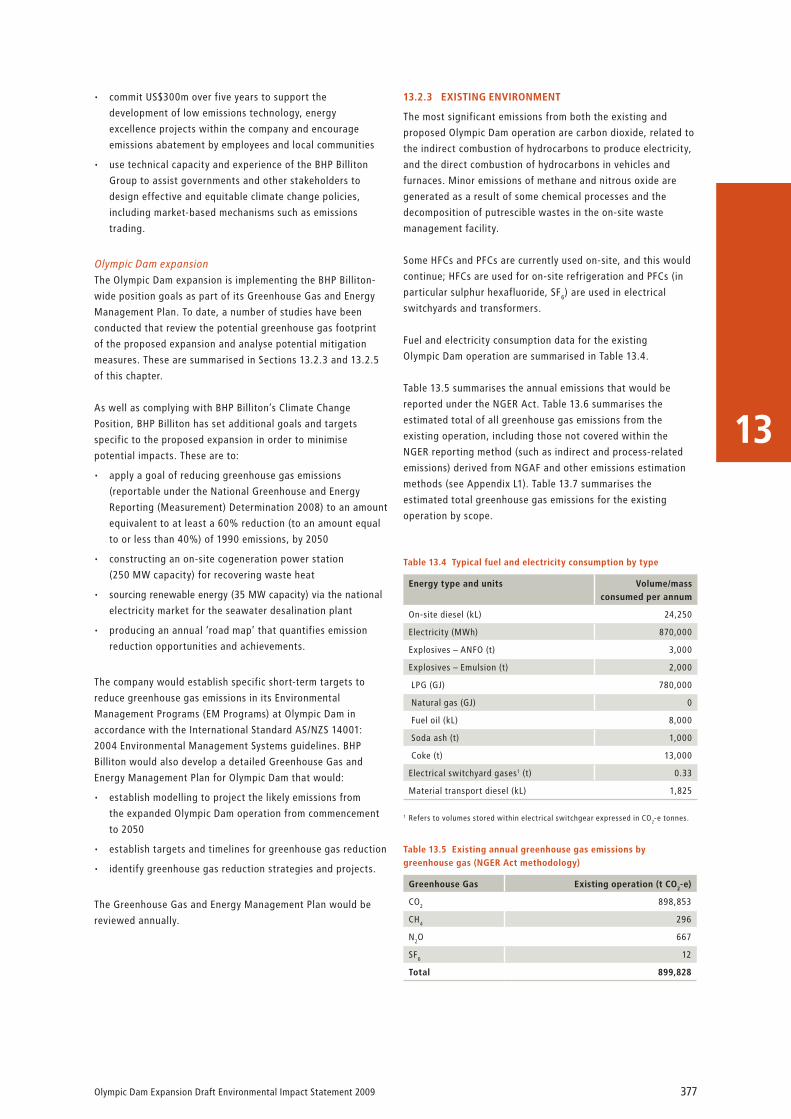
Fuel and electricity consumption data for the existing
Olympic Dam operation are summarised in Table 13.4.
Table 13.5 summarises the annual emissions that would be
reported under the NGER Act. Table 13.6 summarises the
estimated total of all greenhouse gas emissions from the
existing operation, including those not covered within the
NGER reporting method (such as indirect and process-related
emissions) derived from NGAF and other emissions estimation
methods (see Appendix L1). Table 13.7 summarises the
estimated total greenhouse gas emissions for the existing
operation by scope.
table 13.5 existing annual greenhouse gas emissions by greenhouse gas (nGer act methodology)
Greenhouse Gas existing operation (t co2-e)
CO2 898,853
CH4 296
N2O 667
SF6 12
total 899,828
table 13.4 typical fuel and electricity consumption by type
energy type and units volume/mass consumed per annum
On-site diesel (kL) 24,250
Electricity (MWh) 870,000
Explosives – ANFO (t) 3,000
Explosives – Emulsion (t) 2,000
LPG (GJ) 780,000
Natural gas (GJ) 0
Fuel oil (kL) 8,000
Soda ash (t) 1,000
Coke (t) 13,000
Electrical switchyard gases1 (t) 0.33
Material transport diesel (kL) 1,825
1 Refers to volumes stored within electrical switchgear expressed in CO2-e tonnes.
Olympic Dam Expansion Draft Environmental Impact Statement 2009378
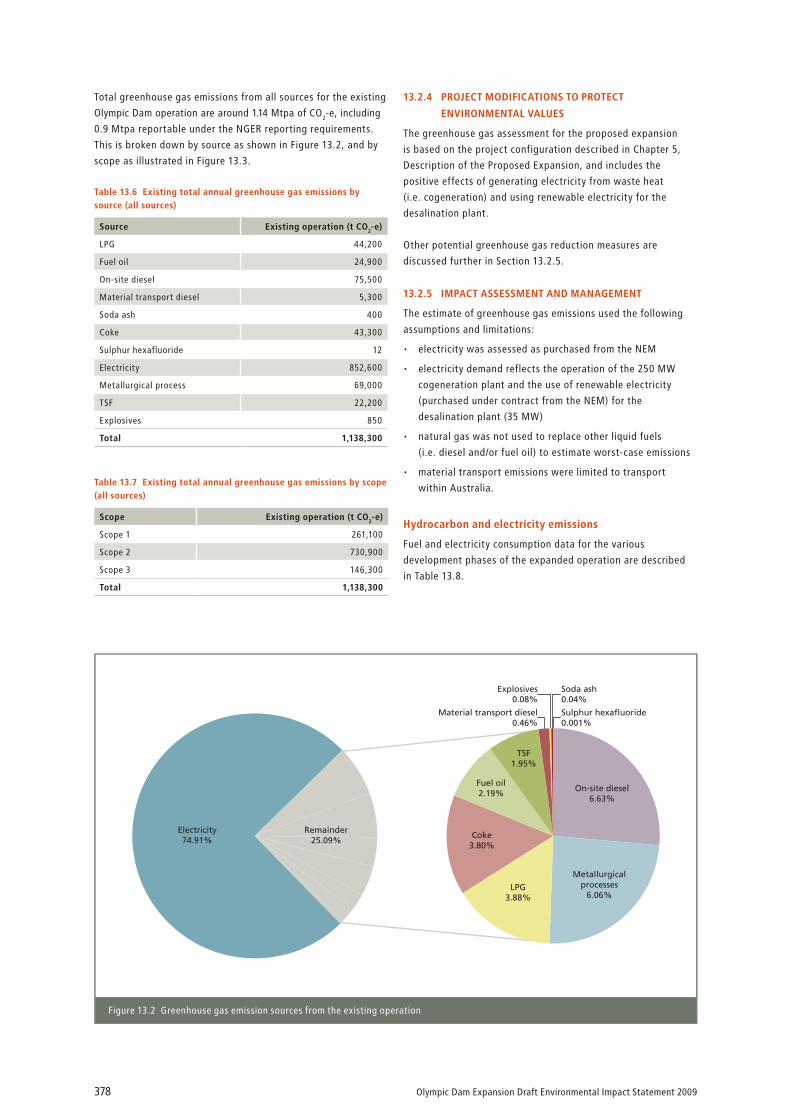
Total greenhouse gas emissions from all sources for the existing
Olympic Dam operation are around 1.14 Mtpa of CO2-e, including
0.9 Mtpa reportable under the NGER reporting requirements.
This is broken down by source as shown in Figure 13.2, and by
scope as illustrated in Figure 13.3.
table 13.7 existing total annual greenhouse gas emissions by scope (all sources)
scope existing operation (t co2-e)
Scope 1 261,100
Scope 2 730,900
Scope 3 146,300
total 1,138,300
table 13.6 existing total annual greenhouse gas emissions by source (all sources)
source existing operation (t co2-e)
LPG 44,200
Fuel oil 24,900
On-site diesel 75,500
Material transport diesel 5,300
Soda ash 400
Coke 43,300
Sulphur hexafluoride 12
Electricity 852,600
Metallurgical process 69,000
TSF 22,200
Explosives 850
total 1,138,300
On-site diesel6.63%
Metallurgicalprocesses
6.06%LPG
3.88%
Coke3.80%
Remainder25.09%
Electricity74.91%
Fuel oil2.19%
TSF1.95%
Material transport diesel0.46%
Explosives0.08%
Sulphur hexafluoride0.001%
Soda ash0.04%
Figure 13.2 Greenhouse gas emission sources from the existing operation
13.2.4 Project modifications to Protect
environmental values
The greenhouse gas assessment for the proposed expansion
is based on the project configuration described in Chapter 5,
Description of the Proposed Expansion, and includes the
positive effects of generating electricity from waste heat
(i.e. cogeneration) and using renewable electricity for the
desalination plant.
Other potential greenhouse gas reduction measures are
discussed further in Section 13.2.5.
13.2.5 imPact assessment and manaGement
The estimate of greenhouse gas emissions used the following
assumptions and limitations:
electricity was assessed as purchased from the NEM•
electricity demand reflects the operation of the 250 MW •
cogeneration plant and the use of renewable electricity
(purchased under contract from the NEM) for the
desalination plant (35 MW)
natural gas was not used to replace other liquid fuels •
(i.e. diesel and/or fuel oil) to estimate worst-case emissions
material transport emissions were limited to transport •
within Australia.
hydrocarbon and electricity emissions
Fuel and electricity consumption data for the various
development phases of the expanded operation are described
in Table 13.8.

Olympic Dam Expansion Draft Environmental Impact Statement 2009 379
13
table 13.8 fuel and electricity consumption for the proposed expansion
energy type and units volume/mass consumed
initial development to 20 mtpa
intermediate development
to 40 mtpa
full operating capacity
of 60 mtpa
at closure (year 40)
On-site diesel (kL) 330,000 367,000 454,000 454,000
Electricity (MWh) 1,465,000 2,050,000 2,573,000 2,573,000
Explosives – ANFO (t) 110,000 110,000 110,000 110,000
Explosives – Emulsion (t) 4,500 4,500 4,500 4,500
LPG (GJ) 0 816,000 816,000 816,000
Natural gas (GJ) 0 0 0 0
Fuel oil (kL) 0 14,000 14,000 14,000
Soda ash (t) 0 6,700 6,700 6,700
Coke (t) 0 18,300 18,300 18,300
Electrical switchgear gases1 4,800 9,700 14,500 14,500
Material transport diesel (kL) 16,000 27,000 36,500 36,500
1 Refers to volumes stored within electrical switchgear expressed in CO2-e tonnes.
Scope 123%
Scope 264%
Scope 313%
Figure 13.3 Greenhouse gas emissions from the existingoperation by scope
The amounts shown in Table 13.8 are converted into gigajoules
(GJ) (where necessary) through the use of energy content
factors and subsequently converted to CO2-e emissions through
the use of emissions factors, as detailed in Appendix L1.
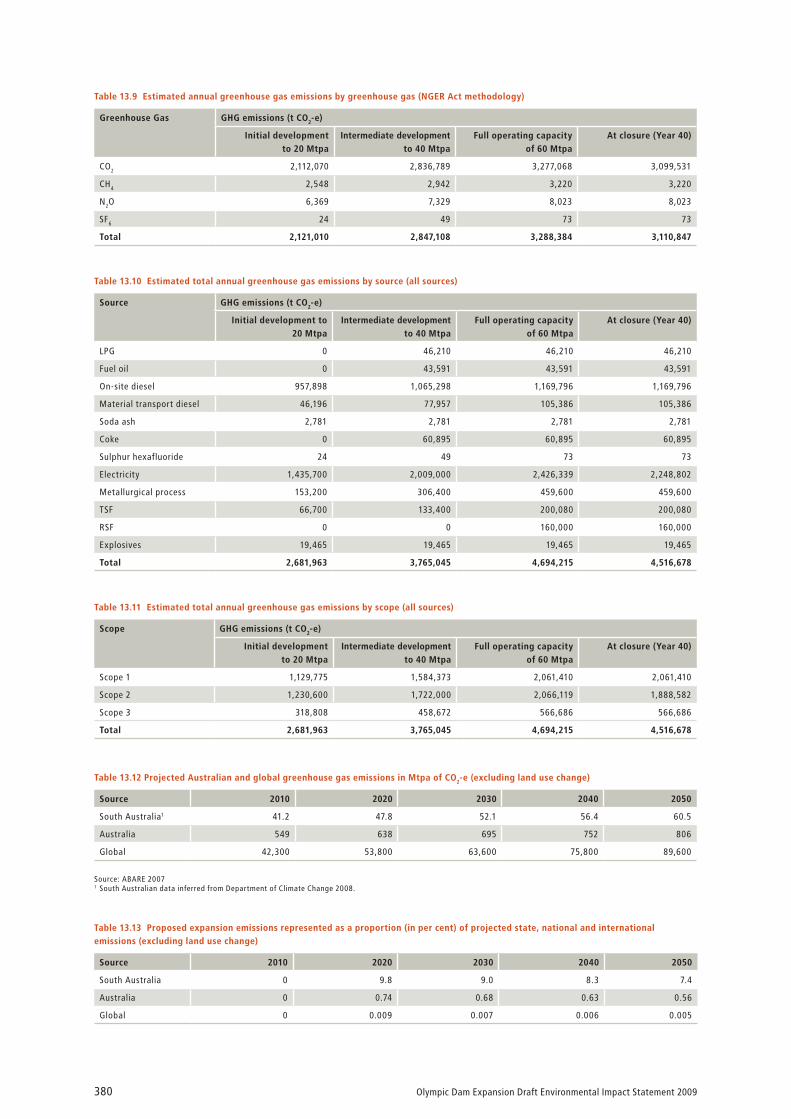
estimation of emissions
Annual emissionsTable 13.9 summarises the expected annual emissions that
would be reported under the NGER Act. Table 13.10 summarises
the estimated total of all greenhouse gas emissions for the
proposed expansion, including those not covered within the
NGER reporting method (such as indirect and process-related
emissions) derived from NGAF and other emissions estimation
methods (see Appendix L1). Table 13.11 summarises the
estimated total greenhouse gas emissions for the proposed
expansion by scope.
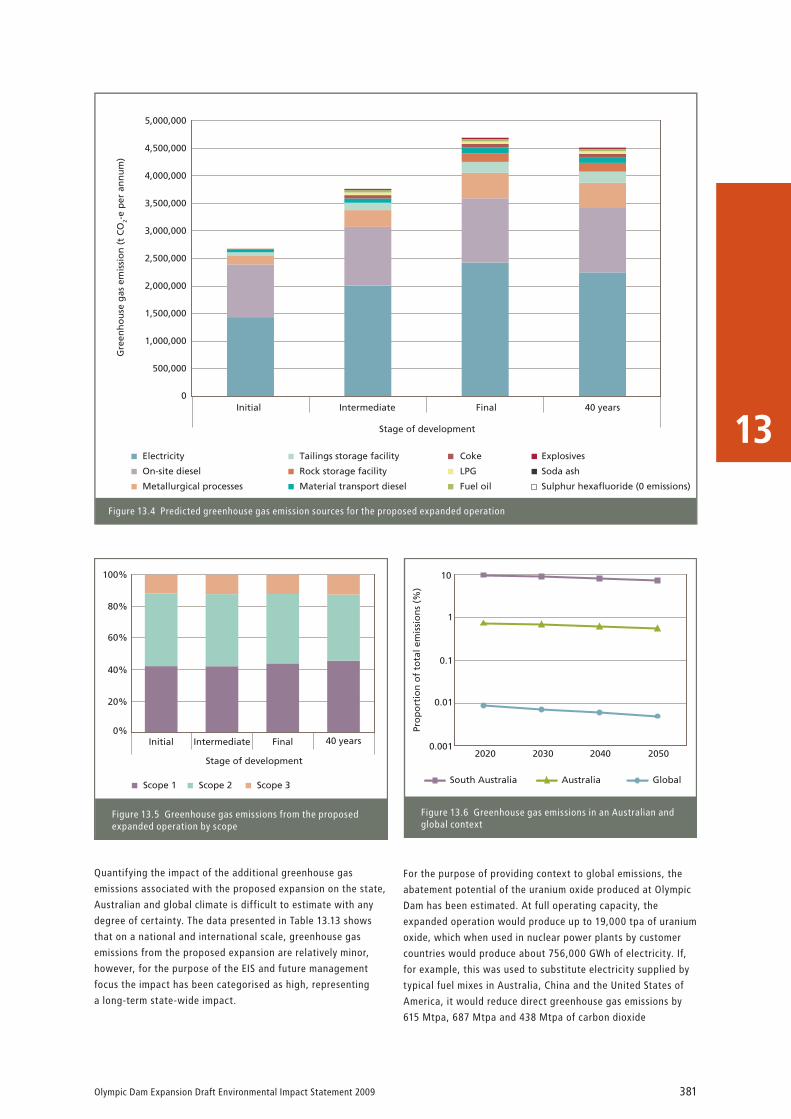
The breakdown of emission source varies with each phase of
development. Scope 1 emissions (largely on-site diesel
consumption and on-site process-related CO2 emissions) and
Scope 2 emissions (being off-site electricity production) both
account for approximately 42–46% of all greenhouse gas
emissions for the proposed expansion (i.e. total of 84–92%).
Scope 3 emissions provide the balance (see Figures 13.4 and 13.5).
The proposed expansion would result in an increase in the
proportion of Scope 1 emissions compared with the existing
operation because of the significant increase in diesel (required
by the new open pit mining fleet) and the positive influence of
using cogenerated electricity. The proportion of Scope 3
emissions would also increase as a result of the increased
transport volumes and distances associated with transporting
concentrate to the Port of Darwin for export.
Land use changeIn addition to the above-mentioned sources, land use change
associated with land clearing for infrastructure associated with
the expansion would result in one-off greenhouse gas emissions
totalling approximately 1 Mt of CO2-e over the life of the
expansion (see Appendix L1 for details).
expanded operation greenhouse gas emissions in context
Over the next five decades, Australian and global greenhouse
gas emissions are predicted to rise from the current levels of
506 Mtpa and 36,200 Mtpa, respectively. No specific emission
projections for South Australia exist, however assuming the
proportion of South Australia’s greenhouse gas emissions
(relative to Australia) remain constant (at around 7.5%), South
Australian greenhouse gas emissions can be inferred, as shown
in Table 13.12.
The peak greenhouse gas emissions from the proposed
expansion (4.7 Mtpa of CO2-e) were compared against the
projected future state, national and international emissions.
The additional greenhouse gas emissions associated with the
proposed expansion would constitute a relatively small
proportion of overall emissions as shown in Table 13.13 and
shown in Figure 13.6.
Olympic Dam Expansion Draft Environmental Impact Statement 2009380
table 13.10 estimated total annual greenhouse gas emissions by source (all sources)
source GhG emissions (t co2-e)
initial development to 20 mtpa
intermediate development to 40 mtpa
full operating capacity of 60 mtpa
at closure (year 40)
LPG 0 46,210 46,210 46,210
Fuel oil 0 43,591 43,591 43,591
On-site diesel 957,898 1,065,298 1,169,796 1,169,796
Material transport diesel 46,196 77,957 105,386 105,386
Soda ash 2,781 2,781 2,781 2,781
Coke 0 60,895 60,895 60,895
Sulphur hexafluoride 24 49 73 73
Electricity 1,435,700 2,009,000 2,426,339 2,248,802
Metallurgical process 153,200 306,400 459,600 459,600
TSF 66,700 133,400 200,080 200,080
RSF 0 0 160,000 160,000
Explosives 19,465 19,465 19,465 19,465
total 2,681,963 3,765,045 4,694,215 4,516,678
table 13.11 estimated total annual greenhouse gas emissions by scope (all sources)
scope GhG emissions (t co2-e)
initial development to 20 mtpa
intermediate development to 40 mtpa
full operating capacity of 60 mtpa
at closure (year 40)
Scope 1 1,129,775 1,584,373 2,061,410 2,061,410
Scope 2 1,230,600 1,722,000 2,066,119 1,888,582
Scope 3 318,808 458,672 566,686 566,686
total 2,681,963 3,765,045 4,694,215 4,516,678
table 13.12 Projected australian and global greenhouse gas emissions in mtpa of co2-e (excluding land use change)
source 2010 2020 2030 2040 2050
South Australia1 41.2 47.8 52.1 56.4 60.5
Australia 549 638 695 752 806
Global 42,300 53,800 63,600 75,800 89,600
Source: ABARE 20071 South Australian data inferred from Department of Climate Change 2008.
table 13.9 estimated annual greenhouse gas emissions by greenhouse gas (nGer act methodology)
Greenhouse Gas GhG emissions (t co2-e)
initial development to 20 mtpa
intermediate development to 40 mtpa
full operating capacity of 60 mtpa
at closure (year 40)
CO2 2,112,070 2,836,789 3,277,068 3,099,531
CH4 2,548 2,942 3,220 3,220
N2O 6,369 7,329 8,023 8,023
SF6 24 49 73 73
total 2,121,010 2,847,108 3,288,384 3,110,847
table 13.13 Proposed expansion emissions represented as a proportion (in per cent) of projected state, national and international emissions (excluding land use change)
source 2010 2020 2030 2040 2050
South Australia 0 9.8 9.0 8.3 7.4
Australia 0 0.74 0.68 0.63 0.56
Global 0 0.009 0.007 0.006 0.005
Olympic Dam Expansion Draft Environmental Impact Statement 2009 381
13
Scope 1 Scope 2 Scope 3
Initial Intermediate
Stage of development
0%
20%
40%
60%
80%
100%
Final 40 years
Figure 13.5 Greenhouse gas emissions from the proposedexpanded operation by scope
Explosives
Soda ash
Sulphur hexafluoride (0 emissions)
Coke
LPG
Fuel oil
Tailings storage facility
Rock storage facility
Material transport diesel
Electricity
On-site diesel
Metallurgical processes
Initial Intermediate Final 40 years
Stage of development
Gre
enh
ou
se g
as e
mis
sio
n (
t C
O2-
e p
er a
nn
um
)
0
500,000
1,000,000
1,500,000
2,000,000
2,500,000
3,000,000
3,500,000
4,000,000
4,500,000
5,000,000
Figure 13.4 Predicted greenhouse gas emission sources for the proposed expanded operation
Pro
po
rtio
n o
f to
tal e
mis
sio
ns
(%)
South Australia Australia Global
2050204020302020
10
1
0.1
0.01
0.001
Figure 13.6 Greenhouse gas emissions in an Australian andglobal context
Frutiger LT Std
Quantifying the impact of the additional greenhouse gas
emissions associated with the proposed expansion on the state,
Australian and global climate is difficult to estimate with any
degree of certainty. The data presented in Table 13.13 shows
that on a national and international scale, greenhouse gas
emissions from the proposed expansion are relatively minor,
however, for the purpose of the EIS and future management
focus the impact has been categorised as high, representing
a long-term state-wide impact.
For the purpose of providing context to global emissions, the
abatement potential of the uranium oxide produced at Olympic
Dam has been estimated. At full operating capacity, the
expanded operation would produce up to 19,000 tpa of uranium
oxide, which when used in nuclear power plants by customer
countries would produce about 756,000 GWh of electricity. If,
for example, this was used to substitute electricity supplied by
typical fuel mixes in Australia, China and the United States of
America, it would reduce direct greenhouse gas emissions by
615 Mtpa, 687 Mtpa and 438 Mtpa of carbon dioxide

Olympic Dam Expansion Draft Environmental Impact Statement 2009382
equivalents, respectively. This compares to Australia’s current
greenhouse gas emissions of 506 Mtpa of carbon dioxide
equivalents (excluding land use change).
The greenhouse gas intensity (emissions of CO2-e per tonne of
ore milled) of Olympic Dam has decreased over the life of the
current operation, reflecting increased efficiencies associated
with previous optimisation and expansion projects. The proposed
expansion would result in an initial increase in the greenhouse
gas intensity to around 119 kg of CO2-e per tonne of ore milled,
from the current level of 105 kg of CO2-e per tonne of ore
milled, as a result of the ramp-up in mining and the energy
usage associated with the movement of mine rock during the
initial development phase. This would decrease as the
development progresses, with greenhouse gas intensity
reducing to around 79 kg of CO2-e per tonne of ore milled (see
Figure 13.7) as the ore extraction rate increases and the mine
rock extraction rate decreases.
Greenhouse gas mitigation and management
As discussed in Section 13.2.2, the expanded operation has
committed to a goal of reducing emissions significantly by the
Year 2050. BHP Billiton has used modelling based on McKinsey
& Company’s Australian carbon reduction methodology
(McKinsey & Company 2008) to understand the path to achieve
this goal. This involves evaluating the cost and carbon-
reduction potential of specific projects using a three-step
process:
a project baseline was established•
a range of emission-reduction opportunities was identified •
through project workshops and fact-based estimates were
made of the costs and potential abatement volume
presented by each opportunity. A range of assumptions was
made, including power capacity forecasts, expected learning
curves, and initial generation costs
these costs and volumes were combined to form the Olympic •
Dam expansion carbon reduction cost curves.
The carbon reduction cost curves from this process indicate
that significant greenhouse gas reduction is possible. Appendix
L1 details this process further, and includes figures for an
indicative pathway from project inception to the year 2050.
Potential greenhouse gas reduction projects are divided into
those that reduce energy demand, and those that provide a
cleaner energy supply. Demand-side projects used in the
modelling for the expanded Olympic Dam operation were:
using waste engine oil in mine blasting•
in-pit ore crushing and conveying to the surface•
conveying mine rock to the surface•
trolley assist haulage•
alternative power/fuel supply for haul trucks (LNG)•
hybrid light vehicles•
more efficient crushing/grinding•
reducing water usage through increased recycling of TSF •
liquor
low intensity leaching•
energy efficient design for town, construction camp and •
administration buildings.
Sources:Previous Olympic Dam GHG emissions and intensity from WMC Greenhouse Challenge Agreement Annual Report August 2000 and from site data obtained from theEnvironment and Radiation Department
0
20
40
60
80
100
120
140
160
1994
–199
5
1995
–199
6
1996
–199
7
1997
–199
8
1998
2002
2003
2004
2005
2006
2007
2016
2019
2021
2050
Previous Olympic Dam expansionmilling around 2.5 to 3.5 Mtpa
Previous Olympic Dam expansionmilling around 8.5 to 10 Mtpa
Proposedexpanded operation
Init
ial
(~32
Mtp
a)
Inte
rmed
iate
(~52
Mtp
a)
Fina
l(~
72 M
tpa)
At
40 y
ears
(~72
Mtp
a)
Gre
enho
use
gas
inte
nsit
y(k
g CO
2-e
per
tonn
e of
ore
mill
ed)
Figure 13.7 Greenhouse gas intensity of the existing and proposed expanded operation
Olympic Dam Expansion Draft Environmental Impact Statement 2009 383
13
Supply-side projects identified during the modelling were:
on-site CCGT•
off-site CCGT•
on-shore wind power•
geothermal power•
concentrated solar thermal power (with waste heat •
recovery plant)
concentrated solar thermal power (stand-alone)•
solar photovoltaic•
biodiesel•
coal carbon capture and storage (CCS)•
biomass power.•
The current status of investigations into the technologies is
provided in Appendix L1.
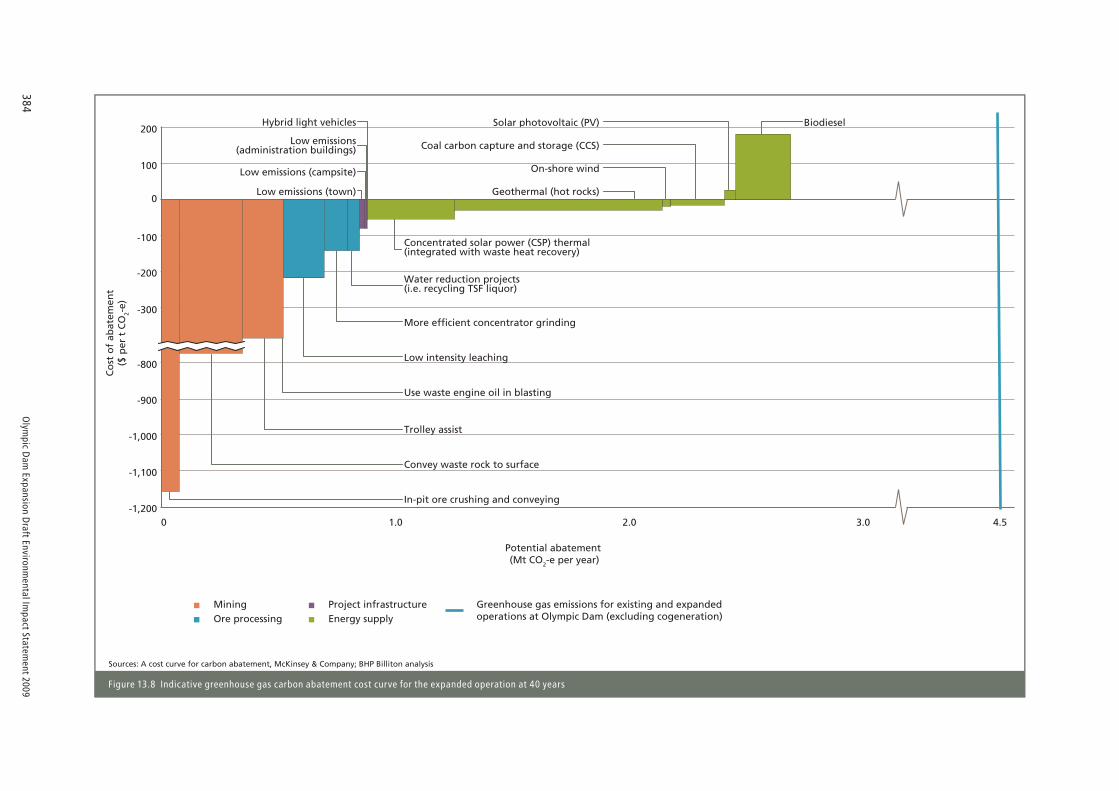
The carbon abatement curve for the projects listed above is
presented in Figure 13.8. It shows the likely cost of mitigation
(on the vertical scale) and the potential greenhouse gas
reduction (on the horizontal scale) for the year 2050. As
discussed in Section 13.2.2, a Greenhouse Gas and Energy
Management Plan for the expanded operation would set interim
goals and targets for emission reductions based on identified
emissions reduction projects that may or may not include the
above-mentioned projects. These have only been provided as
examples of how the stated goal may be achieved and would be
subject to annual updates as the costs of mitigation
technologies, and carbon permits and offsets, change over time.
The implementation of demand and supply-side greenhouse gas
mitigation measures alone would not necessarily achieve the
2050 goal described previously. Fixed greenhouse gas
emissions, such as those from land use change, the
metallurgical plant and the RSF and TSF, may require additional
mitigation projects, offsets or permits. Options for offsetting
these emissions would be investigated during the detailed
design phase, but would include either Australian or
internationally-purchased offsets, or a combination of both.
13.3 air quality imPact assessment
13.3.1 introduction
The metallurgical plant of the existing Olympic Dam operation
is the primary source of airborne emissions in the Olympic Dam
region. Minor sources of emissions from the existing operation
and the nearby township of Roxby Downs include heavy
vehicles, passenger vehicles, air-conditioners, gas heaters and
light industry. The current underground mining operation
generates minimal dust although some dust is emitted from
associated activities including the extraction of limestone from
the on-site quarry.
There are extensive gas treatment facilities in the existing
metallurgical plant that ensure that the substances emitted
from the plant are below applicable compliance limits. On
occasions, such as interruptions to power supply, substances
are emitted via bypass stacks at elevated concentrations and
these events are reported to the Environment Protection
Authority (EPA) in South Australia.
Emissions from the existing operation are monitored to record the
occurrence of bypass events, the effectiveness of controls and
compliance with applicable limits. They are audited and annually
reported publicly. The gas treatment systems are also maintained
and monitored regularly, and these processes are used to identify
opportunities for improving treatment efficiencies.
The remaining sections of this chapter provide an overview of
the current airborne emissions associated with the Olympic Dam
operation and discuss the additional airborne emission sources
introduced by the proposed expansion, including the new open
pit mine, the storage of mine rock, the expansion of the
existing metallurgical plant and the construction and operation
of a natural gas-fired power station. The construction and
operation of off-site infrastructure may also result in additional
air quality impacts.
The remaining sections of this chapter also explain how the
additional project components affect the existing air quality,
and provides comparisons between the predicted concentration
levels and applicable limits. Where necessary, design
modifications and management measures are identified that
would reduce predicted levels to within applicable limits.
13.3.2 assessment methods
Several specialist air quality consultants conducted components
of the detailed assessment for the Draft EIS. These were Holmes
Air Sciences (peer review of the modelling process), Pacific Air
and Environment (computational fluid dynamics (CFD) modelling
of the open pit) and ENSR (Calpuff modelling and emissions
inventory review). The assessments, which are detailed in
Appendix L2, entailed:
identifying sources of airborne emissions for the existing •
and expanded operation and modelling the point source and
ground level concentrations for the combined existing
and proposed expansion (i.e. the expanded operation)
identifying sensitive receivers•
establishing existing ambient air quality at these receivers•
comparing the predicted emission levels with applicable •
limits and, if required, modifying the design and developing
management measures to reduce the predicted levels to
below the applicable limits.
Potential off-site infrastructure emissions were not modelled;
instead specific analysis of the likely emissions from the
infrastructure elements was considered relative to the nearby
receivers and available mitigation measures. These are
discussed further in the off-site infrastructure component of
Section 13.3.5.
Olym
pic Dam
Expansion Draft Environm
ental Impact Statem
ent 2009384
Sources: A cost curve for carbon abatement, McKinsey & Company; BHP Billiton analysis
Greenhouse gas emissions for existing and expandedoperations at Olympic Dam (excluding cogeneration)
MiningOre processing
Project infrastructureEnergy supply
Potential abatement (Mt CO2-e per year)
Solar photovoltaic (PV)C
ost
of
abat
emen
t($
per
t C
O2-
e)
0
100
200
-100
-1,000
-1,100
-1,200
-200
-300
-800
-900
0 3.0 4.52.01.0
Convey waste rock to surface
More efficient concentrator grinding
In-pit ore crushing and conveying
Trolley assist
Low intensity leaching
Use waste engine oil in blasting
Geothermal (hot rocks)
Biodiesel
Low emissions (campsite)
Coal carbon capture and storage (CCS)
On-shore wind
Low emissions (town)
Hybrid light vehicles
Water reduction projects(i.e. recycling TSF liquor)
Concentrated solar power (CSP) thermal(integrated with waste heat recovery)
Low emissions(administration buildings)
Figure 13.8 Indicative greenhouse gas carbon abatement cost curve for the expanded operation at 40 years

Olympic Dam Expansion Draft Environmental Impact Statement 2009 385
13
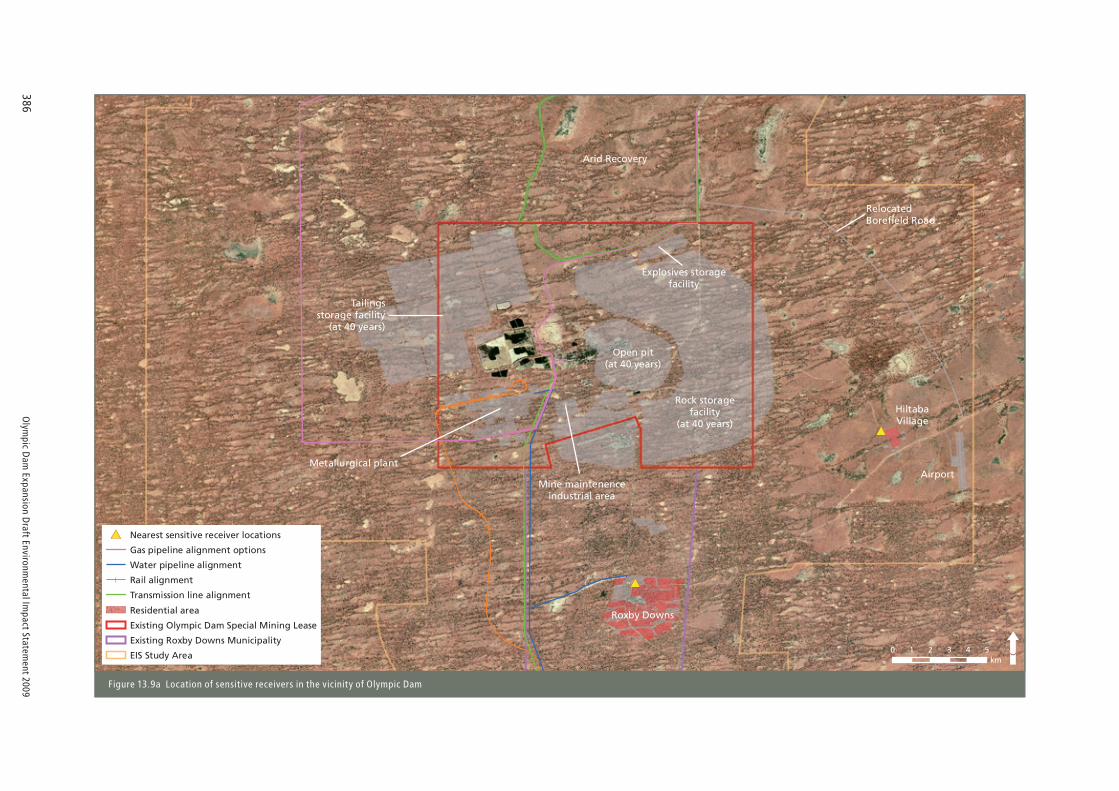
sensitive receivers
Sensitive receivers are those members of the population most
likely to be affected by the proposed expansion. In terms of air
quality, these are the communities closest to the expansion
infrastructure construction and operations (see Figures 13.9a
to 13.9d).
The population centres nearest to the expansion – Roxby Downs
(about 14 km from the current operation) and the proposed
Hiltaba Village (about 16 km from the existing operation) –
were identified as sensitive receivers. These receivers would
be about five and six kilometres respectively from the nearest
airborne emission source of the proposed expansion, namely
the southern and south-eastern boundary of the RSF.
Olympic Dam Village would continue to provide heavy industrial
support to the operation until such time as the new heavy
industrial area was established, about 3 km south from the
existing area. The workforce currently accommodated at
Olympic Village would be relocated to Hiltaba Village and/or
accommodation at Roxby Village during the pre-mine phase,
and the pre-mining operation would be managed to comply
with the air quality criteria at Olympic Village while the
workforce remains in that location.
The township of Andamooka is some 30 km from the existing
operation and would be about 20–25 km from the nearest
proposed airborne emission source. This was found to be at a
distance beyond which the predicted impacts from the
proposed expansion were so low as to be considered negligible,
with an annual average PM10 particulate concentration of less
than 2 µg/m3.
As noted in the introduction to this chapter, the potential
impacts from airborne emissions on ecologically sensitive
receivers (e.g. plants and animals) are discussed in Chapter 15,
Terrestrial Ecology. The potential impact of air quality on
human receivers is discussed further in Chapter 22, Health
and Safety.
Roxby Downs Roxby Downs is located approximately 12 km south of the
centre of the new open pit mining operation and about 5 km
from the south-east edge of the proposed RSF. The nearest
sensitive receiver, representing the worst-case scenario for
ground level concentrations, is at the northern edge of Roxby
Downs (Plate 13.1).
Hiltaba Village Hiltaba Village would be located approximately 17 km north-
east of Roxby Downs, along Andamooka Road. The site would
be about 12 km from the centre of the open pit operation and
about 5 km from the south-east edge of the proposed RSF. The
nearest sensitive receiver, again representing the worst-case
scenario for ground level concentrations, is at the north-
western edge of Hiltaba Village.
modelling of predicted levels
An air quality model was developed to predict ground level
concentrations of pollutants from the expanded mining and
processing activities.
Air quality modelGround level concentrations of emissions for the proposed
expansion were predicted using the Calpuff computer
dispersion model. Other plume dispersion models have
limitations associated with reaching steady-state dispersion
conditions instantaneously, which leads to a potentially
significant overestimation of pollutant concentrations at distant
receivers under low wind-speed conditions. This is a particularly
important constraint given the scale of the proposed expansion.
Calpuff overcomes this constraint by representing each emission
as a puff, which is effectively carried by the wind. The model’s
CALMET meteorology and topography pre-processing software
is also more accurate when modelling complex terrains, such as
those that may exist around the RSF and the open pit mining
operation.
South Australia’s EPA has approved Calpuff as a regulatory air
quality model for the existing Olympic Dam operation.
Emission factors derived from the National Pollutant Inventory
(NPI 1999, 2001, 2005) and the United States Environmental
Protection Agency’s Compilation of Air Pollutant Emission
Factors, AP42 (US EPA AP42), were used with site geological
data to estimate emissions from the proposed mining and
processing operations.
The air quality model used several inputs, which are described
in the following sections.
TopographyLocal topographic data was used in the air quality model,
although its effect is likely to be minimal given the relatively
flat terrain of the Olympic Dam region. The maximum vertical
relief is 40 m over the region modelled (i.e. 400 km2).
Plate 13.1 Roxby Downs viewed from the existing operation
Olym
pic Dam
Expansion Draft Environm
ental Impact Statem
ent 2009386
Tailingsstorage facility
(at 40 years)
Rock storagefacility
(at 40 years)
Open pit(at 40 years)
HiltabaVillage
Airport
Arid Recovery
RelocatedBorefield Road
Mine maintenenceindustrial area
Roxby Downs
Metallurgical plant
Nearest sensitive receiver locations
Gas pipeline alignment options
Water pipeline alignment
Rail alignment
Transmission line alignment
Residential area
Existing Olympic Dam Special Mining Lease
Existing Roxby Downs Municipality
EIS Study Area0 1 2 3 4 5
km
Explosives storagefacility
Figure 13.9a Location of sensitive receivers in the vicinity of Olympic Dam

Olympic Dam Expansion Draft Environmental Impact Statement 2009 387
13
SpencerGulf
Pimba
Whyalla
Andamooka
Roxby Downs
Port Augusta
Woomera
PointLowly
OLYMPICDAM
LakeDutton
LakeTorrens
IslandLagoon
LakeWindabout
PernattyLagoon
0 10 20 30 40 50km
Nearest sensitive receiver locations
Landing facility
Desalination plant
Preferred intake pipe alignment
Preferred outfall pipe alignment
Gas pipeline alignment options
Water pipeline alignment
Adjacent Olympic Dam - SA Governmentwater pipeline alignments
Rail alignment
Transmission line alignments
Access corridor
Residential area
Existing Olympic Dam Special Mining Lease
Existing Roxby Downs Municipality
EIS Study Area
Moomba
Whyalla
Adelaide
Port rie
Roxby Downs
Port A ta
Desalination plantinvestigation area
Santosfacilities
PumpStation
See inset 1
See inset 4
Pre-assemblyyard
Pimba intermodal facility
Inset 3Landing facility
Inset 4Point Lowly
0 0.5 1km
Inset 2Pimba
0 1 2km
Inset 1Woomera
0 1 2km
See inset 2
See inset 3
0 1 2km
ugus
Pi
Figure 13.9b Location of sensitive receivers in the southern corridor

Olym
pic Dam
Expansion Draft Environm
ental Impact Statem
ent 2009388
Frances Bay
FannieBay
Darwin Harbour
East Arm Port
Darwin Airport
DARWIN
Middle ArmPort
EastArm
Perth
Hobart
Sydney
Darwin
Adelaide
Brisbane
Melbourne
Alice Springs
Roxby Downs
Moomba
PimbaTarcoola
Tennant Creek
Katherine
Map extent
0 0.5 1 1.5 2 2.5km
Rail loop
Concentrate transferand storage shed
Enclosedconveyor
Rail spur
See inset
Inset
Residential area
Figure 13.9c Location of sensitive receivers for the Port of Darwin, East Arm
Olympic Dam Expansion Draft Environmental Impact Statement 2009 389
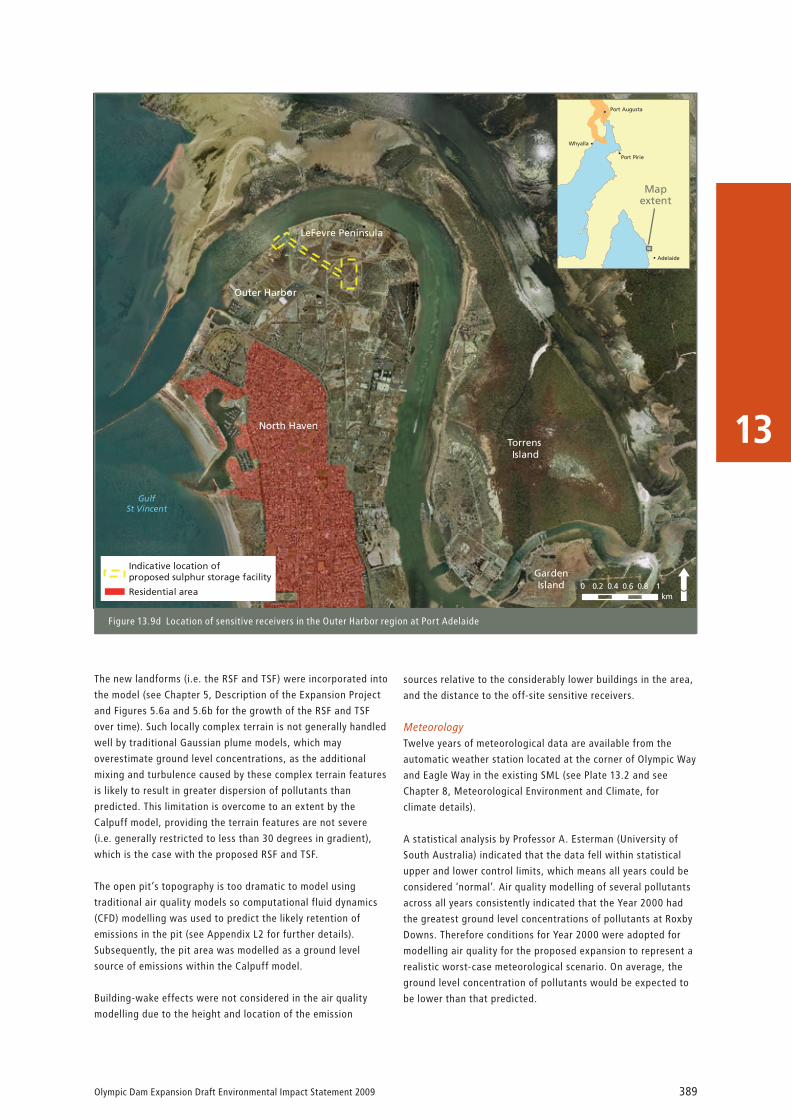
13Gulf
St Vincent
North Haven
Torrens Island
Outer Harbor
LeFevre Peninsula
GardenIsland
Indicative location ofproposed sulphur storage facility
Residential area0 0.2 0.4 0.6 0.8 1
km
Whyalla
Adelaide
Port Pirie
Port Augusta
Mapextent
Figure 13.9d Location of sensitive receivers in the Outer Harbor region at Port Adelaide
The new landforms (i.e. the RSF and TSF) were incorporated into
the model (see Chapter 5, Description of the Expansion Project
and Figures 5.6a and 5.6b for the growth of the RSF and TSF
over time). Such locally complex terrain is not generally handled
well by traditional Gaussian plume models, which may
overestimate ground level concentrations, as the additional
mixing and turbulence caused by these complex terrain features
is likely to result in greater dispersion of pollutants than
predicted. This limitation is overcome to an extent by the
Calpuff model, providing the terrain features are not severe
(i.e. generally restricted to less than 30 degrees in gradient),
which is the case with the proposed RSF and TSF.
The open pit’s topography is too dramatic to model using
traditional air quality models so computational fluid dynamics
(CFD) modelling was used to predict the likely retention of
emissions in the pit (see Appendix L2 for further details).
Subsequently, the pit area was modelled as a ground level
source of emissions within the Calpuff model.
Building-wake effects were not considered in the air quality
modelling due to the height and location of the emission
sources relative to the considerably lower buildings in the area,
and the distance to the off-site sensitive receivers.
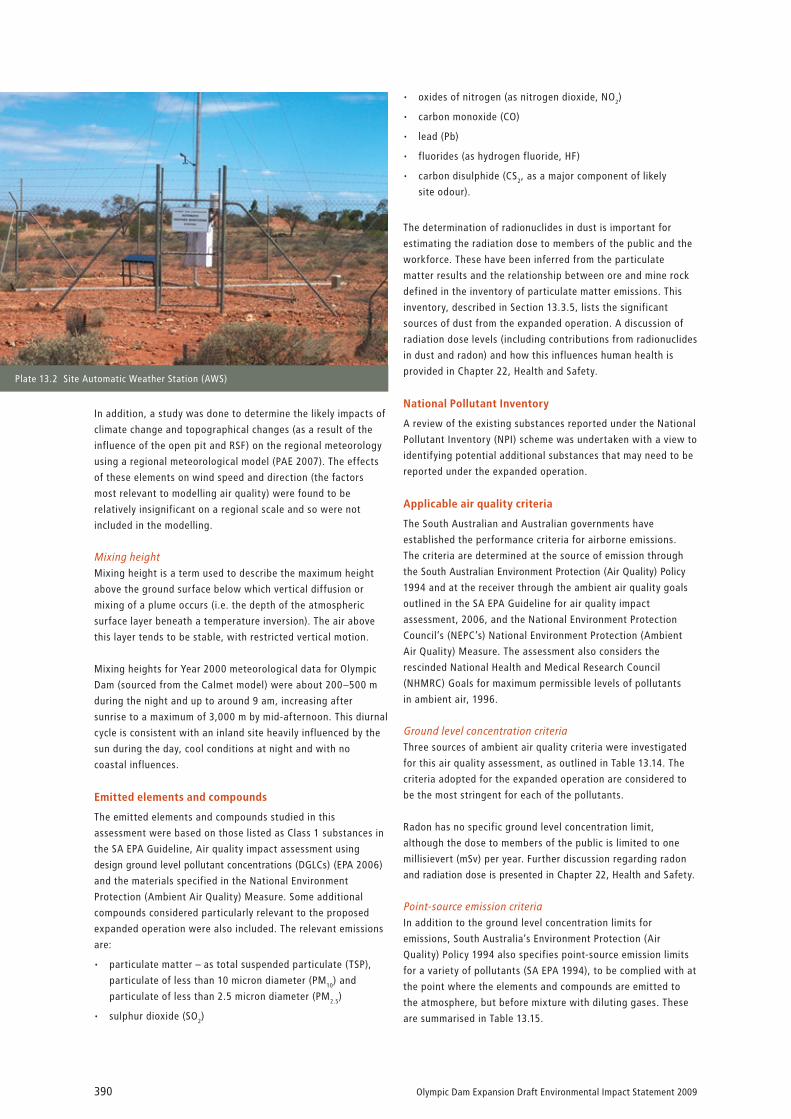
MeteorologyTwelve years of meteorological data are available from the
automatic weather station located at the corner of Olympic Way
and Eagle Way in the existing SML (see Plate 13.2 and see
Chapter 8, Meteorological Environment and Climate, for
climate details).
A statistical analysis by Professor A. Esterman (University of
South Australia) indicated that the data fell within statistical
upper and lower control limits, which means all years could be
considered ‘normal’. Air quality modelling of several pollutants
across all years consistently indicated that the Year 2000 had
the greatest ground level concentrations of pollutants at Roxby
Downs. Therefore conditions for Year 2000 were adopted for
modelling air quality for the proposed expansion to represent a
realistic worst-case meteorological scenario. On average, the
ground level concentration of pollutants would be expected to
be lower than that predicted.
Olympic Dam Expansion Draft Environmental Impact Statement 2009390
Plate 13.2 Site Automatic Weather Station (AWS)
In addition, a study was done to determine the likely impacts of
climate change and topographical changes (as a result of the
influence of the open pit and RSF) on the regional meteorology
using a regional meteorological model (PAE 2007). The effects
of these elements on wind speed and direction (the factors
most relevant to modelling air quality) were found to be
relatively insignificant on a regional scale and so were not
included in the modelling.
Mixing heightMixing height is a term used to describe the maximum height
above the ground surface below which vertical diffusion or
mixing of a plume occurs (i.e. the depth of the atmospheric
surface layer beneath a temperature inversion). The air above
this layer tends to be stable, with restricted vertical motion.
Mixing heights for Year 2000 meteorological data for Olympic
Dam (sourced from the Calmet model) were about 200–500 m
during the night and up to around 9 am, increasing after
sunrise to a maximum of 3,000 m by mid-afternoon. This diurnal
cycle is consistent with an inland site heavily influenced by the
sun during the day, cool conditions at night and with no
coastal influences.
emitted elements and compounds
The emitted elements and compounds studied in this
assessment were based on those listed as Class 1 substances in
the SA EPA Guideline, Air quality impact assessment using
design ground level pollutant concentrations (DGLCs) (EPA 2006)
and the materials specified in the National Environment
Protection (Ambient Air Quality) Measure. Some additional
compounds considered particularly relevant to the proposed
expanded operation were also included. The relevant emissions
are:
particulate matter – as total suspended particulate (TSP), •
particulate of less than 10 micron diameter (PM10) and
particulate of less than 2.5 micron diameter (PM2.5)
sulphur dioxide (SO• 2)
oxides of nitrogen (as nitrogen dioxide, NO• 2)
carbon monoxide (CO)•
lead (Pb)•
fluorides (as hydrogen fluoride, HF)•
carbon disulphide (CS• 2, as a major component of likely
site odour).
The determination of radionuclides in dust is important for
estimating the radiation dose to members of the public and the
workforce. These have been inferred from the particulate
matter results and the relationship between ore and mine rock
defined in the inventory of particulate matter emissions. This
inventory, described in Section 13.3.5, lists the significant
sources of dust from the expanded operation. A discussion of
radiation dose levels (including contributions from radionuclides
in dust and radon) and how this influences human health is
provided in Chapter 22, Health and Safety.
national Pollutant inventory
A review of the existing substances reported under the National
Pollutant Inventory (NPI) scheme was undertaken with a view to
identifying potential additional substances that may need to be
reported under the expanded operation.
applicable air quality criteria
The South Australian and Australian governments have
established the performance criteria for airborne emissions.
The criteria are determined at the source of emission through
the South Australian Environment Protection (Air Quality) Policy
1994 and at the receiver through the ambient air quality goals
outlined in the SA EPA Guideline for air quality impact
assessment, 2006, and the National Environment Protection
Council’s (NEPC’s) National Environment Protection (Ambient
Air Quality) Measure. The assessment also considers the
rescinded National Health and Medical Research Council
(NHMRC) Goals for maximum permissible levels of pollutants
in ambient air, 1996.
Ground level concentration criteriaThree sources of ambient air quality criteria were investigated
for this air quality assessment, as outlined in Table 13.14. The
criteria adopted for the expanded operation are considered to
be the most stringent for each of the pollutants.
Radon has no specific ground level concentration limit,
although the dose to members of the public is limited to one
millisievert (mSv) per year. Further discussion regarding radon
and radiation dose is presented in Chapter 22, Health and Safety.
Point-source emission criteriaIn addition to the ground level concentration limits for
emissions, South Australia’s Environment Protection (Air
Quality) Policy 1994 also specifies point-source emission limits
for a variety of pollutants (SA EPA 1994), to be complied with at
the point where the elements and compounds are emitted to
the atmosphere, but before mixture with diluting gases. These
are summarised in Table 13.15.

Olympic Dam Expansion Draft Environmental Impact Statement 2009 391
13
table 13.14 legislative goals for ambient air quality at sensitive receivers
Pollutant averaging period Goals (µg/m3) allowable exceedances (days per year)
sa ePa1 nePc2 nhmrc3
TSP Annual – – 90 Nil
PM10 24 hour – 50 – 5
Annual – 30 – Nil
PM2.54 24 hour – 25 – n.a.
Annual – 8 – n.a.
Sulphur dioxide 1 hour 450 570 570 1
24 hour – 228 – 1
Annual – 57 60 Nil
Nitrogen dioxide 1 hour 158 240 320 1
Annual – 60 – Nil
Carbon monoxide 1 hour 29 – – Nil
8 hour – 10,000 10,000 1
Lead Annual – 0.5 1.5 Nil
Fluoride 24 hour 2.9 – – Nil
Carbon disulphide 3 minute 130 – – Nil
1 Sourced from SA EPA Guidelines, Air quality impact assessment using DGLCs 2006.2 Sourced from NEPC, National Environment Protection (Ambient Air Quality) Measure 2003.3 Sourced from NHMRC, Ambient air quality goals recommended by NHMRC 1996 (since rescinded).4 The PM2.5 NEPC goal is an advisory reporting standard.
impact and risk assessment
The assessment of impacts and risks for the proposed
expansion has been undertaken as two separate, but related,
processes (see Section 1.6.2 of Chapter 1, Introduction, and
Figure 1.11).
Impacts and benefits are the consequence of a known event.
They are described in this chapter and categorised as high,
moderate, low or negligible in accordance with the criteria
presented in Table 1.3 (Chapter 1, Introduction).
A risk assessment describes and categorises the likelihood and
consequence of an unplanned event. These are presented in
Chapter 26, Hazard and Risk Reduction.
13.3.3 existinG environment
This section of the assessment describes the current air quality
environment in the Olympic Dam region with reference to
existing emissions sources, locations and monitoring results.
existing emissions sources
The Olympic Dam operation is the only major source of
emissions with the potential to affect air quality in the region.
Other local emission sources such as heavy vehicles, passenger
vehicles, air-conditioners, gas heaters and minor industrial
emissions are relatively insignificant.
Existing metallurgical plantEmissions from the existing metallurgical operations are
generally low in concentration compared to the point source
criteria, shown in Table 13.15, as a result of the extensive gas
treatment facilities installed on most emission-generating
plant. Emergency or abnormal events where the gas treatment
facilities are bypassed, such as power supply failures, have
previously resulted in short-term, high-emission concentrations
being discharged from stacks. Such bypass events are necessary
to protect the health and safety of personnel, and are recorded
and reported to the SA EPA in accordance with the site EPA
licence (see Chapter 2, Existing Operation, for details of
environmental reporting).
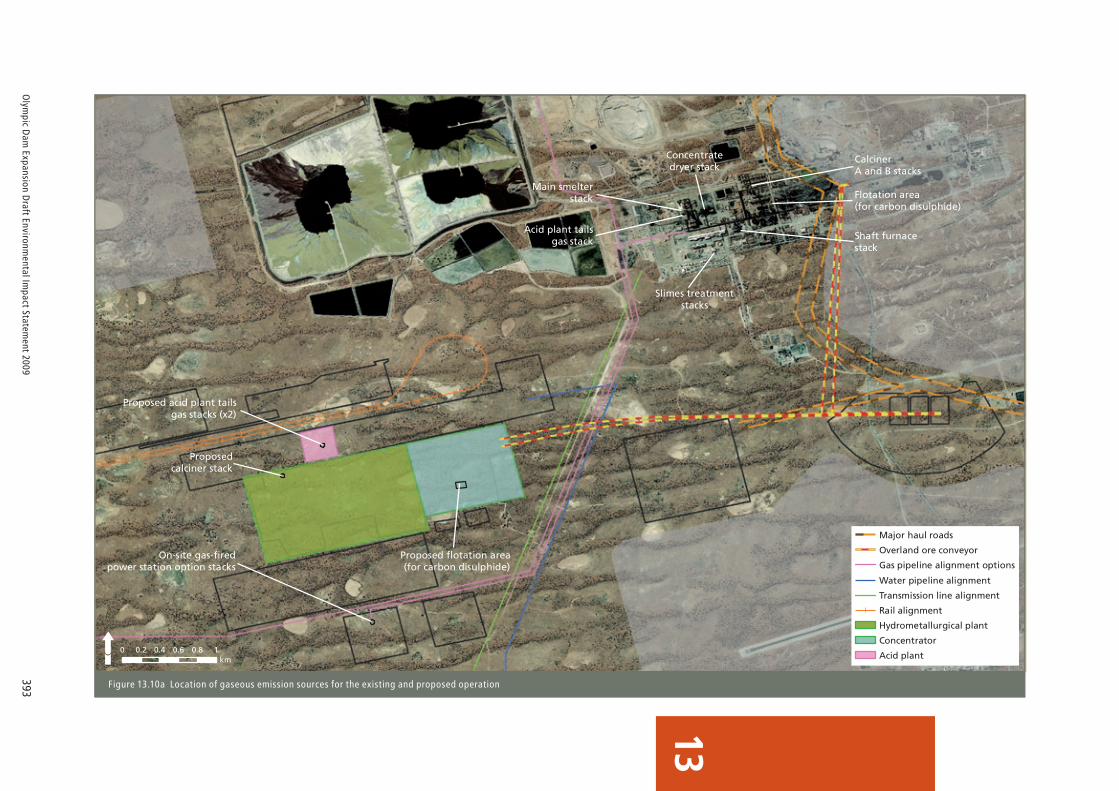
The major sources of emission from the existing metallurgical
plant shown in Figure 13.10a and are listed below:
main smelter stack•
acid plant tails gas stack •
calciner stacks•
shaft furnace stack•
slimes treatment plant stacks•
feed preparation concentrate dryer stack.•
There are also several bypass stacks used in emergency
or abnormal situations. These are the:
acid plant bypass stack•
electric furnace bypass stack•
anode furnace bypass stacks•
flash furnace bypass stack.•

Olympic Dam Expansion Draft Environmental Impact Statement 2009392
table 13.15 Point source emission criteria
Pollutant application limit (mg/nm3) notes
Particulate (TSP) All operations except those for heating metal or metal ores
250
Operations for heating metal or metal ores 100
Lead (Pb) All operations 10
Antimony (Sb) All operations 10
Arsenic (As) All operations 10
Cadmium (Cd) All operations 10
Mercury (Hg) All operations 3
Oxides of nitrogen (NOx)
All operations except those for the manufacture of nitric acid, sulphuric acid, glass or cement
500 For liquid or solid fuel burning equipment (other than internal combustion engines) with a maximum heat input rate greater than 150,000 MJ/h gross
350 For gaseous fuel burning equipment (other than internal combustion engines) with a maximum heat input rate greater than 150,000 MJ/hr gross
700 For power stations for electricity generation of rated output equal to or greater than 250 MW
70 For gas turbines for electricity generation with a rated output equal to or greater than 10 MW using gaseous fuels
150 For gas turbines for electricity generation with a rated output equal to or greater than 10 MW using other fuels
90 For gas turbines for electricity generation with a rated output less than 10 MW using gaseous fuels
All operations for the manufacture of nitric or sulphuric acid
2,000 Emitted gas must be colourless
Sulphur trioxide (SO3) and/or sulphuric acid (H2SO4) aerosols
All operations 100 Expressed as sulphur trioxide equivalent
Acid gases All operations for the manufacture of sulphuric acid
3,000 Expressed as sulphur trioxide equivalent. Off-gas must be free of persistent mist
Hydrogen sulphide (H2S)
All operations 5
Fluorine compounds (as HF)
All operations except primary aluminium smelters
50 Expressed as hydrofluoric acid equivalent
Chlorine (Cl) All operations 200
Carbon monoxide (CO)
All operations 1,000
Plates 13.3 and 13.4 show the main smelter stack complex and
the bypass stacks associated with the existing smelter.
The main pollutant generated (measured by concentration) in
the metallurgical plant is sulphur dioxide, significant volumes
of which are generated during the smelting of copper sulphide
ore. About 99% of the sulphur dioxide is recovered and
converted into sulphuric acid. The remaining 1% is emitted to
the atmosphere as a result of conversion inefficiencies in the
acid plant, gas treatment system bypasses or other fugitive
emissions that occur in the smelter building.
Particulate matter is also released during metal smelting
operations and although the majority is captured and recycled
in the gas treatment areas, some is emitted to the atmosphere.
Figure 13.10b shows the location and source of major particulate
matter emissions for the existing and proposed operation.
Odorous emissions are released from the flotation and reagents
area of the metallurgical facility, where sodium ethyl xanthate
decomposes to form the odorous carbon disulphide. The
estimated emission rate from this (derived from the NPI
Emission Estimation Technique Manual for Copper
Concentrating, Smelting and Refining) is about 0.01 g/s. Acidic
mist is also odorous, although less so than carbon disulphide,
and is released from all open-topped process vessels containing
acidic materials, including process tanks, storage ponds and
the TSF.
Olym
pic Dam
Expansion Draft Environm
ental Impact Statem
ent 2009393
13
CalcinerA and B stacks
Proposedcalciner stack
0 0.2 0.4 0.6 0.8 1km
Major haul roads
Overland ore conveyor
Gas pipeline alignment options
Water pipeline alignment
Transmission line alignment
Rail alignment
Hydrometallurgical plant
Concentrator
Acid plant
Concentratedryer stack
Main smelterstack
Acid plant tailsgas stack
Flotation area(for carbon disulphide)
Shaft furnacestack
Slimes treatmentstacks
Proposed flotation area (for carbon disulphide)
Proposed acid plant tailsgas stacks (x2)
On-site gas-firedpower station option stacks
Figure 13.10a Location of gaseous emission sources for the existing and proposed operation

Olym
pic Dam
Expansion Draft Environm
ental Impact Statem
ent 2009394
0 0.5 1 1.5 2 2.5km
Truck unloading points
Major haul roads
Overland ore conveyor
Pit development over time (in-pit sources emit from here)
Haulage access corridorsto unloading points
Run-of-mine stockpileand primary crushers
Quarry
Tailings wallraising
Figure 13.10b Location of particulate emission sources for the existing and proposed operation

Olympic Dam Expansion Draft Environmental Impact Statement 2009 395
13
The details of the main existing point sources are shown in
Table 13.16, and the emission rates associated with the existing
point sources are listed in Table 13.1. These were derived from
on-site sampling data.
Existing mining activities including limestone quarryParticulate matter, including saline aerosols, and gaseous
pollutants (such as CO and NOx from blasting) are released from
both the mine ventilation raise bores (see Plate 13.5) and
from the existing quarrying operation (see Plate 13.6). Radon
generated through the exposure of ore in the underground
workings is also ventilated to the surface via the raise bores.
table 13.16 existing point emission sources and indicative operating data
stack flow rate (m3/h) height (m aGl1) velocity (m/s) inner diameter (m) temperature (°c)
Smelter 2 main smelter stack 475,000 90 17.0 3.80 55
Acid plant tails gas stack 100,000 90 6.5 2.90 70
Smelter 1 shaft furnace stack 45,000 40 15.5 1.30 38
Calciner A stack 2,500 29 9.0 0.50 45
Calciner B stack 3,000 29 9.0 0.50 85
Slimes treatment roaster stack 30,000 20 23.0 0.75 60
Slimes treatment NOx stack 6,000 20 14.5 0.40 35
Concentrate dryer stack 20,000 22 9.0 1.20 30
1 AGL = above ground level.
table 13.17 existing average point source emission rates (mg/nm3)
stack so2 nox co Pb f
Smelter 2 main smelter stack 150 50 n.a. 1 0.05
Acid plant tails gas stack 1,050 75 n.a. 0 0.05
Smelter 1 shaft furnace stack 2 20 n.a. 8 0.1
Calciner A stack 0 0 n.a. 0 0
Calciner B stack 0 0 n.a. 0 0
Slimes treatment roaster stack 0 700 n.a. 0.005 0
Slimes treatment NOx stack 0 170 n.a. 0.005 0
Concentrate dryer stack 1 35 n.a. 0.05 0.5
Plate 13.3 The smelter, showing emission stacks
Mainsmelter
stack
Acid planttails gas stack
Acid plantbypass stack
Plate 13.4 The smelter, showing bypass stacks
Flash furnace bypass stackElectric slag reduction furnace bypass stack
Anode refining furnace bypass stacksAnode refining furnace bypass stacks

Olympic Dam Expansion Draft Environmental Impact Statement 2009396
Plate 13.6 Operations in the limestone quarry
existing ground level concentrations
The air quality of the existing operation is monitored by the
Airborne Emissions Monitoring Program which assesses
the effectiveness of controls and compliance with regulatory
limits. The program centres on estimating ground level
concentrations of sulphur dioxide, measuring total ground
level concentrations of suspended particulates and dust
deposition rates, and measuring concentrations of radon
progeny. The monitoring results are described in the annual
site Environmental Management and Monitoring Report
(BHP Billiton 2007) for SO2, TSP and dust deposition and are
summarised below, together with additional pollutants as
described in Section 13.2.3.
Plate 13.7 TSP high volume air sampler at Olympic Village
Plate 13.5 Saline aerosols capture infrastructure
Particulate matter (TSP, PM10 and PM2.5)Total suspended particulate (TSP) matter is monitored via high-
volume air samplers established on the western side of Olympic
Dam Village (see Plate 13.7), and on the north-west edge of
Roxby Downs (see Figure 13.11 for results).
PM10 monitoring has only recently started at Olympic Dam
Village and Roxby Downs (see Plate 13.8), and no PM2.5
monitoring is currently undertaken. The available PM10
monitoring data are shown in Figure 13.12. Although limited
conclusions can be drawn from the data, they indicate that the
operation’s contribution to the annual average ground level
concentration is about 17 µg/m3 at Olympic Dam Village and
13 µg/m3 at Roxby Downs, which is below the annual average
PM10 goal of 30 µg/m3. An analysis of simultaneous TSP and
PM10 monitoring results undertaken at Olympic Dam indicates
that 40–50% of TSP consists of particulate in the PM10 size
fraction, consistent with the 45–50% suggested in the NPI
Emission Estimation Technique Manual for Mining.
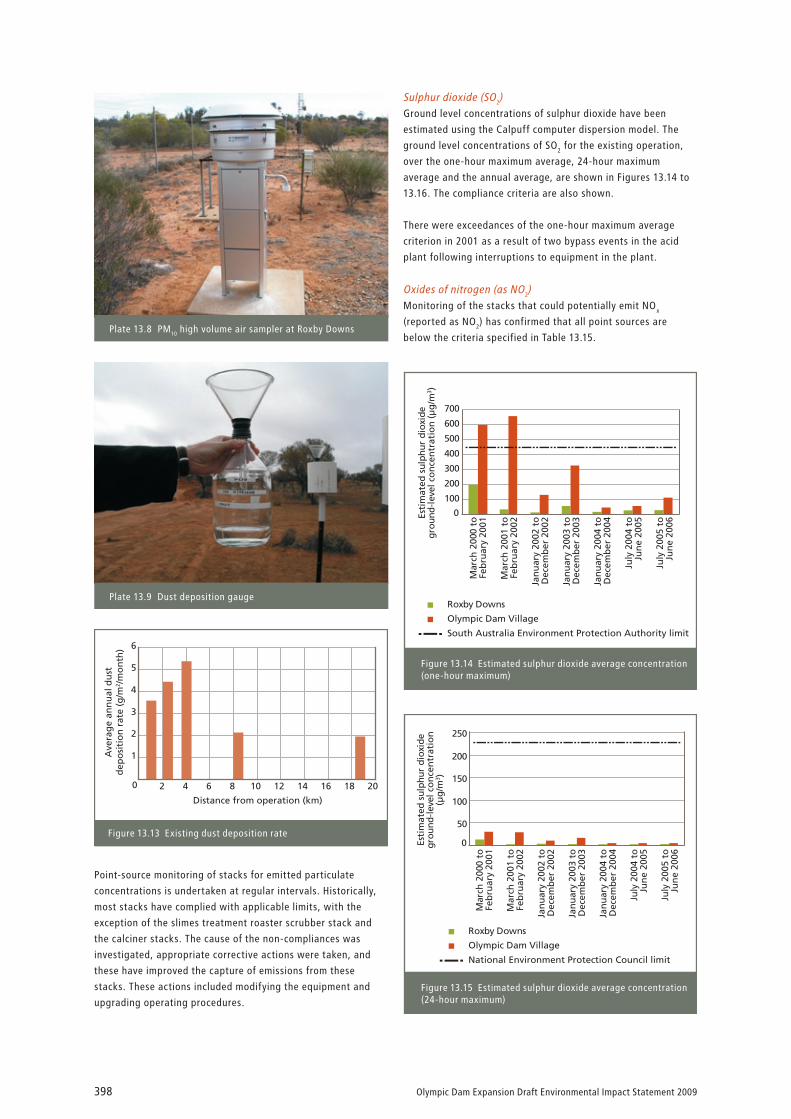
Dust deposition is currently monitored by a system of 14
passive dust deposition gauges (see Plate 13.9). The results of
this monitoring are presented in the annual site Environmental
Management and Monitoring Report (see BHP Billiton 2007),
and are summarised according to distance from the operation in
Figure 13.13. These results show that dust deposition generally
peaks at distances of between two and four kilometres from the
operation, and then decreases to relatively constant levels
about eight kilometres from the operation.

Olympic Dam Expansion Draft Environmental Impact Statement 2009 397
13
20
TSP
gro
un
d-l
evel
co
nce
ntr
atio
n (µ
g/m
3 )
0
40
60
80
100
120
1998 1999 2000 2001 2002 2003 2004 2005 2006
Roxby Downs
Olympic Dam Village
National Health and Medical Research Council annual average limit
Figure 13.11 Existing operation contributed total suspended particulate (TSP) ground-level concentration
Esti
mat
ed P
M10
gro
un
d-l
evel
co
nce
ntr
atio
n (
µg
/m3 )
Roxby Downs
Olympic Dam Village
10
15
20
25
30
35
40
Nov2006 2007
Dec Jan Feb Mar Apr May Jun Jul Aug Sep0
5
Figure 13.12 Existing PM10 particulate matter ground-level concentration
Olympic Dam Expansion Draft Environmental Impact Statement 2009398
Distance from operation (km)
Ave
rag
e an
nu
al d
ust
dep
osi
tio
n r
ate
(g/m
2 /m
on
th)
1
2
3
4
5
6
0 2 4 6 8 10 12 14 16 18 20
Figure 13.13 Existing dust deposition rate
0
100
200
300
400
500
600
700
Mar
ch 2
000
toFe
bru
ary
2001
Mar
ch 2
001
toFe
bru
ary
2002
Jan
uar
y 20
02 t
oD
ecem
ber
200
2
Jan
uar
y 20
03 t
oD
ecem
ber
200
3
Jan
uar
y 20
04 t
oD
ecem
ber
200
4
July
200
4 to
Jun
e 20
05
July
200
5 to
Jun
e 20
06
Esti
mat
ed s
ulph
ur d
ioxi
degr
ound
-lev
el c
on
cen
trat
ion
(µ
g/m
3 )
Roxby Downs
Olympic Dam Village
South Australia Environment Protection Authority limit
Figure 13.14 Estimated sulphur dioxide average concentration(one-hour maximum)
0
50
100
150
200
250
Esti
mat
ed s
ulph
ur d
ioxi
degr
ound
-lev
el c
on
cen
trat
ion
(µg
/m3 )
Mar
ch 2
000
toFe
bru
ary
2001
Mar
ch 2
001
toFe
bru
ary
2002
Jan
uar
y 20
02 t
oD
ecem
ber
200
2
Jan
uar
y 20
03 t
oD
ecem
ber
200
3
Jan
uar
y 20
04 t
oD
ecem
ber
200
4
July
200
4 to
Jun
e 20
05
July
200
5 to
Jun
e 20
06
Roxby Downs
Olympic Dam Village
National Environment Protection Council limit
Figure 13.15 Estimated sulphur dioxide average concentration(24-hour maximum)
Plate 13.8 PM10 high volume air sampler at Roxby Downs
Plate 13.9 Dust deposition gauge
Point-source monitoring of stacks for emitted particulate
concentrations is undertaken at regular intervals. Historically,
most stacks have complied with applicable limits, with the
exception of the slimes treatment roaster scrubber stack and
the calciner stacks. The cause of the non-compliances was
investigated, appropriate corrective actions were taken, and
these have improved the capture of emissions from these
stacks. These actions included modifying the equipment and
upgrading operating procedures.
Sulphur dioxide (SO2)Ground level concentrations of sulphur dioxide have been
estimated using the Calpuff computer dispersion model. The
ground level concentrations of SO2 for the existing operation,
over the one-hour maximum average, 24-hour maximum
average and the annual average, are shown in Figures 13.14 to
13.16. The compliance criteria are also shown.
There were exceedances of the one-hour maximum average
criterion in 2001 as a result of two bypass events in the acid
plant following interruptions to equipment in the plant.
Oxides of nitrogen (as NO2)Monitoring of the stacks that could potentially emit NOx
(reported as NO2) has confirmed that all point sources are
below the criteria specified in Table 13.15.

Olympic Dam Expansion Draft Environmental Impact Statement 2009 399
13
Mar
ch 2
000
toFe
bru
ary
2001
Mar
ch 2
001
toFe
bru
ary
2002
Jan
uar
y 20
02 t
oD
ecem
ber
200
2
Jan
uar
y 20
03 t
oD
ecem
ber
200
3
Jan
uar
y 20
04 t
oD
ecem
ber
200
4
July
200
4 to
Jun
e 20
05
July
200
5 to
Jun
e 20
06
Roxby Downs
Olympic Dam Village
National Environment Protection Council limit
Esti
mat
ed s
ulph
ur d
ioxi
degr
ound
-lev
el c
on
cen
trat
ion
(µg
/m3 )
0102030
40506070
Figure 13.16 Estimated sulphur dioxide annual averageconcentration
Plate 13.10 Reagents storage area
Carbon monoxide (CO)Using the NPI emission estimation techniques, together with
fuel usage data, the point-source emissions are estimated to
be below the criteria specified in Table 13.15.
Lead (Pb)Point-source monitoring of particulate emissions from stacks
and subsequent particulate analysis has been undertaken. The
results indicate that point-source lead concentrations are below
the criteria specified in Table 13.15.
Fluoride (as HF)Point-source monitoring of HF emissions has been undertaken
previously. The results confirm that all point sources measured
are below the criteria specified in Table 13.15.
Carbon disulphide (CS2)No monitoring of ground level odour concentrations has been
done at Olympic Dam beyond the current mining lease. A study
commissioned in 2003 by BHP Billiton to investigate odours
emanating from the hydrometallurgical areas of the
metallurgical plant, however, found that the principal source
of odour in the plant was the decomposition of xanthates to
carbon disulphide within the flotation area (Glossop 2003).
In addition, an extensive survey of the mining industry was
undertaken in 1995 as a part of the Australian Government
Priority Existing Chemical Program because of the lack of
information available regarding the health effects of xanthates,
the large volumes used in the mining industry, and the potential
for odorous emissions after the xanthates decompose in acid to
form carbon disulphide.
The results of an investigation at Olympic Dam, as part of the
1995 industry survey, indicated that instantaneous atmospheric
concentrations of carbon disulphide were less than 2.5 ppm
(about 800 µg/m3) in the reagents storage area of the facility
(see Plate 13.10), which was the major source of carbon
disulphide at Olympic Dam. This was consistent with other
operations benchmarked in the assessment report (NICNAS 1995).
In the past seven years, members of the public have filed two
reports of nuisance odour in Roxby Downs (as a result of mining
and metallurgical operations) with BHP Billiton. These were
found to be the result of issues associated with the dosing of
xanthate to the flotation area of the metallurgical plant. In
these instances, the issues associated with the dosing system
were corrected and the systems returned to service.
13.3.4 desiGn modifications to Protect
environmental values
environmental values
The values in this instance relate to the sensitive receivers
discussed in Section 13.3.2 and the existing quality of the
air environment as described in Section 13.3.3.
major elements of the project design
The initial design brief for the expanded mining and
metallurgical operation, and the subsequent development of
an emissions inventory for the purpose of air quality modelling,
indicated that compliance with the 24-hour particulate matter
ambient air quality goals would be a challenge. As a result,
some mitigation measures were adopted into the emissions
inventory that resulted in decreased particulate emissions from
the mining operations. Other management decisions were made
regarding the location of project infrastructure to reduce the
potential impacts to sensitive receivers. These specific
mitigation and management measures were:
suppressing dust on unsealed haul roads and unsealed •
access roads using saline water or a suitable chemical dust
suppressant
providing a 500 m separation between the toe of the RSF •
and Arid Recovery to minimise direct and indirect impacts
from particulate matter
relocating Olympic Dam Village, including the existing heavy •
industrial estate, to reduce potential workforce exposures to
particulate matter
Olympic Dam Expansion Draft Environmental Impact Statement 2009400
siting Hiltaba Village about halfway between Roxby Downs •
and Andamooka to maximise the distance between the
particulate emissions sources and the residents, while
considering the social and economic impacts associated
with the construction and operation of a 6,000 person
accommodation camp
transferring dry materials using covered or otherwise •
enclosed conveyor systems, with baghouses at transfer
points, and intermediate storage bins to minimise dust
emissions. Differential pressure indicators would be fitted
to alert operations personnel to a potential bag failure.
With regard to gaseous emissions from the expanded existing
and proposed new metallurgical plants, and in particular the
proposed sulphur-burning acid plants and the gas-fired power
station, the following mitigation and management measures
have been incorporated:
the exhaust stacks for all four new sulphur-burning acid •
plants have been modelled at 50 m high, and would operate
to at least the same efficiency as the existing acid plant
the stack for the proposed CCGT power station has been •
modelled at 35 m high
a gas cleaning system would be installed with the proposed •
additional calcining furnace so that the treated calciner off-
gas would comply with the criteria discussed in Table 13.15
a gas cleaning system similar to that currently installed for •
the existing anode furnaces would be installed with the
additional smelter anode furnace. Like the existing furnaces,
the system would be inter-locked to the process control
system so that in the event of the gas cleaning system
failure, the furnace would stop processing to minimise
further emissions.
These management and mitigation measures have been
incorporated into the air quality modelling discussed previously.
Further to these measures, a closed system would be designed
at the Port of Darwin for the transport, storage and handling
of concentrate. As part of the closed system, the concentrate
storage shed at the East Arm facility would be a fully enclosed
building fitted with automatic doors and a negative pressure
particulate filtration and ventilation system. The closed system
would extend from the production storage point at Olympic
Dam to the ship hold at the Port of Darwin (see Appendix E4
for details).
13.3.5 imPact assessment and manaGement
The assessment of air quality relates to proposed sources and
rates of emission from the expanded operation, the resultant
concentrations of emissions at ground level at sensitive
receivers, and the proposed management measures to comply
with applicable limits at sensitive receivers.
emissions sources
The two key emission sources from the proposed expansion
would be the expanded metallurgical facility and activities
associated with the new open pit mine. These are discussed in
greater detail in the following sections, with the locations of
emission sources relevant to the proposed expansion shown in
Figures 13.10a and b.
Expanded metallurgical plantThe expanded metallurgical plant would be constructed to the
south of the existing operation. However, the existing smelter,
which would be upgraded to handle the additional volumes of
copper concentrate (see Chapter 5, Description of the Proposed
Expansion, for details), would remain the primary source of
gaseous emissions. New flotation circuits would be constructed
within the new concentrator plant and a new calciner would be
constructed within the additional hydrometallurgical plant. Four
new sulphur-burning acid plants, feeding into two new off-gas
stacks, would also service the new hydrometallurgical plant.
Details of the point-emission sources associated with the
expanded plant are shown in Table 13.18, and the estimated
emission rates are listed in Table 13.19. As described in the
following section, the expanded processing operation would be
designed so that all point-source emissions comply with the
requirements of the Environment Protection (Air Quality) Policy
1994 (see Table 13.15 for emission limits).
Emissions of carbon disulphide are expected to increase in
proportion to the volume of sodium ethyl xanthate used within
the new flotation facilities, with the estimated emission rate
being 0.07 g/s from the new facility.
New furnace bypass stacksThe gas cleaning systems in all smelter-based furnaces would
be bypassed in the event of abnormal or emergency conditions
that may adversely affect the health and safety of personnel.
As with the existing operation, these bypass stacks would be
interlocked to the process, so that the failure of a gas cleaning
system would interrupt feed to the relevant furnaces and
minimise the potential environmental or health and safety risks.
CCGT power stationThe proposed CCGT power station would be constructed to the
south of the expanded metallurgical plant. Details of the
modelled stack configuration are presented in Table 13.20.
Emissions from the gas-fired power station have been
calculated using the NPI Emission Estimation Technique Manual
for Fossil Fuel Electric Power Generation (NPI 2005) and
estimates of the likely volume of natural gas that would be
consumed. Table 13.21 shows the likely annualised emissions
from the proposed power station where the NPI reporting
thresholds have been triggered.
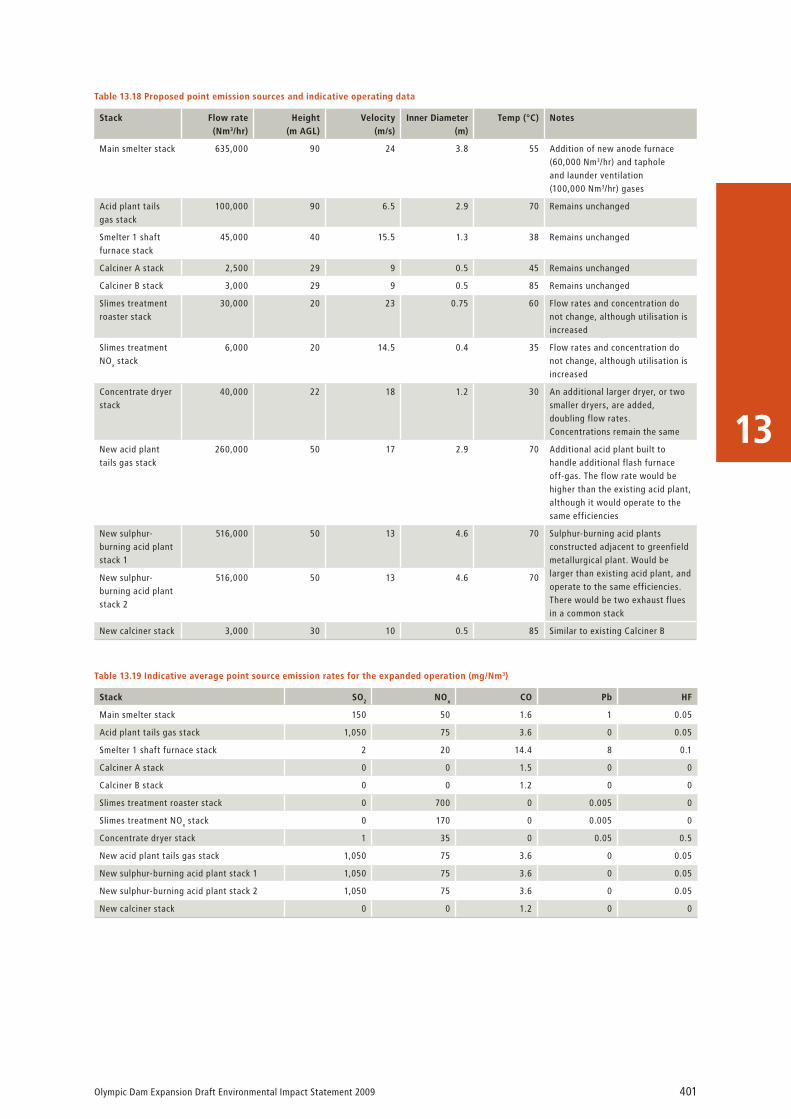
Olympic Dam Expansion Draft Environmental Impact Statement 2009 401
13
table 13.18 Proposed point emission sources and indicative operating data
stack flow rate (nm3/hr)
height (m aGl)
velocity (m/s)
inner diameter (m)
temp (°c) notes
Main smelter stack 635,000 90 24 3.8 55 Addition of new anode furnace (60,000 Nm3/hr) and taphole and launder ventilation (100,000 Nm3/hr) gases
Acid plant tails gas stack
100,000 90 6.5 2.9 70 Remains unchanged
Smelter 1 shaft furnace stack
45,000 40 15.5 1.3 38 Remains unchanged
Calciner A stack 2,500 29 9 0.5 45 Remains unchanged
Calciner B stack 3,000 29 9 0.5 85 Remains unchanged
Slimes treatment roaster stack
30,000 20 23 0.75 60 Flow rates and concentration do not change, although utilisation is increased
Slimes treatment NOx stack
6,000 20 14.5 0.4 35 Flow rates and concentration do not change, although utilisation is increased
Concentrate dryer stack
40,000 22 18 1.2 30 An additional larger dryer, or two smaller dryers, are added, doubling flow rates. Concentrations remain the same
New acid plant tails gas stack
260,000 50 17 2.9 70 Additional acid plant built to handle additional flash furnace off-gas. The flow rate would be higher than the existing acid plant, although it would operate to the same efficiencies
New sulphur-burning acid plant stack 1
516,000 50 13 4.6 70 Sulphur-burning acid plants constructed adjacent to greenfield metallurgical plant. Would be larger than existing acid plant, and operate to the same efficiencies. There would be two exhaust flues in a common stack
New sulphur-burning acid plant stack 2
516,000 50 13 4.6 70
New calciner stack 3,000 30 10 0.5 85 Similar to existing Calciner B
table 13.19 indicative average point source emission rates for the expanded operation (mg/nm3)
stack so2 nox co Pb hf
Main smelter stack 150 50 1.6 1 0.05
Acid plant tails gas stack 1,050 75 3.6 0 0.05
Smelter 1 shaft furnace stack 2 20 14.4 8 0.1
Calciner A stack 0 0 1.5 0 0
Calciner B stack 0 0 1.2 0 0
Slimes treatment roaster stack 0 700 0 0.005 0
Slimes treatment NOx stack 0 170 0 0.005 0
Concentrate dryer stack 1 35 0 0.05 0.5
New acid plant tails gas stack 1,050 75 3.6 0 0.05
New sulphur-burning acid plant stack 1 1,050 75 3.6 0 0.05
New sulphur-burning acid plant stack 2 1,050 75 3.6 0 0.05
New calciner stack 0 0 1.2 0 0
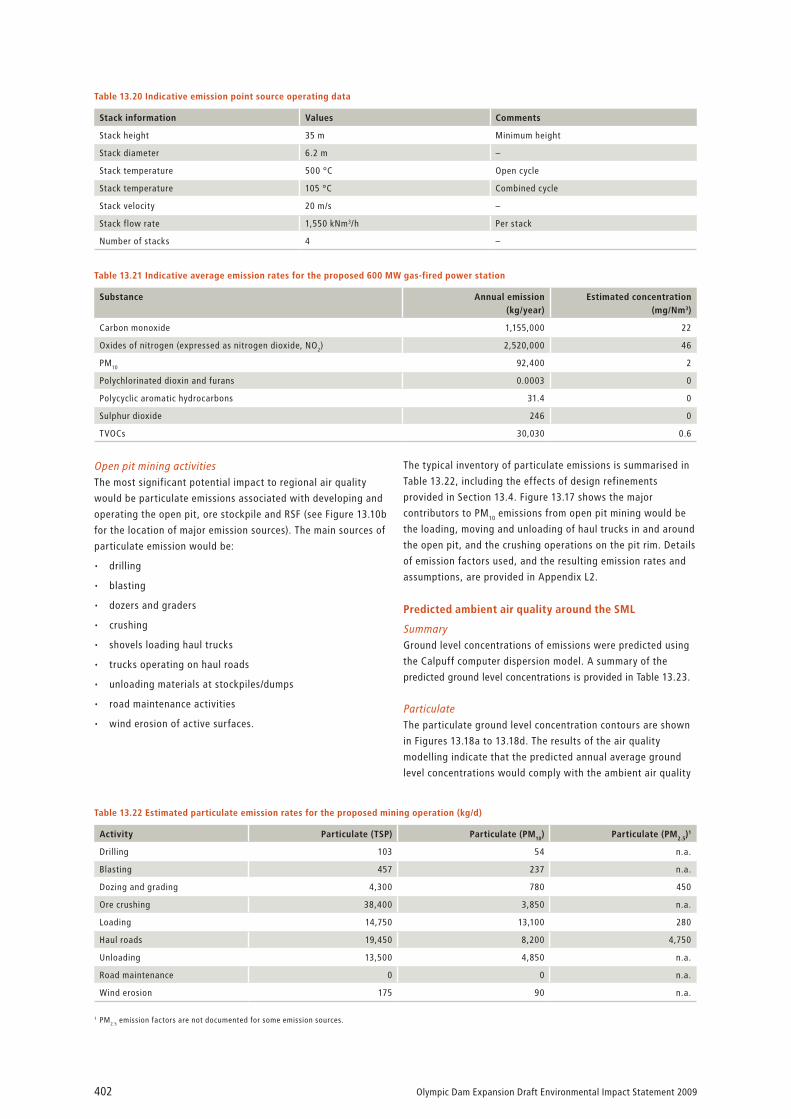
Olympic Dam Expansion Draft Environmental Impact Statement 2009402
table 13.21 indicative average emission rates for the proposed 600 mW gas-fired power station
substance annual emission (kg/year)
estimated concentration (mg/nm3)
Carbon monoxide 1,155,000 22
Oxides of nitrogen (expressed as nitrogen dioxide, NO2) 2,520,000 46
PM10 92,400 2
Polychlorinated dioxin and furans 0.0003 0
Polycyclic aromatic hydrocarbons 31.4 0
Sulphur dioxide 246 0
TVOCs 30,030 0.6
table 13.22 estimated particulate emission rates for the proposed mining operation (kg/d)
activity Particulate (tsP) Particulate (Pm10) Particulate (Pm2.5)1
Drilling 103 54 n.a.
Blasting 457 237 n.a.
Dozing and grading 4,300 780 450
Ore crushing 38,400 3,850 n.a.
Loading 14,750 13,100 280
Haul roads 19,450 8,200 4,750
Unloading 13,500 4,850 n.a.
Road maintenance 0 0 n.a.
Wind erosion 175 90 n.a.
1 PM2.5 emission factors are not documented for some emission sources.
Open pit mining activitiesThe most significant potential impact to regional air quality
would be particulate emissions associated with developing and
operating the open pit, ore stockpile and RSF (see Figure 13.10b
for the location of major emission sources). The main sources of
particulate emission would be:
drilling•
blasting•
dozers and graders•
crushing•
shovels loading haul trucks•
trucks operating on haul roads•
unloading materials at stockpiles/dumps•
road maintenance activities•
wind erosion of active surfaces.•
table 13.20 indicative emission point source operating data
stack information values comments
Stack height 35 m Minimum height
Stack diameter 6.2 m –
Stack temperature 500 °C Open cycle
Stack temperature 105 °C Combined cycle
Stack velocity 20 m/s –
Stack flow rate 1,550 kNm3/h Per stack
Number of stacks 4 –
The typical inventory of particulate emissions is summarised in
Table 13.22, including the effects of design refinements
provided in Section 13.4. Figure 13.17 shows the major
contributors to PM10 emissions from open pit mining would be
the loading, moving and unloading of haul trucks in and around
the open pit, and the crushing operations on the pit rim. Details
of emission factors used, and the resulting emission rates and
assumptions, are provided in Appendix L2.
Predicted ambient air quality around the sml
SummaryGround level concentrations of emissions were predicted using
the Calpuff computer dispersion model. A summary of the
predicted ground level concentrations is provided in Table 13.23.
ParticulateThe particulate ground level concentration contours are shown
in Figures 13.18a to 13.18d. The results of the air quality
modelling indicate that the predicted annual average ground
level concentrations would comply with the ambient air quality

Olympic Dam Expansion Draft Environmental Impact Statement 2009 403
13
PM10
em
issi
on
s (k
g/d
)
0
2,000
4,000
6,000
8,000
10,000
12,000
14,000
Load
ing
Hau
l ro
ads
Un
load
ing
Ore
cru
shin
g
Bu
lldo
zin
g a
nd
gra
din
g
Bla
stin
g
Win
d e
rosi
on
Dri
llin
g
Ro
ad m
ain
ten
ance
Figure 13.17 Estimated PM10 particulate matter emission ratesfor the proposed mining operation
table 13.23 Predicted ground level concentrations at roxby downs and hiltaba village
Pollutant averaging period ambient air quality goal1
(µg/m3)
allowable exceedances
(days per year)
roxby downs2 (µg/m3)
hiltaba village2 (µg/m3)
TSP Annual 90 5.7 7.1
Deposition (g/m2/month)
4 Nil 0.2 0.2
PM10 24 hour 50 5 83.0 65.9
Annual 30 Nil 4.3 5.0
PM2.5 24 hour 25 n.a. 13.9 17.8
Annual 8 n.a. 1.0 0.9
Sulphur dioxide 1 hour max 450 1 460 260
24 hour 228 1 51.9 43.0
Annual 57 Nil 1.6 1.4
Nitrogen dioxide 1 hour max 158 1 87.7 70.7
Annual 60 Nil 0.44 0.33
Carbon monoxide 1 hour max 29 Nil 20.0 17.2
8 hour 10,000 1 3.2 4.4
Lead Annual 0.5 Nil 0.001 0.001
Fluoride 24 hour 2.9 Nil 0.003 0.003
Carbon disulphide 3 minute 130 Nil 0.4 0.2
1 The ambient air quality goal for each compound is the lower of those presented in Table 13.13.2 Numbers in bold indicate that concentrations exceed ambient air quality criteria.
goals at both Roxby Downs and Hiltaba Village for all
particulate size fractions, as would the maximum 24-hour
average PM2.5 ground level concentration. The maximum 24-
hour average PM10 concentrations, however, are predicted to
exceed the ambient air quality goals at Roxby Downs on 10 days
per year, and at Hiltaba Village on five days during the worst-
case year. The National Environment Protection (Ambient Air
Quality) Measure, 2003, permits up to five exceedances of
the PM10 24-hour average ambient air quality goal per year.
As the air quality modelling already includes the effect of the
design refinements identified in Section 13.3.4, operational
controls may be required to maintain ground level
concentrations of PM10 dust to within applicable compliance
limits during the predicted five to ten days per annum of
worse-case weather conditions, should such conditions
eventuate. Other large mining and materials handling operations
currently use such systems with success (e.g. KCGM 2006 and
BHP Billiton 2006).
A dust management plan would be developed to record and
monitor the following process of applying operational control:
a network of real-time dust monitors, which may include •
TSP, PM10 and PM2.5 monitors, around the mining operation,
at the sensitive receivers, and at intervals between these
receivers and the mining operation. These would be
integrated within the mining process control system as an
early warning of rising particulate concentrations at the
sensitive receivers
a real-time meteorological system, integrated with the real-•
time dust monitors, which would permit mining operations
to be planned and adjusted to ensure the particulate criteria
would not be exceeded at the sensitive receivers
additional monitoring sites would be placed north, east and •
west of the operation to determine the concentration of
particulates contributed by the expanded operation.

Olympic Dam Expansion Draft Environmental Impact Statement 2009404
Annual average
Roxby Downs
Hiltaba Village
0 2 4kmReceiver limit = 90 µg/m3
Sensitive receiver
90 µg/m3 dust contour
Figure 13.18a Predicted total suspended particulateground-level concentrations (µg/m3)
Roxby Downs
Hiltaba Village
Maximum 24-hour average Annual average
0 2 4km
0 2 4km Receiver limit = 30 µg/m3
Sensitive receiver
30 µg/m3 dust contourReceiver limit = 50 µg/m3
Sensitive receiver
50 µg/m3 dust contour
Figure 13.18b Predicted PM10 ground-level concentrations for the expanded operation (µg/m3)
Figure 13.19 shows the response procedure should ambient dust
concentrations rise to a point where the ambient air quality
goals are likely to be exceeded. The controls would be based
around managing the scale of the dust generating activities,
and the timing and location of such activities. The management
response may include:
relocating some or all blasting/loading or unloading •
activities to more favourable areas of the mining operation
redirecting mine rock haulage activities •
modifying planned blasting activities•
increasing the frequency of dust suppression activities •
on haul roads
cessation of operations.•
The effects of dust on health and amenity have been raised as
issues in consultation undertaken for the Roxby Downs Draft
Master Plan (see Appendix F4) and in the Outback Areas
Community Development Trust – Community Forum Report (2007).
Research into the amenity impacts of dust arising from mining
operations has been undertaken for communities in the Hunter
Valley region of New South Wales exposed to varying
concentrations of dust, including dust deposition rates in excess
of those predicted for the expanded operation. A 1986 survey
of three communities (Dean et al. 1987) showed that there was
‘no specific dust deposition threshold that represented a
precise point where people generally perceive a decline in their
level of amenity commencing’. This study subsequently
concluded that the most important factor in determining a
community’s response to dust was likely to be the existing air
quality and its rate of change.
A similar study undertaken in 1999 (ACARP 1999), also for the
Hunter Valley, concluded that ‘community perceptions to air
quality do not correlate well with exposure to long-term
average PM10 concentrations, nor do community perceptions
appear to correlate well with even quite extreme exposures to
dust measured at a particular location’. It was suggested that
a possible explanation for this is that community perception of
dust is based on visual cues (such as general haze and dust
fallout onto roofs and cars) rather than compliance or otherwise
with health-based limits. The additional particulate emissions
associated with the expanded operation, although complying
with ambient air quality goals specified in Table 13.23 through

Olympic Dam Expansion Draft Environmental Impact Statement 2009 405
13
Roxby Downs
Hiltaba Village
Maximum 24-hour average Annual average
0 2 4km
0 2 4kmReceiver limit = 8 µg/m3
Sensitive receiver
8 µg/m3 dust contourReceiver limit = 25 µg/m3
Sensitive receiver
25 µg/m3 dust contour
Figure 13.18c Predicted PM2.5 ground-level concentrations (µg/m3)
Roxby Downs
Annual average dust deposition rate
0 2 4km
Hiltaba Village
Receiver limit = 4 g/m2/month
Sensitive receiver
4 g/m2/month dust contour
Figure 13.18d Predicted dust deposition rate (g/m2/month)
the use of dust suppression and operational control, are
predicted to increase dust deposition by about 10% over
current levels at both Roxby Downs and Hiltaba Village.
This would be visible by residents and therefore may be
perceived negatively by the community. As a result, it has
been categorised as a moderate residual impact.
To assist in fostering a greater understanding of impacts of
particulates on community amenity and health, BHP Billiton
would provide information to residents of Roxby Downs and
Hiltaba Village on dust and dust emissions through:
information packs for all new and existing residents•
a web-based system that enables the community to have •
access to dust monitoring results
feedback to the community about on-site and off-site •
environmental performance through the EMMR.
Chapter 15, Terrestrial Ecology, and Chapter 22, Health and
Safety, also provide further details on predicted impacts to
ecosystems and human health, respectively.
Other airborne emissionsThe results of the air quality modelling indicate that other
airborne emissions would comply with the ambient air quality
goals as described in Table 13.14 for the proposed expanded
operation (see results in Table 13.23), with the adoption of the
design components detailed in Section 13.3.4. The SO2 one-hour
maximum average concentration slightly exceeds the SA EPA
ambient air quality goal at Roxby Downs on one occasion during
the modelled worst-case year. An analysis of the ground level
concentration data for SO2 indicates that the next highest
one-hour maximum concentration at Roxby Downs is around
315 µg/m3, significantly below the goal (of 450 µg/m3). The
operation of the four sulphur-burning acid plants is the largest
factor in the increase in ground level sulphur dioxide
concentrations,
and calculations of final stack height and acid plant efficiency
would be undertaken during detailed design with the aim of
reducing the potential ground level concentrations. The National
Environment Protection (Ambient Air Quality) Measure permits
one exceedance of the one-hour maximum average SO2 goal
per year.

Olympic Dam Expansion Draft Environmental Impact Statement 2009406
Action (shift supervisor identifies
source, initiates action)
Review and report
Effective? (additional
message sent indicating effectiveness)
Yes
No
Effective? (additional
message sent indicating effectiveness)
No Yes
Review source and actions, initiate further actions
Monitor dust levels and recommence mining when conditions are
more favourable
Shut down dust generating activities
Continue operationsin restricted formuntil conditions
improve, then resume operation as normal
Continue operationsin restricted formuntil conditions
improve, then resume operation as normal
Second message sent (trigger for
action)
Monitoring levelsacceptable
Operationas normal
Real time monitoringof dust
Monitored levelsapproaching
applicable limits
Dust event (dust levels heightened for
a period of time)
Message sent to shiftsupervisor (locationof reading and wind
direction)
Continue operation as normal unless dust
levels heighten
Figure 13.19 Indicative response procedure should operational dust control be required
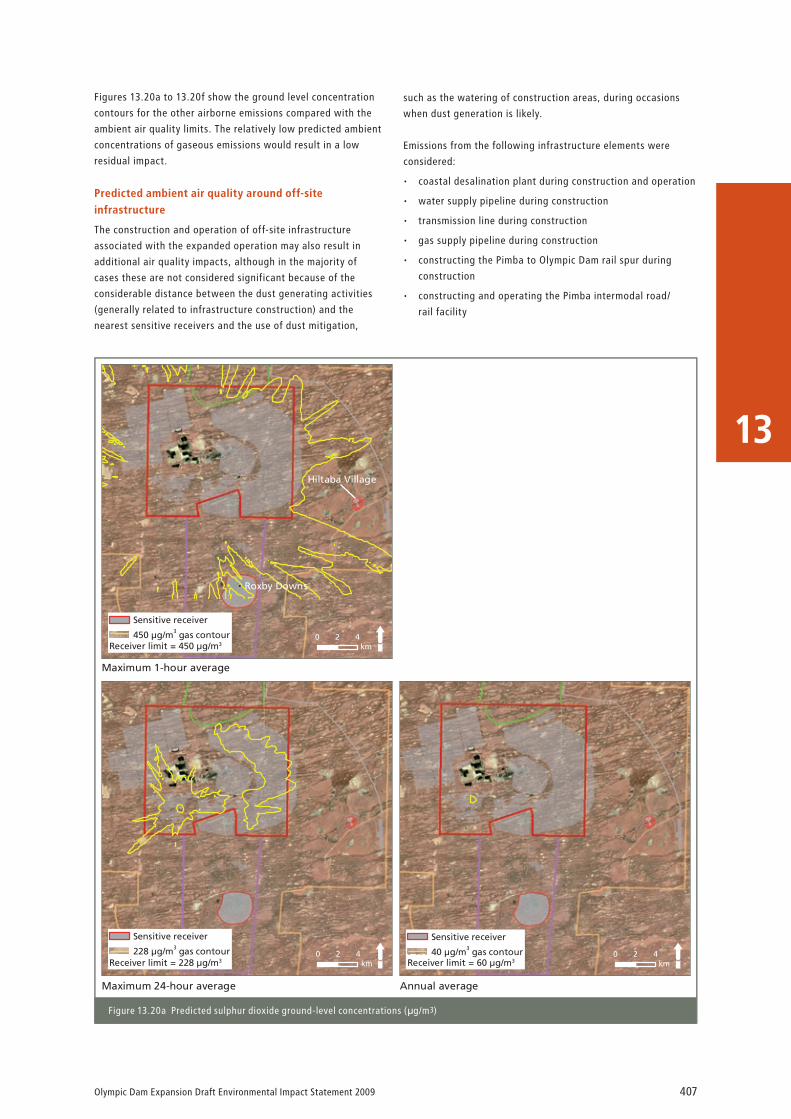
Olympic Dam Expansion Draft Environmental Impact Statement 2009 407
13
Roxby Downs
Hiltaba Village
Maximum 1-hour average
Maximum 24-hour average Annual average
0 2 4km
0 2 4km
0 2 4km
Sensitive receiver
450 µg/m3 gas contourReceiver limit = 450 µg/m3
Receiver limit = 228 µg/m3
Sensitive receiver
228 µg/m3 gas contourReceiver limit = 60 µg/m3
Sensitive receiver
40 µg/m3 gas contour
Figure 13.20a Predicted sulphur dioxide ground-level concentrations (µg/m3)
Figures 13.20a to 13.20f show the ground level concentration
contours for the other airborne emissions compared with the
ambient air quality limits. The relatively low predicted ambient
concentrations of gaseous emissions would result in a low
residual impact.
Predicted ambient air quality around off-site infrastructure
The construction and operation of off-site infrastructure
associated with the expanded operation may also result in
additional air quality impacts, although in the majority of
cases these are not considered significant because of the
considerable distance between the dust generating activities
(generally related to infrastructure construction) and the
nearest sensitive receivers and the use of dust mitigation,
such as the watering of construction areas, during occasions
when dust generation is likely.
Emissions from the following infrastructure elements were
considered:
coastal desalination plant during construction and operation•
water supply pipeline during construction•
transmission line during construction•
gas supply pipeline during construction•
constructing the Pimba to Olympic Dam rail spur during •
construction
constructing and operating the Pimba intermodal road/ •
rail facility

Olympic Dam Expansion Draft Environmental Impact Statement 2009408
constructing roadways, including the relocated Borefield •
Road, passing bays on the Stuart Highway and Olympic Way
and the road/rail overpass north of Woomera
constructing and operating the Outer Harbor sulphur •
handling facility, the Port of Darwin concentrate handling
facility and the landing facility at Port Augusta
constructing the new airport•
constructing additional accommodation infrastructure.•
Some likely ambient air quality impacts are common to multiple
infrastructure elements, and these are discussed below in
general terms. The potential air quality impacts specific to a
particular infrastructure element are also discussed in the
following sections.
General ambient air quality impactsThe emission of dust during construction activities and from
unsealed areas during operations would be the most common
air quality issue for most off-site infrastructure. An allowance
for the use of low-quality water for dust suppression has been
made for all infrastructure projects (see Chapter 5, Description
of the Proposed Expansion, for further details).
Maximum 1-hour average Annual average
Roxby Downs
Hiltaba Village
0 2 4km
0 2 4kmReceiver limit = 158 µg/m3
Sensitive receiver
158 µg/m3 gas contourReceiver limit = 40 µg/m3
Sensitive receiver
5 µg/m3 gas contour
Figure 13.20b Predicted nitrogen dioxide equivalent ground-level concentrations (µg/m3)
Maximum 1-hour average Maximum 8-hour average
Roxby Downs
Hiltaba Village
0 2 4km
0 2 4kmReceiver limit = 30 µg/m3
Sensitive receiver
30 µg/m3 gas contourReceiver limit = 10 µg/m3
Sensitive receiver
10 µg/m3 gas contour
Figure 13.20c Predicted carbon monoxide ground-level concentrations (µg/m3)
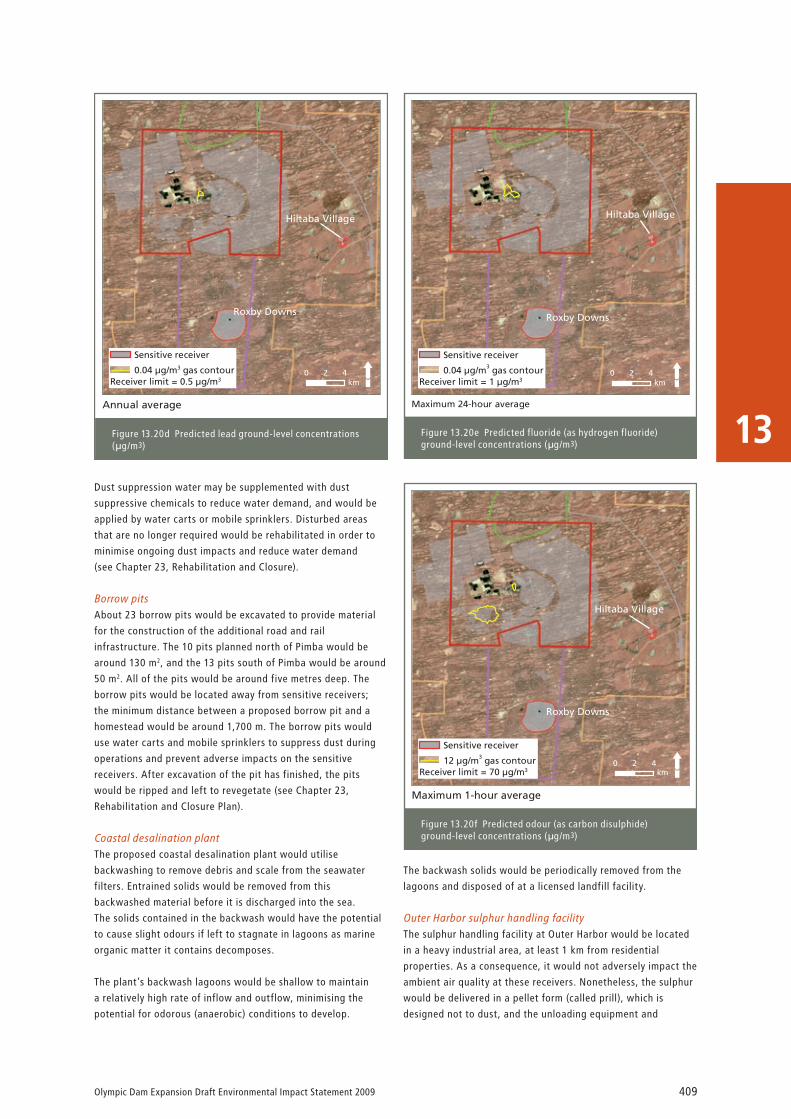
Olympic Dam Expansion Draft Environmental Impact Statement 2009 409
13Annual average
Roxby Downs
Hiltaba Village
0 2 4kmReceiver limit = 0.5 µg/m3
Sensitive receiver
0.04 µg/m3 gas contour
Figure 13.20d Predicted lead ground-level concentrations(µg/m3)
Maximum 24-hour average
Roxby Downs
Hiltaba Village
0 2 4kmReceiver limit = 1 µg/m3
Sensitive receiver
0.04 µg/m3 gas contour
Figure 13.20e Predicted fluoride (as hydrogen fluoride)ground-level concentrations (µg/m3)
Maximum 1-hour average
Roxby Downs
Hiltaba Village
0 2 4kmReceiver limit = 70 µg/m3
Sensitive receiver
12 µg/m3 gas contour
Figure 13.20f Predicted odour (as carbon disulphide)ground-level concentrations (µg/m3)
Dust suppression water may be supplemented with dust
suppressive chemicals to reduce water demand, and would be
applied by water carts or mobile sprinklers. Disturbed areas
that are no longer required would be rehabilitated in order to
minimise ongoing dust impacts and reduce water demand
(see Chapter 23, Rehabilitation and Closure).
Borrow pitsAbout 23 borrow pits would be excavated to provide material
for the construction of the additional road and rail
infrastructure. The 10 pits planned north of Pimba would be
around 130 m2, and the 13 pits south of Pimba would be around
50 m2. All of the pits would be around five metres deep. The
borrow pits would be located away from sensitive receivers;
the minimum distance between a proposed borrow pit and a
homestead would be around 1,700 m. The borrow pits would
use water carts and mobile sprinklers to suppress dust during
operations and prevent adverse impacts on the sensitive
receivers. After excavation of the pit has finished, the pits
would be ripped and left to revegetate (see Chapter 23,
Rehabilitation and Closure Plan).
Coastal desalination plantThe proposed coastal desalination plant would utilise
backwashing to remove debris and scale from the seawater
filters. Entrained solids would be removed from this
backwashed material before it is discharged into the sea.
The solids contained in the backwash would have the potential
to cause slight odours if left to stagnate in lagoons as marine
organic matter it contains decomposes.
The plant’s backwash lagoons would be shallow to maintain
a relatively high rate of inflow and outflow, minimising the
potential for odorous (anaerobic) conditions to develop.
The backwash solids would be periodically removed from the
lagoons and disposed of at a licensed landfill facility.
Outer Harbor sulphur handling facilityThe sulphur handling facility at Outer Harbor would be located
in a heavy industrial area, at least 1 km from residential
properties. As a consequence, it would not adversely impact the
ambient air quality at these receivers. Nonetheless, the sulphur
would be delivered in a pellet form (called prill), which is
designed not to dust, and the unloading equipment and

Olympic Dam Expansion Draft Environmental Impact Statement 2009410
associated conveyors and transfer points would be fully
enclosed to prevent the release of dust. The sulphur prill would
also be stored in a covered shed facility. Sulphur prill emits
little-to-no odour, and therefore presents negligible potential
odour impact to nearby sensitive receivers.
Port of Darwin concentrate handling facilityThe facilities at the Port of Darwin for the export of concentrate
would be designed specifically to manage fugitive dusts in
order to keep potential radiation exposures as low as
reasonably achievable. The concentrate handling facility would
be a closed system; that is, the conveyors, transfer points,
loading and unloading facilities and storage areas would be
enclosed and suitably ventilated. As a result of this design,
there would be a negligible adverse air quality impact on
nearby sensitive receivers (see Appendix E4 for details).
national pollutant inventory
Additional reporting thresholds under the National Pollutant
Inventory (NPI) scheme would be triggered by the proposed
expansion because it is, in general, a scaled version of the
existing metallurgical, mining and quarrying facility, which
already uses a significant volume of reagents. The emissions
volumes presently reported would, however, increase in line
with production.
13.4 findinGs and conclusions
13.4.1 Greenhouse Gas
The assessment of the potential increase in greenhouse gas
emissions for the proposed expansion has identified the sources
and quantified the volumes of greenhouse gases likely to be
emitted. Potential mitigation measures that could reduce
greenhouse gas emissions from the proposed expansion have
also been identified.
It is estimated that at full operating capacity (of 60 Mtpa of
ore), a peak of 4.7 Mtpa of greenhouse gases (with an NGER-
reportable component of 3.3 Mtpa) would be emitted as a
result of the proposed expansion, in addition to the existing
greenhouse gas emission of 1.1 Mtpa. This includes the positive
effects of the addition of a cogeneration plant which would use
waste heat to generate electricity, saving about 1.2 Mtpa of
CO2-e emissions and the use of renewable electricity, contracted
through the NEM, for the coastal desalination plant. In terms of
emissions intensity, measured as a function of the mass of ore
milled per annum, the increased size of the operation is
predicted to result in a decrease from around 105 kg of CO2-e
per tonne of ore milled to about 79 kg of CO2-e per tonne of ore
milled over the long term, following an initial increase to 119 kg
of CO2-e per tonne of ore milled during the early mining
operations when large quantities of mine rock but little ore are
being moved.
Greenhouse gas emissions for the expanded operation are
predicted to represent about 7–10% of South Australia’s future
greenhouse gas emissions, 0.5–0.75% of Australian future
greenhouse gas emissions and around 0.01% increase in future
global emissions. Although these proportions are relatively
small, the residual impacts of greenhouse gas emissions have
been categorised as high, representing a long-term state-wide
impact.
BHP Billiton is negotiating a Sectoral Agreement with the South
Australian Government setting out the objectives and strategies
for greenhouse gas emission abatement.
13.4.2 air quality
The assessment of the potential air quality impacts of the
proposed expansion has identified the location and properties
of potential additional airborne emission sources, and
assessed them against state and national legislation, standards
and guidelines.
In general, improvements to process technology enable the
scaled-up process facilities to meet criteria for emissions to
air and ground level air quality under normal operations for
sulphur dioxide, oxides of nitrogen, lead, fluoride and carbon
disulphide (odour).
The modelled air quality impacts for particulates on sensitive
receptors around the expanded operation meet criteria for all
indicators except the 24-hour criterion for PM10 (predicted to be
exceeded at Roxby Downs and Hiltaba Village on between five
and ten days per year).
Dust suppression methods will generally prevent PM10
exceedances, but operational control via a dust management
system would be implemented to cope with occasionally severe
dusting conditions. The dust management system has two
elements, namely:
pre-emptive particulate controls which would involve •
suppressing dust on haul roads and covering conveyors and
conveyor transfer points to minimise dust lift-off from
vehicle traffic
a real-time response system which would be used to monitor •
the weather and fugitive particulates around the mine and
towards sensitive receptors such as Roxby Downs and
Hiltaba Village, identify impending exceedances and direct
remedial action at specific dust sources. This may include
periods during which significant dust generating activities
are postponed.
The dust suppression and operational response measures
proposed for the expansion project work at existing mines.
On this basis, the residual air quality impacts of dust are
predicted to be moderate. It is acknowledged that dust
nuisance to residents of Roxby Downs and Hiltaba Village may
occur, and education materials would be provided, and
corrective actions applied, as appropriate.
The ground level concentrations of all other investigated
substances, including odour, would comply with air quality
criteria in all cases, resulting in a low residual impact requiring
no further mitigation.

Olympic Dam Expansion Draft Environmental Impact Statement 2009 411
13
Sources of particulate emissions include the open pit
Covered conveyors would reduce dust
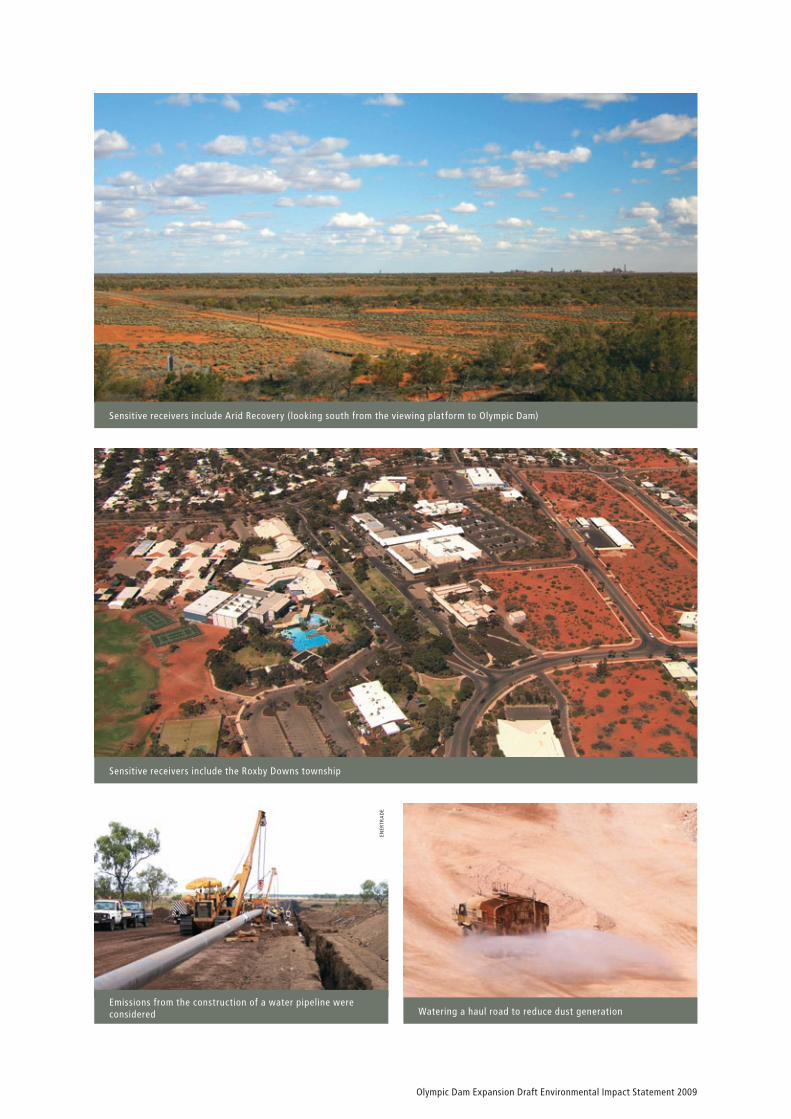
Olympic Dam Expansion Draft Environmental Impact Statement 2009412
Watering a haul road to reduce dust generationEmissions from the construction of a water pipeline were considered
ENER
TRA
DE
Sensitive receivers include the Roxby Downs township
Sensitive receivers include Arid Recovery (looking south from the viewing platform to Olympic Dam)