green star – healthcare v1 greenhouse gas emissions calculator guide star... · ·...
TRANSCRIPT

Green Star HealtHcare v1 GreenHouSe GaS emiSSionS calculator Guide
July 2010reviSion b

1Date Issued: July 2010
TABLE OF CONTENTS1.0 INTRODUCTION 3
2.0 GLOSSARY 3
3.0 REQUIREMENTS FOR SIMULATION 3
3.1 Simulation software requirements 4
3.2 Overview of the simulation of the Proposed and Reference Building performance 4
3.3 Simulation guidelines for each parameter for the Proposed and Reference Building 5
4.0 HOW THE POINTS ARE CALCULATED 8
5.0 DOCUMENTATION REQUIREMENTS FOR A GREEN STAR SUBMISSION 11
6.0 REFERENCES 14
APPENDIX A – INTERNAL HEAT LOAD AND OCCUPANCY AND OPERATIONAL PROFILES 15
APPENDIX B – LIFT ENERGY CONSUMPTION METHODOLOGY 29
APPENDIX C – GREENHOUSE GAS EMISSIONS FACTORS 32
2Date Issued: July 2010
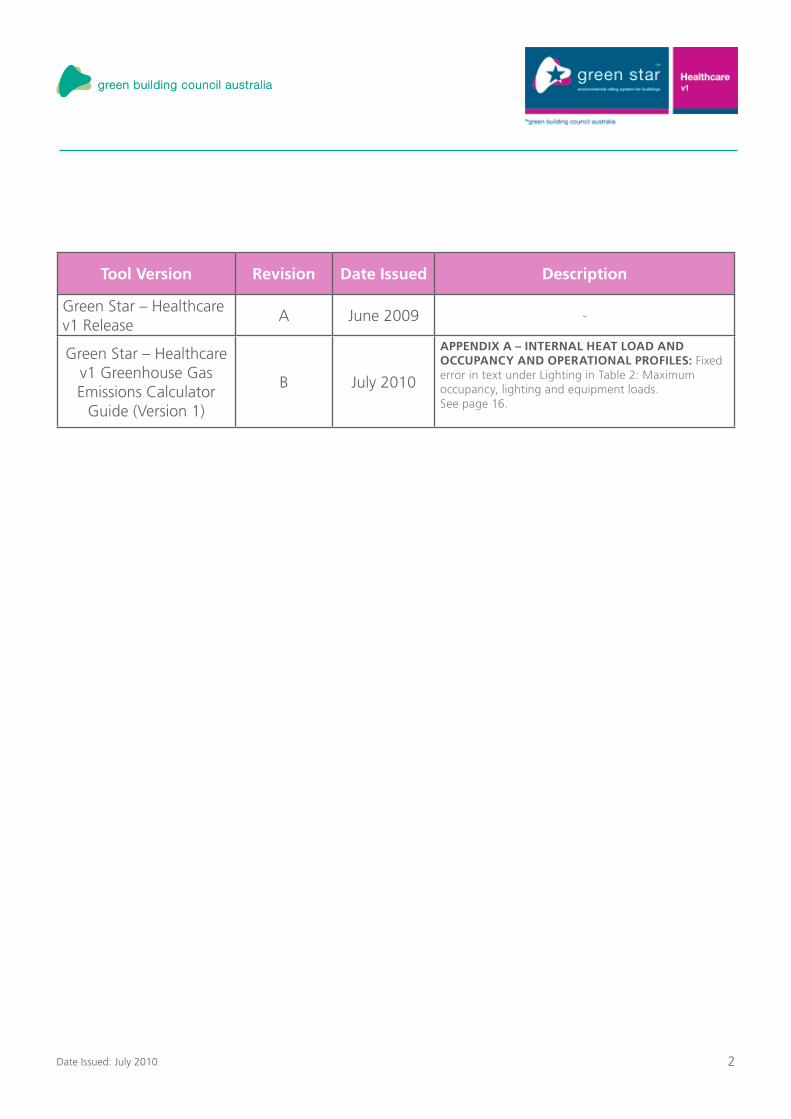
Tool Version Revision Date Issued Description
Green Star – Healthcare v1 Release
A June 2009 -
Green Star – Healthcare v1 Greenhouse Gas Emissions Calculator
Guide (Version 1)
B July 2010
APPENDIX A – INTERNAL HEAT LOAD AND OCCUPANCY AND OPERATIONAL PROFILES: Fixed error in text under Lighting in Table 2: Maximum occupancy, lighting and equipment loads. See page 16.

3Date Issued: July 2010
1.0 – Introduction
2.0 – Glossary
This document explains how the greenhouse gas emissions of a proposed healthcare facility are assessed for purposes of the Ene-1 ‘Greenhouse Gas Emissions’ credit. It explains how the energy consumption of the ‘Proposed Building’, along with a ‘Reference Building’ needs to be modelled using dynamic simulation. It then explains how the results of this modelling are used to determine the greenhouse gas emissions of the Proposed and the Benchmark Buildings (see Glossary) and hence, the number of points awarded.
Projects are awarded points for each 5% reduction in emissions on the Benchmark building (the Benchmark building is 10% more efficient than the ‘Reference building’).
This method minimises the additional work required to be undertaken by design teams, whilst maximising the accuracy of the calculation method. To achieve this aim, where possible, the modelling methodology described in this document is identical to modelling methodology required for demonstrating compliance with Section J of the Building Code of Australia (BCA) using the JV3 verification methodology.
Where the GBCA received feedback that the JV3 methodology was not appropriate for that building type, or where particular energy saving measures were not being recognised by the methodology, we have altered the methodology.
Note: Throughout this document, wherever the BCA is referenced, the version applicable to the project is the BCA 2008, or later. When quoted, the clause numbers are from BCA 2008 Volume 1.
Proposed Building: The building, as designed and modelled by the project team.
Reference Building: A hypothetical building based predominantly on the BCA Section J Deemed-to-Satisfy provisions.
Benchmark Building: A building modelled to be 10% more efficient over the Reference Building. Points are awarded where the emissions from the Proposed Building are lower than the Benchmark Building’s emissions.
3.0 – Requirements for specification
The Green Star – Healthcare v1 Greenhouse Gas Emissions Calculator requires the energy consumption from the Proposed Building along with a ‘Reference Building’ to be calculated using simulation software. This chapter provides details on what simulation software should be used, and how each component of the Proposed and Reference Buildings should be modelled.

4Date Issued: July 2010
3.1 – Simulation software requirements
3.2 – Overview of the simulation of the Proposed and Reference Building performance
As with the BCA Specification JV, the energy consumption from the Proposed and Reference Building ‘must be calculated using a thermal calculation method that complies with the ABCB Protocol for Energy Analysis Software 2006.1’ (BCA Specification JV, clause 2.(f)).
The annual energy consumption from the Proposed Building should be modelled in accordance with the BCA Section JV3 verification methodology. The exceptions to this include the following:
The climate file – where a climate file as described in Table 1 is used;•
The occupancy and operational profiles – where those provided in Appendix B must be used for both the Proposed • Building and the Reference Building. However, if the project team wishes to use alternative profiles, they must submit a Credit Interpretation Request (CIR). Please note that if alternative profiles are approved, the same profiles must still be used for the Proposed and Reference
buildings;
The percentage of electricity generated on-site from sources that do not emit greenhouse gases (such as solar and wind) • where 100% of the energy generated may be used to reduce the calculated annual energy consumption of the building. This is a change from BCA 2008 Specification JV, clause 2 (e) which limits the reduction to 50% of the energy generated on-site. As with the BCA, Co-generation can also be modelled at 100%.
All parameters used in the modelling the Proposed Building should be consistent with the design documents.
The modelling requirements for the Reference Building are also predominantly in accordance with the BCA JV3 verification methodology. As described in the BCA JV3 verification methodology, the Proposed Building and Reference Building must be calculated with the same calculation method (as defined above); physical model; internal heat gains; occupancy and operational profiles; servicing requirements; HVAC zoning; and in the same location with the same environmental conditions. The building envelope performance, HVAC plant performance and lighting lamp power or illumination power density must be based on the BCA Deemed-to-Satisfy criteria. The exceptions to using the JV3 verification methodology for the Reference Building include the following:
The Reference Building HVAC system type must be the system type given in ASHRAE 90.1:2007, Appendix G, Section G3.1.1. •
However, as noted above, the HVAC plant performance parameters must be in accordance with BCA.

5Date Issued: July 2010
3.3 – Simulation guidelines for each parameter for the Proposed and Reference Building
No.Proposed Building modelling
requirements
Reference Building modelling
requirements
1. Thermal calculation method
As BCA Specification JV, clause 2.(f), a thermal calculation method that complies with the ABCB Protocol for Energy Analysis Software 2006.1’
As Proposed Building (as BCA Section J, JV3 (b)(ii)(A))
2. Location (selection of climate file)
A Test Reference Year (TRY) if the building location is within 50km of a TRY location; orIn the absence of local TRY weather data, an actual year of recorded weather data from a location within 50km of the building location; orIn the absence of TRY or actual weather data within 50km, interpolated data based upon 3 points within 250km of the building location.
Please contact the Green Building Council of Australia for approval of alternative climate files if the project cannot comply with any of the above options.
As Proposed Building (as BCA Section J, JV3 (b) (ii) (B))
3. Adjacent structures and features
As BCA Section J, JV3 (b) (ii) (C)), overshadowing from the surrounding environment must be taken into account in the model.
As Proposed Building (as BCA Section J, JV3 (b) (ii) (C))
4.Environmental conditions As BCA Section J, JV3 (b) (ii) (D))As Proposed Building (as BCA Section J, JV3 (b) (ii) (D))
5.OrientationThe representation of Proposed Building orientation shall be consistent with the design documents.
As Proposed Building (as BCA Section J, JV3 (b) (ii) (D))
6. Geometric model The representation of Proposed Building’s geometry shall be consistent with the design documents.
As Proposed Building (as BCA Section J, JV3 (b) (ii) (F, G, H, I, J, K, L, M, N, O))
7. Building envelope
The simulation of the Proposed Building envelope shall be consistent with the design documents.
Note: Manual fenestration shading devices such as blinds or shades shall not be modelled.
BCA Deemed-to-Satisfy provisions (see BCA Section J, JV3 (b) (i) (A))
Table 1: Modelling requirements for calculating the Proposed and Reference Building energy consumption

6Date Issued: July 2010
No.Proposed Building modelling
requirements
Reference Building modelling
requirements
8. Internal heat gainsThe internal heat gains from occupants, lighting and equipment given in Appendix B must be used.
As Proposed Building. (BCA Section J, JV3 (b) (ii) (S))
9. Occupancy, lighting and equipment profiles.
The occupancy and operational profiles given in Appendix B must be used.
If the project team wishes to use alternative profiles, they must submit a Credit Interpretation Request (CIR). Please note that if alternative profiles are approved, the same profiles must still be used for the Proposed and Reference Buildings.
As Proposed Building. (BCA Section J, JV3 (b) (ii) (U))
10. HVAC zonesThe simulation of the Proposed HVAC zones shall be consistent with the design documents.
As Proposed Building. (BCA Section J, JV3 (b) (ii) (T))
11. HVAC system As BCA Specification JV, clause 2 (a)
The HVAC system type must be as specified in ASHRAE Standard 90.1, Appendix G :“The HVAC system type(s) in the [Reference Building design] shall be of the type and description specified in Section G3.1.1.
All the deemed-to-satisfy requirements of J5 must be complied with for the Reference Building system type, and must modelled in accordance with Specification JV, clause 2 (a).
12. Artificial internal lighting As BCA Specification JV, clause 2.(b).
Maximum lamp power or maximum illumination power as specified in the Deemed-to-Satisfy Provisions, without any occupancy or daylight sensors; corridor timers; dimming systems; or dynamic lighting control devices (BCA Section J, JV3 (b) (i) (A & C)).
Required lighting levels as Proposed Building. (BCA Section J, JV3 (b) (ii) (R))
13. Domestic hot water systems As BCA Specification JV, clause 2.(d) As BCA Section J, JV3 (b) (ii) (W)).
14. On-site energy generation from sources that do not emit greenhouse gases such as solar and wind
100% of the energy generated on-site from sources that do not emit greenhouse gases, such as solar and wind may be used to reduce the calculated annual energy consumption of the building.
The modelling methodology to be used must be Proposed by the design team in the form of a CIR.
None

7Date Issued: July 2010
No.Proposed Building modelling
requirements
Reference Building modelling
requirements
15. LiftsModelled using the modified Draft ISO standard calculation methodology detailed in Appendix A
Modelled using the modified Draft ISO standard calculation methodology detailed in Appendix A
16. Other energy consumption
Any other energy consumed on site for base building facilities, such as a water recycling treatment plant, or escalators and travelators, should be calculated by the design team and included.
All assumptions used in the calculation must be provided in the documentation and justified.
None
17. Internal equipment/ process load
The energy consumed by medical/office equipment directly, is not included in the assessment. This energy consumption is related to the function of the building rather than the physical attributes of the building fabric and services which is being assessed in this credit.
Please note however, that approximated internal heat loads resulting from equipment use must be included in the simulation of the HVAC energy consumption as described points 8 and 9 of this table.
As Proposed Building

8Date Issued: July 2010
4.0 – How the points are calculatedUp to twenty points are awarded where it is demonstrated that the building’s predicted greenhouse gas emissions have been reduced below that of the ‘Benchmark Building’. The Benchmark building is 10% more efficient than the Reference Building.
The number of points is established as follows:
The design team enters the annual energy consumption from the Proposed Building and the Reference Building into the Green 1. Star – Greenhouse Gas Calculator (the calculator) as shown in below:
Select the energy source for each end use.
Enter electricity generated on-site from co-generation, tri-generation and renewable sources.
Enter the annual energy consumption for the Proposed and Reference Buildings in terms of kWh of electricity and MJ of fuel.
The emissions by end use are presented here for the Proposed and Reference buildings.
Figure 1: Energy consumption and generation section of the excel tool

9Date Issued: July 2010
The calculator multiplies the energy consumption by appropriate GHG emissions factors to determine the annual GHG emissions 2. from both the Proposed and Reference Building. GHG emissions factors used are from the National Greenhouse Accounts (NGA) Factors, Department of Climate Change (DCC), current at the time of release. See Appendix B for a full description of the emissions factors used;
The calculator then multiplies the GHG emission from the Reference Building by 90% to determine the Benchmark building 3. emissions.
The calculator then compares the emissions from the Proposed and Benchmark building as follows to determine the percentage reduction in GHG emissions.
For each 5% improvement on the Benchmark building, one point is awarded, up to a maximum of 20 for a 100% reduction.
Benchmark building GHG emissions = Reference Building GHG emissions(as calculated through simulation) x 90%
Percentage reduction in greenhouse gas emissions =
(Reference Building GHG emissions - Benchmark building GHG emissions)
Benchmark building GHG emissions
Percentage reduction in
Greenhouse Gas Emissions (%)Points
Awarded
0 0
5 1
10 2
15 3
20 4
25 5
30 6
35 7
40 8
45 9
50 10
55 11
60 12
65 13
70 14
75 15
80 16
85 17
90 18
95 19
100 (Zero net operating emissions) 20

10Date Issued: July 2010
These figures followed by the number of points and whether or not the building meets the conditional requirement, are then presented as shown in Figure 2 below.
Figure 2: Results section of the excel tool.

11Date Issued: July 2010
5.0 – Documentation guidelines for a
Green Star submission
The energy modelling report must be prepared in accordance with the Green Star Healthcare v1 Greenhouse Gas Emissions Guide and must clearly:
Identify all default values used (e.g. occupant density);•
Identify all of the design-driven inputs referencing drawings, schedules and • specifications. Whenever assumptions are used, they must be justified and conservative; andCorrespond to the design. •
All other aspects of the building must have been modelled correctly, with no significant compromises made. If these requirements are not met, then the reasons for this will need to be adequately justified.
The Energy Modelling Report must include as a minimum the information detailed below:
1) Executive Summary The executive summary must including at a minimum:• AnoverviewoftheProposedBuildingincluding:
a description of all systems installed and their environmental performance; -a description of energy saving features; and -a brief description of the control strategy of the building’s systems. -
• AbriefoverviewofthemainattributesoftheReferenceBuilding;A summary of energy consumption for the proposed and Reference Buildings by end use and fuel type.•
2) Simulation package and model descriptionThe simulation and model brief must include at a minimum:• Confirmationthatthesimulationpackagecomplieswithoneofthefollowingstandards:
- BESTEST (US NREL, 2005); or- The European Union draft standard EN13791 July 2000; or- Be certified in accordance with ANSI/ASHRAE Standard 140-2001.
• Confirmationthatthebuildingperformanceisanalysedonanhourlybasisforafullyear;• Detailsoftheweatherdatafileselected(typeofdataandweatherstationlocation);• Adescriptionofthesimulationpackage’saccuracyatrepresenting:
- The proposed and reference HVAC systems;- The HVAC controls which are to be used;- Glazing on the building – whether the model represents glazing as only a U-value and shading coefficient;- The performance curves and sizes for plant items; and- The daylighting effects and the operation of daylight controls.
• Adescriptionofanycompromisesmadeinregardstothemodellingofthebuildingandwhateffecttheyhaveontheresults.

12Date Issued: July 2010
3) Schedule of inputsA schedule of inputs should be provided for both the reference and Proposed Buildings, and should include, but not be limited to:• Areascheduleindicatingtheoccupantdensity,internalloadsforequipment,internalloadsforpeopleandprofilechosenforeach
space, or typical space; • Buildingfabric;
- Building form, including any simplifications and their effect;- Orientation;- Insulation;- Glazing;- Shading (window shading and external building fabric) and overshadowing;- Window and spandrel sizes; and- Infiltration.
• HVAC;- Heating system selection, including any reheat limits;- Cooling system selection; and- Air handling and ventilation system description, including air flow rates, system static pressure, fan maximum total motor shaft
power and fan motor power to air flow rate ratio.• Lighting(foreachspace,ortypicalspace);
- Average lighting levels;- Light power density; and- Lighting controls;
• HotWater;• Mechanicalventilation,liftsandotheramenities;and• On-siteelectricitygeneration.
4) Reference and Proposed Building energy simulation details and results
The following must be provided for both the Reference Building and the Proposed Building.
• HVACenergysystems;- Space Type Breakdown, including:- Details of the area (m2), space type and profile selection for each area of the building. - Confirmation that the lighting power density, equipment power density, occupancy load and occupancy and operational
profiles were used as per the Green Star – Healthcare Greenhouse Gas Emissions Calculator Guide for each space, or typical space type.
- HVAC System: Detailing, and including supporting documentation of, how the following aspects of the HVAC system have been modelled/represented in the model:
- HVAC system design;- Air-conditioning zones;- Chiller plant, including the chiller plant size and details on the efficiency curves that have been used and details on how the
chiller data is relevant to the intended condenser water temperature controls;- Boiler plant;- Supply air and exhaust fans, including details on how the index run pressure drops have been calculated and modelled and
including:Fan Maximum Total Motor Shaft Power °Maximum Fan Motor Power to Air Flow Rate Ratio °System static pressure °

13Date Issued: July 2010
- Cooling tower fans; and- Cooling tower and condenser water pumping.- Building Environmental Control Strategy including:- A clear description of the overall control systems. The description must include an analysis of the benefits and conflicts of
having these control strategies working alongside each other;- Control(s) of any building envelope elements (glazing, shading devices, etc); - Lighting/daylighting interaction(s); and - Air / plant side HVAC control(s); detailing, and including supporting documentation describing how the following aspects of
the HVAC controls have been modelled/represented in the model:Outside air flow; °Economy cycle; °Primary duct temperature control, including details on how design temperatures and setpoints have been modelled; °Airflow control; °Minimum turndown; °Chiller staging; and °Temperature control bands. °
- A/C Pumping: Detailing, and including supporting documentation describing how the following have been calculated:- Pump maximum motor shaft power; and- Chilled water energy efficiency ratio for the selected cooling equipment (refrigerant chillers or packaged equipment);
Type of equipment used for each area; °Energy efficiency ratio for the selected cooling equipment (refrigerant chillers or packaged equipment). °
- Heating hot water thermal efficiency of the selected water heaterRated capacity °Fuel type °Thermal efficiency of the selected water heater °
- HVAC simulation outputs.• Lighting: Detailing the energy use calculations, and including supporting documentation for each space, or typical space,
including:- The lighting power density;- The lighting controls systems and their energy use; and- The operational profiles used.
• HotWater:Detailingtheenergyusecalculationsforallhotwatersystems,andincludingsupportingdocumentationsuchassystemefficiency and fuel type.
• Mechanicalventilation,liftsandotheramenities:Detailingtheenergyusecalculations,andincludingsupportingdocumentationfor:- Lifts including lift motor rating and stand-by power;- Car park ventilation; and- Any other energy use such as travelators, escalators, water reuse systems, etc.
• ElectricityGenerationDetailing,andincludingsupportingdocumentationdescribinghowthefollowinghasbeenmodelledincludingall operational assumptions (e.g. solar/wind and other fuel resources):- Renewable energy systems; and- Co-generation, tri-generation systems.

14Date Issued: July 2010
5.0 – ReferencesAustralian Building Codes Board (ABCB) (2008), Volume One Class 2-9 Buildings, BCA 2008, Australian Building Codes Board, •Australia.
Australian Building Codes Board (ABCB) (2006), Protocol for Energy Analysis Software 2006.1, http://www.abcb.gov.au/index.•cfm?objectid=6928102C-F27E-4834-0B94E42A0568F11B, accessed June, 2009.
American Society of Heating, Refrigerating and Air-Conditioning Engineers (ASHRAE) (2007), Energy Standard for Buildings •Except Low-Rise Residential Buildings (SI Edition), ASHRAE Standard 90.1-2007 SI Edition, http://www.ashrae.org/technology/page/548, accessed June, 2009.
Barney, G. (2007), ‘Energy efficiency of lifts – measurement, conformance, modelling, prediction and simulation’ (presentation), •www.cibseliftsgroup.org/CIBSE/papers/Barney-on-energy%20efficiency%20of%20lifts.pdf, accessed June, 2009.
Department of Climate Change (DCC), The National Greenhouse Accounts (NGA) Factors, http://www.climatechange.gov.au/•workbook, accessed June, 2009.
International Organization for Standardization (ISO) (2008), Energy performance of lifts and escalators - Part 1: Energy •measurement and conformance, ISO/DIS 25745-1: 2008 (Draft standard - currently under development), International Organization for Standardization, Geneva.
New South Wales Health (NSW Health) (2007), Technical Series 11: Engineering Services and Sustainable Development •Guidelines, www.healthfacilityguidelines.com.au, accessed June 2008
Standards Australia (SA) (2002), AS 1668.2—2002, Australian Standard, The use of ventilation and airconditioning in buildings, •Part 2: Ventilation design for indoor air contaminant control (excluding requirements for the health aspects of tobacco smoke exposure).

15Date Issued: July 2010
Appendix A – Internal heat load, occupancy and operational profiles

16Date Issued: July 2010
This appendix contains the internal heat loads and occupancy and operational profiles which need to be applied to each zone within the healthcare facility under assessment. The same heat loads and occupancy and operational profiles should be used for both the Proposed and Reference Buildings.
Note: When calculating the energy consumption of the lighting of the facility, the lighting profile in this Appendix should be used in conjunction with the lighting densities as per the lighting specification.
Maximum occupancy, lighting and equipment heat loads
The maximum occupancy, lighting and equipment heat load figures to be used are those required for use are given in Table 2 below. These heat loads should be used in combination with the occupancy and operational profiles given below.
For all space types excluding
operating suitesOperating suites only
Occupancy The occupancy densities that must be used are those stipulated in the Australian Standard, AS 1668.2—2002, (SA, 2002).
Metabolic rate The metabolic rates that must be used are as required for JV3 (75W sensible and 55W latent).
LightingAs required for JV3, lighting loads are the maximum illumination power densities permitted under Part J6.
25W/m2
EquipmentAs required for JV3, the equipment loads are those give in Table 2h: Internal heat gains for appliances and equipment.
40W/m2
Table 2: Maximum occupancy, lighting and equipment loads
The profiles provided include:
1. General areas - 12 hours; 2. General areas - 24 hours;3. Operating room suite – 12 hours; 4. Operating room suite – 24 hours;5. Emergency; 6. Wards; 7. Kitchen; 8. Transitory spaces – 12 hours; 9. Transitory spaces – 24 hours; and 10. Back of house.
A description of each profile, along with examples of typical spaces which would use it, follows.
Occupancy and operational profiles
The profiles, which must be used in combination with the heat load figures given in Table 2, have been developed with reference to the profiles given in BCA Specification J, the profiles given in the NSW Health publication, Engineering Services and Sustainable Development Guidelines, TS11 v2.0 (NSW Health, 2007) and with input from industry. These profiles provide typical hours of operation for the majority of healthcare space types.
The simulator should choose the profile most appropriate profile for each space within the healthcare facility. If none of the profiles provided give a reasonable estimation of the expected hours of operation of a particular space, the design team should submit a Credit Interpretation Request (CIR) to the GBCA.

17Date Issued: July 2010
General areas - 12 hour
The ‘General Areas – 12 hour’ profile should be used for all:
• Areasthatoperateduringthedayonly(excluding12–houroperatingsuites,corridors,kitchensorback-ofhouseareas;separate profiles have been specifically developed specifically for those space types).
This profile is typical of the operation of a large number of small healthcare facility spaces. It may also be appropriate for a number of hospital spaces. This profile can be applied to spaces that operate for five or seven days of the week.
Examples of space types which would use this profile for five days of the week include office areas, outpatients, waiting areas, consulting areas, diagnostic areas, medical records, pathology, pharmacy, auditoriums and seminar rooms.
Examples of space types which would use this profile for seven days of the week include cafes and the hospital main receptions.
TimeOccupancy
(%)
Artificial
lighting (%)
Appliances and
equipment (%)Plant Operation
12am – 1am 0% 10% 10% Off
1am – 2am 0% 10% 10% Off
2am – 3am 0% 10% 10% Off
3am – 4am 0% 10% 10% Off
4am – 5am 0% 10% 10% Off
5am – 6am 0% 10% 10% Off
6am – 7am 0% 10% 15% Off
7am – 8am 15% 40% 25% On
8am – 9am 50% 80% 70% On
9am – 10am 70% 100% 100% On
10am – 11am 70% 100% 100% On
11am – 12pm 70% 100% 100% On
12pm – 1pm 70% 100% 100% On
1pm – 2pm 70% 100% 100% On
2pm – 3pm 70% 100% 100% On
3pm – 4pm 70% 100% 100% On
4pm – 5pm 70% 100% 100% On
5pm – 6pm 50% 80% 60% On
6pm – 7pm 15% 60% 25% On
7pm – 8pm 5% 40% 15% Off
8pm – 9pm 5% 20% 15% Off
9pm – 10pm 0% 10% 10% Off
10pm – 11pm 0% 10% 10% Off
11pm – 12am 0% 10% 10% Off
Table 3: General areas - 12 hour

18Date Issued: July 2010
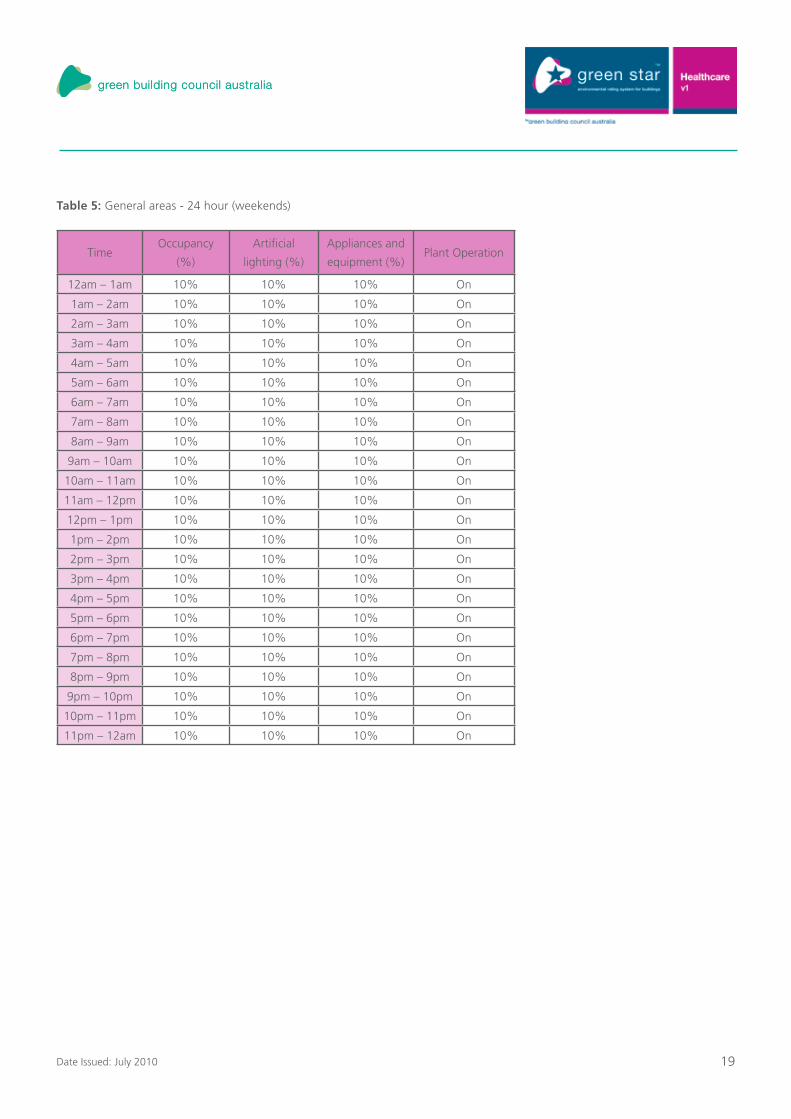
General areas - 24 hour
The ‘General Areas – 24 hour’ profiles should be used for:
• Areasthatareconditionedfor24hoursaday,sevendaysaweekandthathavepeakoperationforfivedaysoftheweekand reduced operation over night and at the weekends.
Two profiles are provided; one that should be used for the weekdays and the other that should be used for the weekends.
These profiles are typical of the operation of a large number of hospitals space types. They may also be appropriate for some spaces in smaller healthcare facilities. Examples of spaces that would use these profiles include medical imaging, recovery, central sterilising services department, pathology and pharmacy areas, within a hospital.
TimeOccupancy
(%)
Artificial
lighting (%)
Appliances and
equipment (%)Plant Operation
12am – 1am 10% 10% 10% On
1am – 2am 10% 10% 10% On
2am – 3am 10% 10% 10% On
3am – 4am 10% 10% 10% On
4am – 5am 10% 10% 10% On
5am – 6am 10% 10% 10% On
6am – 7am 10% 10% 10% On
7am – 8am 15% 40% 25% On
8am – 9am 60% 80% 70% On
9am – 10am 70% 100% 100% On
10am – 11am 70% 100% 100% On
11am – 12pm 70% 100% 100% On
12pm – 1pm 70% 100% 100% On
1pm – 2pm 70% 100% 100% On
2pm – 3pm 70% 100% 100% On
3pm – 4pm 70% 100% 100% On
4pm – 5pm 70% 100% 100% On
5pm – 6pm 50% 70% 70% On
6pm – 7pm 15% 30% 30% On
7pm – 8pm 10% 10% 10% On
8pm – 9pm 10% 10% 10% On
9pm – 10pm 10% 10% 10% On
10pm – 11pm 10% 10% 10% On
11pm – 12am 10% 10% 10% On
Table 4: General areas - 24 hour (weekdays)
19Date Issued: July 2010
TimeOccupancy
(%)
Artificial
lighting (%)
Appliances and
equipment (%)Plant Operation
12am – 1am 10% 10% 10% On
1am – 2am 10% 10% 10% On
2am – 3am 10% 10% 10% On
3am – 4am 10% 10% 10% On
4am – 5am 10% 10% 10% On
5am – 6am 10% 10% 10% On
6am – 7am 10% 10% 10% On
7am – 8am 10% 10% 10% On
8am – 9am 10% 10% 10% On
9am – 10am 10% 10% 10% On
10am – 11am 10% 10% 10% On
11am – 12pm 10% 10% 10% On
12pm – 1pm 10% 10% 10% On
1pm – 2pm 10% 10% 10% On
2pm – 3pm 10% 10% 10% On
3pm – 4pm 10% 10% 10% On
4pm – 5pm 10% 10% 10% On
5pm – 6pm 10% 10% 10% On
6pm – 7pm 10% 10% 10% On
7pm – 8pm 10% 10% 10% On
8pm – 9pm 10% 10% 10% On
9pm – 10pm 10% 10% 10% On
10pm – 11pm 10% 10% 10% On
11pm – 12am 10% 10% 10% On
Table 5: General areas - 24 hour (weekends)

20Date Issued: July 2010
Operating room suite - 12 hours
The ‘Operating room suite – 12 hours’ profile should be used for:
• Operatingsuiteareasthatwillpredominantlyoperatefivedaysperweek(Mon-Fri)for12hoursperday.Whileitmightbe expected that the operating suite may be used on weekends, this is not its expected primary use pattern.
Examples of spaces that would use this profile include general and endoscopy operating suite areas.
TimeOccupancy
(%)
Artificial
lighting (%)
Appliances and
equipment (%)Plant Operation
12am – 1am 0% 0% 15% Off
1am – 2am 0% 0% 15% Off
2am – 3am 0% 0% 15% Off
3am – 4am 0% 0% 15% Off
4am – 5am 0% 0% 15% Off
5am – 6am 0% 0% 15% Off
6am – 7am 30% 25% 25% On
7am – 8am 30% 25% 25% On
8am – 9am 50% 50% 50% On
9am – 10am 60% 100% 100% On
10am – 11am 70% 100% 100% On
11am – 12pm 70% 100% 100% On
12pm – 1pm 70% 100% 100% On
1pm – 2pm 70% 100% 100% On
2pm – 3pm 70% 100% 100% On
3pm – 4pm 60% 100% 100% On
4pm – 5pm 50% 50% 50% On
5pm – 6pm 30% 25% 25% On
6pm – 7pm 0% 0% 15% Off
7pm – 8pm 0% 0% 15% Off
8pm – 9pm 0% 0% 15% Off
9pm – 10pm 0% 0% 15% Off
10pm – 11pm 0% 0% 15% Off
11pm – 12am 0% 0% 15% Off
Table 6: Operating room suite - 12 hours
21Date Issued: July 2010
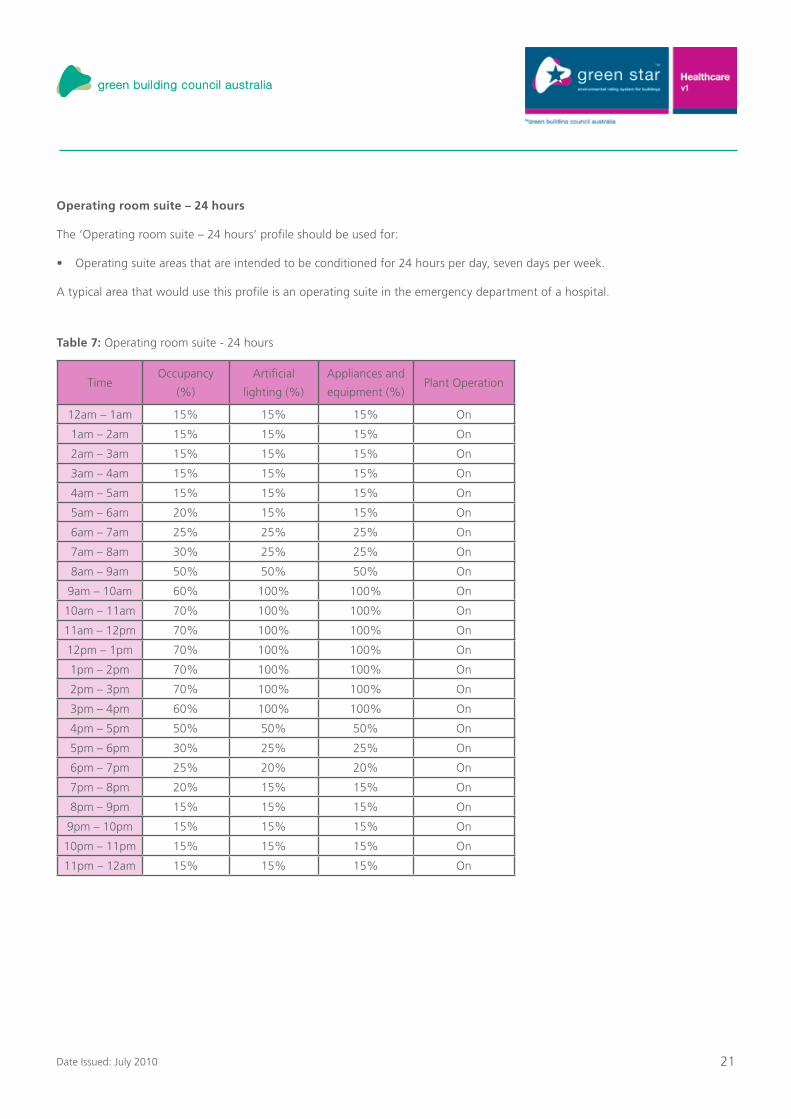
Operating room suite – 24 hours
The ‘Operating room suite – 24 hours’ profile should be used for:
• Operatingsuiteareasthatareintendedtobeconditionedfor24hoursperday,sevendaysperweek.
A typical area that would use this profile is an operating suite in the emergency department of a hospital.
TimeOccupancy
(%)
Artificial
lighting (%)
Appliances and
equipment (%)Plant Operation
12am – 1am 15% 15% 15% On
1am – 2am 15% 15% 15% On
2am – 3am 15% 15% 15% On
3am – 4am 15% 15% 15% On
4am – 5am 15% 15% 15% On
5am – 6am 20% 15% 15% On
6am – 7am 25% 25% 25% On
7am – 8am 30% 25% 25% On
8am – 9am 50% 50% 50% On
9am – 10am 60% 100% 100% On
10am – 11am 70% 100% 100% On
11am – 12pm 70% 100% 100% On
12pm – 1pm 70% 100% 100% On
1pm – 2pm 70% 100% 100% On
2pm – 3pm 70% 100% 100% On
3pm – 4pm 60% 100% 100% On
4pm – 5pm 50% 50% 50% On
5pm – 6pm 30% 25% 25% On
6pm – 7pm 25% 20% 20% On
7pm – 8pm 20% 15% 15% On
8pm – 9pm 15% 15% 15% On
9pm – 10pm 15% 15% 15% On
10pm – 11pm 15% 15% 15% On
11pm – 12am 15% 15% 15% On
Table 7: Operating room suite - 24 hours
22Date Issued: July 2010
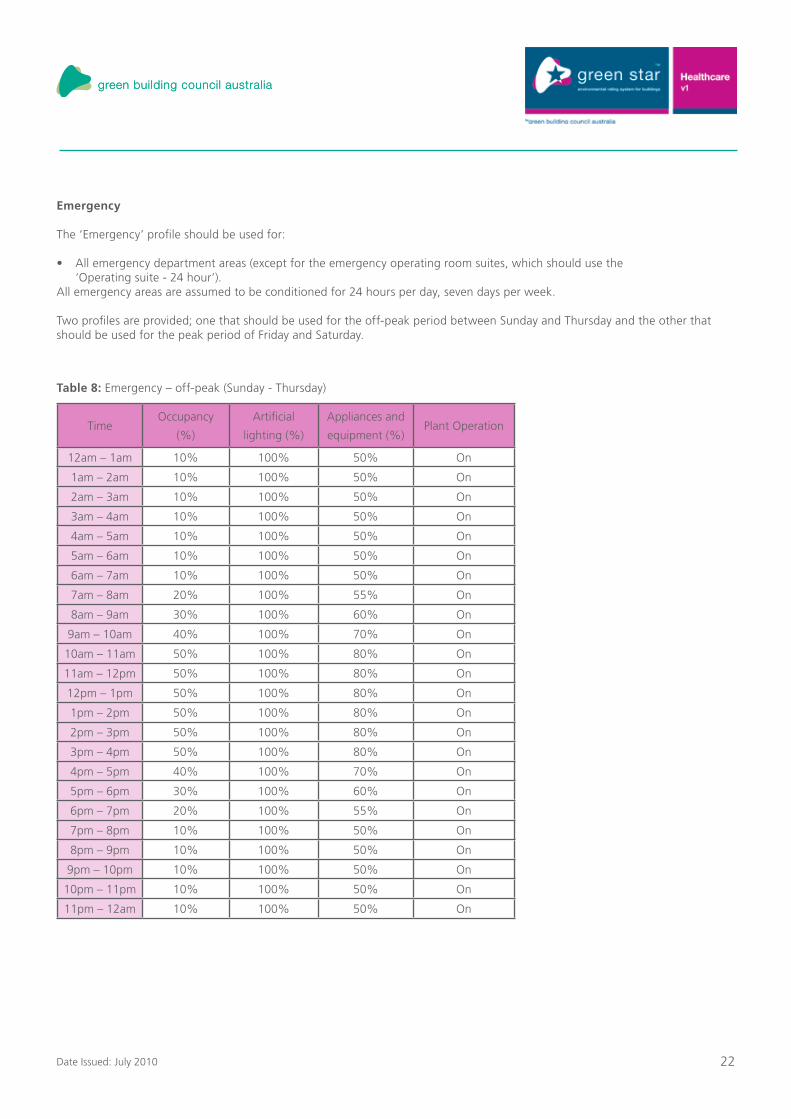
Emergency
The ‘Emergency’ profile should be used for:
• Allemergencydepartmentareas(exceptfortheemergencyoperatingroomsuites,whichshouldusethe ‘Operating suite - 24 hour’). All emergency areas are assumed to be conditioned for 24 hours per day, seven days per week.
Two profiles are provided; one that should be used for the off-peak period between Sunday and Thursday and the other that should be used for the peak period of Friday and Saturday.
TimeOccupancy
(%)
Artificial
lighting (%)
Appliances and
equipment (%)Plant Operation
12am – 1am 10% 100% 50% On
1am – 2am 10% 100% 50% On
2am – 3am 10% 100% 50% On
3am – 4am 10% 100% 50% On
4am – 5am 10% 100% 50% On
5am – 6am 10% 100% 50% On
6am – 7am 10% 100% 50% On
7am – 8am 20% 100% 55% On
8am – 9am 30% 100% 60% On
9am – 10am 40% 100% 70% On
10am – 11am 50% 100% 80% On
11am – 12pm 50% 100% 80% On
12pm – 1pm 50% 100% 80% On
1pm – 2pm 50% 100% 80% On
2pm – 3pm 50% 100% 80% On
3pm – 4pm 50% 100% 80% On
4pm – 5pm 40% 100% 70% On
5pm – 6pm 30% 100% 60% On
6pm – 7pm 20% 100% 55% On
7pm – 8pm 10% 100% 50% On
8pm – 9pm 10% 100% 50% On
9pm – 10pm 10% 100% 50% On
10pm – 11pm 10% 100% 50% On
11pm – 12am 10% 100% 50% On
Table 8: Emergency – off-peak (Sunday - Thursday)

23Date Issued: July 2010
TimeOccupancy
(%)
Artificial
lighting (%)
Appliances and
equipment (%)Plant Operation
12am – 1am 10% 100% 50% On
1am – 2am 10% 100% 50% On
2am – 3am 10% 100% 50% On
3am – 4am 10% 100% 50% On
4am – 5am 10% 100% 50% On
5am – 6am 10% 100% 50% On
6am – 7am 10% 100% 50% On
7am – 8am 20% 100% 55% On
8am – 9am 30% 100% 60% On
9am – 10am 40% 100% 75% On
10am – 11am 50% 100% 80% On
11am – 12pm 60% 100% 80% On
12pm – 1pm 60% 100% 80% On
1pm – 2pm 60% 100% 80% On
2pm – 3pm 60% 100% 80% On
3pm – 4pm 60% 100% 80% On
4pm – 5pm 70% 100% 85% On
5pm – 6pm 80% 100% 90% On
6pm – 7pm 90% 100% 95% On
7pm – 8pm 100% 100% 100% On
8pm – 9pm 100% 100% 100% On
9pm – 10pm 100% 100% 100% On
10pm – 11pm 100% 100% 100% On
11pm – 12am 100% 100% 100% On
Table 9: Emergency - peak (Friday and Saturday)

24Date Issued: July 2010
Wards
The ‘Wards’ profile should be used for:
• Allareasthatareforthecareandrecoveryofpatients(inbeds)whichareoccupied24hoursperday,sevendaysperweek. Areas that are expected to use this profile are all inpatient wards, maternity wards and critical care areas. It should also be used for the ward offices and nurse’s stations.
TimeOccupancy
(%)
Artificial
lighting (%)
Appliances and
equipment (%)Plant Operation
12am – 1am 50% 10% 70% On
1am – 2am 50% 10% 70% On
2am – 3am 50% 10% 70% On
3am – 4am 50% 10% 70% On
4am – 5am 50% 10% 70% On
5am – 6am 50% 25% 70% On
6am – 7am 50% 25% 70% On
7am – 8am 60% 80% 70% On
8am – 9am 60% 100% 70% On
9am – 10am 70% 100% 70% On
10am – 11am 70% 100% 70% On
11am – 12pm 70% 100% 70% On
12pm – 1pm 70% 100% 70% On
1pm – 2pm 70% 100% 70% On
2pm – 3pm 70% 100% 70% On
3pm – 4pm 70% 100% 70% On
4pm – 5pm 70% 100% 70% On
5pm – 6pm 60% 80% 70% On
6pm – 7pm 60% 25% 70% On
7pm – 8pm 50% 25% 70% On
8pm – 9pm 50% 25% 70% On
9pm – 10pm 50% 10% 70% On
10pm – 11pm 50% 10% 70% On
11pm – 12am 50% 10% 70% On
Table 10: Wards

25Date Issued: July 2010
Kitchen
The ‘Kitchen’ profile should be used for:
• Hospitalkitchens
The profile assumes 16 hour operation, seven days per week.
TimeOccupancy
(%)
Artificial
lighting (%)
Appliances and
equipment (%)Plant Operation
12am – 1am 0% 0% 10% Off
1am – 2am 0% 0% 10% Off
2am – 3am 0% 0% 10% Off
3am – 4am 0% 0% 10% Off
4am – 5am 0% 0% 10% Off
5am – 6am 70% 100% 100% On
6am – 7am 70% 100% 100% On
7am – 8am 70% 100% 100% On
8am – 9am 50% 50% 50% On
9am – 10am 50% 50% 50% On
10am – 11am 70% 100% 100% On
11am – 12pm 70% 100% 100% On
12pm – 1pm 70% 100% 100% On
1pm – 2pm 50% 50% 50% On
2pm – 3pm 50% 50% 50% On
3pm – 4pm 70% 100% 100% On
4pm – 5pm 70% 100% 100% On
5pm – 6pm 60% 75% 75% On
6pm – 7pm 50% 50% 50% On
7pm – 8pm 50% 50% 50% On
8pm – 9pm 50% 50% 50% On
9pm – 10pm 0% 0% 10% Off
10pm – 11pm 0% 0% 10% Off
11pm – 12am 0% 0% 10% Off
Table 11: Kitchen

26Date Issued: July 2010
Transitory spaces – 12 hours
The ‘Transitory spaces – 12 hours’ profile should be used for:
• Allspacesthatarelitandhavelowtransientoccupancyduringthedayonly.
This profile is expected to be used for corridors and stairways within healthcare facilities with daytime operation only.
Note: Waiting areas are not considered transitory spaces.
TimeOccupancy
(%)
Artificial
lighting (%)
Appliances and
equipment (%)Plant Operation
12am – 1am 0% 10% 0% Off
1am – 2am 0% 10% 0% Off
2am – 3am 0% 10% 0% Off
3am – 4am 0% 10% 0% Off
4am – 5am 0% 10% 0% Off
5am – 6am 0% 10% 0% Off
6am – 7am 0% 10% 0% Off
7am – 8am 0% 40% 0% On
8am – 9am 0% 80% 0% On
9am – 10am 0% 100% 0% On
10am – 11am 0% 100% 0% On
11am – 12pm 0% 100% 0% On
12pm – 1pm 0% 100% 0% On
1pm – 2pm 0% 100% 0% On
2pm – 3pm 0% 100% 0% On
3pm – 4pm 0% 100% 0% On
4pm – 5pm 0% 100% 0% On
5pm – 6pm 0% 80% 0% On
6pm – 7pm 0% 60% 0% On
7pm – 8pm 0% 40% 0% Off
8pm – 9pm 0% 20% 0% Off
9pm – 10pm 0% 10% 0% Off
10pm – 11pm 0% 10% 0% Off
11pm – 12am 0% 10% 0% Off
Table 12: Transitory spaces - 12 hours

27Date Issued: July 2010
Transitory spaces – 24 hours
The ‘Transitory spaces – 24 hours’ profile should be used for:
• Allspacesthatarelitandhavelowtransientoccupancy24hoursperday,sevendaysperweek.
This profile is expected to be used for corridors and stairways within a 24 hour hospital.
Note: Waiting areas are not considered transitory spaces.
TimeOccupancy
(%)
Artificial
lighting (%)
Appliances and
equipment (%)Plant Operation
12am – 1am 0% 100% 0% On
1am – 2am 0% 100% 0% On
2am – 3am 0% 100% 0% On
3am – 4am 0% 100% 0% On
4am – 5am 0% 100% 0% On
5am – 6am 0% 100% 0% On
6am – 7am 0% 100% 0% On
7am – 8am 0% 100% 0% On
8am – 9am 0% 100% 0% On
9am – 10am 0% 100% 0% On
10am – 11am 0% 100% 0% On
11am – 12pm 0% 100% 0% On
12pm – 1pm 0% 100% 0% On
1pm – 2pm 0% 100% 0% On
2pm – 3pm 0% 100% 0% On
3pm – 4pm 0% 100% 0% On
4pm – 5pm 0% 100% 0% On
5pm – 6pm 0% 100% 0% On
6pm – 7pm 0% 100% 0% On
7pm – 8pm 0% 100% 0% On
8pm – 9pm 0% 100% 0% On
9pm – 10pm 0% 100% 0% On
10pm – 11pm 0% 100% 0% On
11pm – 12am 0% 100% 0% On
Table 13: Transitory spaces - 24 hours
28Date Issued: July 2010
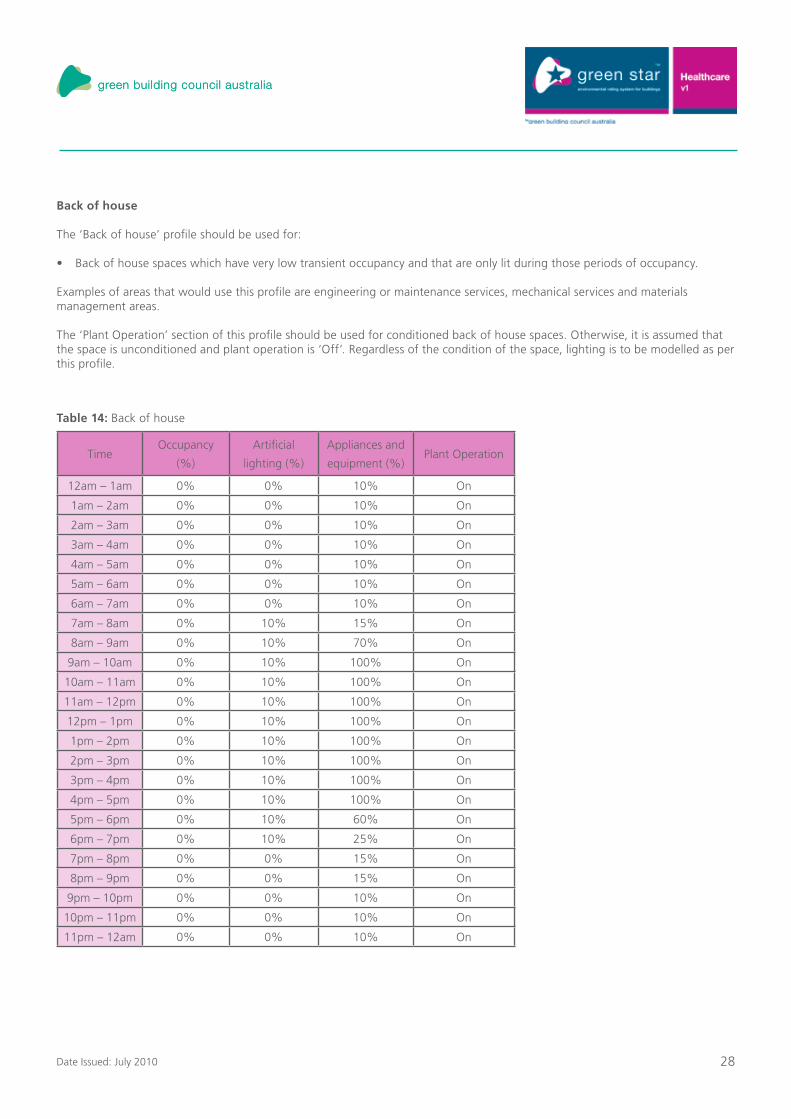
Back of house
The ‘Back of house’ profile should be used for:
• Backofhousespaceswhichhaveverylowtransientoccupancyandthatareonlylitduringthoseperiodsofoccupancy.
Examples of areas that would use this profile are engineering or maintenance services, mechanical services and materials management areas.
The ‘Plant Operation’ section of this profile should be used for conditioned back of house spaces. Otherwise, it is assumed that the space is unconditioned and plant operation is ‘Off’. Regardless of the condition of the space, lighting is to be modelled as per this profile.
TimeOccupancy
(%)
Artificial
lighting (%)
Appliances and
equipment (%)Plant Operation
12am – 1am 0% 0% 10% On
1am – 2am 0% 0% 10% On
2am – 3am 0% 0% 10% On
3am – 4am 0% 0% 10% On
4am – 5am 0% 0% 10% On
5am – 6am 0% 0% 10% On
6am – 7am 0% 0% 10% On
7am – 8am 0% 10% 15% On
8am – 9am 0% 10% 70% On
9am – 10am 0% 10% 100% On
10am – 11am 0% 10% 100% On
11am – 12pm 0% 10% 100% On
12pm – 1pm 0% 10% 100% On
1pm – 2pm 0% 10% 100% On
2pm – 3pm 0% 10% 100% On
3pm – 4pm 0% 10% 100% On
4pm – 5pm 0% 10% 100% On
5pm – 6pm 0% 10% 60% On
6pm – 7pm 0% 10% 25% On
7pm – 8pm 0% 0% 15% On
8pm – 9pm 0% 0% 15% On
9pm – 10pm 0% 0% 10% On
10pm – 11pm 0% 0% 10% On
11pm – 12am 0% 0% 10% On
Table 14: Back of house

29Date Issued: July 2010
Appendix B – Lift energy consumption methodology

30Date Issued: July 2010
The formula which needs to be used to calculate the energy consumption by a lift per year, in kWh, is given below. This formula has been adapted for Green Star from the Draft ISO standard ISO/DIS 25745-1: Energy performance of lifts and escalators - Part 1: Energy measurement and conformance.
This formula should be used for both the Proposed and Reference Building. The design team needs to establish the trip time, lift power rating and standby power for the Proposed Building (definitions below). All other parameters for the Proposed and all parameters for the Reference Building and are given in the table below.
Parameter DefinitionProposed Building modelling
requirements
Reference Building
modelling requirements
Number of tripsThe standard number of trips per year for the relevant building type
The number of trips for the Proposed Building should be taken from Table 16: Number of trips As Proposed Building
Average trip time
The time, in seconds, for the lift to travel half the possible travel distance measured from doors closed to doors opening.The distance of average trip is 0.5×N. where: N is the total travel distance (m) of the lift.The lift can be assumed to run at the rated speed (m/s) over the whole trip.
This parameter needs to be calculated by the design team. It will depend on the distance the lift will travel and the rated speed of the lift.
The distance travelled is the same as the Proposed Building.The rated speed of the Reference Building lift is 1m/s
Average power loadThe average power load is assumed to be the lift motor power rating (kW)
From supplier specifications for lift being assessed.This figure can be reduced by 20% if the lift has regenerative breaks. 40kW
3600 The figure of 3600 converts the first half of the equation, which is in kWs, into kWh.
Standby powerThe average power load is assumed to be the lift motor power rating (kW)
From supplier specifications for lift being assessed 0.15kW
Standby hours per day
Number of hours per day that the car lights and lift control systems are operating
24 hours unless the lift has a power off feature, in which case the figure used should be 18 hours. 24 hours
Standby days per yearNumber of days the standby power is applicable
365 daysExcept for offices and education facilities, where if the lift has a power off feature, 260 days should be used.Shopping centres and hospitals should use 365 days in all cases.
365 days
Table 15: Definition of parameters used to calculate the energy consumption of a lift
Energy used by a lift per year
(kWh):
Number of trips Average trip time (s)
3600
Average power load (kW)
Standby power(kW)
Standby hours per day
Standby days per year= X X X X+

31Date Issued: July 2010
Lift DutyTrips per
day
Building types(lift operation days/week)
Trips per year
5 days/week
(260 days/year)
6 days/week
(312 days/year)
7 days/week
(365 days/year)
Low 100residential care (7), goods (5), library (6), entertainment centres (7) 26,000 31,200 36,500
Medium 300
office car parks (5), general car parks (7), residential (7), university (5),hotels (7), low rise hospitals (7),shopping centres (7)
78,000 109,500
High 750
office (5),airports (7),high rise hospitals (7) 195,000 273,750
Intensive 1000 HQ office (5) 260,000 365,000
Table 16: Number of trips
Gina Barney (2007)
32Date Issued: July 2010
APPENDIX C – GREENHOUSE GAS EMISSIONS FACTORS

33Date Issued: July 2010
Greenhouse gas emissions factors quantify the amount of greenhouse gas which will be emitted into the atmosphere, as a result of using one unit of energy, i.e. the amount of greenhouse gas emitted due to using one kilowatt hour of electricity or one megajoule of gas, coal or bio-fuel.
The greenhouse gas emission factors used in the Green Star – Healthcare Greenhouse Gas Emissions Calculator are from the Australian Government’s National Greenhouse Accounts (NGA) Factors Workbook, current at the date of release.
Notes on the emissions factors used:
T1. he greenhouse gas emissions factors used include all direct and indirect emissions (or Scopes 1, 2 and 3). Direct emissions include all greenhouse gases emitted directly from the site from the combustion of fuels. An example of a direct emission would be the emissions from a gas boiler or gas cook top. Indirect emissions include all emissions which occur off-site, but which result from the building’s demand for energy. For example, indirect emissions include the emissions which occur at electricity power stations in order to supply the building with electricity, and the emissions which occur due to the extraction, transportation and fugitive losses of fuels, which the building or power station will ultimately consume.The emissions factors are given in terms of kilograms of carbon dioxide ‘equivalent’ 2. (kg/CO2-e per unit of energy). This is because the emissions factor not only accounts for emissions from carbon dioxide, but from other significant greenhouse gases (which occur due to the combustion of fossil and bio-fuels) such as methane and nitrous oxide.Emissions factors for electricity and gas vary between states and territories3. . For electricity, this is due to the mix of fuels used in the power stations. For gas, this is due to the variation in the fugitive emissions from the gas distribution network.The Scope 3 emissions factor for gas is the emissions factor for ‘small users’4. . Small users are defined as a user that consumes less than 100,000 gigajoules per year
* The emissions factors used for Tasmania in the Green Star – Healthcare v1 Greenhouse Gas Emissions Calculator Guide are the lowest emissions from mainland Australia, which at this time are the emissions factors from the Northern Territories. This ensures that initiatives such as renewable energy and low carbon technologies are rewarded in Tasmania.
StateElectricity
(kgCO2-e /kWh)
Gas
(kgCO2-e /MJ)
LPG(kgCO2-e /
MJ)
Diesel(kgCO2-e /
MJ)
Coal(kgCO2-e /
MJ)
Solid Biomass
(kgCO2-e /MJ)
Liquid Biofuels
(kgCO2-e /MJ)
ACT 1.06 0.0661
0.0652 0.0748 0.0930 0.0018 0.0003
NSW 1.06 0.0661
NT 0.80 0.0570
QLD 1.04 0.0573
SA 0.98 0.0707
TAS* 0.80 0.0570
VIC 1.31 0.0572
WA 0.98 0.0589
Table 17: Greenhouse Gas Emissions Factors for all states and territories in Australia from National Greenhouse Accounts (NGA) Factors Workbook (DCC, 2008)