green space, soundscape and urban sustainability: an ... · green space, soundscape and urban...
TRANSCRIPT

Green space, soundscape and urban sustainability:
an interdisciplinary, empirical study
Katherine N. Irvinea�, Patrick Devine-Wrightb, Sarah R. Payneb, Richard A. Fullerc,
Birgit Paintera and Kevin J. Gastonc
aInstitute of Energy and Sustainable Development, De Montfort University, Leicester, UK;bManchester Architecture Research Centre, University of Manchester, Manchester, UK;cBiodiversity and Macroecology Group, Department of Animal and Plant Sciences, Universityof Sheffield, Sheffield, UK
This paper addresses two typically separate issues contributing to urban quality of life:increasing noise levels and declining quality of public green space. Drawing fromenvironmental psychology, ecology and acoustical methods, this interdisciplinaryresearch studied the soundscapes of three green spaces in a UK city through interviewswith 70 park users, the measurement of habitat and recording of sound levels. Thedata reveal a prevalence of mechanical sounds and a hierarchy of preference fornatural over people and mechanical sounds. There was a link between sound levels,both objective and perceived, and the type of sounds heard. The presence of thesesounds varied across sites in part due to the ecological qualities of the place,specifically the presence of birds and shrub vegetation. The results suggest thatpeople’s opportunity to access quiet, natural places in urban areas can be enhanced byimproving the ecological quality of urban green spaces through targeted planning anddesign.
Keywords: soundscape; noise; biodiversity; urban green space; sustainability
Introduction
By 2009, more than half of the global human population is predicted to live in urban areas
(United Nations Population Fund [UNFPA] 2007). In some nations that proportion is
already much higher; for example, �90% of the present population of the United
Kingdom (UK) is suburban/urban (Office of Deputy Prime Minister [ODPM] 2001).
Concern over the quality of urban environments, including noise levels and declining
quality of green space, has grown over the past decade with increasing emphasis on design-
ing communities that are both liveable and sustainable (Williams et al. 2000, Girardet
2004). For example, research suggests that chronic exposure to aircraft noise can impair
children’s reading comprehension (Stansfeld et al. 2005) and that the biological quality
of green space can enhance psychological benefits of green space users (Fuller et al.
2007). There is a need for research that combines these three aspects (sound levels, biodi-
versity and green space) to deepen our understanding of the multiple dimensions of the
urban environmental experience.
ISSN 1354-9839 print/ISSN 1469-6711 online
# 2009 Taylor & Francis
DOI: 10.1080/13549830802522061
http://www.informaworld.com
�Corresponding author. Email: [email protected], [email protected]
Local Environment
Vol. 14, No. 2, February 2009, 155–172
Downloaded By: [University of Queensland] At: 03:04 19 January 2009

The impact of noise upon quality of life has become an important aspect of both urban
and environmental policy-making throughout Europe (European Commission 2002). In
England, noise levels are currently being calculated to produce “noise maps” across the
country, a Road Traffic Noise Map for London has already been produced, a “National
Ambient Noise Strategy” is being produced (Department of Environment, Farming and
Rural Affairs [DEFRA] 2004) and a discourse about “noisy neighbours” has emerged in
which urban dwellers have been called to reduce noise (Leicester City Council 2005).
Opinion polls suggest that 57% of the public are fairly or very worried about levels of
environmental noise (DEFRA 2002a). Thus at national, local and personal levels, there
is concern that “noise” is an increasing problem affecting the liveability of urban places
and that particular kinds of sounds can have a significant, detrimental impact upon
quality of life.
Research exploring the aesthetics of how people perceive and relate to urban environ-
ments has primarily focused on visual perception and evaluation. Critiques of this literature
have challenged the primacy of the visual sense and recommended research into other
sensory modalities (Rodaway 1994). One such area is the acoustic or auditory sense.
“Soundscape” has been defined as the “overall sonic environment of an area, ranging in
size from a room to a region” (Porteous and Mastin 1985, p. 169). Acoustic ecologists
suggest that the quality of the urban acoustic experience has declined, producing “lo-fi”
urban soundscapes characterised by the dominance of monotonous, background sounds
such as traffic and construction. These then mask specific sounds preventing them from
being attended to and becoming sound signals, in contrast to a “hi-fi” soundscape
(Schafer 1977). Acoustic ecologists have also critiqued the social construction of “noise”
implicit in the policy agenda, arguing for a more sophisticated understanding of, and
policy responses to, how the senses are implicated in place-making in urban environments
(Truax 2001). This involves the need to study both the objective sound levels inside and
outside a place as well as the subjectively perceived sound levels and quality of the sounds-
cape within it.
Empirical research on soundscapes has used both objective (e.g. sound level measure-
ments) and subjective (e.g. questionnaires) methods to study urban open spaces such as
squares and streets. Objective measures usually involve sound pressure levels, and have
been used substantially to fulfil policy directives. For example, noise mapping has been
used to identify the quantity and location of people affected by road traffic noise
(DEFRA 2004). Research involving subjective measures has indicated the validity of
grouping sounds into the broad categories of “natural”, “people” and “mechanical”
(Payne et al. 2007) as well as consistent preferences for natural “sounds” (e.g. water)
over mechanical “noise” (e.g. traffic; Porteous and Mastin 1985, Ge and Hokao 2004).
Age differences in evaluations of acoustic comfort and sound preferences are also
present, with younger people preferring mechanical sounds more than older people, and
older people preferring natural sounds more than younger people (Yang and Kang
2005a). Kang (2006) provides a comprehensive review of this literature on the soundscape
of these types of urban open spaces.
The soundscapes of green urban open spaces, such as parks, has been less well-studied
although the literature is growing. In Curitiba, Brazil objective measures have been used to
evaluate sound levels in urban parks against established legislative limits with subsequent
identification of sites where steps to address noise pollution may be necessary (Zannin et al.
2006). In a study of a large urban park in Japan, Ge and Hokao (2004) utilised subjective
measures that asked participants to evaluate the soundscape at several points (e.g. forest,
Japanese garden, baseball ground). The results demonstrated the variability present
156 K.N. Irvine et al.
Downloaded By: [University of Queensland] At: 03:04 19 January 2009

throughout the park allowing the researchers to identify different soundscape zones and
design implications.
There is, however, a relative absence of empirical research on the soundscapes of urban
green spaces in the UK. There are an estimated 27,000 urban parks in the UK and in
England alone some 33 million people make more than 2.5 billion visits a year (Dunnett
et al. 2002). Amidst concerns about the condition and management of these parks
(Urban Parks Forum 2001), and the potential for the quantity of available green space to
be reduced by trends towards more compact city form (Burton 2003), it is timely to
explore the quality of urban green spaces in more detail focusing upon sensory aspects
of the urban green space experience.
Understanding the quality of urban green space requires an interdisciplinary perspective
that draws from both the natural and social sciences. Ecologically, the benefits of urban
green spaces (e.g. parks) include supporting biodiversity and providing ecosystem services
such as air filtering, carbon sequestration, rainwater absorption and temperature regulation
in urban areas (Bolund and Hunhammar 1999, Nowak and Crane 2002, Crane and Kinzig
2005, Gaston et al. 2005, Smith et al. 2005). Urban green spaces often comprise a wide
variety of habitats capable of supporting a range of species (Park and Lee 2000), some
of which may be of significant conservation concern (Mortberg and Wallentinus 2000).
Within the UK, urban habitats support significant populations of several bird species,
some of which are declining and listed as nationally threatened (Gregory and Baillie
1998, Bland et al. 2004, Cannon et al. 2005, Newson et al. 2005, Robinson et al. 2005).
Although covering only about 7% of the land surface area of the UK, urban and suburban
habitats support about 40% of the starling Sturnus vulgaris population, 12% of song
thrushes Turdus philomelos (Gregory and Baillie 1998) and 49% of house sparrows
Passer domesticus (Robinson et al. 2005). Despite the significant ecological benefits of
urban green space, many such places are disappearing (Hornsten and Fredman 2000,
Pauleit et al. 2005, Yli-Pelkonen and Niemela 2005).
Environmental psychologists have researched the beneficial effects of “nature”, ranging
from wilderness to trees and grass, on multiple dimensions of health and wellbeing, includ-
ing stress reduction (Ulrich 1981), reducing mental fatigue (Hartig et al. 1991) and improv-
ing mood (Hull and Michaels 1995; for reviews, see Kaplan and Kaplan 1989, Irvine and
Warber 2002). Work in urban areas specifically has identified both social and personal
benefits of natural features such as trees and mown grass areas adjacent to housing.
Social benefits included encouraging interaction amongst neighbours, promoting a sense
of community and reducing crime (Kuo and Sullivan 2001, Sullivan et al. 2004, Kim
and Kaplan 2004), while personal benefits included managing mental fatigue and providing
opportunities for reflection (Kuo 2001, Fuller et al. 2007). Research also indicates that
urban open spaces with trees and grass are more positively perceived by residents (Kuo
et al. 1998a, 1998b) and that the presence, number and location of trees predict the fre-
quency with which local people use green space (Coley et al. 1997).
A number of gaps in the research on urban green space exist. In environmental psychol-
ogy, research often treats the natural environment as an inert backdrop to personal experi-
ence and action, rarely adopting a more holistic appraisal of both psychological and
ecological significance of habitat characteristics. Secondly, by reducing habitat to a
mono-dimensional independent variable characterised as “levels of vegetation” (e.g. Kuo
et al. 1998a, 1998b), psychological research has overlooked the structural complexity of
urban habitats, and the potential significance of particular biodiversity features such as
singing birds. Thirdly, research has often bypassed the non-visual sensory aspects of
how urban green space is experienced – for example, the acoustic aspects of hearing
Local Environment 157
Downloaded By: [University of Queensland] At: 03:04 19 January 2009

sounds from passing traffic, construction sites, children playing or singing birds – and how
such experiences shape evaluations and action. Equally, despite some recent attention to the
associations between socioeconomic factors and patterns of urban biodiversity (Pickett
et al. 2001, Hope et al. 2003, Martin et al. 2004, Kinzig et al. 2005), relatively little
urban ecological work has considered how the social and psychological benefits to urban
green space users depend on, and interact with, urban biodiversity patterns.
Such deficiencies are perhaps best addressed by the adoption of an interdisciplinary
empirical approach drawing from, and seeking to integrate environmental psychology,
ecology and acoustics, while using a combination of subjective and objective methods.
Conceptually, the research draws upon a strand of thinking in environmental psychology
advocating interdisciplinary research on human–environment interactions; it conceives
human behaviour to be shaped by psychological and contextual factors working at multiple
levels of analysis (Stern 2000, Tleubayeva and Devine-Wright 2006), and that interdisci-
plinary research can provide an appropriate basis for making recommendations for policies
and practices of sustainable development (Cooper 2002). The research adopts a transac-
tional perspective on human-environment relations, avoiding a narrow deterministic view
of the impact of the environment on human behaviour, and instead reflecting a view of
ongoing interdependencies and mutual impacts over time (Saegert and Winkel 1990).
Finally, we draw on place theory (Canter 1977), in which places are seen as representing
units of psychological experience made up of environmental, behavioural and cognitive/affective aspects, and behaviour is seen as goal-directed activity. Thus, conceiving urban
green spaces as places, the central aim of this paper is to extend the empirical literature
by adding an ecological dimension rarely applied in previous research to gain insight
into the objective and subjective experience of soundscapes in diverse green spaces.
Methodology
Context
Research was conducted in Sheffield, UK, a city of 513,000 people (Office for National
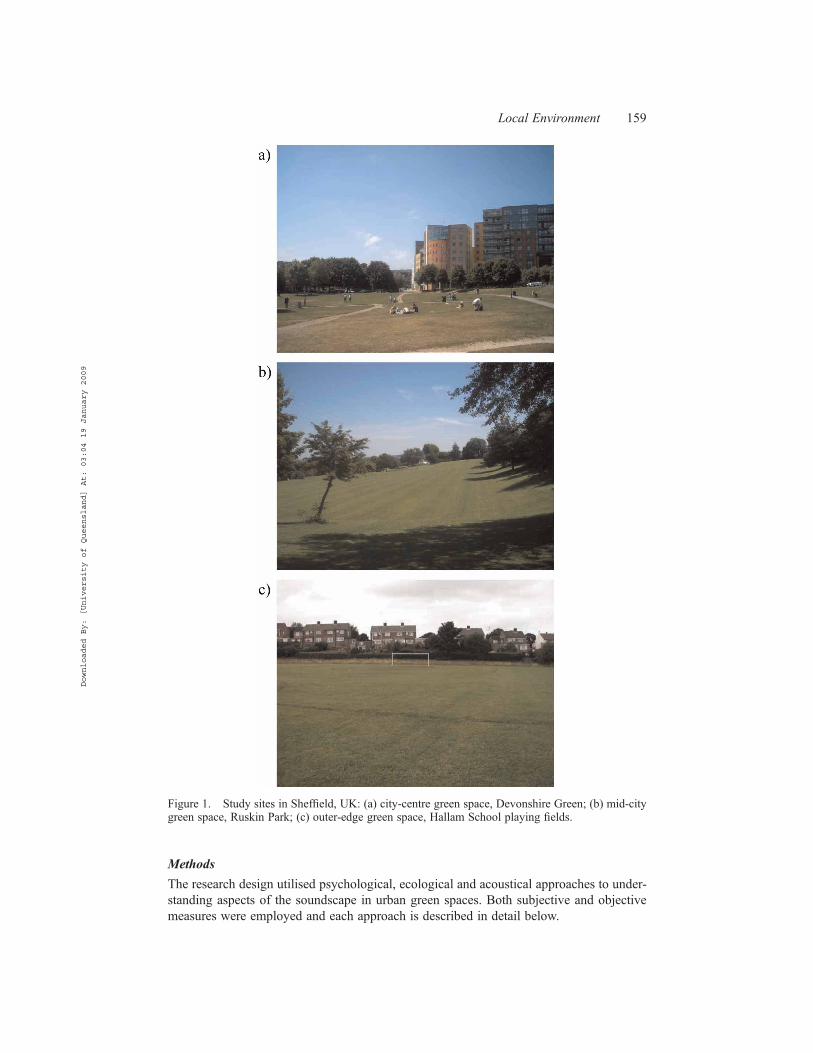
Statistics 2001). Three green spaces were selected as case studies. Devonshire Green, situ-
ated close to the city centre, has an area of 1.22 hectares (Figure 1a). The recently redeve-
loped surrounding area includes mixed-use development comprising shops, restaurants and
high rise apartment accommodation catering to both professionals and university students.
At the time of our research, it featured a skate park and some benches; it has a few trees
distributed thinly around the edges and is bounded on three sides by streets.
Ruskin Park is located east of the city centre in a mid-city neighbourhood (Figure 1b). It
has a total area of 3.93 hectares and is bounded on three sides by streets and on one side by
terraced homes with small yards. Situated on high ground with views to the north it includes
a basketball court, a children’s playground and turfed green space. There are several areas of
shrub and medium-dense trees.
Hallam School playing fields, a green space affiliated with a local primary school, is
located in a suburb close to the open countryside (Figure 1c). It is bounded on three
sides by semi-detached and detached homes with large gardens and has two entrances,
one on its northern boundary from a road that serves as a main bus route for the area
and the other on the western side from a residential street. With a total area of 3.76 hectares,
it has few amenities apart from a large quantity of open turfed field, football goal posts, a
cricket pitch and one small paved parking area. High grass areas have been left around the
edges; trees overhang primarily from neighbouring gardens.
158 K.N. Irvine et al.
Downloaded By: [University of Queensland] At: 03:04 19 January 2009
Methods
The research design utilised psychological, ecological and acoustical approaches to under-
standing aspects of the soundscape in urban green spaces. Both subjective and objective
measures were employed and each approach is described in detail below.
Figure 1. Study sites in Sheffield, UK: (a) city-centre green space, Devonshire Green; (b) mid-citygreen space, Ruskin Park; (c) outer-edge green space, Hallam School playing fields.
Local Environment 159
Downloaded By: [University of Queensland] At: 03:04 19 January 2009

Psychological
A questionnaire including open- and closed-ended questions was administered in person by
a researcher in situ during August 2005. Soundscape-related questions were embedded in a
larger project about how people think about green space that addressed park use and per-
ceptions, biodiversity conservation, the soundscape and socio-demographic characteristics.
The perception and evaluation of the soundscape were examined at two levels, the park
overall and specific sounds; question wording was drawn from previous research (Carles
et al. 1992, Yang and Kang 2005a, 2005b). At the overall level, respondents were asked
two questions: to rate how quiet or noisy the park is, overall? and to rate how much
they liked the sounds that I hear in this park. Responses were made on a 5-point Likert
scale with options from “extremely quiet” to “extremely noisy” and from “strongly dis-
agree” to “strongly agree” respectively. Specific park sounds heard when interviewed
were identified by asking respondents What are three sounds you hear when you are in
this park? and to evaluate each sound on a 5-point Likert scale (“extremely unpleasant”
to “extremely pleasant”). Only the first mentioned sounds were used in the analysis.
Seventy interviews were carried out across the three green spaces; interviewees were
park users (e.g. sitting in the park, passing through). The sample overall was 58% male,
87% European ethnicity and ranged in age from 16 to over 70. Table 1 presents a profile
of users within each study site. With the exception of access to a home garden, where
users of the city-centre park were significantly less likely to have access (x2(2) ¼18.13,
p , 0.0001), there were no significant differences between the users of the three places
on a range of socio-demographics including age, gender and the frequency of park usage.
Ecological
Habitats were mapped in the field using the standard Phase 1 habitat survey protocol (Joint
Nature Conservation Committee 1993) and imported into a geographical information
system (GIS) environment, where variables such as the area of each habitat type could
be calculated. Based on the field surveys, land parcels were classified into seven habitat
types: building, sealed surface (e.g. tarmac, concrete), water, amenity planting, amenity
turf (areas of mown grass), grassland (areas of unmown grass), scrub (shrubby vegetation
with few trees) and woodland (more or less continuous tree cover). For each habitat
polygon, we estimated the percentage ground cover and mean height of (i) herbaceous
plants comprising the ground flora layer, (ii) woody plants comprising the shrub layer
and (iii) trees. Within each habitat polygon, the volume of each vegetation layer was calcu-
lated, summed across polygons and then standardised by dividing by total area.
The number of bird species in each urban green space was estimated by walking a trans-
ect route around each space between June and August 2005, noting down all bird species
seen or heard within the space boundary. The intention was not to provide a complete
checklist of bird species, but to indicate the species most likely to be present and heard
during a typical visit in the summer months; therefore, a maximum of 2 h was spent in
each green space. In Devonshire Green and Hallam School, the number of new species
added to the list diminished very quickly over time, and owing to the simple habitat struc-
ture of these green spaces, it was clear that all species regularly using the space had been
detected. In the more topographically complex Ruskin Park, the species accumulation
curve showed a clear asymptote after about 40 min, so we are confident that the vast
majority, if not all, common species were included in our estimate.
160 K.N. Irvine et al.
Downloaded By: [University of Queensland] At: 03:04 19 January 2009

Acoustical
Sound pressure levels [LA, eq, dB(A)] were measured in June and August 2005 during two
separate 2-day sessions, one Sunday and one Monday during term time and a further
Sunday and Monday during school holidays. A 50 m grid was overlaid onto each park,
using GIS software and regularly spaced grid cells covering the park areas were then
selected as measurement locations. A handheld PDA with Global Positioning System
module was used to regularly confirm the exact position in the park so that measurements
Table 1. Participant characteristics by study site.
Devonshire, n (%) Ruskin, n (%) Hallam, n (%) x2 df p-value
Gender 0.243 2 nsMale 18 (64.3) 9 (42.9) 13 (65.0)Female 10 (35.7) 12 (57.1) 7 (35.0)Total 28 21 20
Age groups� 0.200 4 ns16–19 3 (10.3) 1 (4.8) 5 (25)20–29 10 (34.5) 4 (19.0) 1 (5)30–39 9 (31.0) 9 (42.9) 2 (10)40–49 4 (13.8) 0 (0) 5 (25)50–59 3 (10.3) 3 (14.3) 2 (10)60–60 0 (%) 3 (14.3) 3 (15)70þ 0 (0%) 1 (4.8) 2 (10)Total 29 21 20
Ethnic group na na naWhite European 22 (75.9) 19 (95) 19 (95)Other† 7 (24.1) 1 (5) 1 (5)Total 29 20 20
Personal income‡ 0.339 4 nsUnder £10,000 9 (39.1) 6 (35.3) 3 (21.4)£10–19,000 7 (30.4) 7 (41.2) 3 (21.4)£20–29,000 5 (21.7) 3 (17.5) 5 (35.7)£30–49,000 0 (0) 1 (5.9) 3 (21.4)£50,000þ 2 (8.7) 0 (0) 0 (0)Total 23 17 14
Frequency of visit} 0.702 4 nsDaily 11 (37.9) 8 (38.1) 8 (40.0)Weekly 11 (37.9) 6 (28.6) 9 (45.0)Monthly 4 (13.8) 2 (9.5) 1 (5.0)Less than monthly 3 (10.3) 5 (23.8) 2 (10.0)Total 29 21 20
Group size 0.361 2 nsAlone 16 (55.2) 9 (42.9) 7 (35)Two or more§ 13 (44.8) 12 (57.1) 13 (65.0)Total 29 21 20
Garden access 18.13 2 ,0.0001Yes 13 (46) 20 (95) 17 (90)No 15 (44) 1 (5) 2 (10)Total 28 21 19
�Original seven categories collapsed into three (16–29, 30–40, 50þ) for group comparison.†Includes: Black Caribbean, Black African, Black other, Indian, Pakistani, Bangladeshi, Chinese, other.‡Original five categories collapsed into three (under 10,000, 10-19,000, 20,000þ) for group comparison.}Original four categories collapsed into three (daily, weekly, less than weekly) for group comparison.§Includes: couple, 3–5, 5þ people.
Local Environment 161
Downloaded By: [University of Queensland] At: 03:04 19 January 2009

could be taken as closely as possible to the centroid points of the selected grid cells.
Measurements were taken consecutively at 5–8 points, depending upon the total area of
each park, lasting �4–5 min each, with the aim of collecting sufficient data at each
point to allow statistically valid calculations. Particular events that might produce unusually
high sound levels were also recorded (e.g. motorbike riding within a park). Simultaneously,
further measurements and traffic counts were carried out at a single kerbside monitoring
location next to the largest/busiest road in proximity of the park. Acoustical data were col-
lected at a frequency of 1 per second (i.e. 1 Hz) with two sound pressure level meters (CEL-
254 and TENMA 72-860) connected to TinyTag data loggers. Data were imported into a
GIS environment along with Ordnance Survey information, to produce plots that show
the spatial pattern of the measured sound pressure levels.
Results
The majority of land cover in the three green spaces was “amenity turf” (mown grass). Each
space had a relatively small amount of amenity planting, buildings, grassland, scrub and
water cover. Almost a quarter of the land cover of the mid-city site of Ruskin Park was
woodland, in contrast to none in the city-centre site, Devonshire Green. Although
Hallam School at the city’s outer edge had the highest proportion of natural surface
cover (94.6%), this consisted predominantly of amenity turf, which is associated with
low structural complexity and little biodiversity value. Finally, the volume of shrub layer
was markedly different in Ruskin Park compared with the other two, with �85% less
shrub layer in Hallam School and 95% less in Devonshire Green. Table 2 (Ecological
profile) provides details on the ecological characteristics, including size and land cover,
for the three green spaces.
Sound levels and soundscape evaluations
Perceptions of sound level differed across the three green spaces. Among users of the city-
centre park, Devonshire Green, only 22% (n ¼ 6) considered it quiet or very quiet which
contrasts with 71% (n ¼ 15) and 84% (n ¼ 16) of the users in the parks located mid-city
(Ruskin) and at the outer edge (Hallam School), respectively. A one-way between-group
analysis of variance showed a significant difference (F(2, 64) ¼ 17.598, p , 0.0001); a
post hoc test (Bonferroni) revealed that Devonshire Green was perceived as significantly
louder than the other two sites (Table 2, Psychological profile).
Figure 2 provides the sound level profiles constructed for each green space from objec-
tive sound measurements. The internal profile for Devonshire Green (first column) con-
trasted markedly from the other two urban green spaces studied, showing both less
variability in levels of noise and distinguished by generally higher sound levels irrespective
of the day of week or month studied. Although more variable, the sound levels recorded in
Ruskin Park and Hallam School tended to fall within the 40–55 dB(A) range; this is below
sound levels recorded in Devonshire Green. As noted in Table 2 (Acoustical profile) the
internal variability in Ruskin Park and Hallam School is exemplified by both noisier
(maximum) and quieter (minimum) sound levels, creating a bigger range in sound levels.
Thus, while the sound level range is smaller in the city-centre green space, it was consist-
ently noisier, as noted by the higher minimum sound level, for the other two spaces.
The occurrence of specific sound events provides insight into the high maximum
measured sound levels recorded within Ruskin Park and Hallam School. Figure 3 illustrates
the influence a single event can have on a soundscape; sound levels in the generally quiet
162 K.N. Irvine et al.
Downloaded By: [University of Queensland] At: 03:04 19 January 2009

environment of Ruskin Park on a Monday (Figure 3a) reached 78 dB(A) when small motor-
bikes were ridden through the space on a Sunday (Figure 3b). Figure 4 shows a similar
occurrence within Hallam School where the sound of children playing during an after-
school club elevated sound levels above 70 dB(A). The influence of external sound
levels on the soundscape of each green space was also present yet varied across the
spaces as noted in Figure 2 (fourth column). In Devonshire Green, there was little difference
between kerbside sound levels and internal sound levels (Table 2, Acoustical profile; Figure
5). In contrast, Hallam School had measured kerbside sound levels of more than 70 dB(A)
due to a busy road (Table 2, Acoustical profile) but there was less dispersal of this sound
into the park interior (Figure 4). ecologically, there was a difference in the availability of
roadside vegetative buffers between the two sites; Hallam School had woodland buffers
(as well as homes/gardens) but there were no buffers at Devonshire Green.
Table 2. Ecological, psychological and acoustical profile of the three study sites.
Devonshire Ruskin Hallam
EcologicalSize (ha) 1.2 3.9 3.8Land cover (%)
Tree canopy 25.5 25.0 11.4Amenity planting 2.0 0.5 0Amenity turf 78.3 63.0 82.6Building 0 0 0Grassland 0 3.3 2.8Scrub 0 0 0Sealing 19.8 10.2 5.4Water 0 0 0Woodland 0 23.05 9.17
Total natural surface (%) 80.2 89.8 94.6Total artificial surface (%) 19.8 10.2 5.4Shrub layer volume (m3/ha) 146 2896 434Observed bird species 4 13 4
PsychologicalSounds heard (category)�
Natural 0 12 3Of which bird-related 0 7 3People 9 3 9Mechanical 18 6 8
Mean (sd) perceived sound level† 3.30 (0.91) 2.05 (0.74) 2.05 (0.85)Mean rank sounds liked overall‡ 28.40 40.40 40.65
AcousticalInternal sound levels [dB(A)]
Maximum 64.4 78.1 79.4Minimum 54.1 40.4 37.7Range 10.3 37.7 41.7
Kerbside sound levels [dB(A)]Maximum 73.3 66.1 74.4Minimum 58.0 59.8 61.3Range 15.3 6.3 13.1
�First sound mentioned; question “what are three sounds you hear when in this park”.†Question “how quiet or noisy the park is overall”; 5-point Likert scale (extremely quiet, extremely noisy).‡Question “I like the sounds that I hear in this park”; 5-point Likert scale (strongly disagree, strongly agree).
Local Environment 163
Downloaded By: [University of Queensland] At: 03:04 19 January 2009

Participants’ evaluation of the overall soundscape was generally positive (m ¼ 3.6,
sd ¼ 1.0), although there were significant differences between the sites. Results from a
Kruskal–Wallis test (conducted due to unequal variance) indicated a significant difference
between the three urban green spaces (x2(2) ¼ 6.729, p ¼ 0.035). Soundscapes in Devon-
shire Green were less well liked compared with those heard in Ruskin Park and Hallam
School green spaces, which were rated similarly (Table 2, Psychological profile).
Sound identification, presence and evaluation
The 68 sounds that were first identified by the participants as being heard in the green space
were recorded and coded into three categories: “natural”, “people” and “mechanical” based
on Schafer’s definitions (1977). Coding was completed independently by two of the
researchers with an inter-rater reliability of r ¼ 0.91, k ¼ 0.89. Table 3 illustrates the fre-
quency with which each category of sound was heard across the three study sites with
mechanical and people sounds being heard most frequently. Of the mechanical sounds,
traffic was mentioned most. Within the people-related sound category, hearing voices of
people speaking and children playing was most frequently mentioned. Birds were the
most frequently mentioned sound in the natural category. Two respondents in the city-
centre green space indicated hearing no sounds.
The distribution of these sound categories differed across the three green spaces as illus-
trated in Table 2 (Psychological profile). There were no natural sounds heard in the city-
centre green space of Devonshire Green, whereas 80% of the natural sounds were heard
in the mid-city site of Ruskin Park alone, the predominant of which were birds (58%). In
contrast, mechanical sounds were most frequently heard in Devonshire Green, while
people sounds were most prevalent in both Devonshire Green and the outer-city site,
Hallam School.
The predominance of bird sounds heard by participants in Ruskin Park mirrors ecologi-
cal observation of bird species (Table 2, Ecological profile). Of the 15 different species
recorded across the three green spaces, 13 (86%) were observed in Ruskin Park alone
(robin Erithacus rubecula, magpie Pica pica, blackbird Turdus merula, woodpigeon
Columba palumbus, blue tit Cyanistes caeruleus, chiffchaff Phylloscopus collybita,
willow warbler P. trochilus, great tit Parus major, swift Apus apus, wren Troglodytes
Figure 2. Sound levels measured at a series of locations for each study site.
164 K.N. Irvine et al.
Downloaded By: [University of Queensland] At: 03:04 19 January 2009

troglodytes, greenfinch Carduelis chloris, goldfinch C. carduelis, bullfinch Pyrrhula pyr-
rhula). This is in marked difference to the other two green spaces in which only four
species (26%) were observed in Hallam School (robin, woodpigeon, house sparrow
P. domesticus, pied wagtail Motacilla alba) and within Devonshire Green (robin,
magpie, blackbird, blue tit). Of the bird species observed, bullfinch and house sparrow
(in Ruskin Park and Hallam School) are considered “red-listed” species in a recent
review of the conservation status of UK birds (Gregory et al. 2002), denoting a high
level of conservation concern at a national level. Furthermore, the willow warbler (in
Ruskin Park) was amber-listed, denoting a moderate level of conservation concern at a
national level. In comparison, Devonshire Green had no species of conservation signifi-
cance observed, in addition to its lack of bird species diversity.
Figure 3. Effect of sound event on internal soundscape of mid-city green space, Ruskin Park: (a)without sound event (Monday, 12 : 50 to 14 : 00 h), (b) effect of motorbike on sound levels(Sunday, 12 : 50 to 14 : 00 h). Measurement points are marked with grey hash symbols.
Local Environment 165
Downloaded By: [University of Queensland] At: 03:04 19 January 2009

A one-way between-group analysis of variance explored the evaluation of the perceived
pleasantness of these three sound categories revealing a hierarchy of preference from
natural, to people to mechanical sounds (Table 3; F(2, 65) ¼ 23.924, p , 0.0001).
Further analysis indicated no significant differences in preference by socio-demographic
categories of gender (x2(2) ¼ 0.909, p ¼ 0.635) and age (x2(4) ¼ 2.18, p ¼ 0.705); the
natural, people, mechanical hierarchical preference was indicated across the entire sample.
Discussion
Despite increasing concern over noise levels and declining quality of parks in cities little
research has specifically addressed the soundscapes of urban green space. Combining per-
spectives and methods from psychology, ecology and acoustics, three green spaces located
in different parts of a large UK city (centre, mid, edge) were studied for their ecological
content, objective sound levels and park users’ perceptions and evaluations of the overall
soundscape as well as specific sounds heard. The results suggest a link between sound
levels, both objective and perceived, and the type of sounds heard. While there was a con-
sistent hierarchy of sound evaluation, there were clear place-dependent differences, in part
due to the ecological qualities of the green space.
Figure 4. After-school club effect on sound levels in outer-edge green space, Hallam School playingfields, and infiltration of kerbside noise (Monday, 15:20 to 16:30 h). Measurement points marked withgrey hash symbols.
166 K.N. Irvine et al.
Downloaded By: [University of Queensland] At: 03:04 19 January 2009

The soundscape experience in each green space differed between the city-centre
location and the two others. The city-centre green space was both perceived as noisier
and objectively measured as being consistently louder than the other two green spaces,
despite relatively similar maximum noted sound levels. This match between the subjective
perception and the objective measures of sound level has also been noted by Yang and Kang
(2005b). These results could explain the significantly poorer evaluation of the soundscape
for the city-centre green space compared with the two places located further from the centre;
the louder the green space, both perceptually and measured, the more negative the sounds-
cape evaluation. These relationships, however, are not straightforward, as the results of the
types of sounds heard within the green spaces offer additional suggestions for the poorer
soundscape evaluation.
People in the city-centre green space heard no natural sounds and a large number of
mechanical sounds, whereas in the two places located further from the centre the opposite
was true where natural sounds were more frequently heard. Mechanical sounds were the
least preferred by all users, and the hierarchy of preference for natural, then people and
then mechanical sounds mirrored the results from studies on public squares (Yang and
Kang 2005a) as well as previous studies on urban green spaces (Ge and Hokao 2004,
Figure 5. Influence of external factors upon sound levels in the city-centre green space, DevonshireGreen (Monday, 10 : 45 to 11 : 30 h). Measurement points are marked with grey hash symbols.
Local Environment 167
Downloaded By: [University of Queensland] At: 03:04 19 January 2009

Payne et al. 2007). The different proportions of sound categories heard by participants
across the three parks as well as each sound category being evaluated differently is
likely to have influenced the overall soundscape evaluations. That the city-centre green
space’s soundscape was significantly less liked in comparison to the other two places
could have been influenced by the perceived noisier sound levels, the actual louder
sound levels, the more frequent hearing of disliked mechanical sounds and the lack of
hearing the most preferred, natural sounds. This shows the complex interplay of subjective
and objective factors operating at multiple levels (individual sounds and a combination of
several sounds) that collectively make up the soundscape experience in urban green spaces.
Future research can address how these factors and levels interplay in more detail, for
example, by investigating which of the factors are most important at particular times and
in particular places.
The high prevalence of mechanical sounds reported across the three places supports
recent concerns over rising levels of sound from road traffic on urban quality of life
(Bluhm et al. 2004). The results indeed showed that traffic sounds, the highest proportion
of mechanical sounds identified, are perceived to be the least preferred sound type, and this
did not vary depending on the participant’s age or gender. The absence of an age effect in
our study differed from that in Yang and Kang (2005a), although the relatively small sample
size of this study should be taken into account before broader implications are drawn. The
generality of the sound categories used in the research may obscure important variations
within each category as to how people evaluate different types of “mechanical”,
“natural” or “people” sounds. For example, Payne et al. (2007) found that the sound of
background traffic was more positively evaluated compared with other types of mechanical
sounds such as construction work. Future research could investigate the circumstances in
which a variety of objectively loud “natural” (e.g. strong wind) or “people” (e.g. child
screaming) sounds may be subjectively perceived as “noisy” by different kinds of users
of urban green spaces. Research could also investigate the circumstances in which different
users evaluate specific types of “people” or “natural” sounds as pleasant or unpleasant.
Zhang and Kang (2007) have identified the acoustic effects of the space (e.g. whether
sounds echo) and the relationship between the aural and visual experience as important
in the evaluation of soundscapes of urban open spaces such as squares and streets. It
Table 3. Categories of sounds heard, their frequency and perceived pleasantness across threestudy sites�.
Sound category FrequencyPleasantness†,mean (sd)
Mechanical 32 (47%) 2.81 (0.82)Cars/traffic (21), sirens (2), trail/motorbikes (2), music(2), gardening (1), skateboard-related (4)
People 21 (31%) 3.61 (0.97)People (5) (e.g. “voices”, “chatting”), child-related (13)(e.g. “voices”, “playing”, shouting”), laughter (1), swearwords (1), football (1)
Natural 15 (22%) 4.6 (0.63)Birds (10) (e.g. “birds singing”, “birds”), dogs (3), Windin trees (2)
�Based on analysis of first identified sound.†Responses made on 5-point Likert scale (extremely unpleasant, extremely pleasant). Post hoc tests indicatesignificant difference across all sound categories.
168 K.N. Irvine et al.
Downloaded By: [University of Queensland] At: 03:04 19 January 2009

would be useful for future research to explore whether these factors are also relevant to the
soundscape experience of urban green spaces.
There is an important place dependency to the perception of these categories of sound.
As noted, although mechanical sounds represented almost half of the first identified sounds,
they were not equally elicited across the three green spaces. Hearing natural sounds was also
place-dependent. The predominant natural sound described by respondents was “birds” or
“birds singing”; these were most frequently heard in the mid-city green space. Diversity
of urban birds is positively associated with increased structural complexity, including
greater percentage cover by shrubs (White et al. 2005). Shrub layer was most pronounced
in the mid-city site when compared with the other two green spaces with our surveys detect-
ing 13 different bird species. Our data therefore suggest that species-rich bird communities
impact directly on the quality of the soundscape in urban parks, in an effect mediated by
vegetation structure. The greater level of biodiversity appears to contribute to a soundscape
more distinctive of natural sounds in comparison to the other two green spaces. This
suggests ways in which the design of urban parks might influence soundscapes indirectly
via its effects on biodiversity as well as directly through modification of physical buffers.
Researchers have noted that characteristic sounds or soundmarks can make a place seem
distinctive from other urban spaces and form part of the community’s shared soundscape
(Schafer 1977). This idea is supported among the three case study places where birdsong
was characteristic of the mid-city park, the sound of children in the outer edge playing
fields and traffic in the city-centre park. Although bird species were identified by the
researchers at the city-centre site, no participants in this park reported hearing natural
sounds. This might reflect the prevalence of mechanical sounds at this site masking any
sounds produced by birds. The fact that two participants indicated hearing no sounds at
all potentially highlights some people’s lack of awareness of sounds in comparison to
their visual senses. Our experience mirror’s that of Porteous and Mastin (1985) who
noted participant’s poor completion rates of their soundscape questionnaire.
Data from the acoustical sound measurements both within and adjacent to the green
spaces shed additional light on the user’s experience of a soundscape. Recorded sound
level data revealed differences spatially (e.g. close to or far from road) and suggest differ-
ences across time when a single event can dramatically vary the sound level as occurred in
both the mid-city and edge sites. These single sound events explain some of the variability
in what are otherwise perceptually, and objectively, quiet green spaces. Although the influ-
ence of an extreme event may not affect most users, it is an important component of sounds-
capes that could influence an individual’s experience.
The structure of the green space’s habitat not only provides a supportive habitat for
important aspects of biological diversity, it also has the potential to attenuate sounds gen-
erated outside of the space. In the outer-edge green space, hedges and trees as well as homes
and gardens acted as a buffer effectively minimising the impact of continuous and mono-
tonous external sounds into the green space. In contrast, the relative lack of shrubs, trees or
buildings to attenuate traffic sounds on its surrounding streets made for a city-centre park
experience that differed little from that of the adjacent area. The availability of buffers may
help maximise the ability of park users to hear sounds emanating internally and can promote
“hi-fi” rather than “lo-fi” soundscapes. Such experiences are particularly valuable in city-
centre areas, often characterised by high density and little access to private green space
(e.g. gardens).
While the case study approach enabled the interdisciplinary research design, the small
number of green spaces and a relatively small sample size of green space users made analy-
sis across the three data sets (ecological, psychological, acoustical) difficult and suggests an
Local Environment 169
Downloaded By: [University of Queensland] At: 03:04 19 January 2009
interesting focus for future research. Additionally, the temporal sampling frame for acous-
tical measures was limited, making it difficult to capture sound levels across more extended
periods. Lastly, only one sensory mode was the focus of the research which, while instruc-
tive, provides only a minimal insight into the multisensory experience of urban green space.
Nevertheless, the study provides a novel interdisciplinary approach to understanding the
soundscapes of urban green spaces and is timely given policy interest in providing
access to quiet spaces (Commission for Architecture and Built Environment [CABE
Space] 2005) and incorporating the conservation of biological diversity into the urban
fabric (DEFRA 2002b). There is a complex interplay between personal, ecological and
physical/spatial factors in shaping the perception, evaluation and use of public urban
green space. Our research suggests that decisions to increase biodiversity in urban green
space can generate ecological and psychological benefits through enhanced soundscape
quality, contributing to urban sustainability.
Acknowledgements
This work was supported by EPSRC grant GR/S20529/01 to the CityForm consortium. Our thanks toC. Bernardini for assistance with data collection, R. Wall, G. Mills, S. Herbert and two anonymousreviewers for thoughtful comments on the manuscript, and to the participants who gave of their time.
References
Bland, R.L., Tully, J., and Greenwood, J.J.D., 2004. Birds breeding in British gardens: an underesti-mated population? Bird Study, 51 (2), 96–106.
Bluhm, G., Nordling, E., and Berglind, N., 2004. Road traffic noise and annoyance – an increasingenvironmental health problem. Noise and Health, 6 (24), 43–49.
Bolund, P. and Hunhammar, S., 1999. Ecosystem services in urban areas. Ecological Economics,29 (2), 293–301.
Burton, E., 2003. Housing for an urban renaissance: implications for social equity. Housing Studies,18 (4), 537–562.
CABE Space, 2005. Does money grow on trees? London: CABE.Cannon, A.R., et al., 2005. Trends in the use of private gardens by wild birds in Great Britain 1995–
2002. Journal of Applied Ecology, 42 (4), 659–671.Canter, D., 1977. The psychology of place. London: Architecture Press.Carles, J., Bernaldez, F., and de Lucio, J., 1992. Audio–visual interactions and soundscape prefer-
ences. Landscape Research, 17 (2), 52–56.Coley, R.L., Kuo, F.E., and Sullivan, W.C., 1997. Where does community grow? The social context
created by nature in public housing. Environment and Behavior, 29 (4), 468–492.Cooper, I., 2002. Transgressing discipline boundaries: is BEQUEST an example of “the new pro-
duction of knowledge”? Building Research and Information, 30 (2), 116–129.Crane, P. and Kinzig, A., 2005. Nature in the metropolis. Science, 308 (5726), 1225.DEFRA, 2002a. Survey of public attitudes to quality of life and to the environment – 2001. London:
DEFRA.DEFRA, 2002b. Working with the grain of nature: a biodiversity strategy for England. London:
DEFRA.DEFRA, 2004. Noise mapping England: the London road traffic noise map, [online]. Available from:
http://www.noisemapping.org [Accessed 20 October 2007].Dunnett, N., Swanwick, C., and Woolley, H., 2002. Improving urban parks, play areas and green
spaces. London: DTLR.European Commission, 2002. Directive on environmental noise, (2002/49/EC) [online]. Available
from: http://ec.europa.eu/environment/noise/directive.htm [Accessed 7 November 2007].Fuller, R.A., et al., 2007. Psychological benefits of greenspace increase with biodiversity. Biology
Letters, 3 (4), 390–394.
170 K.N. Irvine et al.
Downloaded By: [University of Queensland] At: 03:04 19 January 2009

Gaston, K.J., et al., 2005. Urban domestic gardens (IV): the extent of the resource and its associatedfeatures. Biodiversity and Conservation, 14 (4), 3327–3349.
Ge, J. and Hokao, K., 2004. Research on the sound environment of urban open space from the view-point of soundscape – a case study of Saga Forest Park, Japan. Acta Acustica United withAcustica, 90 (3), 555–563.
Girardet, H., 2004. Cities people planet: liveable cities for a sustainable world. London: John Wiley& Sons.
Gregory, R.D. and Baillie, S.R., 1998. Large-scale habitat use of some declining British birds. Journalof Applied Ecology, 35 (5), 785–799.
Gregory, R.D., et al., 2002. The population status of birds in the United Kingdom, Channel Islandsand Isle of Man: an analysis of conservation concern 2002–2007. British Birds, 95 (9), 410–448.
Hartig, T., Mang, M., and Evans, G.W., 1991. Restorative effects of natural environment experiences.Environment and Behavior, 23 (1), 3–26.
Hope, D., et al., 2003. Socioeconomics drive urban plant diversity. Proceedings of the NationalAcademy of Sciences, 100 (15), 8788–8792.
Hornsten, L. and Fredman, P., 2000. On the distance to recreational forests in Sweden. Landscape andUrban Planning, 51 (1), 1–10.
Hull, R.B. and Michaels, S.E., 1995. Nature-based recreation, mood change and stress restoration.Leisure Sciences, 17 (1), 1–14.
Irvine, K.N. and Warber, S.L., 2002. Greening healthcare: practicing as if the natural environmentreally mattered. Alternative Therapies in Health and Medicine, 8 (5), 76–83.
Joint Nature Conservation Committee, 1993. Handbook for phase 1 habitat survey: a technique forenvironmental audit. Peterborough: JNCC.
Kang, J., 2006. Urban sound environment. London: Taylor & Francis.Kaplan, R. and Kaplan, S., 1989. The experience of nature: a psychological perspective. Cambridge:
Cambridge University Press. (Republished by Ann Arbor, MI: Ulrich’s, 1995.)Kim, J. and Kaplan, R., 2004. Physical and psychological factors in sense of community. Environment
and Behavior, 36 (3), 313–340.Kinzig, A., et al., 2005. The effects of human socioeconomic status and cultural characteristics on
urban patterns of biodiversity. Ecology and Society, 10 (1), 23.Kuo, F.E., 2001. Coping with poverty: impacts of environment and attention in the inner city.
Environment and Behavior, 33 (1), 5–34.Kuo, F.E. and Sullivan, W.C., 2001. Environment and crime in the inner city: does vegetation reduce
crime? Environment and Behavior, 33 (3), 343–367.Kuo, F.E., Bocacia, M., and Sullivan, W.C., 1998a. Transforming inner-city neighbourhoods: trees,
sense of safety, and preference. Environment and Behavior, 30 (1), 28–59.Kuo, F.E., et al., 1998b. Fertile ground for community: inner-city neighbourhood common spaces.
American Journal of Community Psychology, 26 (6), 823–851.Leicester City Council, 2005. Noise annoys. Leicester Link, May, 13. Available from: http://www.
leicester.gov.uk/your-council–services/council-and-democracy/council-news/news/leicester-link-magazine/link-2005-archive/may-2005 [Accessed 20 October 2007].
Martin, C.A., Warren, P.S., and Kinzig, A.P., 2004. Neighborhood socioeconomic status is a usefulpredictor of perennial landscape vegetation in residential neighborhoods and embedded smallparks of Phoenix, AZ. Landscape and Urban Planning, 69 (4), 355–368.
Mortberg, U. and Wallentinus, H.-G., 2000. Red-listed forest bird species in an urban environment –assessment of green space corridors. Landscape and Urban Planning, 50 (4), 215–226.
Newson, S.E., et al., 2005. Evaluating the Breeding Bird Survey for producing national populationsize and density estimates. Bird Study, 52 (1), 42–54.
Nowak, D.J. and Crane, D.E., 2002. Carbon storage and sequestration by urban trees in the USA.Environmental Pollution, 116 (3), 381–389.
ODPM, 2001. Habitat UK national report. London: HMSO.Office for National Statistics, 2001. 2001 census: standard area statistics (England and Wales).
London: ESRC/JISC Census Programme.Park, C.R. and Lee, W.S., 2000. Relationship between species composition and area in breeding birds
of urban woods in Seoul, Korea. Landscape and Urban Planning, 51 (1), 29–36.Pauleit, S., Ennos, R., and Goldin, Y., 2005. Modeling the environmental impacts of urban land use
and land cover change – a study in Merseyside, UK. Landscape and Urban Planning, 71 (2–4),295–310.
Local Environment 171
Downloaded By: [University of Queensland] At: 03:04 19 January 2009

Payne, S.R., Devine-Wright, P., and Irvine, K.N., 2007. People’s perceptions and classifications ofsounds heard in urban parks: semantics, affect and restoration. Inter-noise 2007: globalapproaches to noise control. 28–31 August 2007. Istanbul, Turkey.
Pickett, S.T.A., et al., 2001. Urban ecological systems: linking terrestrial, ecological, physical, andsocioeconomic components of metropolitan areas. Annual Review of Ecology and Systematics,32 (November), 127–157.
Porteous, J.D. and Mastin, J.F., 1985. Soundscape. Journal of Architectural and Planning Research,2 (3), 168–186.
Robinson, R.A., Siriwardena, G.M., and Crick, H.Q.P., 2005. Size and trends of the House SparrowPasser domesticus population in Great Britain. Ibis, 147 (3), 552–562.
Rodaway, P., 1994. Sensuous geographies: body, sense and place. London: Routledge.Saegert, S. and Winkel, G., 1990. Environmental psychology. Annual Review of Psychology,
41 (January), 441–477.Schafer, R.M., 1977. The tuning of the world. New York: Knopf.Smith, R.M., et al., 2005. Urban domestic gardens (V): relationships between landcover composition,
housing and landscape. Landscape Ecology, 20 (2), 235–253.Stansfeld, S.A., et al., 2005. Aircraft and road traffic noise and health: a cross-national study. Lancet,
365 (9475), 1942–1949.Stern, P.C., 2000. Towards a coherent theory of environmentally significant behaviour. Journal of
Social Issues, 56 (3), 407–424.Sullivan, W.C., Kuo, F.E., and DePooter, S., 2004. The fruit of nature: vital neighbourhood spaces.
Environment and Behavior, 36 (5), 678–800.Truax, B., 2001. Acoustic communication. 2nd ed. CT: Ablex.Tleubayeva, M. and Devine-Wright, P., 2006. Developing an environmental psychology of sustain-
able energy: challenges and opportunities. Zeitschrift Umweltpsychologie, 10 (1), 178–191.Ulrich, R.S., 1981. Natural versus urban scenes: some psychophysiological effects. Environment and
Behavior, 13 (5), 523–556.UNFPA, 2007. State of world population 2007: unleashing the potential of human growth. New York:
UNFPA.Urban Parks Forum, 2001. Public park assessment: a survey of local authority owned parks focusing
on parks of historic interest. Reading, UK: GreenSpace.White, J.G., et al., 2005. Non-uniform bird assemblages in urban environments: the influence of
streetscape vegetation. Landscape and Urban Planning, 71 (2–4), 123–135.Williams, K., Burton, E., and Jenks, M., 2000. Achieving sustainable urban form. London: E&FN
Spon.Yang, W. and Kang, J., 2005a. Soundscape and sound preferences in urban squares: a case study in
Sheffield. Journal of Urban Design, 10 (1), 61–80.Yang, W. and Kang, J., 2005b. Acoustic comfort evaluation in urban open public spaces. Applied
Acoustics, 66 (2), 211–229.Yli-Pelkonen, V. and Niemela, J., 2005. Linking ecological and social systems in cities: urban plan-
ning in Finland as a case. Biodiversity and Conservation, 14 (8), 1947–1967.Zannin, P.H.T., Ferreira, A.M.C., and Szeremetta, B., 2006. Evaluation of noise pollution in urban
parks. Environmental Monitoring and Assessment, 118 (1–3), 423–433.Zhang, M. and Kang, J., 2007. Toward the evaluation, description, and creation of soundscapes in
urban open spaces. Environment and Planning B: Planning and Design, 34 (1), 68–86.
172 K.N. Irvine et al.
Downloaded By: [University of Queensland] At: 03:04 19 January 2009