green rating: what we do and why?
TRANSCRIPT
Green Rating:
What we do
and why?
Centre for Science and Environment
Centre for Science and Environment
CSE’s Green Rating Project - what and why?
GRP is a public tool to leverage change
It benchmarks the present. And points to the way ahead
It sets difficult goal-posts: Pushes towards desirable not what is easily achievable
Centre for Science and Environment
Our Belief
Public disclosure must for credible action
We rate everyone – who agree or those who
do not. Environment is public good
Industry will grow, but growth has to be
business-unusual
Centre for Science and Environment
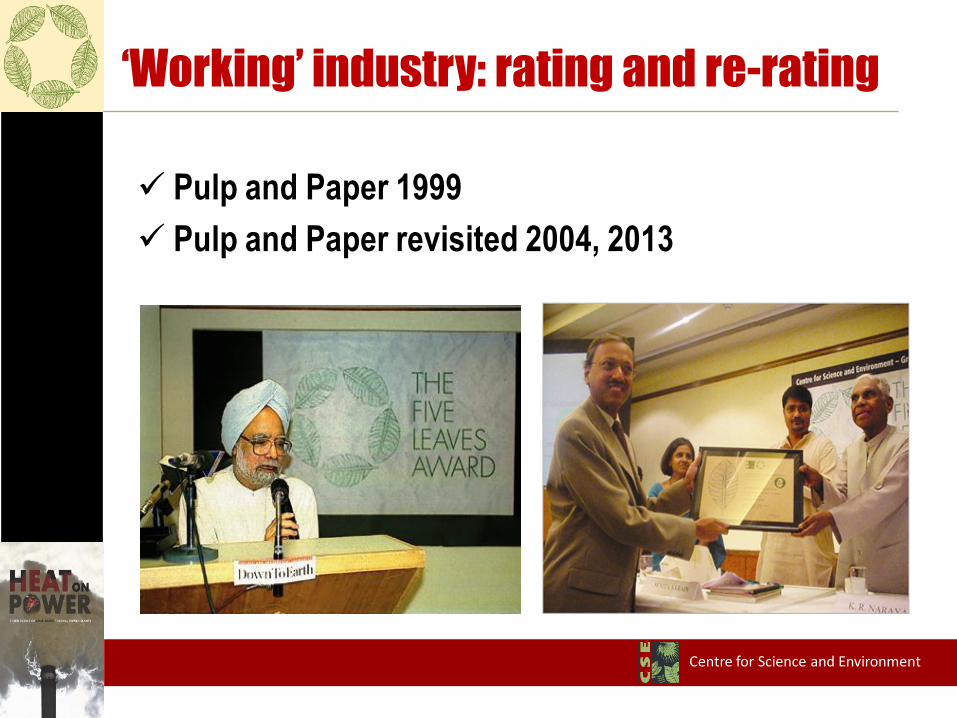
‘Working’ industry: rating and re-rating
Pulp and Paper 1999
Pulp and Paper revisited 2004, 2013
Centre for Science and Environment
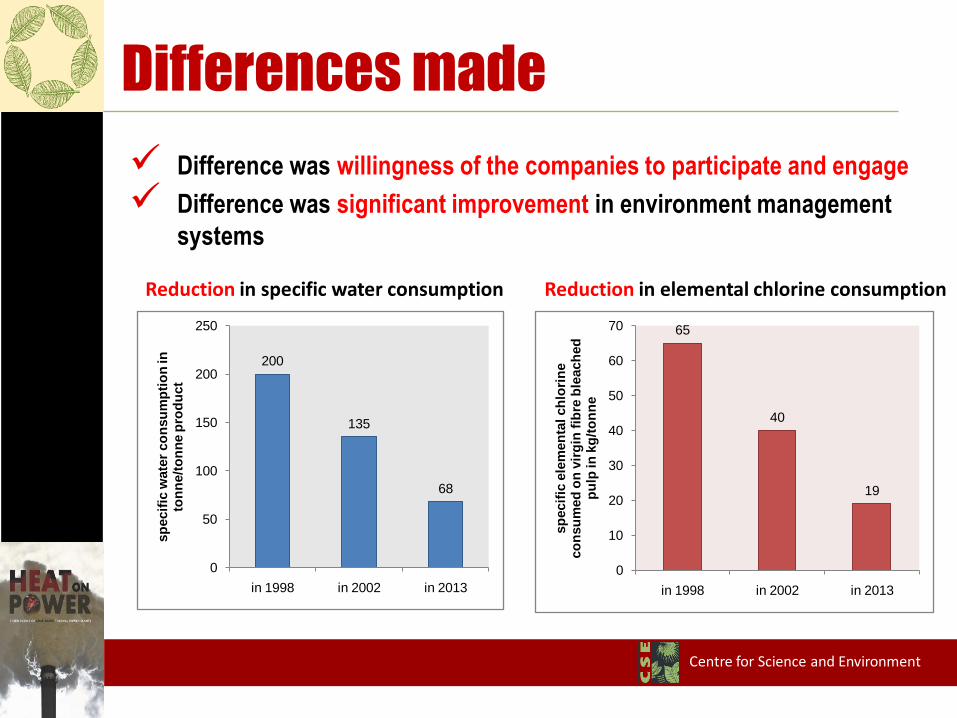
Differences made
Difference was willingness of the companies to participate and engage
Difference was significant improvement in environment management
systems
Reduction in specific water consumption Reduction in elemental chlorine consumption
200
135
68
0
50
100
150
200
250
in 1998 in 2002 in 2013
sp
ecif
ic w
ate
r co
nsu
mp
tio
n in
to
nn
e/t
on
ne p
rod
uct
65
40
19
0
10
20
30
40
50
60
70
in 1998 in 2002 in 2013
sp
ecif
ic e
lem
en
tal ch
lori
ne
co
nsu
med
on
vir
gin
fib
re b
leach
ed
p
ulp
in
kg
/to
nn
e
Centre for Science and Environment
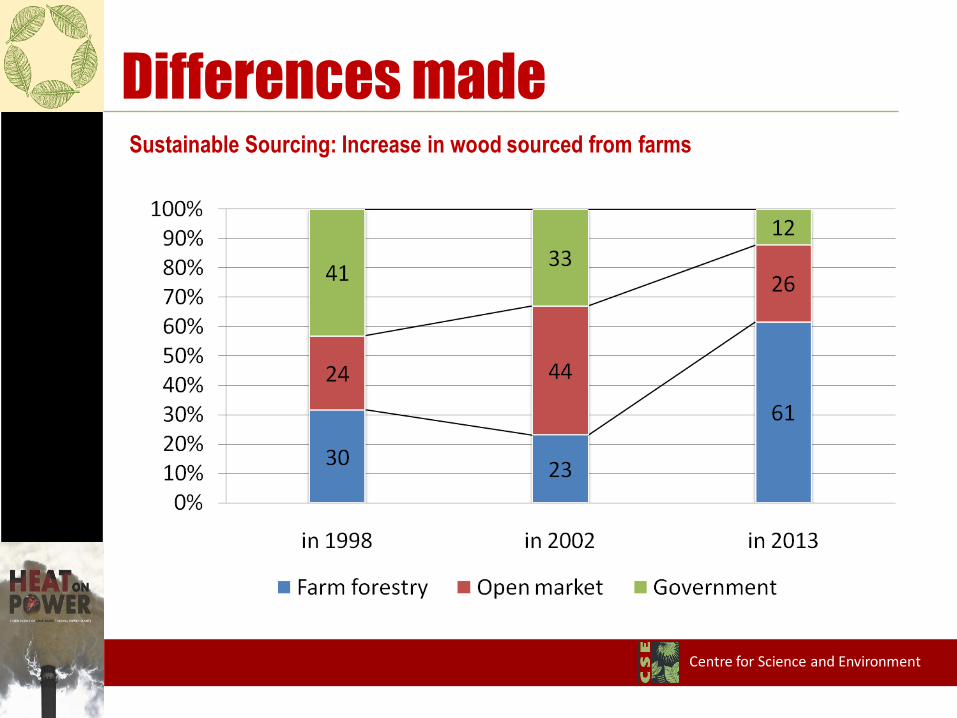
Differences madeSustainable Sourcing: Increase in wood sourced from farms
Centre for Science and Environment
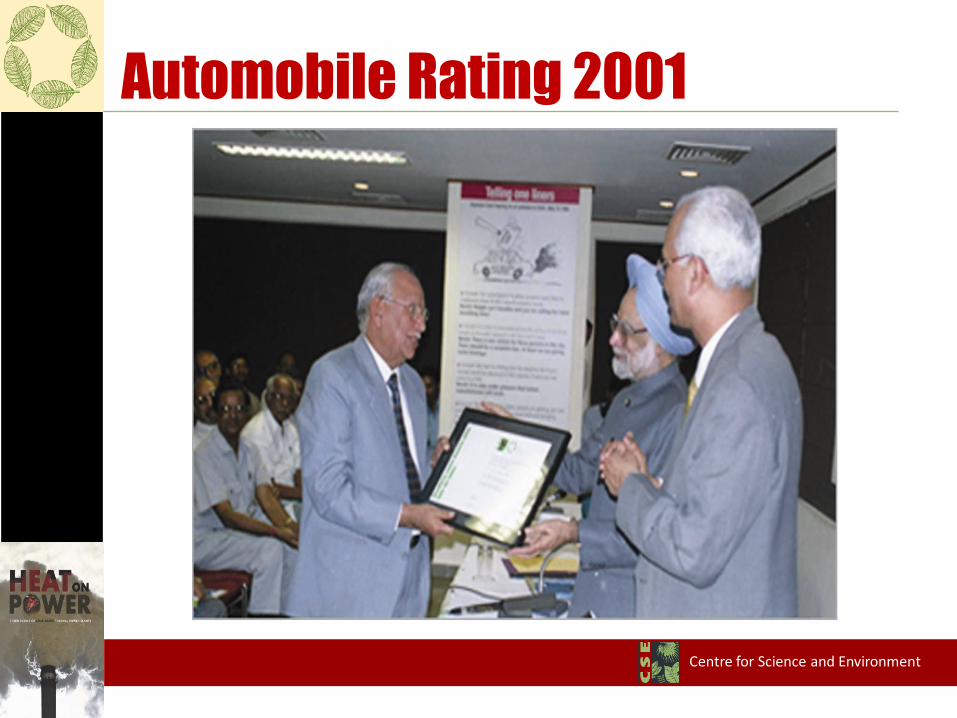
Automobile Rating 2001
Centre for Science and Environment
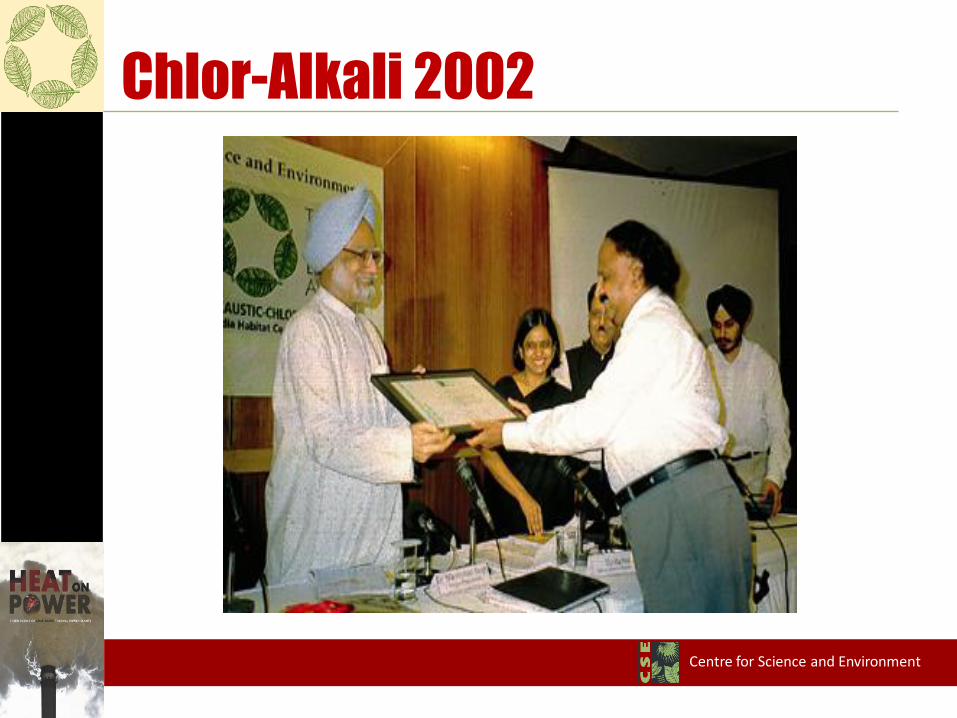
Chlor-Alkali 2002
Centre for Science and Environment
Cement 2005
Recognition that Indian cement industry is
matching global best standards for energy use
and GHG emissions. Changed the perception of
industry and pointed to challenges of mining
Centre for Science and Environment
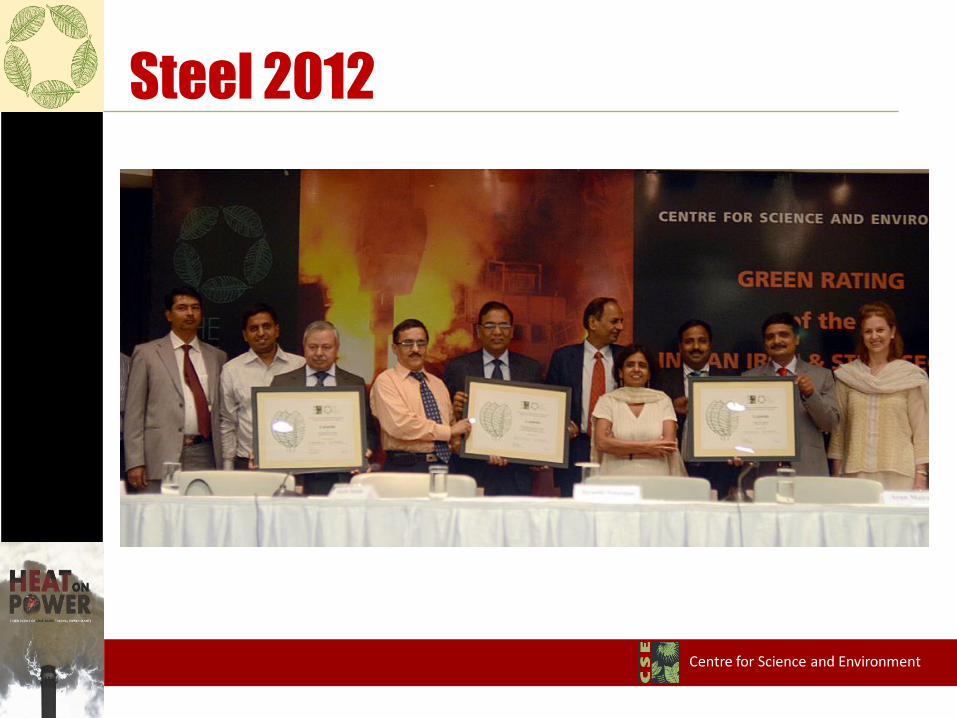
Steel 2012
Centre for Science and Environment
Rationale for rating coal- based
thermal power sector
Core industrial sector - set to expand
Resource intensive – water, coal and land
High pollution potential
Responsible for more than half the country’s GHG
emissions
Centre for Science and Environment
Coal thermal power
Difficult issue for environmentalist
Would like it to go. Huge costs of extraction; fossil
use in climate change; pollution impacts on local
communities
But recognize that it will stay for countries like India.
No country has disengaged as yet. So even as we
push for renewables the question is how to clean
coal thermal power
Is it possible? What do we do? How?
Centre for Science and Environment
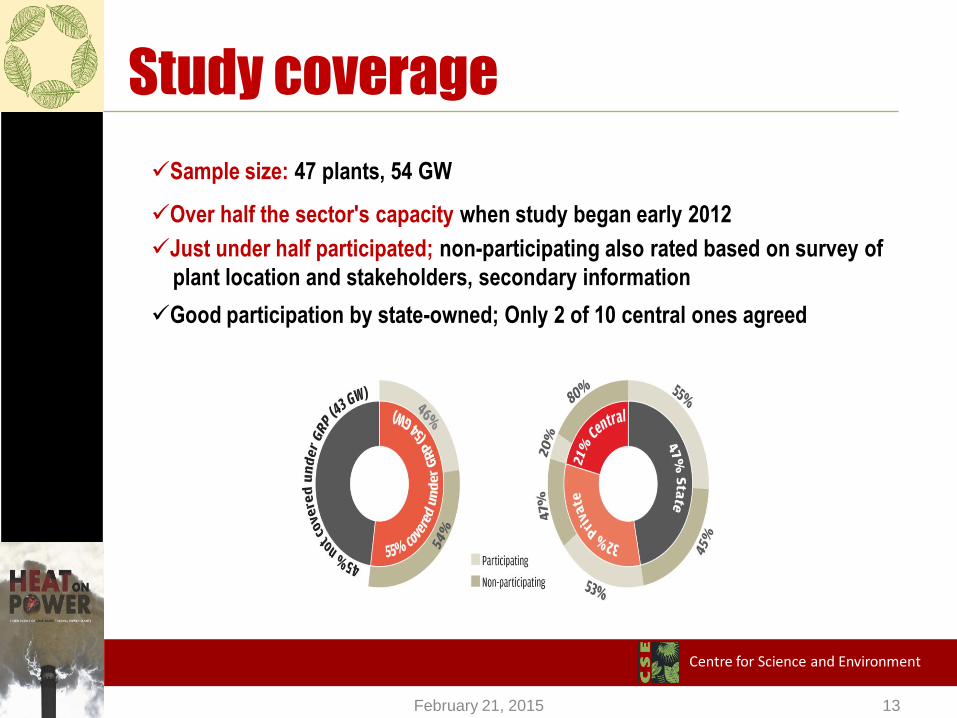
Study coverage
February 21, 2015 13
Sample size: 47 plants, 54 GW
Over half the sector's capacity when study began early 2012
Just under half participated; non-participating also rated based on survey of
plant location and stakeholders, secondary information
Good participation by state-owned; Only 2 of 10 central ones agreed
Centre for Science and Environment
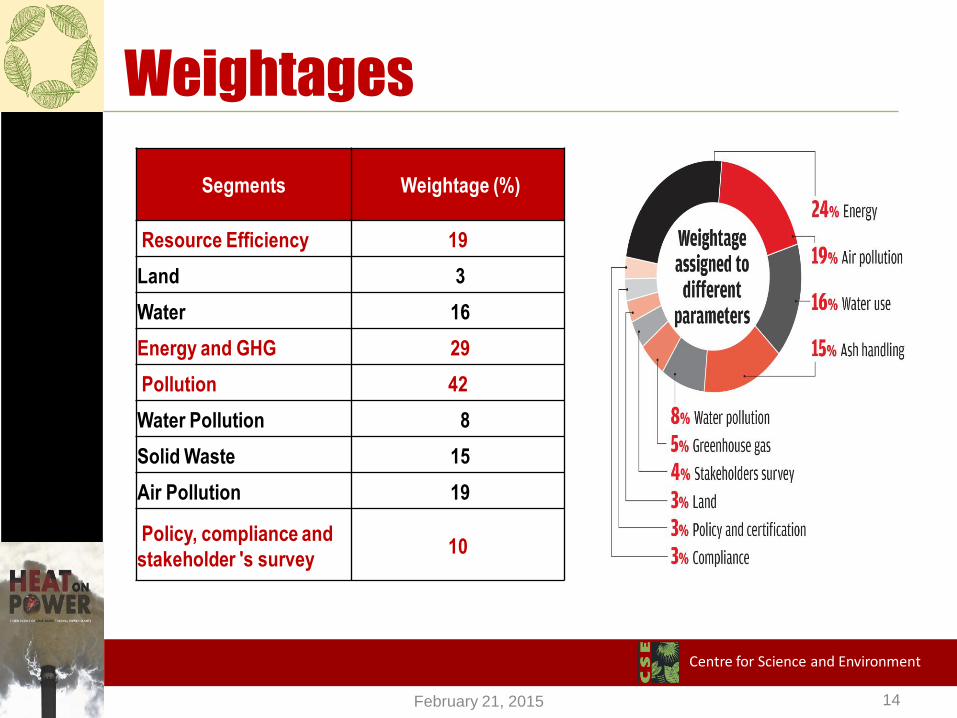
Weightages
Segments Weightage (%)
Resource Efficiency 19
Land 3
Water 16
Energy and GHG 29
Pollution 42
Water Pollution 8
Solid Waste 15
Air Pollution 19
Policy, compliance and
stakeholder 's survey10
February 21, 2015 14

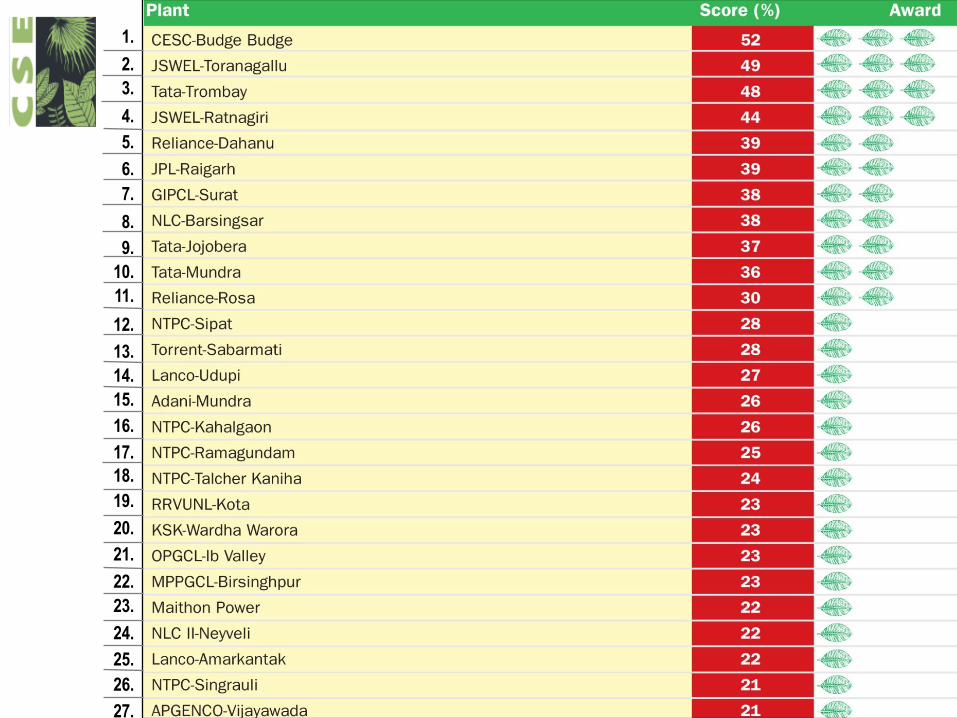
THE
TOP THREE
Centre for Science and Environment

TrombayPower: 3RD BEST PLANT SCORE - 48 %
Two coal- fired units (250MW and 500 MW)
One of the highest plant availability; 94%
Dry Fly ash handling; 100 % Fly ash use
Coastal plant; low fresh water need;0.5
m3/MWh
Average efficiency; 34 %
Above average pollution control; FGD for SO2
emission control
Centre for Science and Environment
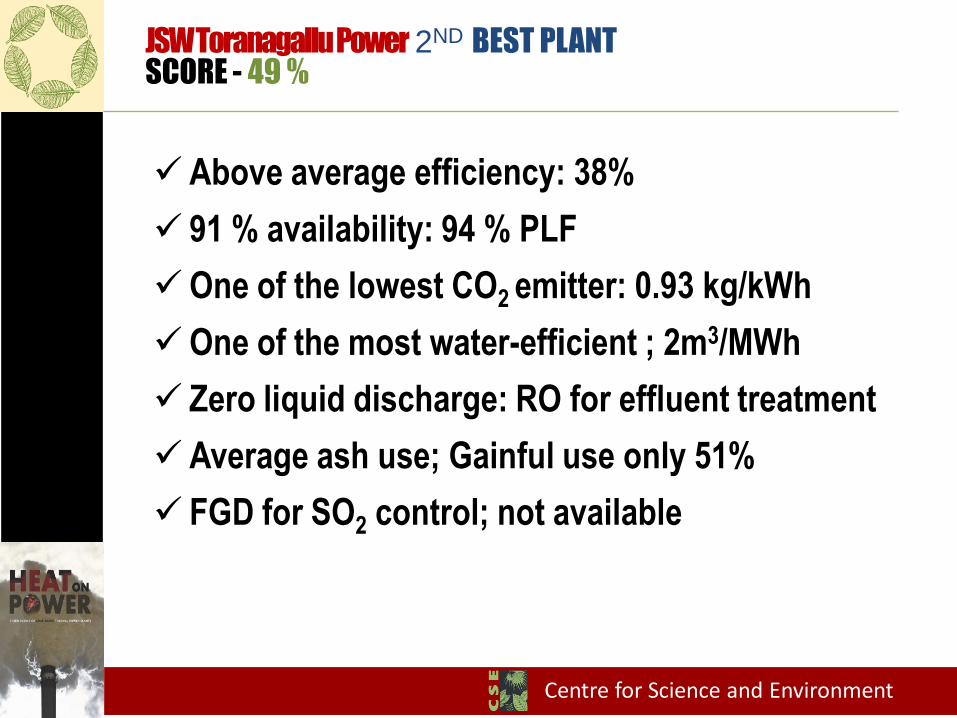
Above average efficiency: 38%
91 % availability: 94 % PLF
One of the lowest CO2 emitter: 0.93 kg/kWh
One of the most water-efficient ; 2m3/MWh
Zero liquid discharge: RO for effluent treatment
Average ash use; Gainful use only 51%
FGD for SO2 control; not available
JSW ToranagalluPower 2ND BEST PLANT SCORE - 49 %
Centre for Science and Environment
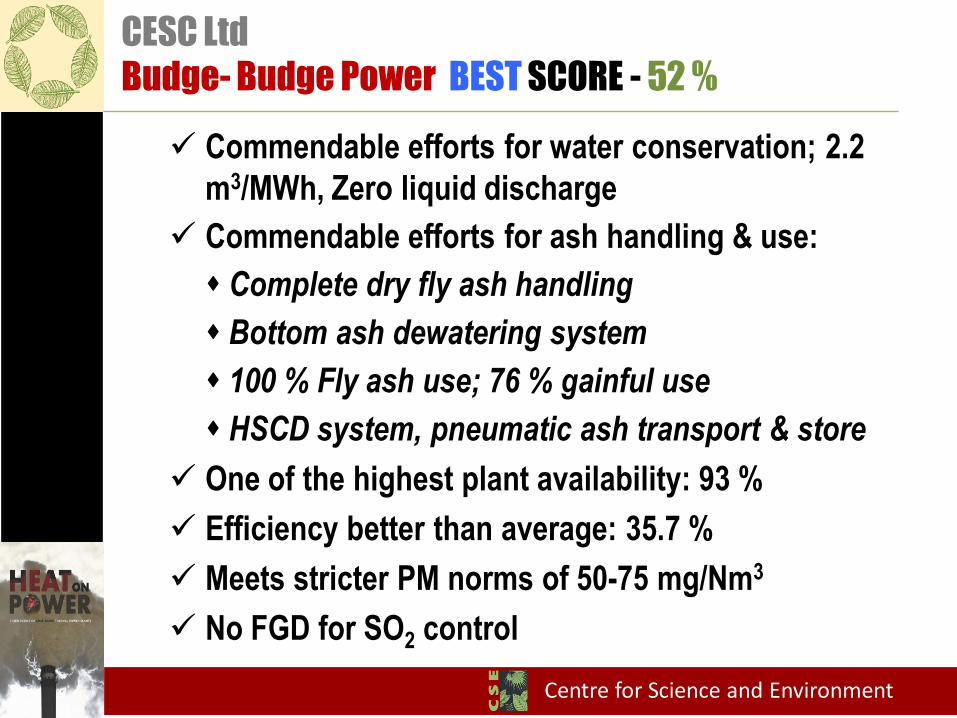
CESC Ltd
Budge- Budge Power BEST SCORE - 52 %
Commendable efforts for water conservation; 2.2
m3/MWh, Zero liquid discharge
Commendable efforts for ash handling & use:
s Complete dry fly ash handling
s Bottom ash dewatering system
s 100 % Fly ash use; 76 % gainful use
s HSCD system, pneumatic ash transport & store
One of the highest plant availability: 93 %
Efficiency better than average: 35.7 %
Meets stricter PM norms of 50-75 mg/Nm3
No FGD for SO2 control
Centre for Science and Environment
Centre for Science and Environment
Centre for Science and Environment
1.
2.
3.
4.
5.
6.
7.
9.
10.
11.
12.
13.
14.
15.
16.
17.
18.
19.
20.
21.
22.
23.
24.
25.
26.
27.
8.

Centre for Science and Environment
Centre for Science and Environment
38.
28.
29.
30.
31.
32.
33.
34.
35.
36.
37.
39.
40.
41.
42.
43.
44.
45.
46.
47.

WAY AHEAD
Centre for Science and Environment
Centre for Science and Environment
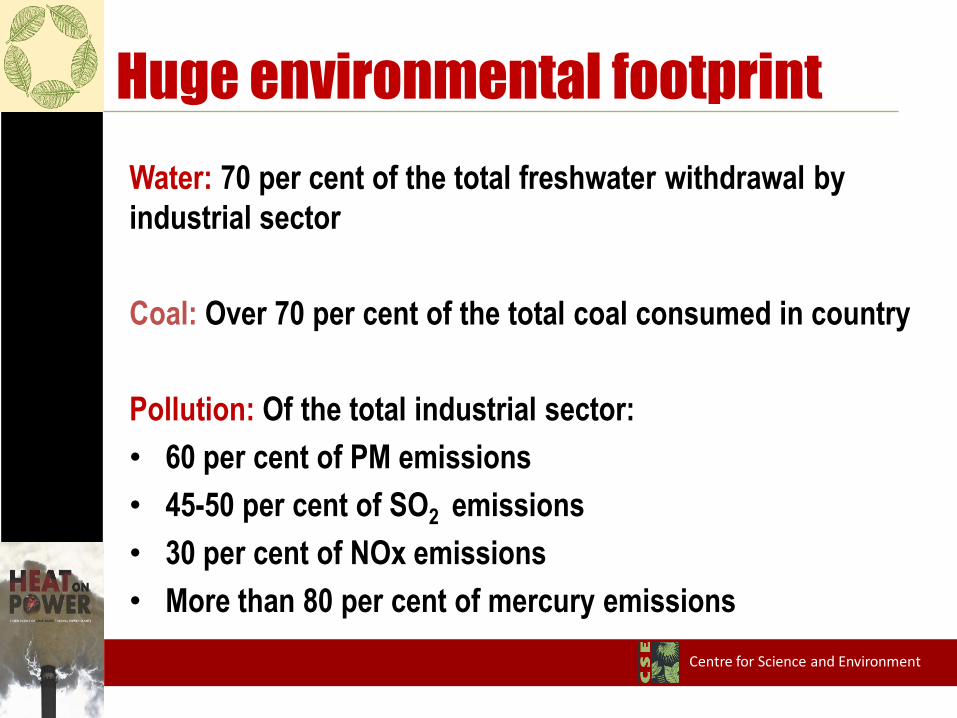
Water: 70 per cent of the total freshwater withdrawal by
industrial sector
Coal: Over 70 per cent of the total coal consumed in country
Pollution: Of the total industrial sector:
• 60 per cent of PM emissions
• 45-50 per cent of SO2 emissions
• 30 per cent of NOx emissions
• More than 80 per cent of mercury emissions
Huge environmental footprint
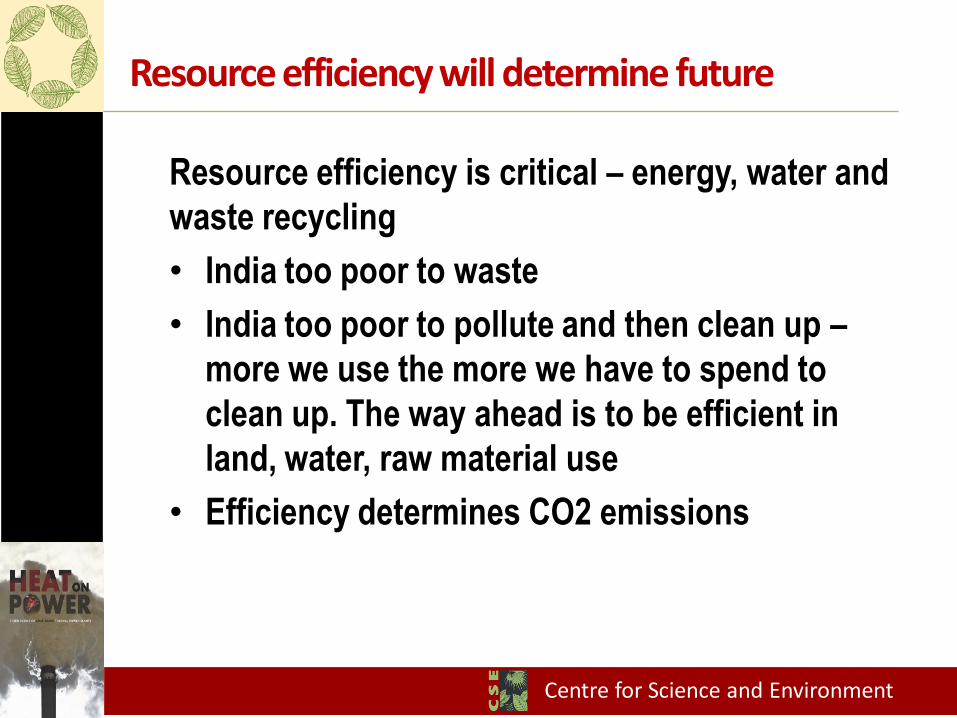
Resource efficiency will determine future
Resource efficiency is critical – energy, water and
waste recycling
• India too poor to waste
• India too poor to pollute and then clean up –
more we use the more we have to spend to
clean up. The way ahead is to be efficient in
land, water, raw material use
• Efficiency determines CO2 emissions
Centre for Science and Environment
Centre for Science and Environment
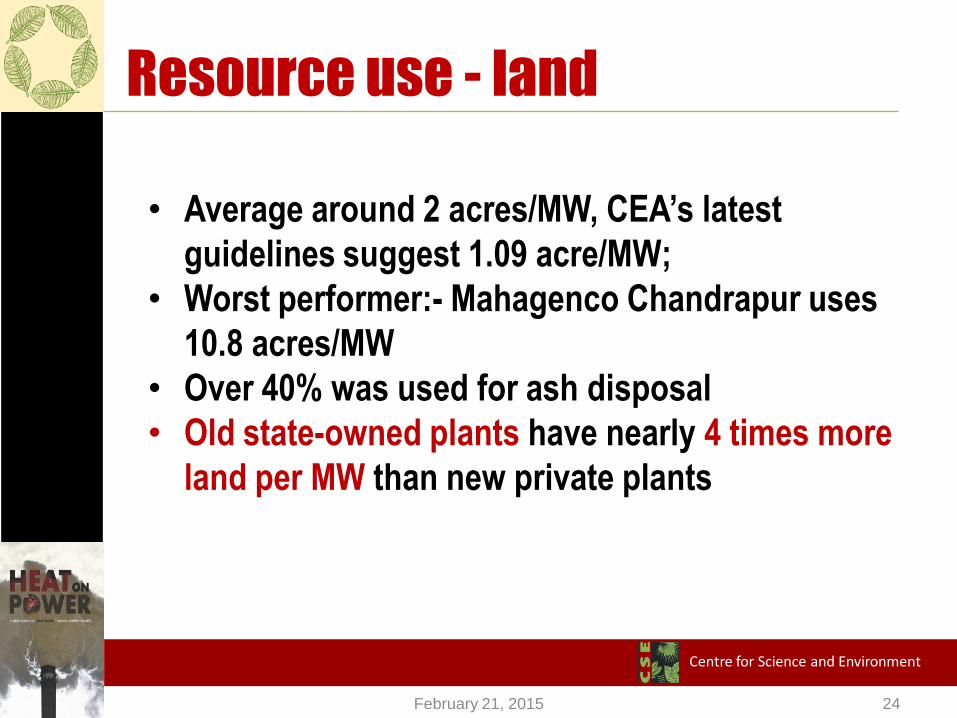
Resource use - land
• Average around 2 acres/MW, CEA’s latest
guidelines suggest 1.09 acre/MW;
• Worst performer:- Mahagenco Chandrapur uses
10.8 acres/MW
• Over 40% was used for ash disposal
• Old state-owned plants have nearly 4 times more
land per MW than new private plants
February 21, 2015 24
Centre for Science and Environment
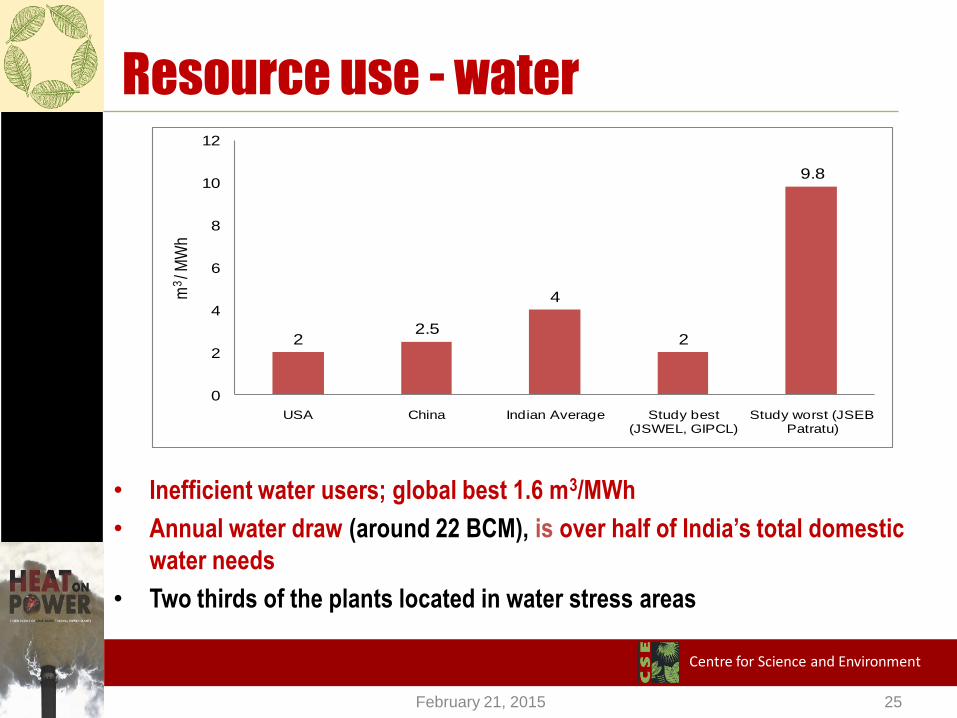
Resource use - water
• Inefficient water users; global best 1.6 m3/MWh
• Annual water draw (around 22 BCM), is over half of India’s total domestic
water needs
• Two thirds of the plants located in water stress areas
22.5
4
2
9.8
0
2
4
6
8
10
12
USA China Indian Average Study best (JSWEL, GIPCL)
Study worst (JSEB Patratu)
m3 / M
Wh
February 21, 2015 25
Centre for Science and Environment
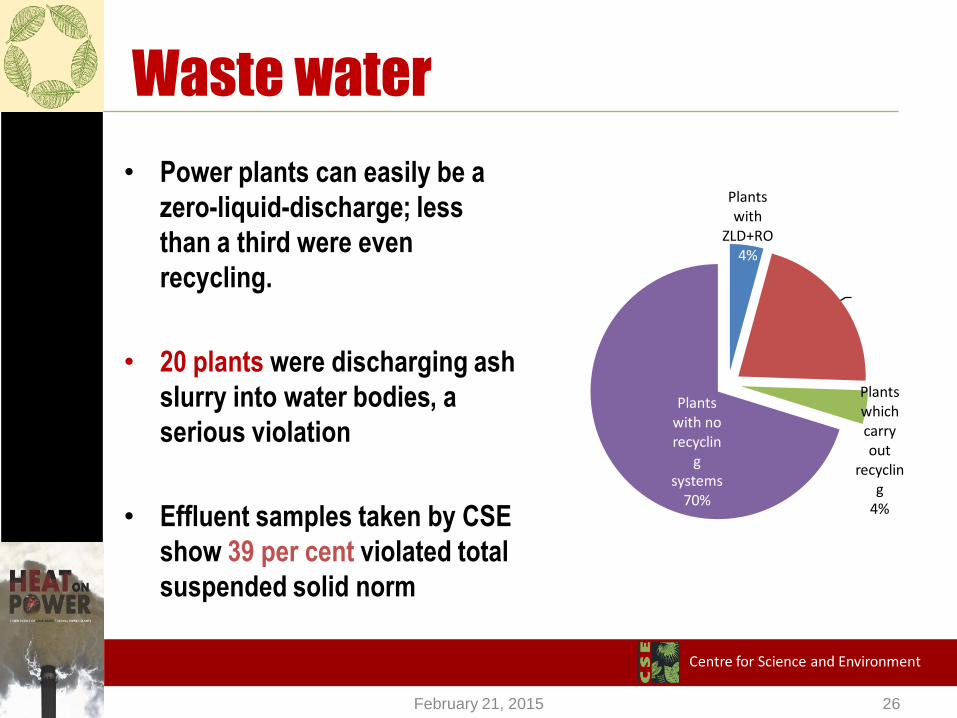
Waste water
• Power plants can easily be a
zero-liquid-discharge; less
than a third were even
recycling.
• 20 plants were discharging ash
slurry into water bodies, a
serious violation
• Effluent samples taken by CSE
show 39 per cent violated total
suspended solid norm
Plants with
ZLD+RO4%
Plants that have ZLD
without RO
22%
Plants which carry out
recycling
4%
Plants with no recyclin
g systems
70%
February 21, 2015 26
Centre for Science and Environment
• Norms for water use should be incorporated in clearances.
• MoEF draft notification April 2015
• All plants with once through cooling (OTC) to install cooling
tower and achieve specific water consumption max 4
m3/MWh within 2 years
• CT plants to reduce to 3.5 m3/Mhr
• New plants after Jan 2017 to have 2.5 m3/Mhr/zero liquid
discharge
Way forward: set norms
Centre for Science and Environment
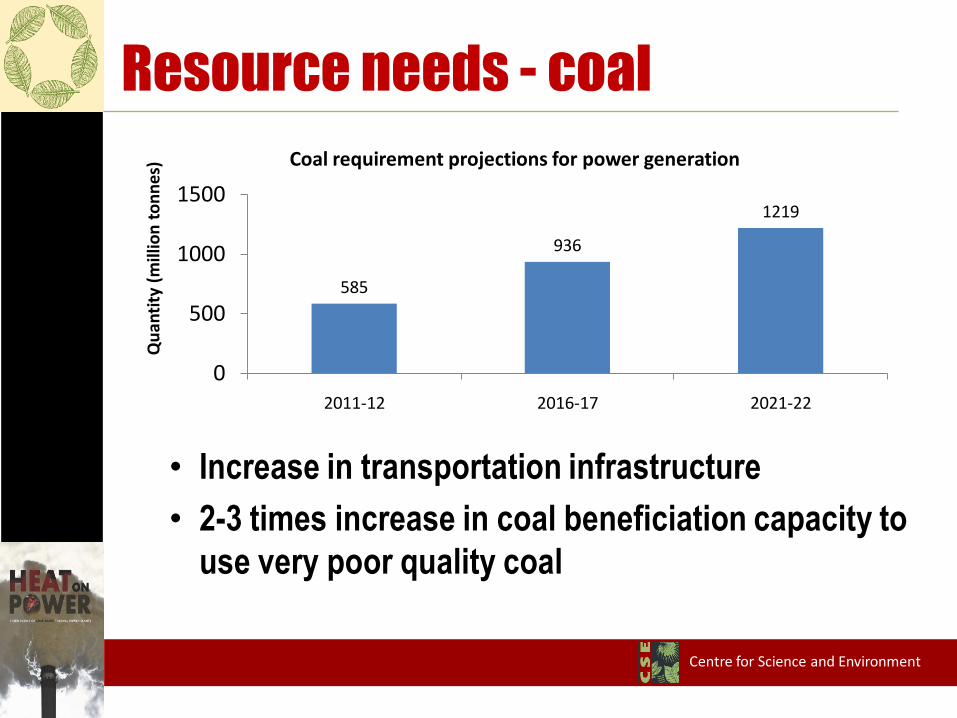
• Increase in transportation infrastructure
• 2-3 times increase in coal beneficiation capacity to
use very poor quality coal
585
936
1219
0
500
1000
1500
2011-12 2016-17 2021-22
Qu
anti
ty (
mill
ion
to
nn
es) Coal requirement projections for power generation
Resource needs - coal
Centre for Science and Environment
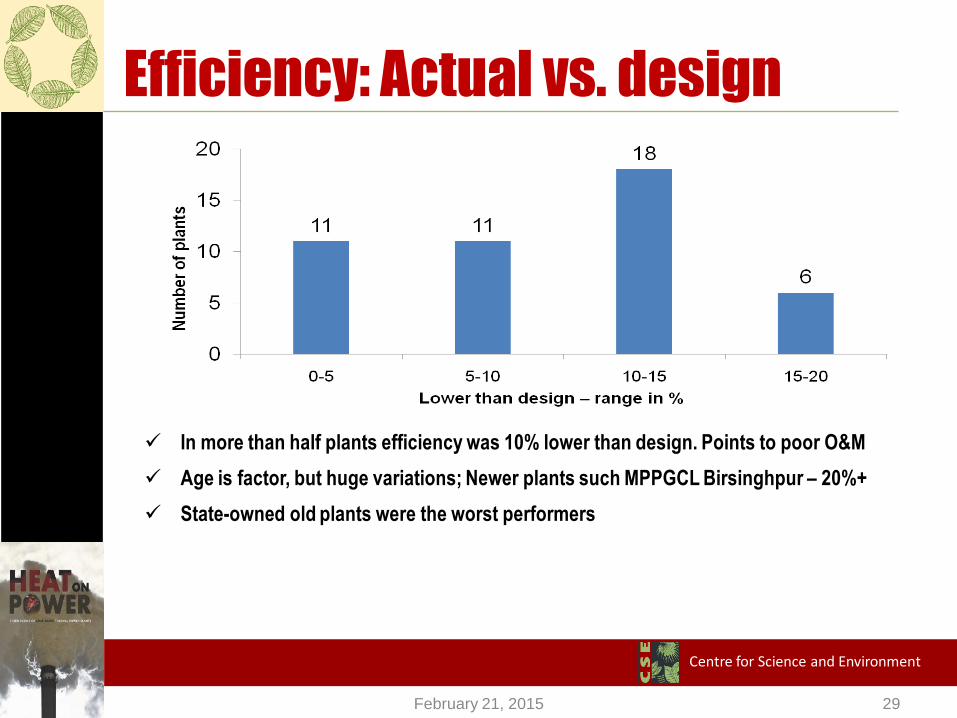
Efficiency: Actual vs. design
In more than half plants efficiency was 10% lower than design. Points to poor O&M
Age is factor, but huge variations; Newer plants such MPPGCL Birsinghpur – 20%+
State-owned old plants were the worst performers
February 21, 2015 29
Centre for Science and Environment
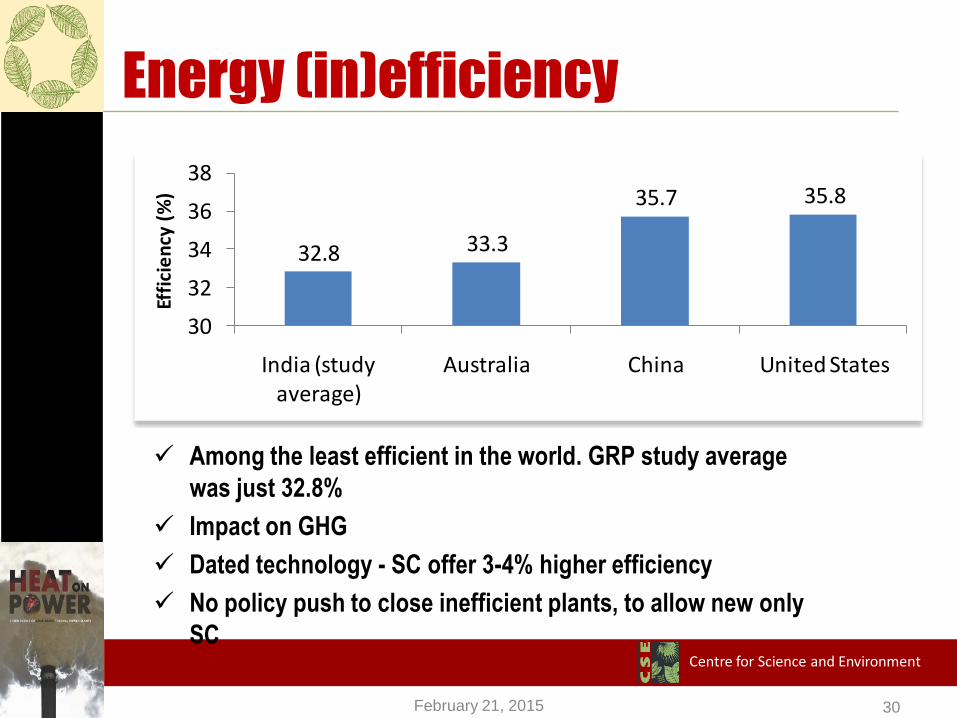
Energy (in)efficiency
32.8 33.3
35.7 35.8
30
32
34
36
38
India (study average)
Australia China United States
Effi
cie
ncy
(%
)
Among the least efficient in the world. GRP study average
was just 32.8%
Impact on GHG
Dated technology - SC offer 3-4% higher efficiency
No policy push to close inefficient plants, to allow new only
SC
February 21, 2015 30
Centre for Science and Environment
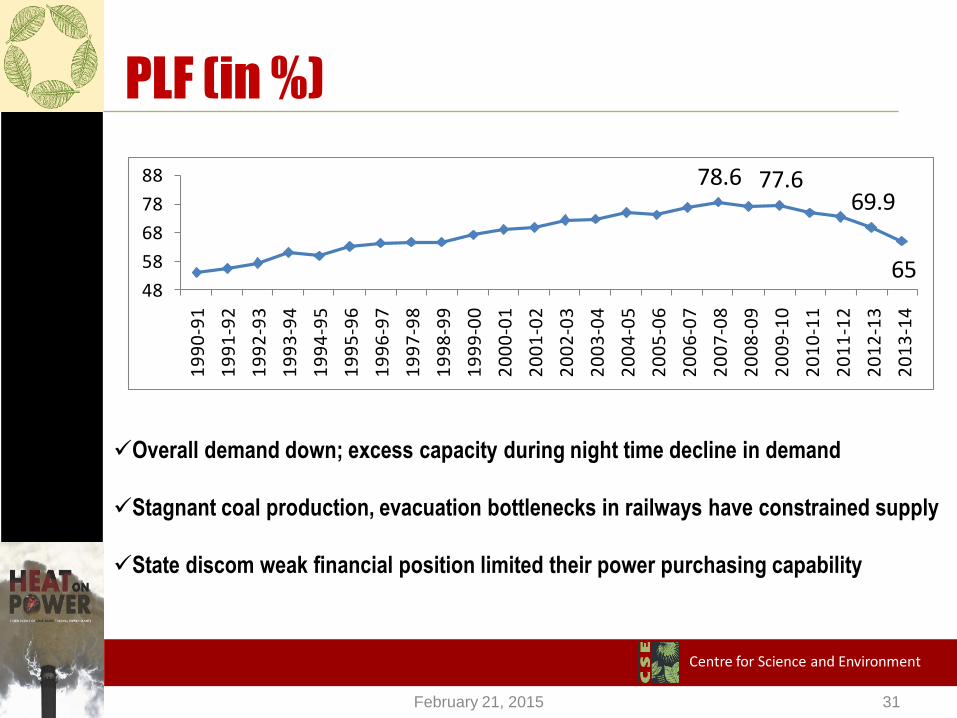
PLF (in %)
78.6 77.669.9
6548
58
68
78
881
99
0-9
1
19
91
-92
19
92
-93
19
93
-94
19
94
-95
19
95
-96
19
96
-97
19
97
-98
19
98
-99
19
99
-00
20
00
-01
20
01
-02
20
02
-03
20
03
-04
20
04
-05
20
05
-06
20
06
-07
20
07
-08
20
08
-09
20
09
-10
20
10
-11
20
11
-12
20
12
-13
20
13
-14
Overall demand down; excess capacity during night time decline in demand
Stagnant coal production, evacuation bottlenecks in railways have constrained supply
State discom weak financial position limited their power purchasing capability
February 21, 2015 31
Centre for Science and Environment
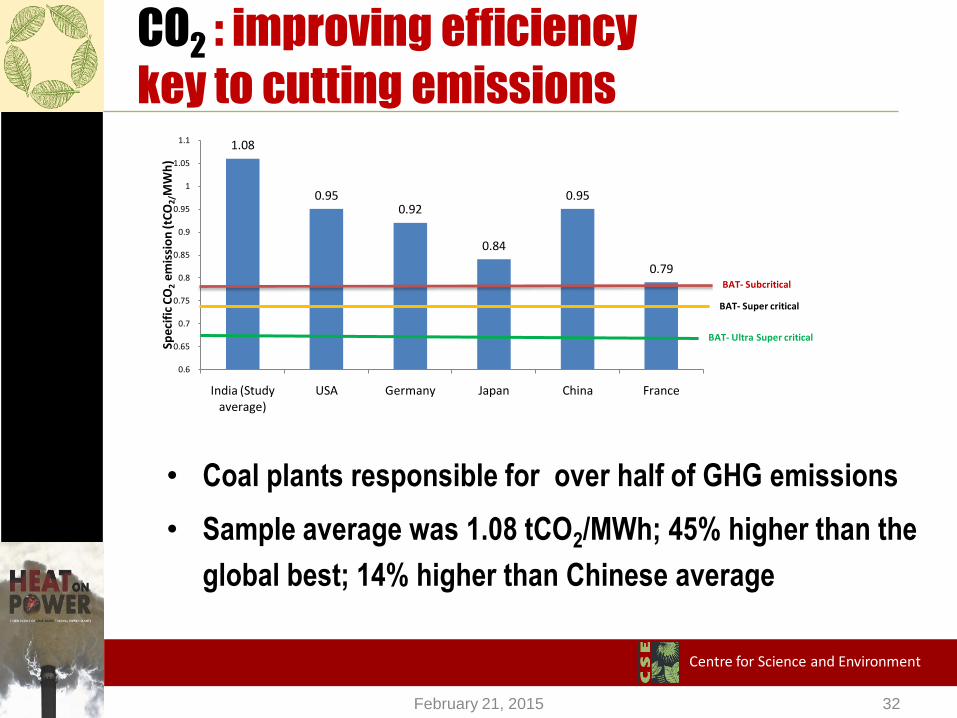
• Coal plants responsible for over half of GHG emissions
• Sample average was 1.08 tCO2/MWh; 45% higher than the
global best; 14% higher than Chinese average
CO2 : improving efficiency
key to cutting emissions
February 21, 2015 32
1.08
0.950.92
0.84
0.95
0.79
0.6
0.65
0.7
0.75
0.8
0.85
0.9
0.95
1
1.05
1.1
India (Study average)
USA Germany Japan China France
Spe
cifi
c C
O2
em
issi
on
(tC
O2
/MW
h)
BAT- Subcritical
BAT- Super critical
BAT- Ultra Super critical
Centre for Science and Environment
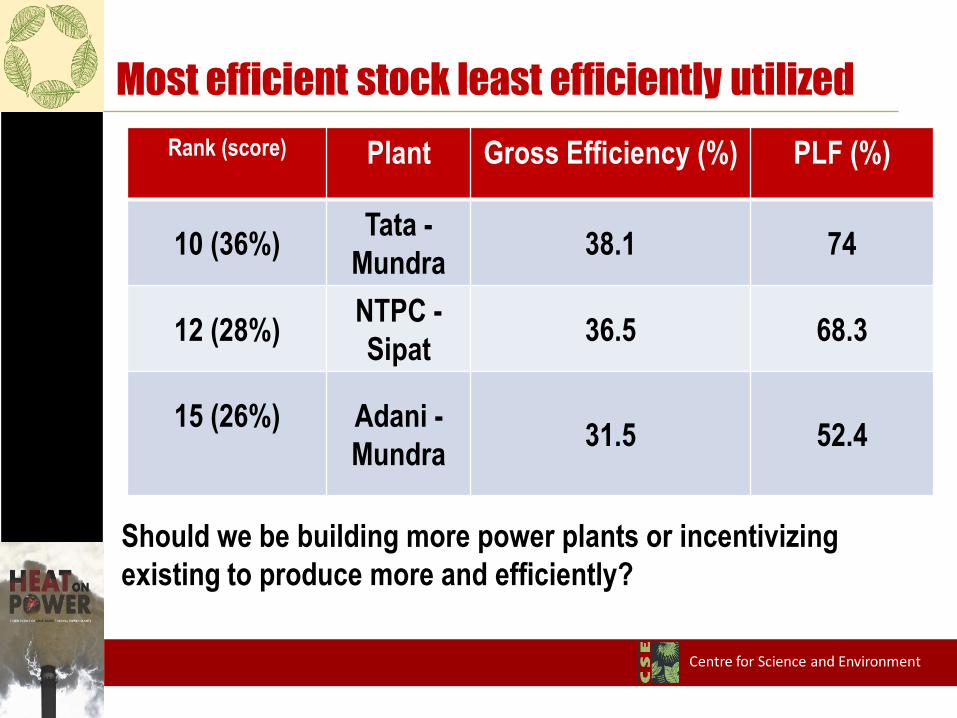
Should we be building more power plants or incentivizing
existing to produce more and efficiently?
Most efficient stock least efficiently utilized
Rank (score) Plant Gross Efficiency (%) PLF (%)
10 (36%)Tata -
Mundra38.1 74
12 (28%)NTPC -
Sipat36.5 68.3
15 (26%) Adani -
Mundra31.5 52.4
Centre for Science and Environment
Centre for Science and Environment
• Old inefficient plants that are heavily polluting should
be retired or modernized at an accelerated pace;
Environmental clearance process should incentivize
this
• New capacities should be only supercritical/ultra
super critical
• Inclusion of environmental costs/ compliance in Merit
Order Dispatch; we should ensure that most efficient
stock is utilised the most and polluting plants are not
called first because they are cheaper.
Way forward: Technology and efficiency

Centre for Science and Environment
Air Pollution - PM
• National PM emission norms lax (150- 350 mg/Nm3), China: 30 mg/Nm3.
• More than half violating, of which 85 per cent were state plants
• No national NOx ,SO2, and Hg standards
• Ambient Air Quality – only 7 monitor continuously
0
20
40
60
80
100
120
140
Central State Private
Nu
mb
er
of
Un
its
Ownership
High visible emission Emission Visible No visible emission
February 21, 2015 36
Centre for Science and Environment
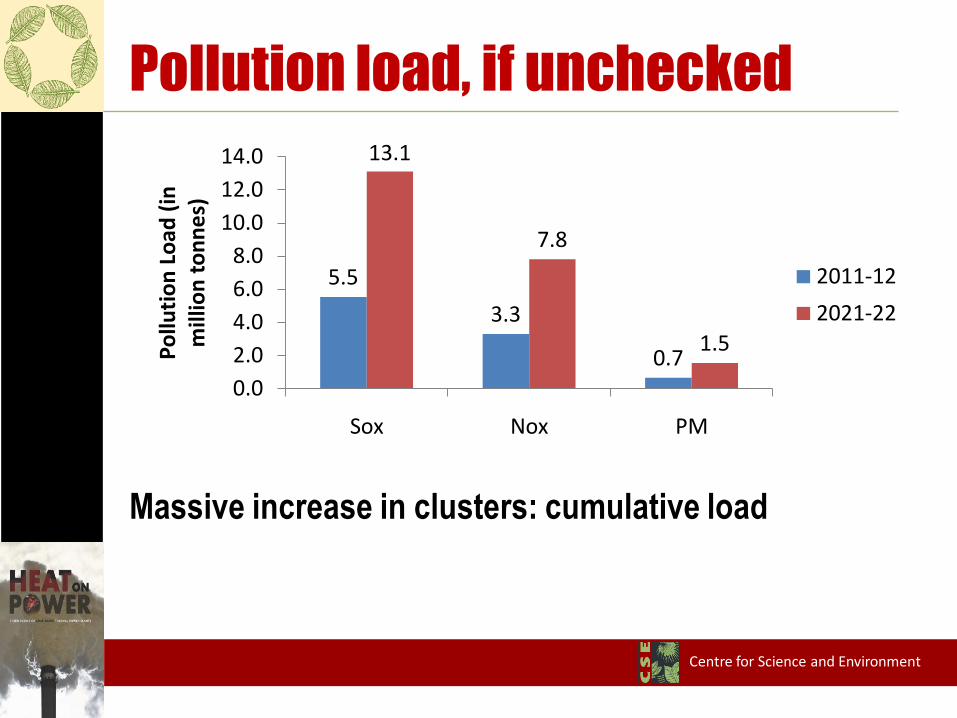
Massive increase in clusters: cumulative load
Pollution load, if unchecked
5.5
3.3
0.7
13.1
7.8
1.5
0.0
2.0
4.0
6.0
8.0
10.0
12.0
14.0
Sox Nox PM
Po
lluti
on
Lo
ad (
in
mill
ion
to
nn
es)
2011-12
2021-22

Centre for Science and Environment
Mismatch between regulation and
environmental footprint
China China(polluted regions)
India
PM (mg/Nm3) 30 20150-350
(50 for some)
SO2 (mg/Nm3) 100 50 None
NOx (mg/Nm3)100 100 None
Hg (mg/m3) 0.03 0.03 None
Centre for Science and Environment
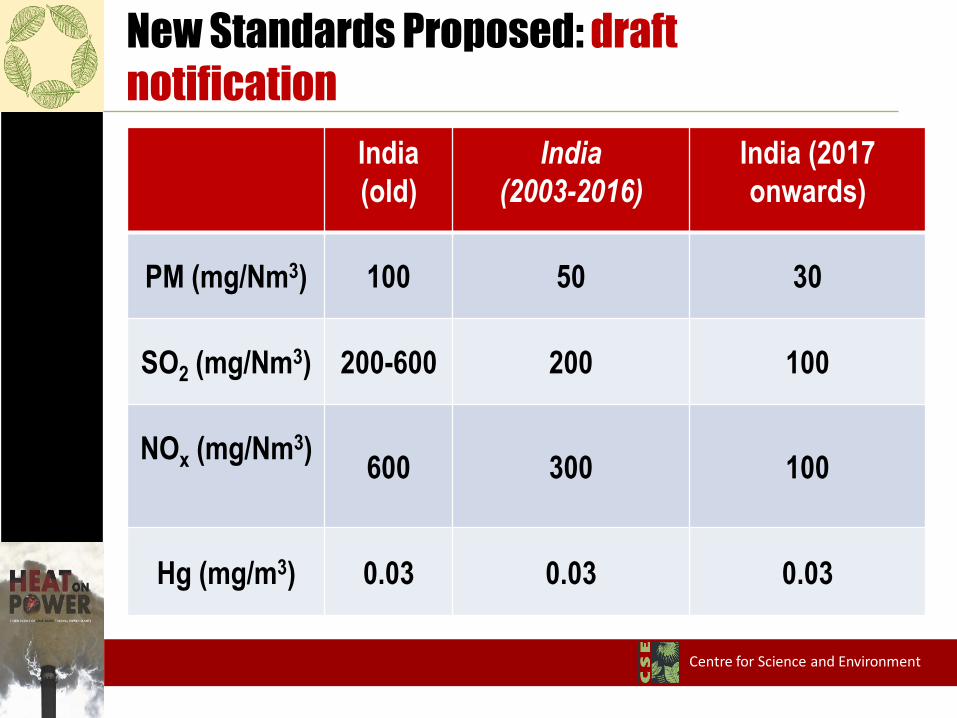
New Standards Proposed: draft
notification
India
(old)
India
(2003-2016)
India (2017
onwards)
PM (mg/Nm3) 100 50 30
SO2 (mg/Nm3) 200-600 200 100
NOx (mg/Nm3)600 300 100
Hg (mg/m3) 0.03 0.03 0.03

Centre for Science and Environment
Solid waste - Ash
Second largest solid waste stream of the country.
Average utilisation during 2010-13 was only 53 per cent for plants in study
However, one-third of this was not beneficial.
Unused ash dumped in poorly maintained ponds (around 80% non
compliance – lining, leakage, no piezometers)
50 53 57
0
20
40
60
80
100
0
10
20
30
40
50
60
70
80
90
2010-11 2011-12 2012-13
Pe
rce
nta
ge
Uti
lis
ati
on
As
h G
en
era
tio
n i
n m
t
Ash Generation in mt Ash Utilization in mt Percentage Utilisation
February 21, 2015 40
Centre for Science and Environment
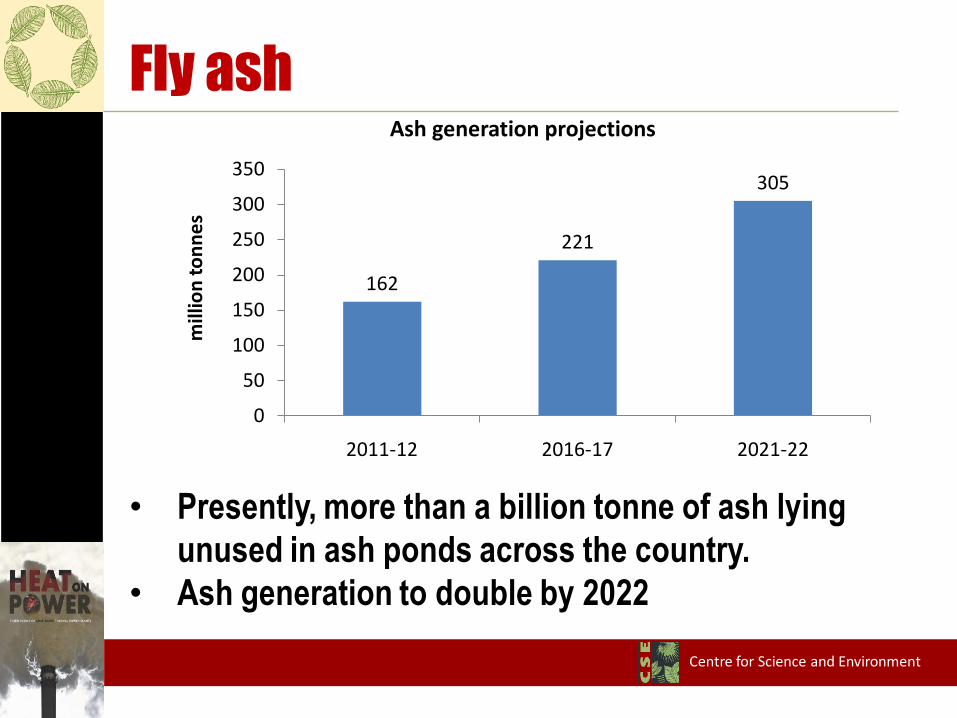
Fly ash
162
221
305
0
50
100
150
200
250
300
350
2011-12 2016-17 2021-22
mill
ion
to
nn
es
Ash generation projections
• Presently, more than a billion tonne of ash lying
unused in ash ponds across the country.
• Ash generation to double by 2022
Centre for Science and Environment
• Most plants will not meet ash use targets due to inadequate
supporting policies to increase use;
• Policies and regulations to change
– Promotion, standards for utilisation and then strict
implementation of policies on ash use in infrastructure,
bricks, cement industry etc.
– Loopholes that allow dumping, yet consider it utilization
(for eg. in low lying areas) need to be addressed;
– Standards and guidelines for use of ash for mine filling
– Flexible regulation to take into consideration plant
location
Way forward: Ash Handling
Centre for Science and Environment
• Pollution monitoring and control by regulators are weak;
need capacity and tools
• Protocol and infrastructure for online monitoring
• Institutional strengthening and use of multiple tool to
enforce norms
• Have to improve regulatory capacity for pollution control
• Cannot do environmental management without attention to
goverance
Way forward: Improved assessment and
regulatory tool
Centre for Science and Environment
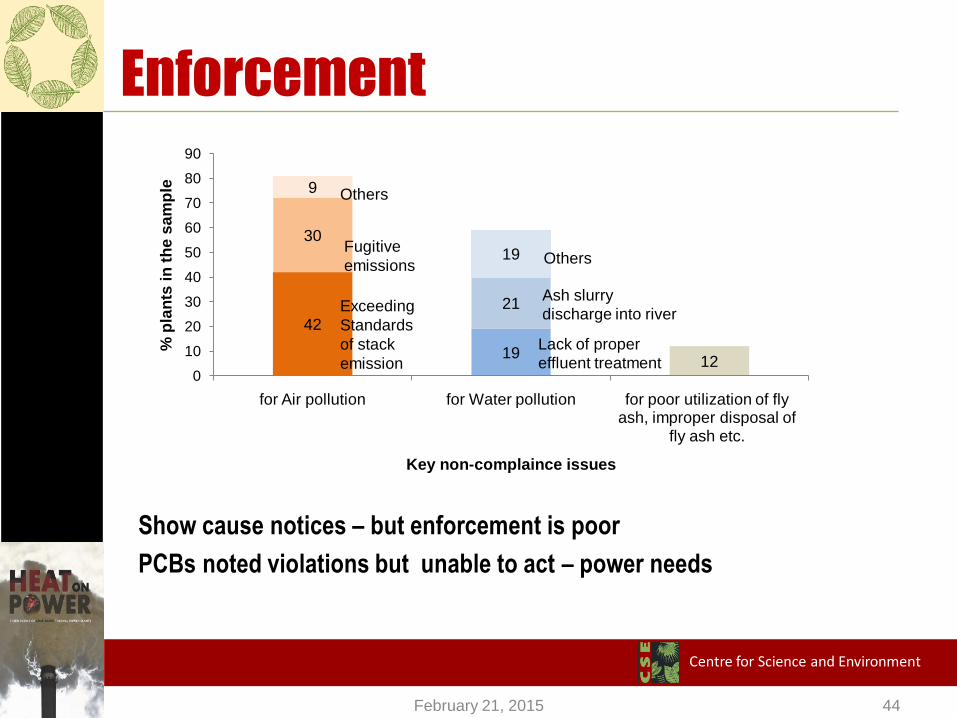
Enforcement
42
1912
30
21
9
19
0
10
20
30
40
50
60
70
80
90
for Air pollution for Water pollution for poor utilization of fly ash, improper disposal of
fly ash etc.
% p
lan
ts i
n t
he
sa
mp
le
Key non-complaince issues
Exceeding
Standards
of stack
emission
Fugitive
emissions
Others
Others
Ash slurry
discharge into river
Lack of proper
effluent treatment
Show cause notices – but enforcement is poor
PCBs noted violations but unable to act – power needs
February 21, 2015 44
Centre for Science and Environment
Coal is not the question
Question is energy access; pollution and need to meet
the needs of all without blowing up the world
Must learn how we can do much more with less – tread
lightly on Earth
Conclusion