green consumers’ skepticism toward pro-environmental
TRANSCRIPT

University of Tennessee, Knoxville University of Tennessee, Knoxville
TRACE: Tennessee Research and Creative TRACE: Tennessee Research and Creative
Exchange Exchange
Doctoral Dissertations Graduate School
8-2017
Green Consumers’ Skepticism toward Pro-Environmental Green Consumers’ Skepticism toward Pro-Environmental
Advertising: Consumer Motivations for Purchasing Pro-Advertising: Consumer Motivations for Purchasing Pro-
Environmental Products Environmental Products
Jinhee Lee University of Tennessee, Knoxville, [email protected]
Follow this and additional works at: https://trace.tennessee.edu/utk_graddiss
Recommended Citation Recommended Citation Lee, Jinhee, "Green Consumers’ Skepticism toward Pro-Environmental Advertising: Consumer Motivations for Purchasing Pro-Environmental Products. " PhD diss., University of Tennessee, 2017. https://trace.tennessee.edu/utk_graddiss/4698
This Dissertation is brought to you for free and open access by the Graduate School at TRACE: Tennessee Research and Creative Exchange. It has been accepted for inclusion in Doctoral Dissertations by an authorized administrator of TRACE: Tennessee Research and Creative Exchange. For more information, please contact [email protected].

To the Graduate Council:
I am submitting herewith a dissertation written by Jinhee Lee entitled "Green Consumers’
Skepticism toward Pro-Environmental Advertising: Consumer Motivations for Purchasing Pro-
Environmental Products." I have examined the final electronic copy of this dissertation for form
and content and recommend that it be accepted in partial fulfillment of the requirements for the
degree of Doctor of Philosophy, with a major in Communication and Information.
Eric Haley, Major Professor
We have read this dissertation and recommend its acceptance:
Ronald E. Taylor, Michael J. Palenchar, David Schumann
Accepted for the Council:
Dixie L. Thompson
Vice Provost and Dean of the Graduate School
(Original signatures are on file with official student records.)

Green Consumers’ Skepticism toward Pro-Environmental Advertising:
Consumer Motivations for Purchasing Pro-Environmental Products
A Dissertation Presented for the
Doctor of Philosophy
Degree
The University of Tennessee, Knoxville
Jinhee Lee
August 2017

ii
Copyright © 2017 by Jinhee Lee
All rights reserved.

iii
ACKNOWLEDGMENTS
I would like to express my sincere gratitude to the numerous people who have helped me
complete this dissertation. First, I want to express my appreciation to Dr. Eric Haley, my
dissertation chair, for his invaluable guidance and exceptional support. Among other things, he
always encouraged me to be a good researcher and teacher and supported my progress during the
course of my master’s and doctoral programs at the University of Tennessee. His insights,
patience, and the time he set aside for me in the midst of a busy schedule helped me immensely
while I was working on my doctorate. I would also like to thank Dr. Ronald Taylor, Dr. Michael
Palenchar, and Dr. David Schumann, my dissertation committee, for offering helpful advice and
insightful feedback on my dissertation. During my master’s and doctoral programs, I gained
invaluable knowledge from all four of my professors and their classes and works have helped to
develop my scholarly abilities. I am honored that all of you thought enough of me to support me
in achieving my doctorate.
My special thanks go to my family, especially my husband Dr. Dongseok Kang, my
parents, and parents-in-law. Without their love and sacrifice, I would not have been able to
complete my doctorate. Thank you so much for always believing in me, even when my
confidence was low. Last but certainly not least, I want to thank my sister and brother. Their
warm support and encouragement cheered me up and helped me to continue focusing on my
dissertation.
I thank you all!

iv
ABSTRACT
Green consumers’ skepticism regarding pro-environmental advertising is the subject of
extensive scholarly debate as researchers have conflicting perspectives on whether or not green
consumers are indeed skeptical of pro-environmental advertising. These opposing viewpoints are
used to support the respective researchers’ assertions regarding how green consumers evaluate
pro-environmental advertising. The differing approaches on green consumers’ skepticism
toward, and evaluations of, pro-environmental advertising seem to stem from how previous
studies have identified green consumers. Inconsistent descriptions of green consumers may thus
be the primary issue in this debate. The purpose of this study was therefore (a) to suggest the
most appropriate way to identify green consumers, (b) to group green consumers into segments
based on their motivations for purchasing pro-environmental products, (c) to reveal each
segment’s characteristics, and (d) to explore the differences in the attitudes of the consumers in
the segments, particularly their levels of skepticism about pro-environmental products.
Two online surveys were conducted, namely a pre-test and a main test. Amazon
Mechanical Turk was used to recruit survey participants for both tests. The responses of 100
participants in the pre-test and 408 in the main test were analyzed. A two-step clustering analysis
(i.e., hierarchical and K-means cluster analysis) and one-way ANOVA were used to analyze the
data.
Based on the results, six distinct green consumers segments were identified: Segment 1
(With Nature), Segment 2 (Follower), Segment 3 (My Green Life), Segment 4 (Conspicuous
Green Life), Segment 5 (All-Rounder), and Segment 6 (Challenger). Accordingly, the different
green consumer segments display a wide range of distinct sociodemographic characteristics,
media preferences, pro-environmental product usage patterns, and perceptions about their pro-

v
environmental product knowledge. The study findings further suggested inverse relationships
between perceived knowledge, skepticism, and attitudes.
The study has several theoretical and practical implications. First, it helps strengthen our insights
into the various types of green consumers, and second, it expands our understanding of why they
have the skepticism and attitudes that they do. This study also makes recommendations regarding
the appropriate target consumers for pro-environmental products and advertising, as well as the
advertising strategies that may appeal to these consumers.
Keywords: Green consumer, pro-environmental advertising, market segmentation, personal
motivations, social motivations, environmental motivations, skepticism toward pro-
environmental advertising, and advertising attitude.

vi
TABLE OF CONTENTS
CHAPTER 1: INTRODUCTION ........................................................................................1
RESEARCH BACKGROUND ......................................................................................1
PURPOSE OF THE STUDY ..........................................................................................5
CHAPTER 2: LITERATURE REVIEW ............................................................................9
GREEN CONSUMERS ..................................................................................................9
SEGMENTING GREEN CONSUMERS .....................................................................13
GREEN CONSUMERS’ MOTIVATIONS ...................................................................16
Personal Motivation ..................................................................................................16
Economic motivation ............................................................................................16
Social status ..........................................................................................................17
Health concerns .....................................................................................................17
Social Motivation ......................................................................................................18
Social norms ..........................................................................................................18
Cultural values ......................................................................................................19
Environmental Motivation ........................................................................................20
Environmental concerns ........................................................................................20
Perceived environmental responsibility ................................................................21
SKEPTICISM TOWARD ADVERTISING .................................................................21
Green Consumer’s Skepticism toward Pro-Environmental Advertising ..................23
RESEARCH QUESTIONS ..........................................................................................24
CHAPTER 3: METHOD ..................................................................................................27
SURVEY OVERVIEW ................................................................................................27
SURVEY PARTICIPANTS .........................................................................................27
SRUVEY PROCEDURE ..............................................................................................30
Amazon Mechanical Turk .........................................................................................30
Survey Procedure ......................................................................................................31
MEASUREMENT ........................................................................................................33
Pro-Environmental Product Usage ...........................................................................33
Pro-Environmental Media Preferences .....................................................................37
Pro-Environmental Product Knowledge ...................................................................38
Consumer Motivations ..............................................................................................38
Personal motivation ..............................................................................................38
Social motivation ..................................................................................................39
Environmental motivation ....................................................................................39
Skepticism and Attitude ............................................................................................40
Demographic Information .........................................................................................40
Attention-Checking Questions ..................................................................................41
CHAPTER 4: ANALYSIS AND RESULTS ...................................................................42
SCALE REFINEMENT ................................................................................................42

vii
Procedure of Refining Scales ....................................................................................42
Scale refinement ....................................................................................................43
Confirmatory factor analysis .................................................................................44
CLUSTERING ANALYSIS .........................................................................................46
Analysis Overview ....................................................................................................46
Hierarchical Cluster Analysis ...................................................................................47
K-means Cluster Analysis .........................................................................................50
TESTING RESEARCH QUESTIONS .........................................................................53
RQ1. Segmenting Green Consumers ........................................................................53
Segment 1: With Nature........................................................................................ 53
Segment 2: Follower .............................................................................................53
Segment 3: My Green Life ...................................................................................54
Segment 4: Conspicuous Green Life ....................................................................54
Segment 5: All-Rounder .......................................................................................54
Segment 6: Challenger ..........................................................................................54
RQ2. Characteristics of Green Consumers ...............................................................60
Demographics .......................................................................................................60
Media preferences .................................................................................................63
Pro-environmental product usage .........................................................................67
Perceived pro-environmental product knowledge ................................................68
RQ3. Skepticism of Green Consumers .....................................................................71
RQ4: Attitudes of Green Consumers ........................................................................73
CHAPTER 5: DISCUSSION ............................................................................................76
SUMMARY OF THE STUDY .....................................................................................76
THEORETICAL IMPLICATIONS ..............................................................................77
Green Consumer Segmentation ................................................................................77
Green Consumers’ Motivations ................................................................................80
Green Consumers’ Characteristics ............................................................................83
Green Consumers’ Skepticism and Attitude .............................................................85
Green Consumers’ Experience, Knowledge, and Skepticism ..................................87
PRACTICAL IMPLICATIONS ...................................................................................89
Targeting for Pro-Environmental Products ...............................................................89
Advertising Strategy .................................................................................................91
LIMITATIONS AND SUGGESTIONS FOR FUTURE RESEARCH ........................93
REFERENCES ...............................................................................................................100
APPENDICES ................................................................................................................116
Appendix A – Online survey ......................................................................................117
Appendix B - Amazon MTurk recruitment page ........................................................133
VITA ...............................................................................................................................134

viii
LIST OF TABLES
Table 1. Sample Description .............................................................................................29
Table 2. Measurements of Main Constructs .....................................................................34
Table 3. Means and Standard Deviations, Cronbach’s α values, and Correlations ..........45
Table 4. Means and Standard Deviations of the Three to Five Segments ........................49
Table5. One-way ANOVA Results with Eight Cluster Criteria of Three to Six Cluster
Options ............... ..............................................................................................................52
Table 6. Means and Standard Deviations of the Six Segments ........................................56
Table 7. Demographic Profiles of Six Segments ..............................................................61
Table 8. Crosstab Results between Six Clusters and Pro-environmental Magazine Usage
............................. ..............................................................................................................65
Table 9. Crosstab Results between Six Clusters and Online Community Usage .............66
Table 10. Crosstab Results between Six Clusters and Pro-environmental Product
Categories .......... ..............................................................................................................68
Table 11. Means and Standard Deviations of Pro-environmental Product Knowledge
Depending on Six Segments .............................................................................................70
Table 12. One-way ANOVA Results with Pro-environmental Product Knowledge ........70
Table 13. Post-Hoc Test Results with Pro-environmental Product Knowledge ...............70
Table 14. Means and Standard Deviations of Skepticism Depending on Six Segments ..72
Table 15. One-way ANOVA Results with Skepticism .....................................................72
Table 16. Post-Hoc Test Results with Skepticism .....................................................72
Table 17. Means and Standard Deviations of Advertising Attitude Depending on
Six Segments ....... ............................................................................................................. 74
Table 18. One-way ANOVA Results with Advertising Attitude .....................................74
Table 19. Post-Hoc Test Results with Advertising Attitude .............................................74

ix
LIST OF FIGURES
Figure 1. Sociodemographic, Attitudinal, Behavioral Approaches of Identifying Green
Consumers .......... ..............................................................................................................13
Figure 2. Survey Procedure ...............................................................................................32
Figure 3. Radar Chart of the Six Segments: Segment 1 (With Nature) ............................57
Figure 4. Radar Chart of the Six Segments: Segment 2 (Follower) ................................. 57
Figure 5. Radar Chart of the Six Segments: Segment 3 (My Green Life) ........................58
Figure 6. Radar Chart of the Six Segments: Segment 4 (Conspicuous Green Life) .........58
Figure 7. Radar Chart of the Six Segments: Segment 5 (All-rounder) .............................59
Figure 8. Radar Chart of the Six Segments: Segment 6 (Challenger) ..............................59
Figure 9. The Inverse Relation among Experience, Knowledge, Skepticism, and Attitudes
by Six Segments . ..............................................................................................................89

1
CHAPTER 1: INTRODUCTION
RESEARCH BACKGROUND
Green consumption is a social phenomenon in which consumers consider the
environmental impacts of products on present and future generations before choosing to purchase
and consume such products (Carman & Cheng, 2016; Mostafa, 2006; Yang, Lu, Zhu, & Su,
2015). In line with this phenomenon, increasing numbers of consumers are showing an interest in
pro-environmental products that provide fewer environmental hazards during the production,
consumption, and disposal phases (Marcacci, 2013; Nastu, 2007; Walker, 2013). Examples of
pro-environmental products include recyclable or recycled products, ozone-free products, non-
toxic products, biodegradable products, organic products, products made with renewable
materials, and products with a low embodied carbon footprint (Federal Trade Commission Green
Guides). Some consumers believe that, by using pro-environmental products, they can help
protect the environment (Nastu, 2007; Banikarim, 2010) and are thus willing to purchase such
products (GreenBiz, 2009; Walker, 2013).
Consumers who may potentially, or actually do, purchase and use pro-environmental
products are referred to as “green consumers” (Mostafa, 2006; Shrum, McCarty, & Lowrey,
1995; Yang et al., 2015). Generally, green consumers purchase more pro-environmental products
than non-green consumers (Finisterra do Paco, Barata Raspo, & Filho, 2009; Modi & Patel,
2013) because green consumers are more strongly inclined toward environmental protection than
non-green consumers (Straughan & Roberts, 1999; Thompson, Anderson, Hansen, & Kahle,
2010; Wulandari, Suharjo, Soehadi, & Purnomo, 2012). In response to green consumers’
preference for pro-environmental products, companies that produce pro-environmental products
target green consumers when promoting their products (Burnett, 2014; Wigder, 2008; Zinkhan &

2
Carlson, 1995). In addition, their marketing and advertising efforts focus on highlighting the pro-
environmental attributes of their products to motivate green consumers to purchase their products
(Brickart & Ruth, 2012; Rahbar & Wahid, 2011).
Several academic researchers and professionals have focused their attention on how
green consumers evaluate pro-environmental advertising and whether such pro-environmental
advertising influences green consumers’ purchasing behaviors. Notably, previous scholarly work
has revealed the effects of pro-environmental advertising targeting green consumers (Hartmann,
Apaolaza, & Eisend, 2016; Hassan & Valenzuela, 2016; Yang et al., 2015) and determined
which advertising messages and creative strategies influence green consumers’ evaluations of
advertising and pro-environmental products and their subsequent purchasing behaviors (Chang,
Zhang, & Xie, 2015; Tucker, Rifon, Lee, & Reece, 2012). In terms of green consumers’
evaluations of pro-environmental advertising, however, these prior studies showed inconsistent
results, with different findings revealing both positive and negative attitudes toward pro-
environmental advertising (Finisterra do Paco & Reis, 2012; Kim, Oh, Yoon, & Shin, 2016;
Johnstone & Tan, 2015; Zinkhan & Carlson, 1995).
In some studies, green consumers were found to have positive attitudes toward pro-
environmental advertising (Kim et al., 2016; Reich & Armstrong Soule, 2016), which led the
researchers to assert that green consumers are motivated regarding environmental issues and
willing to engage in environmental protection (Straughan & Roberts, 1999; Mostafa, 2009; Park
& Lee, 2014). Accordingly, they determined that green consumers tend to evaluate corporate
pro-environmental products and their advertising positively (Kim et al., 2016; Phau & Ong,
2007; Reich & Armstrong Soule, 2016).

3
However, other researchers have provided conflicting results (Johnstone & Tan, 2015;
Zinkhan & Carlson, 1995). They argued that green consumers have more knowledge and
experience with pro-environmental products and advertising (Barbarossa & Pastore, 2015;
Wulandari et al., 2012; Young, Hwang, McDonald, & Oates, 2010). These consumers therefore
realize that not all companies are sincere about environmental protection and instead use pro-
environmental advertising to establish pro-environmental reputations (Friested, & Wright, 1994;
Vires, Terwel, Ellemers, & Daamen, 2015). The researchers concluded that green consumers
therefore tend to be more skeptical of corporate pro-environmental advertising and evaluate pro-
environmental advertising negatively (Finisterra do Paco, Raposo, & Filho, 2009; Johnstone &
Tan, 2015; Zinkhan & Carlson, 1995).
Skepticism in this context is the tendency of consumers to disbelieve advertising
information and distrust the advertiser’s intentions (Mohr, Erogli, & Ellem, 1998; Obermiller &
Spangenberg, 1998). In the context of pro-environmental advertising, green consumers’
skepticism is regarded as an important factor that influences whether green consumers make
positive or negative assessments of such advertising. As shown, there is vigorous scholarly
debate regarding green consumers’ skepticism (Matthes & Wonneberger, 2014), with one group
of researchers insisting that green consumers are skeptical of pro-environmental advertising
(Shrum, McCarty, & Lowrey, 1995; Zinkhan & Carlson, 1995) and the other arguing that green
consumers are not (Matthes & Wonneberger, 2014). Their contradictory views of green
consumers’ skepticism are used to support the opposing researchers’ assertions regarding how
green consumers evaluate pro-environmental advertising.
To understand green consumers’ evaluations of pro-environmental advertising, it is
important to determine why these researchers have conflicting views of green consumers’

4
skepticism in the first place. They seem to stem from how previous studies have identified green
consumers. These studies have used various factors, such as sociodemographic, psychographic,
attitudinal, and behavioral factors, to describe green consumers (Finisterra do Paco & Barata
Raposo, 2010; Jain & Kaur, 2006; Park & Lee, 2014; Straughan & Roberts, 1999; Thompson,
Anderson, Hansen, & Kahle, 2010). These diverse approaches to identifying green consumers
have led to a lack of consistency in defining green consumers and thus triggered conflicting
understandings of their skepticism and evaluations of pro-environmental advertising.
Early research focused on sociodemographic factors (e.g., gender, age, and education and
income levels) (Diamantopoulos, Schlegelmilch, Sinkovics, & Bohlen, 2003; Jain & Kaur, 2006;
Shrum, McCarty, & Lowrey, 1995; Zinkhan & Carlson, 1995); however, these studies failed to
provide common sociodemographic characteristics of green consumers. To overcome this
weakness, more recent research employed psychographic characteristics (e.g., the locus of
control, perceived self-efficacy, and altruism), attitudes (e.g., environmental concerns), and
behaviors (e.g., light vs. heavy users) (Finisterra do Paco & Barata Raposo, 2010; Gleim, Smith,
Andrews, & Cronin, 2013; Jain & Kaur, 2006; Wulandari et al., 2012).
Given these varying approaches, green consumers have been characterized differently.
For example, green consumers have been described as female (Hunter, Hatch, & Johnson, 2004;
Xiao & Hong, 2010; Zelezny, Chua, & Aldrich, 2000), highly educated (Finisterra do Paco,
Barata Raposo, & Filho, 2009; Straughan & Roberts, 1999), concerned about the environment
(Barber, 2014; Mostafa 2009), or demonstrating pro-environmental behaviors (e.g., recycling)
(Chan, 2001; Mostafa, 2006; Wulandari et al., 2012). In other words, green consumers were
found to display a wide spectrum of sociodemographic, psychographic, attitudinal, and
behavioral characteristics. These variations in the assessment of green consumers’ characteristics
5
could have led to the inconsistent findings regarding their skepticism and evaluations of pro-
environmental advertising.
To understand green consumers’ evaluations of pro-environmental advertising, it is
essential to address the limitations of the previous research, specifically those relating to the
identification of green consumers, green consumers’ characteristics, and their evaluations of pro-
environmental advertising. Based on the above discussion, the purpose of this study and its
contribution to the literature are addressed below.
PURPOSE OF THE STUDY
The conflicting scholarly views on green consumers’ evaluations of pro-environmental
advertising pose a dilemma for advertisers who are unsure whether green consumers are an
appropriate target audience for pro-environmental advertising (Matthes & Wonneberger, 2014).
The opposing perspectives among researchers have resulted from a lack of understanding about
how to identify green consumers and consequently how to assess the skepticism and evaluations
of pro-environmental advertising among the different types of green consumers. To address the
limitations of the previous work, it would be useful to first determine the most appropriate
factors (e.g., sociodemographics, psychographics, attitudes, and behaviors) that should be used to
identify green consumers. By evaluating the benefits and drawbacks of using the various factors,
the most appropriate factor may be established.
Previous studies have also focused on the differences between green and non-green
consumers to arrive at broad definitions of the green consumer. The assumption inherent to this
approach is that all green consumers have similar opinions, attitudes, and behaviors regarding the
protection of the environment and pro-environmental advertising. However, green consumers

6
can be divided into sub-segments based on their involvement in green activities, motivations for
purchasing pro-environmental products, and/or pro-environmental product buying patterns (e.g.,
heavy vs. light users) (Park & Lee, 2014; Mostafa, 2009; Wulandari et al., 2012). For example,
some studies about consumer segmentation have suggested that there are three types of green
consumers: truly green consumers, ambiguous green consumers, and non-green consumers
(Chan, 1999; Finisterra do Paco & Barata Raposo, 2010; Thompson et al., 2010; Wulandari et
al., 2012).
Accordingly, truly green consumers are highly involved in the protection of the
environment, and actively purchase and use pro-environmental products (Chan, 1999; Thompson
et al., 2010; Zinkhan & Carlson, 1995). Ambiguous green consumers, on the other hand, are
likely to follow other people’s pro-environmental purchasing behaviors and do not have a strong
desire to invest extra effort and money in the purchase of pro-environmental products (Park &
Lee, 2014; Wulandari et al., 2012). Lastly, non-green consumers are those who do not purchase
pro-environmental products (Modi & Patel, 2013; Mostafa, 2009; Thompson et al., 2010). In
other words, these three groups of green consumers have varying purchasing behaviors and
levels of involvement in environmental protection. Segmenting green consumers can help
demystify the wide spectrum of their attitudes and behaviors, which in turn can influence
interpretations of whether green consumers are skeptical of pro-environmental advertising and
what makes them skeptical.
In this study, green consumers’ motivations for purchasing pro-environmental products
are used to segment green consumers. Although most previous researchers have argued that the
desire of green consumers to protect the environment drives their purchasing behaviors
(Fransson & Garling, 1999; Granzin & Olsen, 1991; Kim & Choi, 2005; Mostafa, 2006), a few

7
studies have suggested other motivations, such as health concerns, social status, social norms,
and cultural orientation (Chan, 2001; Chen & Wei, 2012; Park & Lee, 2016; Tseng & Tasi, 2011;
Liu, Wang, Shishime, & Fujitsuka, 2012). In essence, green consumers’ purchasing behaviors
result from not only their environmental motivations, but also their personal and social
motivations. Based on this, green consumers can be categorized into more homogeneous
subgroups of green consumers. In addition, the differences in sub-segments of green consumer
could explain whether they are skeptical of pro-environmental advertising and why their attitudes
toward pro-environmental advertising are on a continuum between positive and negative
polarities.
This study will therefore refine the way green consumers are identified and explore
different types of green consumers’ skepticism and attitudes toward pro-environmental
advertising. In particular, this study will (a) suggest the most appropriate way to identify green
consumers who are actively engaged in pro-environmental purchasing behaviors, (b) categorize
green consumers into sub-segments based on their pro-environmental purchasing motivations
(e.g., personal, social, and environmental motivations), (c) describe each sub-segment of green
consumers’ characteristics (e.g., sociodemographics, media preferences, and pro-environmental
product knowledge), and (d) investigate the variations in green consumers’ responses to pro-
environmental advertising, with a particular focus on skepticism and attitudes toward pro-
environmental advertising among the consumers in the identified sub-segments.
Based on the results, this study will then address several theoretical and practical
implications. In so doing, the study will, first, improve our understanding of the variety of green
consumers in terms of their sociodemographic, psychographic, attitudinal, and behavioral
characteristics. Specifically, it will reveal the roles differing motivations have on decisions to
8
purchase pro-environmental products, especially how combinations of motivations influence
green consumers purchasing behaviors. In addition, this study will reveal the differences in
skepticism and attitudes among the various sub-segments of green consumers, and explain why
they have such skepticism and attitudes. Finally, based on the results, this study will recommend
appropriate target consumers for pro-environmental products and advertising, and suggest
advertising strategies to appeal to these consumers.

9
CHAPTER 2: LITERATURE REVIEW
GREEN CONSUMERS
Green consumers are broadly defined as those who potentially or actually purchase pro-
environmental products (Baber, 2014; Chan, 1999; Park & Lee, 2014; Shrum, McCarty, &
Lowrey, 1995). Previous studies have used various factors, including sociodemographic,
psychographic, attitudinal, and behavioral factors, to identify these consumers. Early researchers
tried to classify green consumers using sociodemographic factors such as gender, age, race,
education, and income (Diamantopoulos et al., 2003; Jain & Kaur, 2006; Shrum, McCarty, &
Lowrey, 1995; Zinkhan & Carlson, 1995). To a large extent, they asserted that education and
income were significant factors in defining green consumers (Barber, 2014; Chan, 1999; Park &
Lee, 2014; Straughan & Roberts, 1999). Those consumers with college degrees (or higher levels
of education) and/or above-average household incomes were deemed to be knowledgeable and
concerned about environmental issues (Barber, 2014; Chan, 1999). They were consequently
thought to have more positive attitudes about, and purchase intentions in relation to, pro-
environmental products than less educated and/or lower income consumers (Newell & Green,
1997; Roberts, 1995; Zimmer, Stafford, & Stafford, 1994).
Nevertheless, there are some limitations when using sociodemographic factors to identify
green consumers (Straughan & Roberts, 1999; Thompson et al., 2009; Zelezny, Chua, & Aldrich,
2000). First, the early studies did not provide consistent descriptions of green consumers’ gender
and age (Straughan & Roberts, 1999). While some studies revealed middle-aged female
consumers as being potential or actual green consumers (Hunter, Hatch, & Johnson, 2004; Xiao
& Hong, 2010; Zelezny, Chua, & Aldrich, 2000; Zinkhan & Carlson, 1995), a few studies
showed young male adults to have a willingness and/or intention to purchase pro-environmental

10
products (Diamantopoulos et al., 2003). These inconsistent descriptions of green consumers
mean that sociodemographic factors are not sufficient to identify green consumers or to describe
their purchasing behaviors.
The second limitation of using sociodemographic factors is that green consumers are
defined more broadly compared to other approaches (e.g., attitudinal and behavioral factors)
(Figure 1). In other words, within a specific sociodemographic group, consumers can have a
broad spectrum of attitudes and intentions in relation to pro-environmental products. As a result,
other, more relevant factors were considered in later research to explain consumers’ pro-
environmental purchasing behaviors (e.g., psychographic and attitudinal and behavioral factors)
(Barber, 2014; Diaz-Rainey & Ashton, 2011). Compared to sociodemographic factors,
psychographic and attitudinal and behavioral factors can provide more meaningful explanations
of why consumers purchase pro-environmental products.
Subsequent research has therefore focused increasingly on consumers’ psychographic
characteristics and attitudes toward environmental issues (Chan, 2001; Mostafa, 2006; Sharma &
Gadenne, 2014). Various psychographic characteristics (e.g., locus of control, perceived self-
efficacy, and altruism) and attitudinal factors (e.g., environmental concerns and perceived
environmental responsibility) are included in this approach (Cleveland, Kalamas, & Laroche,
2005; Dagher & Itani, 2014). These psychographic and attitudinal factors can be used to explain
why green consumers purchase pro-environmental products. For example, environmental
concerns, which describe consumers’ concerns about environment, create positive attitudes
toward pro-environmental products and also motivate such consumers to purchase these products
(Chekima et al., 2016; Schlegelmilch, Bohlen, & Diamantopoulos, 1996; Mostafa, 2006). In
addition, consumers who believe their pro-environmental behaviors can contribute to

11
environmental protection (e.g., consumers with a high locus of control or perceived self-efficacy)
are more likely to purchase pro-environmental products (Cleveland, Kalamas, & Laroche, 2005;
Liu et al., 2012).
Although psychographic and attitudinal factors are widely used to identify green
consumers, they have a weak relationship with actual pro-environmental product purchasing
behaviors (Gleim et al., 2013; Johnstone & Tan, 2015). In other words, among the green
consumers who are regarded as preferring pro-environmental products and being willing to
purchase them, only some report that they actually purchase pro-environmental products (Bonini
& Oppenheim, 2008). Nevertheless, while others show a willingness to purchase pro-
environmental products, they do not actually follow through and buy pro-environmental products
and can therefore be described as potential green consumers. These consumers hesitate to
purchase pro-environmental products because of their concerns about pro-environmental
products (e.g., the perceived poor quality of pro-environmental products) and advertising (e.g.,
skepticism), and poor product availability (e.g., high prices and few retailers offering pro-
environmental products) (Gabler, Butler, & Adams, 2013; Gleim et al., 2013). Thus, while the
use of psychographic and attitudinal factors is an appropriate way to find potential and actual
green consumers, on its alone, this approach makes it difficult to define who actually buys pro-
environmental products.
Notwithstanding, some studies have used consumers’ actual pro-environmental
purchasing and pro-environmental behaviors (e.g., recycling) to define green consumers (Chan,
1999; Finisterra do Paco & Barata Raposo, 2010; Modi & Patel, 2013; Wulandari et al., 2012).
These studies classified green consumers as those who have used pro-environmental products
(Chan, 1999; Finisterra do Paco, & Barata Raposo, 2010; Thompson et al., 2010) or those who

12
are actually engaged in general pro-environmental behaviors (e.g., energy conservation and
recycling) (Modi & Patel, 2013; Wulandari et al., 2012). According to their findings, such
consumers tend to perceive pro-environmental purchasing as one way to protect the environment
and are accordingly willing to purchase pro-environmental products (Kim & Choi, 2005;
Mostafa, 2006).
In contrast with previous studies that used sociodemographic, psychological, and
attitudinal factors to define green consumers, these studies first located green consumers and
then described their demographic and psychographic characteristics. They also provided
consistent findings in line with previous research; specifically, they found that green consumers
are generally highly educated, have high income levels, and/or are concerned about
environmental protection (Barber, 2014; Chan, 1999; Park & Lee, 2014; Thompson et al., 2010).
Among the behavioral, sociodemographic, psychographic, and attitudinal approaches, the
behavioral approach is considered the most appropriate to identify green consumers because it
overcomes the weaknesses of the others. As shown in Figure 1, by using one of the other
approaches, non-green consumers or potential green consumers may be categorized with actual
green consumers. This can make it difficult to identify a coherent set of characteristics for green
consumers and their attitudes and behaviors toward pro-environmental products and advertising.
The behavioral approach can therefore help to exclude potential green and non-green consumers
and define green consumers as a homogenous group.
To achieve the purpose of this research, it is important to narrow down the definition of
green consumers based on their actual pro-environmental purchasing behaviors. A homogenous
set of green consumer characteristics is necessary to explore the differences in green consumers’
skepticism and attitudes toward pro-environmental advertising based on their motivations. This

13
homogeneity can help exclude the influence of variances in sociodemographic and attitudinal
factors on green consumers’ purchasing behaviors. In addition, this approach can reveal
differences in skepticism and attitudes by sub-segment based on green consumers’ motivations.
Accordingly, this study will follow the behavioral approach, with a specific focus on actual pro-
environmental purchasing behaviors.
Figure 1. Sociodemographic, Attitudinal, Behavioral Approaches of
Identifying Green Consumers.
SEGMENTING GREEN CONSUMERS
Using psychographic, attitudinal and behavioral factors, previous studies have divided
consumers into several subgroups and defined who green consumers are (Chan, 1999; Finisterra
do Paco & Barata Raspo, 2010; Modi & Patel, 2013; Wulandari et al., 2012). Examples of such
factors include consumers’ perceptions of pro-environmental products (e.g., concerns about high
prices and poor quality) (Park & Lee, 2014; Thompson et al., 2010), their attitudes toward the
protection of the environment (e.g., personal environmental responsibility and perceived

14
seriousness of environmental problems) (Finisterra do Paco & Barata Raspo, 2010; Wulandari et
al., 2012), and their pro-environmental behaviors (e.g., green buying, recycling, and energy
conservation) (Chan, 1999; Modi & Patel, 2013).
The results of these studies have consistently shown that consumers can be categorized
into the following groups: truly green consumers, ambiguous consumers, and non-green
consumers (Finisterra do Paco, Barata Raspo, & Filho, 2009; Modi & Patel, 2013; Wulandari et
al., 2012). In terms of differentiation, truly green consumers are conscious of environmental
issues, feel a sense of responsibility toward environmental problems, have positive attitudes
toward pro-environmental activities, and engage in various pro-environmental behaviors (Chan,
1999; Thompson et al., 2010; Zinkhan & Carlson, 1995). From a sociodemographic perspective,
truly green consumers are usually highly educated (e.g., college degree or more) and have high
household incomes (Barber, 2014; Chan, 1999). In addition, these consumers prefer reading
newspapers and magazines rather than watching TV and surfing the Internet (Park & Lee, 2014).
On the other hand, non-green consumers are described as people who are not interested in
environmental issues and thus do not feel the need to protect the environment and tend not to
behave pro-environmentally (Park & Lee, 2014; Wulandari et al., 2012). Their
sociodemographic characteristics and media usage patterns differ from those of green consumers.
Specifically, they are less educated and have lower household incomes (Chan, 1999; Finisterra
do Paco & Barata Raspo, 2010; Straughan & Roberts, 1999). Additionally, television is the most
used media while print media is less used than other media (Park & Lee, 2014).
The group of consumers who have ambiguous attitudes toward pro-environmental
purchasing (Modi & Patel, 2013; Mostafa, 2009; Thompson et al., 2010) generally demonstrate
an understanding of the importance of pro-environmental consumption, and have both
15
environmental concerns and a desire to protect the environment (Modi & Patel, 2013; Barber,
2014). However, they hesitate to purchase pro-environmental products because of perceived
barriers (e.g., concerns about product quality, high prices, lack of availability, and skepticism
toward pro-environmental advertising) (Gleim et al., 2013; Johnstone & Tan, 2015; Park & Lee,
2014).
Based on the above segmentation, previous studies have concluded that green consumers
purchase pro-environmental products because of their environmental motivations, which include
a concern for the environment, a sense of responsibility toward the environment, and a
perception of the seriousness of environmental problems (Dagher & Itani, 2014; Granzin &
Olsen, 1991; Lee, 2008; Mostafa, 2006). In essence, the general understanding is that, compared
to non-green consumers and ambiguous consumers, green consumers share a strong desire to
protect the environment and accordingly purchase pro-environmental products.
Nevertheless, a few studies have revealed different types of motivations, namely,
economic benefits, social status, health-related issues, collectivism, and social norms (Chen &
Wei, 2012; Jansson, Marell, & Nordlund, 2010; Park & Lee, 2016; Tseng & Tasi, 2011), based
on which green consumers tend to choose different products. For example, social status is seen
as an important incentive for consumers to purchase conspicuously pro-environmental products
(e.g., hybrid cars and eco-bags), while their financial standing also makes these consumers
choose energy-efficient products (e.g., energy-efficient light bulbs and energy-saving electronic
products) (Chang, 2011; Park & Lee, 2016; Yang et al., 2015).
The diverse motivations among green consumers are related to their pro-environmental
product consumption patterns (e.g., their choices of pro-environmental product types) and beliefs
in, and attitudes toward, pro-environmental products. Thus, given the diversity of their

16
motivations, a broader spectrum of green consumers should be considered. Green consumers’
various motivations, such as personal, social, and environmental motivations, for purchasing pro-
environmental products are addressed in the next section.
GREEN CONSUMERS’ MOTIVATIONS
Personal Motivation
In the context of green consumerism, personal motivation refers to the desire of
consumers to meet their individual needs and/or to maximize their satisfaction by using pro-
environmental products. Previous research identified three types of personal motivations for
purchasing pro-environmental products, namely economic benefits, social status, and health
concerns (Bonini & Oppenheim, 2008; Chen & Wei, 2012; Griskevicius, Tybur, & Van den
Bergh, 2010; Park & Lee, 2016; Peattie, 2001). These studies showed that some consumers
purchase pro-environmental products to derive maximum economic benefit, build a socially
desirable image, and improve their health (Chen & Wei, 2012; Jansson, Marell, & Nordlund,
2010; Park & Lee, 2016; Tseng & Tasi, 2011).
Economic motivation. Economic motivation indicates the desire of consumers to derive
the maximum economic benefit from their purchases by, for example, saving money when using
a product. In their decision-making process, consumers consider the price and quality of a range
of products and tend to choose the ones that are most appropriate to their requirements (Osterhus,
1997). For instance, they might choose a high-quality product if the product prices are similar or
a low-price product if the product quality is similar. Some green consumers choose pro-
environmental products (e.g., energy-efficient light bulbs and water-saving showerheads) to save
money based on the assumption that pro-environmental products provide similar levels of quality

17
as non-pro-environmental products (Bonini & Oppenheim, 2008; Peattie, 2001). In other words,
these consumers only choose pro-environmental products over regular products when they can
obtain a greater benefit from using such products in the short term as well as over the long term
(Jansson et al., 2010; Tseng & Tasi, 2011).
Social status. The desire for a higher social status or to project a particular image can
motivate consumers to purchase pro-environmental products. Some consumers believe that using
pro-environment products will help them develop a socially desirable image in society, leading
to the subsequent purchase of such goods (Bertrandias & Elaggied-Gambier, 2014; Dagher &
Itani, 2014; Park & Lee, 2016; Yang et al., 2015). The reasons they purchase pro-environmental
products are clearly to show their pro-environmental products to others and have a pro-
environmental image.
Given their desire for social status, these green consumers prefer purchasing pro-
environmental products in public settings (e.g., with other people) rather than privately (e.g.,
alone or online) (Griskevicius, Tybur, & Van den Bergh, 2010). In addition, they tend to avoid
putting money and effort into environmentally protective activities that other peoples do not
easily notice (e.g., recycling and donations to non-profit organizations). Similarly, they prefer
conspicuous pro-environmental products (e.g., hybrid cars and eco-bags) rather than
inconspicuous products such as household electronic appliances and recycled toilet paper (Park
& Lee, 2016).
Health concerns. Health concerns were recently identified as one of the primary reasons
consumers buy pro-environmental products (Liu, McCarthy, & Chen, 2016; Nasir & Karakaya,
2014; Teng & Lu, 2016). Such consumers worry about the negative health impacts associated
with the use of certain products (Bonini & Oppenheim, 2008; Chen & Wei, 2012; Liu,
18
McCarthy, & Chen, 2016), leading them to purchase both health- and environment-oriented
products, for example, natural cosmetics, non-toxic laundry detergents, organic foods, and
organic cotton clothing (Bonini & Oppenheim, 2008; Chen & Wei, 2012; Liu, McCarthy, &
Chen, 2016). By using those products, health-conscious consumers hope to obtain health benefits
and avoid the potential health risks associated with the use of regular products (Michaelidou &
Hassan, 2008; Nasir & Karakaya, 2014). These green consumers therefore feel more secure
about their product purchases and perceive such products to be helping them maintain their
existing health status.
Social Motivation
Social motivations include social norms and cultural orientation. In terms of social
norms, consumers have a tendency to adopt socially acceptable behaviors so that they can appear
to be good citizens or members of society (Ajzen, 1991). Social pressure motivates these people
to follow the dominant norms of their social groups (e.g., respond to peer group pressure) and
society as a whole (Ajzen, 1991). For example, when a person is a member of a group that
behaves pro-environmentally, he/she will be motivated to behave like the other group members
(Bertrandias & Elaggied-Gambier, 2014; Liu et al., 2012). In the same way, cultural orientation
(e.g., collectivism and a man–nature orientation) can motivate consumers to make pro-
environmental purchasing decisions (Chan, 2001). Specifically, people’s perceptions of their
relationships with other people, society, and nature make them engage more in environmentally
protective behaviors (Chan, 2001; Schuitema & De Groot, 2015; Sharma & Gadenne, 2014).
Social norms. Social norms dictate which behaviors are deemed appropriate in society
and motivate members of society to engage in these behaviors (Ajzen, 1991; Liu et al., 2012;

19
Osterhus, 1997). For example, when the majority of members of society or powerful members in
a group support specific behaviors, other members may feel pressure to follow the behaviors as
they perceive them to be the social norm. By following the social norm, they feel like they are
members of the society (Venkatesh & Davis, 2000).
Pro-environmental behaviors (e.g., recycling and carpooling) can be considered social
norms (Macovei, 2015; Liu et al., 2012; Sharma & Gadenne, 2014). Members of society
perceive environmental protection as important and pro-environmental behaviors as
requirements to be a good citizen. For examples, the pro-environmental social norms can be
established by their peer groups’ or parents’ pro-environmental activities (Lee, 2008). The pro-
environmental social norms therefore make them engage in pro-environmental behaviors (Kim,
Yun, Lee, & Ko, 2016; Liu et al., 2012; Sharma & Gadenne, 2014). In particular, Lee (2008)
showed that adolescents with friends who follow pro-environmental lifestyles are more likely to
purchase pro-environmental products.
Cultural values. Cultural values (e.g., a man–nature orientation and collectivism) can
motivate people to engage in pro-environmental behaviors (Chan, 2001; Mostafa, 2006;
Schuitema & De Groot, 2015). In societies that value collectivism, people support public welfare
initiatives and the happiness of society as a whole (Chan, 2001; Leonidou, Leonidou, &
Kvasova, 2010). In addition, they tend to broadly perceive “we” as including current and future
generations, and even nature. A man–nature orientation as a cultural value similarly makes
people consider the harmonization of man and nature as important (Chan, 2001). In man–nature-
oriented societies, people regard themselves as not masters of nature, but part of nature.
Both collectivism and a man–nature orientation thus trigger consumers’ positive attitudes
toward environmental activities and pro-environmental products (Mostafa, 2006). Studies have

20
shown that their positive attitudes lead to a willingness to behave pro-environmentally and to
purchase pro-environmental products (Chan, 2001; Mostafa, 2006; Schuitema & De Groot,
2015). Although these prior studies investigated the impacts of cultural orientation in eastern
countries (e.g., China), collectivism and a man–nature orientation are common values that can
also be shared in western countries such as the US and can thus influence these consumers’ pro-
environmental product purchasing decisions.
Environmental Motivation
Consumers that want to contribute to the protection of the environment generally
perceive environmental issues as severe, are conscious of environmental pollutants, and feel
obligated to protect the environment (Dagher & Itani, 2014; Mostafa, 2006). They therefore
voluntarily participate in various pro-environmental behaviors (Dagher & Itani, 2014; Mostafa,
2006). According to previous studies, environmental concerns and personal environmental
responsibility strongly motivate consumers to make pro-environmental purchases (Fransson &
Garling, 1999; Granzin & Olsen, 1991; Kim & Choi, 2005; Mostafa, 2006).
Environmental concerns. By definition, environmental concern is “an individual’s
general orientation toward the environment and an individual’s concern level as to environmental
issues” (Kim & Choi, 2005, p. 593). Environmental concern is widely used as a factor to explain
why people engage in pro-environmental behaviors (e.g., recycling, the use of public
transportation, energy saving, and the purchase of pro-environmental products) (Phau & Ong,
2007; Reich & Armstrong Soule, 2016). Several prior studies have shown that environmental
concern strongly motivates individuals to invest their energy in the protection of the environment
(Mostafa, 2006; Newton, Tsarenko, Ferraro, & Sands, 2015; Suki & Suki, 2015). The consumers

21
with high levels of environmental concern therefore tend to actively engage in a variety of pro-
environmental behaviors (Hartmann & Apaolaza-Ibannez, 2012; Mainieri et al., 1997; Newton et
al., 2015).
Personal environmental responsibility. Consumers’ personal environmental
responsibility is considered a personal norm in terms of environmental protection. Regardless of
social norms, consumers whose internal obligations imbue them with a personal sense of
responsibility toward the environment are highly likely to take action to minimize environmental
pollution and enhance environmental conditions (Fransson & Garling, 1999; Granzin & Olsen,
1991). These consumers show a strong willingness to behave pro-environmentally. Indeed, when
they do not behave pro-environmentally, they tend to feel guilty since they believe that they have
negatively affected the environment (Stern et al. 1999). It follows that consumers with a high
sense of personal environmental responsibility tend to purchase pro-environmental products
(Carman & Cheng, 2016; Dagher & Itani, 2014).
SKEPTICISM TOWARD ADVERTISING
Skepticism is defined as consumers’ disbelief in advertising claims and suspicions
regarding advertiser’s ulterior motives (Mohr et al., 1998; Obermiller & Spangenberg, 1998).
Skepticism is widely known as a factor that negatively influences consumers’ responses to
advertising (Chen & Leu, 2011; Obermiller, Spangenberg & MacLachlan, 2005). Specifically,
highly skeptical consumers are less likely to believe communication messages or to trust
advertised brands, and tend to evaluate advertisers negatively (Chen & Leu, 2011; Obermiller,
Spangenberg & MacLachlan, 2005). Accordingly, these consumers tend to have negative

22
attitudes toward the advertised products and not to purchase the products (Skarmeas & Leonidou,
2013).
Previous studies have two perspectives on skepticism: dispositional skepticism and
situational skepticism (Pomering & Johnson, 2009; Skarmeas & Leonidou, 2013). Some studies
regard skepticism as a stable belief that is developed based on personality (e.g., cynicism),
personal experience, education, and socialization (Obermiller & Spangenberg, 1998), while
others have focused on situational skepticism in which consumer skepticism varies depending on
the specific context, such as the source and the characteristics of the message (Forehand & Grier,
2003). Thus, consumers can have different levels of skepticism in relation to a specific
advertisement.
In the advertising discipline, both perspectives of skepticism are considered when
evaluating the effects of skepticism on consumers’ responses to advertising. Advocates of
dispositional skepticism argue that consumers’ skepticism develops based on their direct and
indirect experiences, media exposure, and socialization, and becomes a stable and enduring
personal tendency (Freistad & Write, 1994; Obermiller & Spangenberg, 1998; Pomering &
Johnson, 2009). For example, older children have better knowledge of the characteristics of
advertising (e.g., exaggerated, misleading, and deceptive) and are thus more suspicious of
advertising messages than younger children (Boush, Freistad & Rose, 1994; Taylor & Nelson,
2012). In contrast, other scholars have indicated that skepticism can be affected by various
situational factors, including the perceived fit between pro-environmental activities and brand
characteristics, information quality, and corporate commitment to pro-environmental
performance (Elving, 2013; Pomering & Johnson, 2009; Rekom, Go, & Calter, 2014; Skarmeas
& Leonidou, 2013).

23
Green Consumer’s Skepticism toward Pro-Environmental Advertising
Skepticism is used to explain consumers’ ambiguous attitudes toward pro-environmental
advertising (Albayrak, Caber, Mountinho, & Herstein 2011; Chang, 2011; Chen & Leu, 2011).
Some consumers worry about whether pro-environmental advertising provides credible
information about products’ environmental benefits (Chang, 2011; Mohr et al., 1998). In
addition, they question whether companies merely say they are investing in pro-environmental
activities rather than actually doing so (Imran, Park, & Ki, 2015; Vires et al., 2015). Thus, these
consumers are skeptical about the credibility of the information delivered via pro-environmental
advertising and the advertisers’ actual motives. Consumers’ skepticism leads to negative
attitudes toward pro-environmental advertising and makes them hesitant to purchase pro-
environmental products (Albayrak et al., 2011; Newell, Goldsmith, & Banzhaf, 1998).
In a similar vein, green consumers’ skepticism toward pro-environmental advertising has
been explored in the literature. The literature proposed two opposing viewpoints regarding green
consumers’ skepticism. In the first instance, some scholars have supported the notion that green
consumers are skeptical of pro-environmental advertising (Johnstone & Tan, 2015; Finisterra do
Paco & Reis, 2012; Shrum et al., 1995; Zinkhan & Carlson, 1995). They have argued that green
consumers have solid knowledge of, and experience with, pro-environmental products
(Schlegelmilch, Bohlen, & Diamantopoulos, 1996) and therefore well-equipped to recognize
misleading advertising messages and advertisers’ ulterior motives (e.g., self-serving motives)
(Friested, & Wright, 1994). Green consumers are therefore likely to have suspicion of whether
pro-environmental advertising will mislead them regarding products’ pro-environmental
attributes and induce them to purchase the products (Chang, 2011).

24
On the other hand, other studies revealed that green consumers are less skeptical of green
advertising than the average consumer (Mohr et al., 1998). Green consumers tend to be very
interested in environmental issues and have environmental problems high on their personal
agendas, thus their pro-environmental characteristics influence their purchasing behaviors (Chan,
1999; Park & Lee, 2014; Thompson et al., 2010). Moreover, such attitudes make green
consumers less skeptical about green advertising (D’Souza & Taghian, 2005; Matthes &
Wonneberger, 2014; Mohr et al., 1998). In particular, Matthes and Wonneberger (2014) revealed
that consumers with environmental concern tend to have low skepticism toward pro-
environmental advertising, and their low skepticism leads to positive attitudes toward pro-
environmental products and purchasing behaviors.
The conflicting views of green consumers’ skepticism remains a scholarly debate
(Matthes & Wonneberger, 2014). The conflicting views have explained whether green
consumers have negative or positive attitudes toward pro-environmental advertising,
respectively. In order to understand green consumers’ evaluations of pro-environmental
advertising, the conflicting views of green consumers’ skepticism should be resolved firstly.
Based on the discussion about green consumer identification, motivations, skepticism, and
attitudes, research questions are proposed below.
RESEARCH QUESTIONS
Early research had limitations of identifying green consumers and understanding of their
skepticism and attitudes toward pro-environmental advertising. Conflicting perspectives on green
consumers’ skepticism and attitudes seem to come from the variety of approaches to identify
green consumers; for example, sociodemographics and attitudinal and behavioral factors (Chan,

25
2001; Mostafa, 2006; Wulandari et al., 2012). Depending on which approach was used,
consumers with these various sociodemographics, attitudes, and behaviors were described as
green consumers. But the variety of approaches makes it difficult to identify green consumers
coherently and to reveal their skepticism and attitudes toward pro-environmental advertising.
Thus, what is first required is to identify homogeneous green consumers.
In this study, green consumers are regarded as consumers who currently use pro-
environmental products, for example, energy-saving, recycling/recycled, reusable, less toxic or
toxin-free, ozone-free, and biodegradable products. In order to find these green consumers, this
study employ a behavioral approach, specifically focusing on the consumers’ current pro-
environmental usage. Based on this behavioral approach, non-green consumers and potential
green consumers could be excluded, and thus, homogenous green consumers could be identified.
Identified green consumers can also be categorized based on various consumer
motivations (e.g., personal, social, and environmental motivations) for purchasing pro-
environmental products. Segmenting can help understand the variety of green consumers,
specifically, how these consumers can be grouped by their motivations; how different the sub-
segments are in terms of their sociodemographics, knowledge of pro-environmental products,
pro-environmental product usage, and pro-environmental media preferences; and how varied are
their evaluations of pro-environmental advertising, for example, their skepticism and attitudes
toward such advertising. Hence, the following research questions are therefore proposed:
RQ1: How can green consumers be segmented into subgroups based on their personal,
social, and environmental motivations?

26
RQ2: How are characteristics (e.g., sociodemographics, pro-environment product usage,
knowledge of pro-environmental products, and pro-environmental media
preference) different depending on the subgroups of green consumers?
RQ3: How is skepticism toward pro-environmental advertising different depending on
the subgroups of green consumers?
RQ4: How are attitudes toward pro-environmental advertising different depending on the
subgroups of green consumers?

27
CHAPTER 3: METHOD
SURVEY OVERVIEW
Two online surveys were conducted, a pre-test and a main test. The pre-test was used to
refine the scales necessary to measure all the constructs, which included green consumers’
personal, social, and environmental motivations and their environmental knowledge, skepticism,
and attitudes toward pro-environmental advertising. The refined scales were employed for the
main test. The main test was conducted to explore the research questions. For both the pre- and
main tests, survey participants were recruited via Amazon Mechanical Turk.
SURVEY PARTICIPANTS
In relation to the purpose of this study, the study population comprised green consumers
who currently used pro-environmental products in the United States. To access these consumers,
sociodemographic and behavioral factors were applied, for example, education and income level,
as well as their pro-environmental product-using behaviors. Most previous studies have shown
consistent descriptions of green consumers’ education and income levels. In particular, green
consumers who actually purchase pro-environmental products have college degrees or more and
also have high household incomes (Barber, 2014; Chan, 1999; Park & Lee, 2014; Straughan &
Roberts, 1999). Thus, using education and income level can increase the possibility of
identifying actual green consumers. In this study, a two-year college degree or more and an
average household income of $55,000 (the average household income in 2015 in the US) or
higher were employed as the first qualifications for the study sample.
Although using education and income levels helps to find green consumers, those who
meet these two requirements may also include non-green consumers or potential green

28
consumers. In order to exclude non-green and potential green consumers, questions about pro-
environmental product usage were asked, specifically whether respondents currently used pro-
environmental products and which types of pro-environmental products they used. Thus, through
these sociodemographic and behavior factors, green consumers were identified.
For both the pre- and main tests, convenient sampling was employed. A total of 130 and
515 participants were recruited for the pre- and main tests, respectively. Those who could not
meet the requirements or did not give the right answers to attention check questions were
deemed invalid and were eliminated from the final analysis. Thus, the responses of 100
participants for the pre-test and 408 for the main test were analyzed.
Regarding the sociodemographics of survey participants in the main test (Table 1), the
majority of the sample was white/Caucasian (n = 328 or 80.4%). Both males and females were
evenly included in the sample; for males, n = 198 or 48.5%, and for females, n = 210 or 51.5%.
In addition, more than half of the participants had attained a four-year college degree (n = 228 or
55.9%), followed by a two-year college degree (n = 85 or 20.8%) and a master’s degree (n = 68
or 16.7%). In terms of household income, most participants were in the $55,000–$59,999 range
(n = 108, 26.5%), the $60,000–$69,999 range (n = 98, 24.0%), or the $90,000 or more range (n =
116, 28.4%). Lastly, the average age of the participants was 37.75 years (SD = 10.90), with ages
ranging from 19 to 84 years.

29
Table 1.
Sample Description
n %
Gender Male 198 48.5
Female 210 51.1
Age 19-29 107 26.2
30-39 148 36.2
40-49 87 21.3
50-59 46 11.2
60-69 17 4.1
70 and over 3 0.7
Race White/Caucasian 328 80.4
African-American 27 6.6
Asian 34 8.3
Native American 6 1.5
Other 13 3.1
Education 2-year college 85 20.8
4-year college 228 55.9
Master degree 68 16.7
Doctoral degree 11 2.7
Professional degree 16 3.9
Income $55,00-$59,999 108 26.5
$60,000-$69,999 98 24.0
$70,000-$79,999 47 11.5
$80,000-$89,999 39 9.6
$90,000 or more 116 28.4
Total 408 100

30
SURVEY PROCEDURE
Amazon Mechanical Turk
For both the pre-test and the main-test, Amazon Mechanical Turk (hereafter MTurk),
which is a marketplace for work that requires human intelligence (e.g., researching data), was
used to recruit survey participants. Through MTurk, “Requestors” (e.g., researchers) can post
their work, and “Workers” can do the work and obtain monetary compensation. The MTurk
workers consist of more than 500,000 people from various countries (Amazon MTurk, n.d.);
however, the majority of MTurk workers are from the USA and India. The estimated active
number of MTurk workers at any given time is 40,000 (Kim & Pittman, 2016). Due to its
accessibility and the ability to obtain data, MTurk is being used for an increasing amount of
academic research (Kees, Berry, Burton, & Kim, 2017; Mason & Suri, 2012; Shank, 2016).
Specifically, MTurk enables researchers to access various workers based on their
sociodemographics (e.g., gender, age, race, education, and income level) and to collect their data
quickly at a relatively cheap price (Kim & Pittman, 2016; Ipeirotis, 2015; Peer, Vosgerau, &
Acquisti, 2014).
In this study, to recruit qualified survey participants, approval rates and approved
assignments of MTurk workers were used. Generally, MTurk workers’ approval rates and
approved assignments are widely used to access qualified survey participants and to obtain high-
quality data (Peer, Vosgerau, & Acquisti, 2014; Shank, 2016). The approval rate is the
percentage of assignments submitted that have been approved, and approved assignments include
the total number of assignments that have been approved. By using two types of qualifications,
researchers can access MTurk workers who are highly experienced and who provide high-quality
work. Having an approval rate of over 95% and more than 100 approved assignments is strongly

31
recommended for the collection of high-quality data (Kim & Pittman, 2016; Mason & Suri,
2012). Thus, in this study, these qualifications were required for the survey participants. Also,
since the survey aimed at collecting data from US green consumers, the country in which the
MTurk workers lived was restricted to the US only, using MTurk’s qualification functions.
Survey Procedure
The recruitment statement, which included the research information, research purpose,
advantages and disadvantages of participating in the research, requirements for survey
participants, and compensation, was distributed via MTurk. By the use of screening questions,
only qualified survey participants were allowed to participate in the survey, so the requirements
were addressed to prevent unqualified workers from using the recruitment statement to access
the survey. The announcement of the survey on MTurk also provided a link that directed
respondents to the online survey site (Appendix B, Amazon MTurk recruitment site).
The survey procedures were followed as shown in Figure 2. First, after being directed to
the survey site, all participants were informed about the purpose of the research, the survey
procedure, the requirements for survey participants, and compensation. Based on this
information, they were asked to participate in the survey. Their agreement to participate in the
survey was regarded as informed consent. Second, descriptions of pro-environmental products
and advertising were provided to help their understanding, and various examples of pro-
environmental products and advertising were given (Appendix A).
Next, the survey participants were posed screening questions. In particular, these
questions asked whether they had a two-year college degree or more, whether they had an
average household income of US $55,000 or more, and whether they currently used pro-

32
environmental products. Those who could not meet any one (or more) of the three requirements
were screened out and could not participate in the survey. Only survey participants who met all
three requirements could move to the next stage and answer the questions on the following
topics: (a) pro-environmental product usage, (b) pro-environmental media preference, (c)
consumers’ motivations for purchasing pro-environmental products, (d), consumers’ knowledge
of pro-environmental products, (e) consumers’ skepticism toward pro-environmental advertising,
(f) consumers’ attitudes toward pro-environmental advertising, and (g) demographic information
(Appendix A). It took about 10–20 minutes to complete the survey. Participants who
successfully completed the survey were given $0.50 as compensation.
Figure 2. Survey Procedure

33
MEASUREMENT
In this study, several constructs were measured: green consumers’ pro-environmental
product usage, pro-environmental media preferences, demographic characteristics, motivations,
perception knowledge of pro-environmental product knowledge, and skepticism and attitudes
toward pro-environmental advertising (Table 2). Detailed information about how to measure the
constructs is provided below.
Pro-Environmental Product Usage
To measure the consumers’ experiences of pro-environmental products, they were asked
three questions. The first, for screening purposes, queried whether they had ever previously
purchased pro-environmental products. Using a “check all that apply” approach, the second
question sought to determine which categories of pro-environmental products they had
purchased. Specifically, the participants were asked to choose the pro-environmental product
categories from which they had purchased based on a selection of 10 categories: energy-saving,
recyclable/recycling, reusable, biodegradable (or photodegradable), renewable energy, non- (or
less) toxic, organic, compostable, ozone-free, and made with renewable materials. The list of
pro-environmental product categories was developed based on the FTC’s Green Guides (n.d.)
Third, an open-ended question was used to ask the participants to specify all the pro-
environmental products that they currently use, for example, hybrid cars, eco-bags, energy-
efficient bulbs, organic cotton clothing, and non-toxic detergents.

34
Table 2.
Measurements of Main Constructs
Constructs Measurements
Economic
Motivation Most green products are reasonably priced.
Green products offer value for money.
Most green products are good products for the price.
Most green products would be economical.
Green products can save you a lot of money.
The money one can save by using green products does not amount to
much.
I believe that one helps one’s family financially by using green
products.
Social Status Supporting environmental protection makes me more socially
attractive.
Supporting environmental protection makes me special.
I will be perceived by others as “outdated” if I do not support
environmental protection.
Buying green products would help me to feel acceptable.
Buying green products would improve the way that I am perceived.
Buying green products would make a good impression on other
people.
Buying green products would give its owner social approval.
Health benefits By purchasing green products, I help to;
Improve my own or my family’s health.
Avoid risks that may be associated with non-green products.
Give my children better products.
Reduce the risk for illness in my family.
Social norm Most people I know buy green products.
Most people I know are concerned about issues related to the
environment.
Most people I know think it’s important to buy green products.
Most people I know recycle those items that can be recycled.
Most people who are important to me support my effort to use green
products for environmental reasons.
Most people who are important to me think I should use green
products for environmental reasons.
Most people who are important to me take steps to use green products
for environmental reasons.

35
Table 2.
Measurements of Main Constructs (Continued)
Constructs Measurements
Collectivism Making a lasting contribution to groups that I belong to, such as my
work organization, is very important to me.
When I become involved in a group project, I do my best to ensure its
success.
I feel great pride when y team or group does well, even if I’m not the
main reason for its success.
I would be honored if I were chosen by an organization or club that I
belong to, to represent them at conference or meeting.
When I’m part of a team, I am concerned about the group as a whole
instead of whether individual team member like me or whether I like
them.
Man-Nature
Orientation Human beings need to understand the ways of nature and act
accordingly.
We should maintain harmony with nature.
Being the master of the world, human beings are entitled to deploy
any of the natural resources as they like. (R)
Human beings are only part of nature.
We should master instead of adapting to the environment. (R)
Environmental
concern I am worried about the worsening of the quality of environment.
Environment protection is my major concern.
I am emotionally involved in environmental protection issues.
I often think about how the environmental quality can be improved.
I am extremely worried about the state of the world’s environment
and what it will mean for my future.
Mankind is severely abusing the environment.
When humans interfere with nature it often produces disastrous
consequences.
The balance of nature is very delicate and easily upset.
Personal
environmental
responsibility
Everyone should be responsible for protecting the environment.
Environmental protection is the responsibility of environmental
organizations, not me. (R)
Environmental protection should start immediately.
Environmental protection is the responsibility of the government, not
me. (R)
I should take up the responsibility to protect the environment.
Environmental protection starts with me.

36
Table 2.
Measurements of Main Constructs (Continued)
Constructs Measurements
Environmental
Knowledge I know pretty much about green products.
I do not feel very knowledgeable about green products. (R)
Among my circle of friends, I’m one of the experts on green products.
Compare to most other people, I know less about green products. (R)
When it comes to green products, I really don’t know a lot. (R)
I know how to judge the quality of green products.
I think I know enough about green products to feel pretty confident
when I make a purchase.
I have heard of most of the new green products that are around.
Skepticism We can depend on getting the truth in most green advertising. (R)
Green advertising’s aim is to inform the consumer. (R)
I believe green advertising is informative. (R)
Green advertising is generally truthful. (R)
Green advertising is reliable source of information about the quality
and performance of products. (R)
Green advertising is truth well told. (R)
In general, green advertising presents a true picture of the product
being advertised. (R)
I feel I’ve been accurately informed after viewing most green
advertisements. (R)
Most green advertising provides consumers with essential
information. (R)
Most environmental claims made in advertising are true. (R)
Because environmental claims are exaggerated, consumers would be
better off if such claims in advertising were eliminated.
Most environmental claims in advertising are intended to mislead
rather than to inform consumers.
I do not believe most environmental claims made in advertising.
Attitudes Bad – Good
Unpleasant – Pleasant
Irritating – Not irritating
Unfavorable – Favorable
Negative – Positive
Not enjoyable – Enjoyable
Annoying – Not annoying
Not interesting - Interesting

37
Pro-Environmental Media Preferences
Pro-environmental media preferences were measured in terms of two types of media:
magazines and online communities. For magazines, two questions were asked, namely whether
the participants subscribed to any pro-environmental magazines and, if so, what kinds of
magazines (this was a “check all that apply” question). For both questions, periodicals about the
environment, sustainability, and green lifestyles were considered pro-environmental magazines.
For the second question, 14 pro-environmental magazines, including Sierra, Mother Earth
Living, Eat Well, Live Better, National Wildlife, and Nature Conservancy, were given as options.
The magazines were chosen based on their magazine classes, which were categorized as
environment, sustainability, green lifestyle, and nature, and their total circulation (SRDS Media
Solutions, n.d.).
With respect to the online community section, three questions were asked: (1) whether
the participants visit any pro-environmental online communities, (2) what kinds of pro-
environmental online communities they visit (“check all that apply” question), and (3) how often
they visit these communities (seven-point scale). Online communities dealing with
environmental protection, environmental issues, sustainability, and green lifestyles were
regarded as pro-environmental online communities. Based on the total number of their members
and the dates they were launched, nine online communities were selected, including Hugg,
Change.org, MakeMeSustainable, Reddit:Environment, and Greenpeace.org USA (The Best
Green Online Communities, n.d.; WebEcoist, n.d.). Lastly, to measure the frequency of online
community visits, a seven-point scale was used: daily, two to three times a week, once a week,
two to three times a month, once a month, less than once a month, and never.

38
Pro-Environmental Product Knowledge
To assess pro-environmental product knowledge, a nine-item scale developed by Flynn
and Goldsmith (1999) that aims to measure subjective knowledge was used. Measurements were
based on seven-point Likert scale, for example, “I know pretty much about pro-environmental
products” “I think I know enough about pro-environmental products,” “I feel pretty confident
when I make a purchase,” and “I do not feel very knowledgeable about pro-environmental
products” (R).
Consumer Motivation
Three types of consumer motivation were assessed, namely personal, social, and cultural
motivation.
Personal Motivation. Three types of personal motivation were utilized in this study:
economic benefits, social status, and health concerns. To measure economic benefits, seven
items were adapted from Mittal (1994) and Suki and Suki (2015). These included “Most green
products are reasonably priced,” “Green products offer value for money,” and “Green products
can save you a lot of money.” Next, social status was measured via the seven items proposed by
Lee (2008) and Suki and Suki (2015), for example, “Supporting environmental protection makes
me more socially attractive,” “I will be perceived by others as outdated if I do not support
environmental protection” (R), and “Buying green products would make a good impression on
other people.” Lastly, for health concerns, four items from Shepherd, Magnusson, and Sjödén
(2005) were utilized, including “By purchasing green products, I help to improve my own
health,” “By purchasing green products, I help to avoid risks that may be associated with non-

39
green products,” and “By purchasing green products, I help to reduce the risk of illness in my
family.” A seven-point Likert scale was employed for all the measurements.
Social Motivation. Social motivation was assessed by measuring social norms and
cultural orientation (i.e., collectivism vs. man–nature orientation). For social norms, seven items
from Gleim et al. (2013) and Macovei (2015) were used. Examples of the items included “Most
people I know buy green products,” “Most people I know are concerned about issues related to
the environment,” and “Most people who are important to me think I should use green products
for environmental reasons.” In addition, five items were borrowed from Chan (2001) to measure
man–nature orientation, including “Human beings need to understand the ways of nature and act
accordingly” and “Human beings are only part of nature.” For collectivism, six items from Xie,
Bagozzi, and Grønhaug (2015) were used, for example, “When I become involved in a group
project, I do my best to ensure its success,” “I feel great pride when my team does well, even if
I’m not the main reason for its success,” and “When I’m part of a team, I am concerned about the
group as a whole instead of whether individual team member like me.” All the scales were
measured via a seven-point Likert scale.
Environmental Motivation. Environmental concern and personal environmental
responsibility were measured to assess environmental motivation. A total of eight items
developed by Straughan and Robert (1999) and Lee (2008) were used to measure environmental
concern. Examples of these items were “I am worried about the worsening of the quality of
environment,” “Environmental protection is a major concern for me,” and “I am emotionally
involved in environmental protection issues.” Examples of the nine items from Lai and Cheng
(2016) and Gleim et al. (2013) used to measure personal environmental responsibility included
“Everyone should be responsible for protecting the environment,” “Environmental protection is

40
the responsibility of environmental organizations, not me” (R), and “I feel an obligation to buy
green products where possible.” To measure environmental motivation, a seven-point Likert
scale was employed.
Skepticism and Attitudes
The participants’ skepticism about, and attitudes toward, pro-environmental advertising
were measured to explore the differences among the green consumer segments. For skepticism,
Obermiller and Spangenberg (1998) and Mohr et al.’s (1998) scales were used. Three examples
of the scale items were “We can depend on getting the truth in most green advertising” (R),
“Most environmental claims in advertising are intended to mislead rather than inform
consumers,” and “I do not believe most environmental claims made in advertising” (seven-point
Likert scale). In addition, the eight items originally developed by MacKenzie, Lutz, and Belch
(1986) and Kyrousi, Panigyrakis, and Panopoulos (2015) were utilized to assess the participants’
attitudes toward green advertising. Accordingly, a semantic differential scale, which included
“good–bad,” “favorable–unfavorable,” and “not irritating–irritating,” was used.
Demographic Information
At the end of the survey, the participants were asked to supply personal information (e.g.,
age, gender, ethnicity, and education).

41
Attention-Checking Questions
To reduce survey response bias, the scales were randomly shown in some questions and
attention-checking questions, for example, “If you live in the US, please select strongly agree”
were also used.

42
CHAPTER 4: ANALYSIS AND RESULTS
SCALE REFINEMENT
In this study, the process of refining scales had several advantages. Firstly, although well-
developed scales for all constructs were used for the main survey, some of the scales were
adapted to suit the context of pro-environmental advertising and the US market, for instance, to
address health and environmental concerns. Such adaptation is needed to test the scales’
reliability and construct validity. Based on the results, inappropriate scales can be revealed and
removed. Next, different types of consumer motivations for purchasing pro-environmental
products, such as economic, social, and health-related motivations, were measured in the study.
It is important to examine the construct validity (e.g., convergent and discriminant validities)
among the different types of consumer motivations. Lastly, there are a variety of different scales
to measure specific concepts, for example, scales developed by Obermillers and Spangenberg
(1998) and Mohr et al. (1998) were used to measure consumers’ skepticism toward pro-
environmental advertising. In this study, two different scales developed by different researchers
were employed to measure some constructs, for examples, skepticism and attitudes. Thus, the
pre-test helped decide whether combined scales were appropriate to measure the concepts.
Procedure of Refining Scales
The scales used to measure the main constructs (e.g., motivations, knowledge,
skepticism, and attitudes) were refined and tested to confirm their reliability and validity,
specifically, scale refinement, construct validity, and scale reliability (Cronbach’s α). For the
scale refinement, first, a pre-test was used to exclude inappropriate items with which to measure
the constructs. Next, through a main test, the initially refined scales were retested to find

43
inappropriate items, and then the inappropriate items were excluded. Lastly, the reliabilities of
the final refined scales were confirmed by using values of Cronbach’s α. In addition, with the
final scales, confirmatory factor analysis was conducted to confirm the construct validity.
Scale refinement. For the scale refinement, a measurement model, which showed the
relationship between the observed variables (e.g., items) and the latent variables (e.g.,
constructs), was tested. The first measurement model based on the pre-test showed that all items
were significantly related to the constructs that the items were expected to load. However, a few
items’ regression coefficient values were relatively low, specifically, under .50. Low regression
coefficient values mean that the items are not strongly related to the constructs and that they
explain only a small portion of the whole variance of the constructs. Thus, four items with low
regression coefficient values were excluded: The money one can save by using green products
does not amount to much (economic motivation); Environmental protection is the responsibility
of the government, not me (personal environmental responsibility); Environmental protection is
the responsibility of the environmental organization, not me (personal environmental
responsibility); and Because environmental claims are exaggerated, consumers would be better
off if such claims in advertising were eliminated (skepticism).
Except for these four items, the main test was conducted, and the second measurement
model was tested. The results also showed that all items had a significant regression coefficient,
but a few items’ regression coefficient values were under .50. Thus, for the final analysis, four
further inappropriate items were excluded: Most environmental claims in advertising are
intended to mislead rather than to inform consumers (skepticism); Being the masters of the
world, human beings are entitled to deploy any of the natural resources they like (man–nature
44
orientation); We should master instead of adapting to the environment (man–nature orientation);
and I have heard of most of the new green products that are around (environmental knowledge).
With the refined scales, the scale reliabilities of the constructs were calculated. All
constructs’ Cronbach’s α values were between .771 and .967 (Table 3). Thus, the constructs had
satisfactory scale reliabilities.
Confirmatory factor analysis. With the final data of the main test, confirmatory factor
analysis was conducted to confirm construct validity, for example, convergent and discriminant
validity. Confirmatory factor analysis helps confirm both convergent validity, where the
constructs are loaded by expected scales and the expected scales are interrelated to each other,
and discriminant validity, where the constructs are not loaded by items from different constructs,
and items of the different constructs are also not related to each other. To check the convergent
and discriminant validity, model fits were compared between the measurement model and the
one-factor model, in which all items used in this study (total 141 items) loaded one construct.
The measurement model showed a satisfactory fit: χ2 = 5096.976, df = 2835, p <.001; CFI=.913,
RMSEA=.044. In contrast, the one-factor model showed a poor model fit: χ2 = 16003.023, df =
2926, p <.001; CFI=.495, RMSEA=.105. The fit of the measurement model was better than that
of the one-factor model and thus, the constructs had convergent and discriminant validity.

45
Table 3.
Means and Standard Deviations, Cronbach’s α values, and Correlations.
Mean SD α 1 2 3 4 5 6 7 8 9 10
1 EM 4.21 1.16 .88
2 SS 4.13 1.30 .92 .44**
3 HC 5.12 1.23 .92 .44** .32**
4 SN 4.56 1.22 .92 .42** .40** .51**
5 MNO 5.67 1.11 .77 .19** .13** .52** .34**
6 CO 5.22 1.05 .87 .25** .23** .57** .45** .58**
7 PER 5.39 1.13 .92 .39** .28** .73** .56** .68** .69**
8 EC 5.15 1.27 .94 .40** .31** .67** .49** .68** .54** .79**
9 PEPK 4.61 1.07 .85 .33** .23** .49** .33** .36** .38** .51** .45**
10 SKEP 3.42 1.18 .96 -.55** -.43** -.51** -.44** -.30** -.36** -.51** -.48** -.39**
11 ATT 5.23 1.23 .94 .48** .32** .55** .41** .39** .40** .60** 54** .38** -.75**
Note. ** p < .01, EM is economic motivation, SS is social status, HC is health concern, SN is social norm, MNO is man-nature
orientation, CO is collectivism, PER is perceived environmental responsibility, EC is environmental concern, PEPK is perceived
environmental product knowledge, SKEP is skepticism toward pro-environmental advertising, and ATT is attitude toward pro-
environmental advertising.

46
CLUSTERING ANALYSIS
Analysis Overview
Clustering analysis is a statistical method of classifying respondents into groups that have
high within-group homogeneity and between-group heterogeneity based on segmentation criteria
(e.g., respondents’ attitudes and behaviors) (Hair, Anderson, Tatham, & Black, 2010). In this
study, two types of cluster analysis (e.g., hierarchical cluster analysis and K-means cluster
analysis) were conducted to segment the green consumers. The two-step approach of cluster
analysis is a widely recommended analysis method by which to group consumers (Mooi &
Sarstedt, 2011; Park & Lee, 2014; Punj & Stewart, 1983; Singh, 1990).
Hierarchical cluster analysis can provide several options for how many clusters can be
created (Mooi & Sarstedt, 2011). Based on the results, researchers can have several options for
segmenting respondents. Thus, hierarchical cluster analysis is widely used for initial cluster
analysis (Park & Lee, 2014). After the initial analysis, researchers use K-means cluster analysis
to choose the optimal number of clusters among several options suggested by the hierarchical
cluster analysis. Considering the results of hierarchical cluster analysis and K-means cluster
analysis, researchers can determine the final number of clusters (Mooi & Sarstedt, 2011; Park &
Lee, 2014).
To determine the optimal number of clusters, four criteria should be considered: (a)
maximizing within-group homogeneity and between-group heterogeneity; (b) the portion of
respondents in each cluster; specifically, each cluster should have a significant number of
respondents, considering the total sample size; (c) membership stability, how many respondents
are included in the same cluster created by hierarchical and K-means cluster analysis; and (d) the

47
theoretical and practical implications of the segmentations (Hiu, Siu, Wang, & Chang, 2001;
Lamda & Reineke, 2009; Park & Lee, 2014; Silk, Weiner, & Parrott, 2005).
Hierarchical Cluster Analysis
Hierarchical clustering procedures can be explained as a tree-like structure. The
hierarchical cluster analysis is based on agglomerative clustering, in which clusters are
consecutively created based on similarities between respondents (Mooi & Sarstedt, 2011). All
respondents were initially included in their own clusters. For example, the total of 408
respondents initially created 408 clusters. After this first clustering, two respondents who have
the smallest distance in terms of clustering criteria are chosen and merged into one cluster, and
then other respondents are merged with the cluster based on similarities (Mooi & Sarstedt, 2011).
The repetitive procedures finish by creating only one cluster, which includes all respondents.
Hierarchical clustering analysis basically follows a bottom-up approach, and the results also
show the (dis)similarity of the created clusters at every step. Thus, based on the results,
researchers can determine how many clusters are needed to appropriately group respondents.
For the initial hierarchical cluster analysis, Ward’s method with the squared Euclidean
distance equation was used. Ward’s method, which is one of the popular approaches to forming
clusters, is effective in creating clusters with minimum within-group variance (Norusis, 2010;
Park & Lee, 2014). The other advantage of using Ward’s method is that researchers can create
clusters of similar sizes (Norusis, 2010). In addition, the squared Euclidean distance is also
widely used when clustering criteria include ratio or interval scales (Mooi & Sarstedt, 2011; Park
& Lee, 2014).

48
The responses of the 408 participants with respect to eight clustering criteria (e.g.,
motivations for purchasing pro-environmental products) were used to explore the appropriate
number of clusters. The hierarchical clustering analysis results showed the agglomeration
schedule coefficient, which is the calculated distances among respondents included in the same
cluster, and a dendrogram, which describes how respondents are grouped. Both the
agglomeration schedule coefficient values and the dendrogram provide information about within-
group homogeneity and between-group heterogeneity, and thus, the information helps determine
the number of clusters. Based on the results, three- to six-cluster options were considered to have
high within-group homogeneity and between-group heterogeneity (Table 4).

49
Table 4.
Means and Standard Deviations of the Three to Five Segments
N EM SS HC SN MNO CO PER EC
M SD M SD M SD M SD M SD M SD M SD M SD
Option
1
1 148 4.94 1.09 4.77 1.28 6.07 .64 5.45 .97 6.42 .70 5.91 .70 6.34 .50 6.20 .69
2 70 3.47 1.04 3.18 1.01 3.41 1.23 3.33 1.06 4.24 .94 3.91 1.10 3.63 .98 3.33 1.03
3 190 3.92 0.92 3.99 1.15 5.01 .77 4.32 .91 5.62 .85 5.17 .75 5.31 .62 5.01 .79
Total 408 4.21 1.15 4.13 1.30 5.12 1.23 4.56 1.22 5.68 1.10 5.22 1.05 5.39 1.13 5.15 1.27
Option
2
1 121 5.12 .97 5.19 .83 6.05 .66 5.51 .95 6.43 .63 5.87 .70 6.32 .49 6.19 .70
2 61 3.40 1.07 3.06 1.01 3.23 1.24 3.17 1.00 4.21 .99 3.84 1.13 3.56 1.01 3.27 1.07
3 151 4.08 .89 4.45 .77 4.86 .79 4.42 1.06 5.31 .82 5.01 .68 5.07 .63 4.77 .74
4 75 3.70 1.03 2.69 1.02 5.63 .74 4.45 1.06 6.39 .64 5.73 .86 6.03 .57 5.80 .81
Total 408 4.21 1.15 4.13 1.30 5.12 1.23 4.56 1.22 5.68 1.10 5.22 1.05 5.39 1.13 5.15 1.27
Option
3
1 96 5.28 .97 5.27 .85 6.21 .56 5.63 .97 6.53 .56 6.01 .61 6.41 .47 6.32 .62
2 90 3.79 .88 3.70 .99 4.29 .84 3.95 .87 4.65 .90 4.39 .84 4.38 .64 4.06 .69
3 131 4.28 .84 4.65 .74 5.16 .73 4.63 .88 5.61 .84 5.24 .62 5.47 .56 5.20 .66
4 24 2.72 .96 2.72 .92 2.18 .90 2.49 .93 4.23 1.00 3.56 1.42 2.80 1.01 2.34 .96
5 67 3.67 1.04 2.61 .99 5.66 .75 4.45 1.11 6.47 .57 5.76 .87 6.08 .57 5.85 .78
Total 408 4.21 1.15 4.13 1.30 5.12 1.23 4.56 1.22 5.68 1.10 5.22 1.05 5.39 1.13 5.15 1.27
Note. EM is economic motivation, SS is social status, HC is health concern, SN is social norm, MNO is man-nature orientation, CO is
collectivism, PER is perceived environmental responsibility, and EC is environmental concern.

50
K-means Cluster Analysis
K-means cluster analysis can only be used when the number of clusters is predetermined
(Mooi & Sarstedt, 2011). With the predetermined number, K-means cluster analysis creates
clusters with minimum within-group variance. First, respondents are randomly assigned to each
cluster, and after the within-group variance is calculated, respondents are reassigned to minimize
the within-group variance (Mooi & Sarstedt, 2011). Through this repetitive procedure (i.e.,
iteration), all respondents are assigned to appropriate clusters.
In terms of the three- to six-cluster options, four K-means cluster analyses were
conducted. For each K-means cluster analysis, the means of the eight clustering criteria of the
four clustering options from hierarchical cluster analysis were used as initial centers of clusters
(Table 4). In addition, to define the final clusters, the number of iterations was fixed as ten.
Specifically, within ten trials, all respondents were (re-)assigned to each cluster, and with the
repetitive procedure, the initial centers of clusters were changed. The results showed final
clusters with minimum variance within each cluster. In addition, for all clustering options, there
were significant differences of means of the eight clustering criteria, depending on the clusters
(Table 5). Thus, the three- to six-cluster options were considered to have between-group
heterogeneity.
The results of the hierarchical and K-means cluster analyses were cross-checked to
examine the membership stabilities of the three- to six-cluster options. The three-cluster option
showed the highest membership stability; 321 of the respondents (n = 79.6%) were assigned to
the same cluster, followed by the four-cluster (n = 290, 71.3%), six-cluster (n = 280, 68.8%), and
five-cluster options (n = 247, 60.7%) (Appendix D). Among the four options, the five-cluster
option was excluded first, because of low membership stability. The three-cluster option was

51
considered the most appropriate; however, the three clusters were simply divided into high,
medium, and low groups using scores from the eight clustering criteria. Based on three clusters,
it was difficult to reveal the variation of green consumers’ attitudes and behaviors depending on
their motivations. Thus, these three groups were expected to have less significant theoretical and
practical implications than the other two options.
Lastly, in carefully comparing the four- and six-cluster options, the six-cluster option
showed more variety in the motivations and included unique green consumer groups. Thus, the
six-cluster option was considered to have more significant theoretical and practical implications
than the four-cluster option. Hence, to explore the research questions, six segments of green
consumers were used, and specific results are described as follows.

52
Table 5.
One-way ANOVA Results with Eight Cluster Criteria of Three to Six Cluster Options.
Cluster Error F
MS df MS df
Three
Cluster
Option
EM 66.654 2 1.01 405 65.778***
SS 63.342 2 1.39 405 45.534***
HC 170.258 2 .691 405 246.481***
SN 117.339 2 .923 405 127.069***
MNO 113.304 2 .669 405 169.386***
CO 95.138 2 .645 405 147.467***
PER 175.934 2 .435 405 404.121***
EC 196.897 2 .662 405 302.217***
Four
Cluster
Option
EM 54.061 3 .944 4 57.247***
SS 125.840 3 .774 404 162.660***
HC 113.764 3 .691 404 164.746***
SN 77.650 3 .930 404 83.496***
MNO 85.749 3 .595 404 144.182***
CO 64.311 3 .640 404 100.459***
PER 118.046 3 .431 404 274.014***
EC 132.980 3 .640 404 207.660***
Six Cluster
Option
EM 46.817 5 .770 402 60.787***
SS 76.136 5 .770 402 98.925***
HC 79.585 5 .553 402 143.890***
SN 58.007 5 .793 402 73.185***
MNO 54.378 5 .561 402 96.887***
CO 44.272 5 .573 402 77.312***
PER 79.948 5 .320 402 250.216***
EC 90.562 5 .510 402 117.727***
Note. *** p < .001, EM is economic motivation, SS is social status, HC is health concern, SN is
social norm, MNO is man-nature orientation, CO is collectivism, PER is perceived
environmental responsibility, and EC is environmental concern.

53
TESTING RESEARCH QUESTIONS
RQ1. Segmenting Green Consumers
The first research question was to explore how green consumers can be segmented based
on their motivations for purchasing pro-environmental products. By using hierarchical and K-
means clustering analyses, six segments were proposed: Segment 1 (With Nature), Segment 2
(Follower), Segment 3 (My Green Life), Segment 4 (Conspicuous Green Life), Segment 5 (All-
Rounder), and Segment 6 (Challenger) (see Table 6).
Segment 1: With Nature. As shown in Table 6, the first segment of green consumers has
only relatively high man–nature orientation and collectivism. However, other motivations, such
as personal and environmental motivations are under the mid-point. Based on the results, this
green consumer group focuses more on the relationship between human beings and nature. Their
perception of “we” also includes current and future generations and even nature itself. Thus, only
the consideration for nature and community motivates them to purchase pro-environmental
products. Hence, this segment was named “With Nature.”
Segment 2: Follower. This group of people shows modest levels of personal, social, and
environmental motivations. Compared to other segments, there are no specific motivations that
strongly drive them to purchase pro-environmental products. Yet even without strong
motivations, members in Segment 2 buy and use such products. One possible explanation of their
behaviors is that these green consumers follow green consumerism as a social trend. In other
words, as environmental issues become prominent in society and society members (e.g., media)
highlight environmental protection, this group may perceive this and buy and use pro-
environmental products. Thus, this segment was named “Follower.”
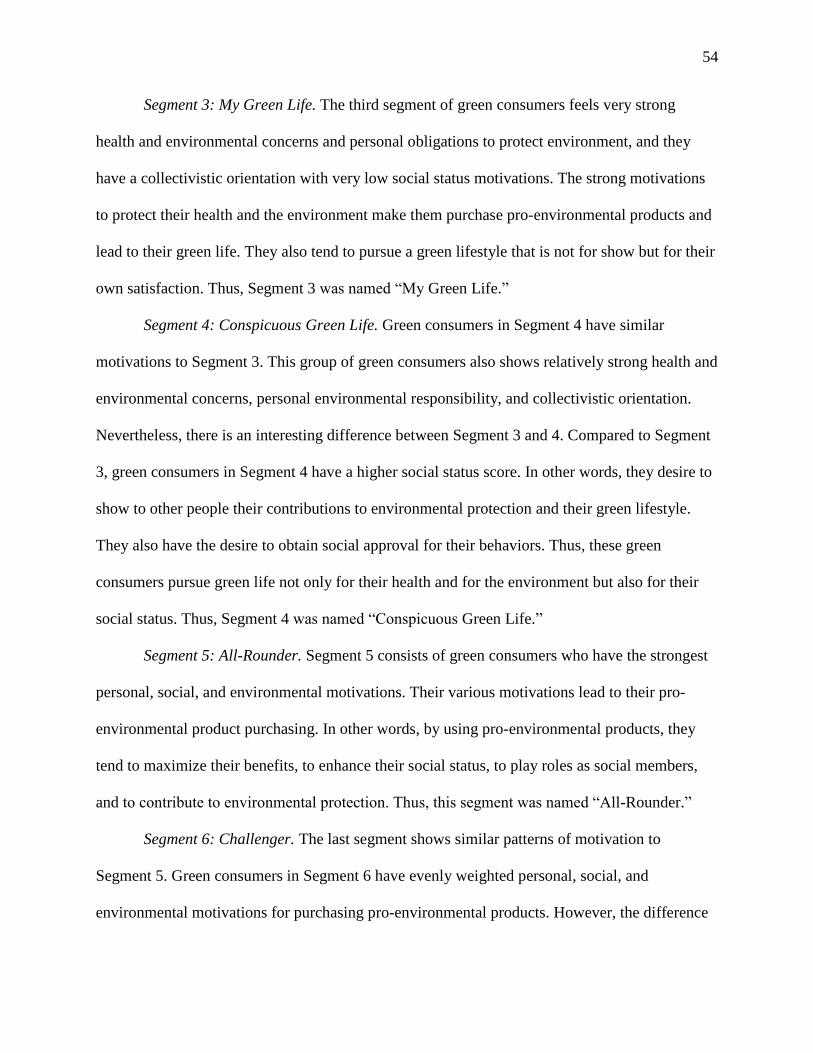
54
Segment 3: My Green Life. The third segment of green consumers feels very strong
health and environmental concerns and personal obligations to protect environment, and they
have a collectivistic orientation with very low social status motivations. The strong motivations
to protect their health and the environment make them purchase pro-environmental products and
lead to their green life. They also tend to pursue a green lifestyle that is not for show but for their
own satisfaction. Thus, Segment 3 was named “My Green Life.”
Segment 4: Conspicuous Green Life. Green consumers in Segment 4 have similar
motivations to Segment 3. This group of green consumers also shows relatively strong health and
environmental concerns, personal environmental responsibility, and collectivistic orientation.
Nevertheless, there is an interesting difference between Segment 3 and 4. Compared to Segment
3, green consumers in Segment 4 have a higher social status score. In other words, they desire to
show to other people their contributions to environmental protection and their green lifestyle.
They also have the desire to obtain social approval for their behaviors. Thus, these green
consumers pursue green life not only for their health and for the environment but also for their
social status. Thus, Segment 4 was named “Conspicuous Green Life.”
Segment 5: All-Rounder. Segment 5 consists of green consumers who have the strongest
personal, social, and environmental motivations. Their various motivations lead to their pro-
environmental product purchasing. In other words, by using pro-environmental products, they
tend to maximize their benefits, to enhance their social status, to play roles as social members,
and to contribute to environmental protection. Thus, this segment was named “All-Rounder.”
Segment 6: Challenger. The last segment shows similar patterns of motivation to
Segment 5. Green consumers in Segment 6 have evenly weighted personal, social, and
environmental motivations for purchasing pro-environmental products. However, the difference

55
between Segment 5 and 6 is the level of motivation. Green consumers in Segment 6 have lower
personal, social, and environmental motivations than Segment 5. Although members of this
green consumer group follow various motivations, their desires do not meet the levels of
Segment 5, and thus, this segment was named “Challenger.”

56
Table 6.
Means and Standard Deviations of the Six Segments
N EM SS HC SN MNO CO PER EC
M SD M SD M SD M SD M SD M SD M SD M SD
1 23 2.68 .95 2.69 .93 2.13 .89 2.46 .94 4.25 1.03 3.55 1.46 2.79 1.03 2.29 .96
2 67 4.10 .67 3.79 .88 4.27 .80 4.05 .78 4.40 .83 4.18 .78 4.14 .58 4.00 .66
3 63 3.99 .99 2.69 1.03 5.81 .67 4.71 .98 6.48 .54 5.87 .74 5.39 1.14 6.02 .67
4 61 3.13 .83 3.67 1.06 4.73 .91 3.65 1.04 5.68 .81 5.21 .79 5.21 .53 4.74 .86
5 84 5.27 1.01 5.42 .76 6.23 .58 5.70 .99 6.61 .46 6.05 .59 6.46 .45 6.33 .64
6 110 4.53 .81 4.76 .73 5.81 .66 4.87 .69 5.58 .87 5.87 .74 5.52 .55 5.27 .67
Total 408 4.21 1.15 4.13 1.30 5.12 1.23 4.56 1.22 5.68 1.10 5.22 1.05 5.39 1.13 5.15 1.27
Note. EM is economic motivation, SS is social status, HC is health concern, SN is social norm, MNO is man-nature orientation, CO is
collectivism, PER is perceived environmental responsibility, and EC is environmental concern.

57
Figure 3. Radar Chart of the Six Segments: Segment 1 (With Nature)
Figure 4. Radar Chart of the Six Segments: Segment 2 (Follower)

58
Figure 5. Radar Chart of the Six Segments: Segment 3 (My Green Life)
Figure 6. Radar Chart of the Six Segments: Segment 4 (Conspicuous Green Life)

59
Figure 7. Radar Chart of the Six Segments: Segment 2 (All-rounder)
Figure 8. Radar Chart of the Six Segments: Segment 2 (Challenger)

60
RQ2. Characteristics of Green Consumers
The second research question explored the character of green consumers by segment.
Demographics (e.g., gender, age, education and income level), pro-environmental media
preferences (e.g., magazine and online community), and pro-environmental product knowledge
were used to reveal these characteristics.
Demographics. In terms of demographics, all six segments showed similar distributions
of education and income level; specifically, in all segments, the majority of green consumers
were white/Caucasian, had college degrees (e.g., two-year and four-year), and had a relatively
high household income (e.g., $55,000–$69,999) (Table 7). For gender, half of the segments were
almost half male and half female. However, the majority of Segment 3 (My green life) were
female (n = 45, 71.4%). In contrast, about 80% of the green consumers in Segment 1 (With
nature, n = 18) and 70% of green consumers in Segment 2 (Follower, n = 48) were male.
Lastly, regarding age, the six segments showed a wide variance. Segment 2 (Follower)
was the youngest group of green consumers (average age = 32.7), while Segment 3 (My green
life) was the oldest group (average age = 41.4). The other four segments’ average ages were
evenly distributed; in Segment 1 (With nature), the average age was 33.3; in Segment 6
(Challengers), it was 36.5; in Segment 5 (All-rounder), the average age was 39.7; and in
Segment 4 (Conspicuous green life), the average was 40.6. Thus, age may be a more critical
factor in showing differences among the six segments than gender, education, and income level.
Based on the demographic information, some unique segments were revealed. Among the
six segments, Segment 3 (My green life) was a unique green consumer group that could be
described as middle-aged women who had concerns about family health and environmental
problems. Segment 1 (With nature) could be specified as young men who had little interest in

61
Table 7.
Demographic Profiles of Six Segments
Segment 1
(With Nature)
Segment 2
(Follower)
Segment 3
(My Green
Life)
Segment 4
(Conspicuous
Green Life)
Segment 5
(All-rounder)
Segment 6
(Challenger)
Gender Male 18 (78.3) 48 (71.6) 18 (28.6) 32 (52.5) 34 (40.5) 48 (43.6)
Female 5 (21.7) 19 (28.4) 45 (71.4) 29 (47.5) 50 (59.5) 62 (56.4)
Age 19-29 8 (34.8) 33 (19.3) 9 (14.3) 7 (11.5) 20 (23.8) 30 (27.3)
30-39 11 (47.8) 18 (26.9) 25 (39.7) 22 (36.1) 26 (31.0) 46 (41.8)
40-49 4 (17.4) 11 (16.4) 13 (20.6) 21 (34.4) 21 (25.0) 17 (15.5)
50-59 0 (0.0) 5 (7.5) 10 (15.9) 6 (9.8) 14 (14.3) 13 (11.8)
60+ 0 (0.0) 0 (0.0) 6 (9.5) 5 (8.2) 5 (6.0) 4 (3.6)
Race White/Caucasian 19 (82.6) 53 (79.1) 54 (85.7) 50 (82.0) 66 (78.6) 86 (78.2)
African-
American
1 (4.3) 6 (9.0) 4 (6.3) 4 (6.6) 4 (4.8) 8 (7.3)
Asian 3 (13.0) 6 (9.0) 3 (4.8) 5 (8.2) 6 (7.1) 11 (10.0)
Native
American
0 (0.0) 1 (1.5) 1 (1.6) 0 (0.0) 4 (4.8) 0 (0.0)
Pacific Islander 0 (0.0) 0 (0.0) 0 (0.0) 0 (0.0) 0 (0.0) 1 (.9)
Other 0 (0.0) 1 (1.5) 1 (1.6) 2 (3.3) 4 (4.8) 4 (3.6)
Education 2-year College 3 (13.0) 12 (17.9) 16 (25.4) 15 924.6) 15 (17.9) 24 (21.8)
4-year College 14 (60.9) 42 (62.7) 31 (49.2) 30 (49.2) 48 (57.1) 63 (57.3)
Master Degree 5 (21.7) 9 (13.4) 11 (17.5) 11 (18.0) 13 (15.5) 19 (17.3)
Doctoral Degree 0 (0.0) 1 (1.5) 3 (4.8) 1 (1.6) 3 (3.6) 3 (2.7)
Professional
Degree
1 (4.3) 3 (4.5) 2 (3.2) 4 (6.6) 5 (6.0) 1 (.9)

62
Table 7.
Demographic Profiles of Six Segments (Continued)
Segment 1
(With Nature)
Segment 2
(Follower)
Segment 3
(My Green
Life)
Segment 4
(Conspicuous
Green Life)
Segment 5
(All-rounder)
Segment 6
(Challenger)
Household
Income
$55,000-$59,999 8 (34.8) 26 (38.8) 10 (15.9) 12 (19.7) 22 (26.2) 30 (27.3)
$60,000-$69,999 5 (21.7) 12 (17.9) 14 (22.2) 15 (24.6) 26 (31.0) 26 (23.6)
$70,000-$79,999 2 (8.7) 9 (13.4) 8 (12.7) 8 (13.1) 8 (9.5) 12 (10.9)
$80,000-$89,999 3 (13.0) 8 (11.9) 7 (11.1) 6 (9.8) 6 (7.1) 9 (8.2)
$90,000 or more 5 (21.7) 12 (17.9) 24 (38.1) 20 (32.8) 22 (26.2) 33 (30.0)

63
environmental protection or the benefits of using pro-environmental products and who felt little
social pressure. In a similar vein, Segment 2 (Follower) could be described as young men who
followed society’s green consumption trend.
Media preferences. Across the six segments, how differently the green consumers used
pro-environmental media was investigated in terms of magazines and online communities. As
shown in Table 8, Segment 5 (All-rounder) had the largest number of green consumers who
subscribed to pro-environmental magazines (n = 34, 40.5%). In particular, these green consumers
most read National Geographic Traveler (n = 15, 21.7%), followed by Eat Well, Live Better (n =
14, 20.2%), and Mother Earth Life (n = 8, 11.6%). In contrast, Segment 4 (Conspicuous green
life) had the smallest number of green consumers who subscribed to pro-environmental
magazines (n = 5, 8.25%). About 20% of green consumers regularly read pro-environmental
magazines in Segment 3 (My green life) (n = 15, 23.8%), Segment 2 (Follower) (n = 12, 17.7%),
and Segment 6 (Challenger) (n = 23, 20.9%). Those green consumers also preferred Mother
Earth Life, Eat Well, Live Better, National Geographic Traveler, National Wildlife, and Mother
Earth News.
Regarding pro-environmental online community preferences, consistent patterns were
revealed. In particular, about 60% of green consumers in Segment 5 (All-rounder) regularly
visited pro-environmental online communities (n = 54, 64.3%). For the green consumers,
Change.org (n = 29, 29.2%), Reddit: Environment (n = 23, 23.2%), Greenpeace.org USA (n =
19, 19.2%), and Care2.com (n = 13, 13.2%) were popular. In addition, most of them reported that
they visit the pro-environmental online communities one to three times per week.
Segment 6 (Challenger) had the second-largest number of green consumers who visited
pro-environmental online communities (n = 37, 33.6%). Compared to Segment 5 (All-rounder),

64
Change.org (n = 13, 23.2%) and Reddit: Environment (n = 13, 23.2%) were the most preferred
pro-environmental online communities. The members of this segment visited these online
communities at least one to three times per month. The first (With nature) and second segments
(Follower) were the groups in which the smallest number of green consumers used pro-
environmental online communities.
Lastly, an interesting finding was that both Segment 3 (My green life) and Segment 4
(Conspicuous green life) had about 20% of green consumers using pro-environmental
communities. However, Segment 4 had the smallest number of green consumers subscribing to
pro-environmental magazines. In other words, to obtain information about green life, green
consumers in Segment 4 tended more to use pro-environmental online communities rather than
to subscribe to pro-environmental magazines. The green consumers in Segment 4 could have a
tendency to pay less for inconspicuous pro-environmental behaviors, for example, subscribing to
pro-environmental magazines. Thus, the difference in media preferences between magazines and
online communities may come from the participants’ willingness to invest money in
inconspicuous pro-environmental behaviors.

65
Table 8.
Crosstab Results between Six Clusters and Pro-environmental Magazine Usage
Segment
1
Segment
2
Segment
3
Segment
4
Segment
5
Segment
6
Magazine
Usage
Yes 3
(13.0)
12
(18.0)
15
(23.8)
5
(8.2)
34
(40.4)
23
(21.0)
No 20
(87.0)
55
(82.0)
48
(76.2)
56
(91.8)
50
(59.6)
87
(79.0)
Total 23
(100.0)
67
(100.0)
63
(100.0)
61
(100.0)
84
(100.0)
110
(100.0)
Magazine
Type
Sierra 0
(0.0)
2
(5.9)
1
(4.8)
0
(0.0)
3
(4.3)
3
(5.3)
Mother Earth
Life
2
(50.0)
5
(14.7)
1
(4.8)
0
(0.0)
8
(11.6)
7
(12.3)
Eat Well, Live
Well
1
(25.0)
6
(17.6)
0
(0.0)
2
(22.2)
14
(20.3)
7
(12.3)
Delicious
Living
1
(25.0)
2
(5.9)
0
(0.0)
0
(0.0)
2
(2.9)
4
(7.0))
Organic Spa 0
(0.0)
1
(2.9)
0
(0.0)
0
(0.0)
4
(5.8)
3
(5.3)
Mary Janes
Farm
0
(0.0)
2
(5.9)
1
(4.8)
0
(0.0)
1
(1.4)
1
(1.8)
National Wild
Life
0
(0.0)
3
(8.8)
1
(4.8)
1
(11.1)
5
(7.2)
5
(8.8)
E-The
Environmental
Magazine
0
(0.0)
2
(5.9)
0
(0.0)
0
(0.0)
0
(0.0)
2
(3.5)
Dirt 0
(0.0)
4
(11.8)
0
(0.0)
0
(0.0)
2
(2.9)
2
(3.5)
Mother Earth
News
0
(0.0)
4
(11.8)
6
(28.6)
1
(11.1)
4
(5.8)
3
(5.3)
National
Geographic
Traveler
0
(0.0)
1
(2.9)
6
(28.6)
4
(44.4)
15
(21.7)
8
(14.0)
National Park 0
(0.0)
2
(5.9)
1
(4.8)
0
(0.0)
5
(7.2)
5
(8.8)
Nature
Conservancy
0
(0.0)
0
(0.0)
4
(5.9)
1
(11.1)
6
(8.7)
4
(7.0)
Green Peace
Magazines
0
(0.0)
0
(0.0)
0
(0.0)
0
(0.0)
0
(0.0)
3
(5.3)
Total 4
(100.0)
34
(100.0)
21
(100.0)
9
(100.0)
69
(100.0)
57
(100.0)

66
Table 9.
Crosstab Results between Six Clusters and Online Community Usage
Segment
1
Segment
2
Segment
3
Segment
4
Segment
5
Segment
6
Online
Community
Usage
Yes 3
(13.0)
10
(14.9)
21
(33.3)
13
(21.3)
54
(64.3)
37
(33.6)
No 20
(87.0)
57
(85.1)
42
(66.7)
48
(78.7)
30
(35.7)
73
(66.4)
Total 23
(100.0)
67
(100.0)
63
(100.0)
61
(100.0)
84
(100.0)
110
(100.0)
Online
Community
Type
Hugg 2
(33.3)
2
(11.1)
0
(0.0)
0
(0.0)
0
(0.0)
4
(7.1)
Carbonally 0
(0.0)
1
(5.6)
0
(0.0)
0
(0.0)
2
(2.0)
3
(5.4)
Cahnge.org 1
(16.7)
3
(16.7)
10
(33.3)
2
(14.3)
29
(29.3)
13
(23.2)
Care2.com 1
(16.7)
3
(16.7)
1
(3.3)
0
(0.0)
13
(13.1)
6
(10.7)
MakeMe-
Sustainable
1
(16.7)
1
(5.6)
1
(3.3)
0
(0.0)
2
(2.0)
2
(3.6)
Reddit:
Environment
0
(0.0)
6
(33.3)
10
(33.3)
6
(42.9)
23
(23.2)
13
(23.2)
Green
options.com
0
(0.0)
0
(0.0)
0
(0.0)
1
(7.1)
3
(3.0)
4
(7.1)
Greenpeace.
org USA
1
(16.7)
2
(11.1)
6
(20.0)
4
(28.9)
19
(19.2)
6
(10.7)
Greenpeace
International
0
(0.0)
0
(0.0)
2
(6.7)
1
(7.1)
8
(8.1)
5
(8.9)
Total 6
(100.0)
18
(100.0)
30
(100.0)
14
(100.0)
99
(100.0)
56
(100.0)

67
Pro-environmental Product Usage. To understand how much these green consumers
engaged in pro-environmental purchasing, their pro-environmental product usage was examined
by segment. In terms of the average number of product categories that they had ever used, green
consumers in Segment 5 (All-rounder) and Segment 3 (My green life) purchased the greatest
variety of pro-environmental products. The average number of pro-environmental product
categories from which Segment 5 and Segment 3 purchased was 6.02 and 5.92, respectively. In
particular, members of both segments primarily used renewable energy and non-(or less) toxic
products. The only difference between the two segments was that Segment 5 (All-rounder)
purchased more ozone-free products, while Segment 3 (My green life) had a greater preference
for organic products.
The segments that followed Segment 5 and 3 were Segment 6 (Challenger) and Segment
4 (Conspicuous green life). Green consumers in Segment 6 purchased pro-environmental
products from 5.06 product categories, and those in Segment 4 purchased from 4.95 product
categories, on average. In terms of product category, reusable, biodegradable, renewable energy,
and non-(or less) toxic products were dominant. Lastly, green consumers in Segment 2
(Follower) and Segment 1 (With nature) purchased pro-environmental products from 3.72 and
2.35 product categories, respectively. However, the preferred product categories were different
between the two segments; specifically, Segment 2 bought more energy-saving, reusable, and
biodegradable products, whereas energy-saving and recyclable (or recycled) products were
popular for Segment 1.
Regarding pro-environmental product types, green consumers in Segment 1 mainly used
energy-efficient bulbs, and green consumers in Segment 2 used energy-efficient bulbs, eco bags,
and biodegradable garbage bags. In contrast, more green consumers in Segment 5 and 6

68
preferred organic products (e.g., foods, bedclothes, and natural cosmetics), non-toxic detergents,
energy-saving electronic products, reusable energy products (e.g., solar panels), and hybrid cars.
As green consumers engaged more in pro-environmental purchasing, they tended to use more
varied pro-environmental products as well as more specialized pro-environmental products.
Table 10.
Crosstab Results between Six Clusters and Pro-environmental Product Categories
Segment
1
Segment
2
Segment
3
Segment
4
Segment
5
Segment
6
Product
Categories
Energy saving 17
(30.9)
51
(20.5)
58
(15.6)
47
(15.6)
78
(15.0)
97
(17.4)
Recyclable (or
Recycled)
9
(16.4)
42
(16.9)
54
(14.5)
57
(18.9)
74
(14.2)
87
(15.6)
Reusable 9
(16.4)
32
(12.9)
47
(12.6)
44
(14.6)
61
(11.7)
75
(13.4)
Biodegradable 3
(5.5)
19
(7.6)
31
(8.3)
22
(7.3)
47
(9.0)
50
(9.0)
Renewable
energy
1
(1.8)
16
(6.4)
17
(4.6)
8
(2.6)
36
(6.9)
34
(6.1)
Non or less
toxic
5
(9.1)
21
(8.4)
49
(13.2)
31
(10.3)
49
(9.4)
58
(10.4)
Organic 8
(14.5)
36
(14.5)
55
(14.8)
44
(14.6)
71
(13.7)
79
(14.2)
Compostable 1
(1.8)
10
(4.0)
21
(5.6)
15
(5.0)
39
(7.5)
29
(5.2)
Ozone free 0
(0.0)
6
(2.4)
10
(2.7)
6
(2.0)
18
(3.5)
9
(1.6)
With renewable
materials
2
(3.6)
16
(6.4)
30
(8.1)
28
(9.3)
47
(9.0)
40
(7.2)
Total 55
(100.0)
249
(100.0)
372
(100.0)
302
(100.0)
520
(100.0)
558
(100.0)
Perceived Pro-environmental Product Knowledge. The differences in the participants’
perceptions of their pro-environmental product knowledge were compared by segment. As
shown in Table 12, there were significant differences between the perceived pro-environmental

69
product knowledge among the six segments: F(402, 5) = 33.396, p < .001. In particular, the
green consumers in Segment 5 (All-Rounder) believed that they had in-depth knowledge of pro-
environmental products (M = 5.50, SD = .95) followed by Segment 3 (My Green Life, M = 5.01,
SD = 1.15). In contrast, the participants in Segment 1 (With Nature) showed the lowest perceived
knowledge of pro-environmental products (M = 3.62, SD = 1.00), with those in Segment 2
(Follower) having marginally better perceptions of their knowledge (M = 3.99, SD = .63). Lastly,
the participants in Segments 4 (Conspicuous Green Life; M = 4.18, SD = .93) and 6 (Challenger;
M = 4.52, SD = .81) believed that they had modest levels of pro-environmental product
knowledge.
The variances in the participants’ perceived knowledge of pro-environmental products
were in line with their media preferences and product usage. In particular, the segments that
reported greater use of pro-environmental media and more pro-environmental product purchases,
namely Segments 3 and 5, showed higher levels of perceived knowledge than the other
segments. Thus, exposure to pro-environmental media and experience with pro-environmental
products can help consumers obtain information about pro-environmental products and develop
their knowledge of such products.
In addition, the post-hoc Tukey HSD test revealed the mean differences in pro-
environmental product knowledge between the six segments. Based on the results (Table 13), the
pro-environmental product knowledge of Segment 4 was not significantly different from that of
Segments 1, 2, and 6. Moreover, there was no significant mean difference between Segments 1
and 2. Aside from these four pairs, this study revealed that differences in pro-environmental
product knowledge are strongly reflected in the various green consumer segments.
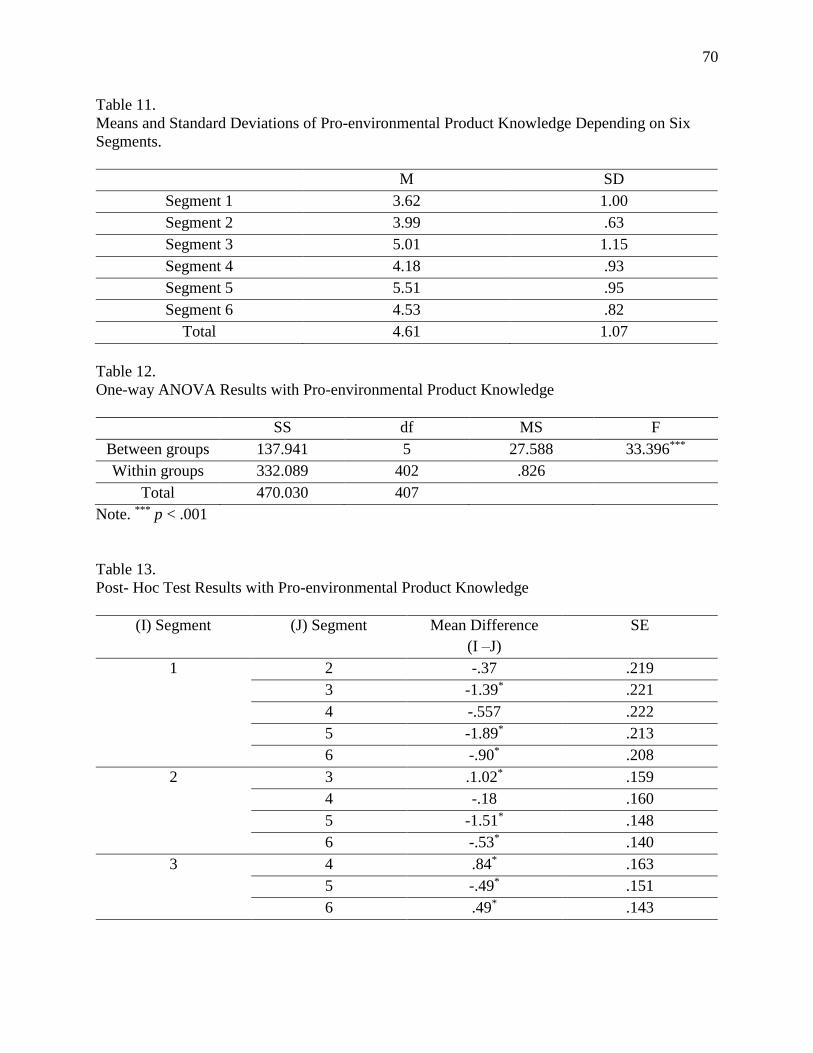
70
Table 11.
Means and Standard Deviations of Pro-environmental Product Knowledge Depending on Six
Segments.
M SD
Segment 1 3.62 1.00
Segment 2 3.99 .63
Segment 3 5.01 1.15
Segment 4 4.18 .93
Segment 5 5.51 .95
Segment 6 4.53 .82
Total 4.61 1.07
Table 12.
One-way ANOVA Results with Pro-environmental Product Knowledge
SS df MS F
Between groups 137.941 5 27.588 33.396***
Within groups 332.089 402 .826
Total 470.030 407
Note. *** p < .001
Table 13.
Post- Hoc Test Results with Pro-environmental Product Knowledge
(I) Segment (J) Segment Mean Difference
(I –J)
SE
1 2 -.37 .219
3 -1.39* .221
4 -.557 .222
5 -1.89* .213
6 -.90* .208
2 3 .1.02* .159
4 -.18 .160
5 -1.51* .148
6 -.53* .140
3 4 .84* .163
5 -.49* .151
6 .49* .143

71
Table 13.
Post- Hoc Test Results with Pro-environmental Product Knowledge (Continued)
(I) Segment (J) Segment Mean Difference
(I –J)
SE
5 -1.33* .152
6 -.35 .145
5 6 .98* .131
Note. * p < .05
RQ3. Skepticism of Green Consumers
The third research question sought to determine how skepticism toward pro-
environmental advertising differed between the six segments using one-way ANOVA. The
results showed that there were significant differences in skepticism among the segments: F(402,
5) = 45.876, p < .000 (Table 15). In particular, Segment 5 (All-Rounder) had the lowest levels of
skepticism toward pro-environmental advertising (M = 2.37, SD = 1.12), while the green
consumers in Segment 1 (With Nature) were the most skeptical of pro-environmental advertising
(M = 5.15, SD = .88). Those in Segment 2 (Follower; M = 4.03, SD = .73) and Segment 4
(Conspicuous Green Life; M = 3.97, SD = .83) had modest levels of skepticism. Lastly, the study
participants in Segment 6 (Challenger; M = 3.23, SD = .89) and Segment 3 (My Green Life; M =
3.39, SD = 1.13) showed the second and third lowest levels of skepticism of pro-environmental
advertising, respectively.
For the mean comparisons of skepticism among the six segments, the post-hoc Tukey
HSD test was used. Based on the results (Table 16), most pairs of segments showed significant
mean differences, while there were no significant differences between Segments 2 and 4 and
Segments 3 and 6. Thus, it was concluded that the green consumers in the six segments have
significantly different levels of skepticism toward pro-environmental advertising.

72
Table 14.
Means and Standard Deviations of Skepticism Depending on Six Segments.
M SD
Segment 1 5.15 .88
Segment 2 4.03 .73
Segment 3 3.39 1.13
Segment 4 3.97 .83
Segment 5 2.37 1.12
Segment 6 3.23 .89
Total 3.42 1.18
Table 15.
One-way ANOVA Results with Skepticism
SS df MS F
Between groups 208.874 5 41.774 45.876***
Within groups 366.054 402 .911
Total 574.924 407
Note. *** p < .001
Table 16.
Post- Hoc Test Results with Skepticism
(I) Segment (J) Segment Mean Difference
(I –J)
SE
1 2 1.12* .230
3 1.76* .232
4 1.18* .233
5 2.77* .224
6 1.97* .218
2 3 .64* .167
4 .060 .168
5 1.65* .156
6 .82* .147
3 4 -.58* .171
5 1.01* .159
6 .17 .150

73
Table 16.
Post- Hoc Test Results with Skepticism (Continued)
(I) Segment (J) Segment Mean Difference
(I –J)
SE
4 5 1.59* .160
6 .75* .152
5 6 -.84* .138
Note. * p < .05
RQ4. Attitudes of Green Consumers
The last research question investigated the differences between the six segments in their
attitudes toward pro-environmental advertising. The results of the one-way ANOVA (Table 18)
showed significant mean differences between the segments: F(402, 5) = 46.125, p < .000. The
mean scores of the attitudes of the participants in the six segments showed an opposite pattern to
the mean scores of their skepticism. Specifically, those in Segment 3 (All-Rounder) had the most
positive attitudes toward pro-environmental advertising (M = 6.23, SD = .95) followed by
Segment 3 (My Green Life; M = 5.64, SD = 1.00) and Segment 6 (Challenger; M = 5.51, SD =
.90). In contrast, the participants in Segment 1 (With Nature) did not evaluate pro-environmental
advertising positively (M = 3.44, SD = 1.07), and those in Segment 2 (Follower; M = 4.54, SD =
.98) and Segment 4 (Conspicuous Green Life; M = 4.70, SD = 1.11) had relatively positive
attitudes toward pro-environmental advertising.
In addition, the post-hoc Tukey HSD test revealed the mean differences in attitudes
toward pro-environmental advertising among the six segments. The mean differences in attitude
between Segments 3 and 6 and Segments 2 and 4 were not significant while the other pairs
showed significant differences in attitude. Thus, it was established that green consumers not only

74
have a variety of motivations for purchasing green products, but also a wide range of attitudes
toward pro-environmental advertising.
Table 17.
Means and Standard Deviations of Advertising Attitude Depending on Six Segments.
M SD
Segment 1 3.44 1.07
Segment 2 4.54 .98
Segment 3 5.64 1.00
Segment 4 4.71 1.11
Segment 5 6.23 .95
Segment 6 5.52 .90
Total 5.28 1.23
Table 18.
One-way ANOVA Results with Advertising Attitude
SS df MS F
Between groups 225.003 5 45.001 46.125***
Within groups 392.002 402 .976
Total 617.205 407
Note. *** p < .001
Table 19.
Post- Hoc Test Results with Advertising Attitude
(I) Segment (J) Segment Mean Difference (I –
J)
SE
1 2 -1.09* .238
3 -2.19* .240
4 -1.26* .241
5 -2.79* .232
6 -2.07* .226
2 3 -1.09* .173
4 -.17 .174
5 -1.69* .161

75
Table 19.
Post- Hoc Test Results with Advertising Attitude (Continued)
(I) Segment (J) Segment Mean Difference (I –
J)
SE
6 -.97* .153
3 4 .93* .177
5 -.59* .164
6 .12 .15
4 5 -1.53* .166
6 -.80* .157
5 6 .72* .143
Note. * p < .05

76
CHAPTER 5: DISCUSSION
SUMMARY OF THE STUDY
The purpose of this study was to group green consumers into sub-segments based on their
personal, social, and environmental motivations for purchasing pro-environmental products. In
addition, based on the sub-segments, the study examined the differences between their
characteristics (i.e., sociodemographics, media preferences, and pro-environmental product
usage), pro-environmental product knowledge, skepticism, and attitudes toward pro-
environmental advertising. To answer research questions, an online survey was conducted with a
total of 408 participants, and two types of clustering analysis (i.e., hierarchical and K-means
cluster analysis) and one-way ANOVA were used.
This study had several interesting results. By using clustering analysis, this study
revealed six segments of green consumers: Segment 1 (With Nature), Segment 2 (Follower),
Segment 3 (My Green Life), Segment 4 (Conspicuous Green Life), Segment 5 (All-Rounder),
and Segment 6 (Challenger). The six segments consisted of green consumers with a variety of
sociodemographic characteristics and showed wide differences in media preferences, pro-
environmental product usage, and perceived knowledge of pro-environmental products. As an
example, green consumers in the fifth (All-Rounder) and third segments (My Green Life)
preferred to use pro-environmental media and consumed a greater variety of pro-environmental
products than other segments. Moreover, these consumers were more confident in their
knowledge of pro-environmental products.
This study found that green consumers’ skepticism and attitudes toward pro-
environmental advertising differed significantly depending on segment. Specifically, those who
were more engaged in pro-environmental purchasing and used more pro-environmental media,

77
for example, Segment 3 (My Green Life) and Segment 5 (All-Rounder) segments, tended to have
less skepticism than the other four segments. Moreover, these segments had more positive
attitudes toward pro-environmental advertising. Evaluating these results in total led to several
theoretical and practical implications.
THEORETICAL IMPLICATIONS
This study had four theoretical implications regarding green consumer segmentation,
their motivations, their skepticism and attitudes toward pro-environmental advertising, and the
role of their experience with and knowledge of pro-environmental advertising in influencing
skepticism.
Green Consumer Segmentation
Based on the personal, social, and environmental motivations of green consumers, the
study revealed six segments of green consumers: Segment 1 (With Nature), Segment 2
(Follower), Segment 3 (My Green Life), Segment 4 (Conspicuous Green Life), Segment 5 (All-
Rounder), and Segment 6 (Challenger). When segmenting green consumers, prior studies have
used various approaches (e.g., psychographics and attitudinal and behavioral factors) (Chan,
1999; Finisterra do Paco & Barata Raspo, 2010; Modi & Patel, 2013; Wulandari et al., 2012).
Most of them revealed three groups of green consumers, truly green, ambiguous green, and non-
green consumers (Finisterra do Paco, Barata Raspo, & Filho, 2009; Modi & Patel, 2013;
Wulandari et al., 2012). The six segments used in this study were similar to those used in prior
research on green consumer segments. Specifically, regarding pro-environmental product usage,

78
Segment 5 (All-Rounder) and Segment 6 (Challenger) could be categorized as the truly green
consumers, and Segment 2 (Follower) could be categorized as the ambiguous green consumers.
The segments suggested by this study showed characteristics, such as pro-environmental
behaviors and knowledge, consistent with prior research. For example, Segment 5 (All-Rounder)
and Segment 3 (My Green Life) tended to consume various types of green products, preferred
pro-environmental media, and had a high knowledge of pro-environmental products. Likewise,
the truly green consumers were described as those who actively engaged in pro-environmental
purchasing, invested their efforts in pro-environmental behaviors, and were highly
knowledgeable (Chan, 1999; Thompson et al., 2010; Zinkhan & Carlson, 1995).
In addition, this study revealed that some green consumers did not have strong personal,
social, or environmental motivations and therefore, showed low levels of pro-environmental
product consumption. These results were similar to prior research which found that ambiguous
green consumers were not actively engaged in pro-environmental behaviors (Modi & Patel,
2013; Mostafa, 2009; Thompson et al., 2010). Thus, the results of the six segments are in line
with prior research on green consumer segmentation.
Moreover, this study revealed new segments of green consumers, including Segment 1
(With Nature), Segment 3 (My Green Life), and Segment 4 (Conspicuous Green Life). Segment
1 (With Nature) was a unique group of green consumers. Specifically, these green consumers
had the least motivation for pro-environmental purchasing. However, their collectivistic
orientation, also known as man-nature orientation or collectivism, was a relatively strong
motivator and triggered them to purchase pro-environmental products. Although their
engagement in pro-environmental product purchasing was low, this group of green consumers

79
showed that consumers can choose pro-environmental products without environmental
motivations.
For both Segment 3 (My Green Life) and Segment 4 (Conspicuous Green Life), health
concerns, environmental concerns, and collectivistic orientation were prominent motivations.
The combination of health concerns, environmental concerns, and collectivistic orientation led
them to engage in heath- and environment-oriented product purchasing (e.g., organic products
and non-toxic detergents) and to pursue a green life. Nevertheless, because of a desire for social
status, Segment 3 and Segment 4 showed a difference in pro-environmental product consumption
and media preferences.
Based on the above discussion, by using green consumers’ motivations, this study
confirmed segments that prior studies revealed as well as found new segments with a variety of
motivations. The newly proposed groups of green consumers show that green consumers are
motivated by not only environmental motivations but also by personal and social motivations. In
addition, for specific groups of green consumers, such as Segment 1 (With Nature), personal and
social motivations have stronger roles in triggering pro-environmental behaviors. With six
segments, this study contributes to understanding of a wide range of green consumers’
characteristics (e.g., sociodemographics, product consumption, and perceived product
knowledge). Specifically, the variety of motivations can explain why certain consumers want to
purchase pro-environmental products, how much they engage in purchasing pro-environmental
products, and what types of pro-environmental products they buy. Thus, the use of green
consumers’ motivations was a more valuable approach to dividing green consumers into
segments than other approaches, such as psychographics, attitudinal, and behavioral factors.

80
Green Consumers’ Motivation
A total of eight motivations were used to divide green consumers into segments:
economic benefit, social status, health concerns, social norms, cultural orientation,
environmental concerns, and perceived environmental responsibility. Among these motivations,
environmental concerns and perceived environmental responsibility were the most significant
motivations to differentiate between segments. Specifically, depending on the level of
environmental motivation, the six segments showed different levels of pro-environmental
product consumption, pro-environmental media preferences, and perceived pro-environmental
product knowledge. Therefore, environmental motivation can be considered a core motivation
driving pro-environmental behaviors.
The literature on consumers’ pro-environmental behaviors has consistently shown that
environmental motivation drives consumers’ pro-environmental behavior (Kim & Choi, 2005;
Mostafa, 2006; Newton et al., 2015; Suki & Suki, 2015). For example, many prior studies
revealed the positive influence of environmental concern on various pro-environmental
behaviors, such as recycling, energy saving, and purchasing pro-environmental products (Phau &
Ong, 2007; Reich & Armstrong Soul, 2016). In addition, personal environmental responsibility
and personal norms were used to explain why people engaged in pro-environmental behaviors
(Carman & Cheng, 2016; Dagher & Itani, 2014; Stern et al. 1999). In this study, the significant
role of environmental motivation on pro-environmental behavior was re-confirmed by
demonstrating the differences in pro-environmental product consumption based on six segments,
each with a different level of environmental motivation.
Additionally, this study revealed how a combination of various motivations led to green
consumers’ unique pro-environmental product purchasing. When environmental motivations are

81
present, health concerns and social status trigger interesting green consumer behavior. As an
example, green consumers who were in Segment 3 (My Green Life) had high health concerns
and environmental concerns. Based on their combined motivations, Segment 3 was the only
green consumer group mainly consuming organic products (e.g., organic vegetables, fruits, and
meats and organic cotton bedding and clothes) along with other pro-environmental products such
as non-toxic detergents. The green consumers’ organic product purchasing was consistent with
prior studies’ findings; health concerns are related to consumers’ organic food consumption
(Bonini & Oppenhein, 2008; Michaelidou & Hassan, 2008; Nasir & Karakaya, 2014). However,
this study showed not only health concerns but also environmental motivations triggered their
purchasing of health- and environment-friendly products to obtain health benefits and contribute
to environmental protection.
Regarding with Segment 4 (Conspicuous Green Life), green consumers’ motivations
showed patterns similar to the third segment’s green consumers. However, most of their
motivations were lower, with only social status being higher than Segment 3 (My Green Life).
High social status was related to the Segment 4’s conspicuous pro-environmental behaviors.
Specifically, they tended to avoid behaviors which required an investment of effort or money,
such as subscribing to pro-environmental magazines. This result was also in line with prior
studies which revealed that social status triggered consumers’ pro-environmental behaviors when
they wanted to show other people they were environmentally concerned (Griskevicious, Tybur,
& Van den Bergh, 2010; Park & Lee, 2016). However, because green consumers also have
health concerns, environmental motivations, and collectivistic cultural orientations, they tend to
purchase various pro-environmental products regardless of conspicuousness (e.g., energy
efficient bulbs, eco-bags, non-toxic detergents, and bio-degradable garbage bags).

82
In terms of collectivistic cultural orientation, most prior studies have applied this concept
to explain consumers’ pro-environmental behaviors in a collectivism-oriented country such as
China. These studies have reported the consistent results of collectivistic cultural orientation.
Specifically, consumers who have a high collectivistic cultural orientation engage in pro-
environmental behaviors more than those who do not (Chan, 2001; Leonidou, Leonidou, &
Kvasova, 2010; Schuitema & De Groot, 2015). In this study, collectivistic cultural orientation
was applied to explain green consumers’ purchasing behaviors in US. The results also showed
that green consumers from all segments had a modest level or more of man-nature orientation
and collectivism. Moreover, only collectivistic cultural orientation makes green consumers
purchase pro-environmental products. Thus, this study revealed the influences of collectivistic
cultural orientation on green consumers’ purchasing behaviors in US.
As prior studies have consistently shown, all identified motivations had significant roles
in driving green consumers’ pro-environmental product purchasing behaviors. Environmental
motivation as a core motivation can especially determine how much green consumers engage in
pro-environmental purchasing. Nevertheless, in addition to environmental motivation, most
green consumers have other types of motivations, and those motivations can be regarded as
supplementary motivations. Combining environmental motivations with other personal and
social motivations can explain a wide variety of green consumers’ purchasing behaviors. Thus,
this study’s approach of using various motivations to segment green consumers revealed primary
and secondary motivations for purchasing pro-environmental products. In addition, based on the
results, this study can increase understanding of how a combination of motivations is related to
the variety of green consumers’ pro-environmental purchasing behaviors.

83
Green Consumers’ Characteristics
The six segments were characterized by sociodemographics, pro-environmental media
preferences, pro-environmental product usage, and pro-environmental product knowledge. In
terms of sociodemographics, all six segments showed similar distributions of education and
household income level. Specifically, most green consumers from the six segments earned 2-year
or 4-year college degrees and had household income levels between $55,000 and $69,000. The
green consumers’ education and household income levels were consistent with prior studies’
descriptions of green consumers: green consumers consisted of those who are highly educated
and have a high income (Barber, 2014; Chan, 1999; Straughan & Roberts, 1999).
On the contrary, for gender, only two green segments, Segment 1 (With Nature) and
Segment 2 (Follower), consisted of more male consumers, while other segments, Segment 3 (My
Green Life) had more female consumers. Segment 4 (Conspicuous Green Life) evenly consisted
of male and female. Although many prior studies insist that gender is not a significant factor
influencing pro-environmental purchasing behavior (Straughan & Roberts, 1999), this study
showed that males are less engaged in pro-environmental product purchasing. In terms of green
consumers’ age, the study revealed that the six segments showed a wide variation in age with the
average age of green consumers being between 33.3 to 41.4 years.
Regarding gender and age, this study found that green consumers in Segment 1 (With
Nature), Segment 2 (Follower), and Segment 3 (My Green Life) had different demographic
characteristics. The typical consumer in Segment 1 and 2 can be described as a man in his early
thirties, while the typical consumer in Segment 3 can be best characterized as a middle-aged
woman. In other words, green consumers showed a wide spectrum of sociodemographic
characteristics between segments. The wide variety of green consumers’ sociodemographics

84
have been included in prior studies’ descriptions of green consumers, for example, highly
educated young men (Diamatopoulos et al., 2003) or middle-aged women (Hunter, Hatch, &
Johnson, 2004; Xiao & Hong, 2010; Zelezny, Chua, & Aldrich, 2000). Thus, the wide range of
sociodemographic characteristics about green consumers, especially age and gender, seems to
lead to inconsistent descriptions of green consumers used in prior studies.
Lastly, an interesting relationship was found between age, pro-environmental product
usage, and pro-environmental product knowledge. The average ages of Segment 2 (Follower),
Segment 6 (Challenger), and Segment 5 (All-Rounder) were 32.7, 36.5, and 39.7 years,
respectively. With increasing age, green consumers’ personal, social, and environmental
motivations grew stronger, and their perception of pro-environmental product knowledge was
higher. Similarly, green consumers’ pro-environmental media preferences and product
consumption increased with age.
Based on the results, this study shows that as time passes, green consumers have more
experience with pro-environmental products and invest more time in obtaining information about
pro-environmental products via pro-environmental media. This experience and knowledge
strengthens their motivations and leads to them being more engaged in purchasing pro-
environmental products. Thus, green consumers can gradually move from Follower to
Challenger or All-Rounder.
The proposition of movement between segments over time is similar to the widely
accepted argument that there is a relationship between environmental knowledge and behaviors.
Specifically, consumers that have more environmental knowledge tend to participate in pro-
environmental behaviors (Barbarossa & Pastore, 2015; Wulandari et al., 2012; Young, Hwang,
McDonald, & Oates, 2010). According to this argument, increasing age is not a significant

85
factor, but instead, increased knowledge and experience with age can be significantly related to
green consumers’ motivations and behaviors. Therefore, although most prior studies about green
consumer segments paid less attention to age, green consumers’ age can explain how experience
with and knowledge of pro-environmental products increases and how their motivation and
behaviors are developed.
Green Consumers’ Skepticism and Attitude
This study showed a wide spectrum of green consumers’ skepticism and attitude toward
pro-environmental advertising. In terms of green consumers’ skepticism, Segment 5 (All-
Rounder) was not skeptical of information in pro-environmental advertising while Segment 1
(With Nature) had the highest skepticism toward pro-environmental advertising. Other segments’
green consumers showed a range skepticism between Segment 5 and 1.
Regarding the range of green consumers’ skepticism, this study found more green
consumers tend to have less skepticism toward pro-environmental advertising. When green
consumers, such as those in the All-Rounder, Challenger, and My Green Life segments, have
strong environmental motivations, they are less suspicious of the trustworthiness of information
in pro-environmental advertising. Green consumer segments with a modest level of
environmental concern, including Conspicuous Green Life and Follower, were neither skeptical
nor convinced of pro-environmental advertising. Lastly, green consumers, such as With Nature,
having fewer environmental motivations tend to be suspicious of pro-environmental advertising.
Some previous research on the causes of skepticism argued that there is a negative
relationship between environmental motivations and skepticism (Chen & Leu, 2011; Obermiller,
Spangenberg & MacLachlan, 2005; Skarmeas & Leonidou, 2013; Xie & Kronrod, 2012). For

86
example, Matthes & Woonberger (2014) provided that green consumers who have environmental
concerns, positive attitudes toward pro-environmental products, and prior pro-environmental
purchasing tend to be less skeptical of pro-environmental advertising. Thus, based on a variety of
environmental motivations, the six segments had different levels of skepticism toward pro-
environmental advertising.
Similarly, green consumers’ attitudes toward pro-environmental advertising varied
depending on the six segments. For green consumers’ attitudes, their environmental motivation
also had a significant role. Green consumers with higher environmental motivation had a greater
positive attitude toward pro-environmental advertising. Thus, Segment 5 (All-Rounder) most
positively evaluated pro-environmental advertising while Segment 1 (With Nature) least
positively evaluated pro-environmental advertising.
In addition, attitude levels in the six segments showed an inverse relationship with
skepticism. For example, Segment 5 (All-Rounder) had the lowest skepticism and the most
positive attitude toward pro-environmental advertising. However, Segment 1 (With Nature) had
the highest skepticism and the least positive attitude. This inverse relationship is consistent with
prior studies’ results regarding the negative relationship between skepticism and advertising
attitude (Albayrak et al., 2011; Chen & Leu, 2011; Newell, Goldsmith, & Banzhaf, 1998;
Obermiller, Spangenberg, & MacLachlan, 2005).
Thus, green consumers have a wide range of skepticism and attitudes toward pro-
environmental advertising, and there is an inverse relationship between their skepticism and
attitude. Based on the results of this study, the range of skepticism and attitude is impacted by
the differences in green consumers’ environmental motivations. Only green consumers with

87
strong environmental motivations have low skepticism and positive attitudes toward pro-
environmental advertising.
Green Consumers’ Experience, Knowledge, and Skepticism
This study showed a range of skepticism of green consumers in six segments with
different levels of environmental motivations. However, the inverse relationship between
skepticism and attitude does not provide enough explanation about why green consumers have
different levels of skepticism. To understand the basis for the differing levels of skepticism,
green consumers’ experience and knowledge can be considered antecedents of skepticism.
Many scholarly works have argued that consumers’ experience and knowledge trigger
their skepticism toward advertising (Boush, Freistad, & Rose, 1994; Obermiller & Spangenberg,
1998; Taylor & Nelson, 2012). These studies have verified that more experienced and
knowledgeable consumers are more skeptical of advertising, have more negative beliefs in
advertising and advertisers, and have more negative attitudes toward advertising (Boush,
Freistad, & Rose, 1994; Taylor & Nelson, 2012). Applying the notion of consumers’ skepticism
to the context of pro-environmental advertising, some prior studies have argued that green
consumers are skeptical of pro-environmental advertising (Johnstone & Tan, 2015; Finisterra do
Paco & Reis, 2012; Shrum et al., 1995; Zinkhan & Carlson, 1995). In other words, because green
consumers have more experience with and knowledge of pro-environmental products, they doubt
the trustworthiness of pro-environmental advertising messages.
Nevertheless, this study reached the complete opposite conclusion. Specifically,
regarding green consumers’ experience and knowledge, the more experienced and
knowledgeable green consumers were, the less skeptical they were of pro-environmental

88
advertising. As shown in Figure 9, green consumers such as All-Rounder, Challenger, and My
Green Life, who have experience with various pro-environmental products and follow pro-
environmental media, perceive that they are knowledgeable about pro-environmental products.
Moreover, they have low skepticism and positive attitudes toward pro-environmental advertising.
Through their direct experience with pro-environmental products and pro-environmental
media, these green consumers have significant knowledge of pro-environmental products,
including the products’ environmental benefits and corporate efforts to produce pro-
environmental products. The understanding of pro-environmental products can make them less
skeptical of pro-environmental advertising, and thus cause them to have positive attitudes toward
pro-environmental advertising. In addition, when green consumers have stronger environmental
motivations, their experience, knowledge, and skepticism shows a clearer inverse relationship.
Thus, the argument for skeptical green consumers should be re-considered, especially what types
of green consumers are skeptical of pro-environmental advertising and why and how they are
skeptical of pro-environmental advertising.

89
Figure 9. The Inverse Relation among Experience, Knowledge, Skepticism, and Attitudes by Six
Segments.
PRACTICAL IMPLICATIONS
There are several practical implications of this study’s results. For instance, this study can
recommend appropriate target audiences for pro-environmental products and suggest advertising
and media strategies.
Targeting for Pro-Environmental Products
Among the six segments, Segment 5 (All-Rounder), Segment 6 (Challenger), and
Segment 3 (My Green Life) segments are considered the most appropriate target audiences for
pro-environmental products and advertising. Green consumers in Segment 5 and 6 especially
have strong personal, social, and environmental motivations for purchasing pro-environmental
products and actually use a variety of pro-environmental products. In addition, green consumers
have high experience with and knowledge of pro-environmental products.

90
Based on their experience and knowledge, green consumers are expected to understand
the personal, social, and environmental benefits of various pro-environmental products. To
promote pro-environmental products to this group of consumers, companies can reduce spending
on informing or educating consumers. Moreover, green consumers may not hesitate to try other
types of pro-environmental products if they perceive those products as enhancing quality of life
or environmental protection. Therefore, companies have opportunities to promote a variety of
already existing pro-environmental products and new pro-environmental products to green
consumers.
Similarly, the third segment’s (My Green Life’s) high health concerns and environmental
motivations trigger its pro-environmental purchasing. These green consumers are the appropriate
target audience for health- and environment-friendly products, such as organic, gardening, non-
toxic, reusable, renewable energy, and biodegradable products. Moreover, most pro-
environmental products that are included the above categories generally have a short purchase
cycle. Green consumers are expected to frequently purchase the pro-environmental products to
maintain their healthy and green life. By focusing on the third group, companies that produce
health- and environment-friendly products can have more consumers of their pro-environmental
products. The other advantage of targeting this group is that companies can easily identify this
group of green consumers based on their demographics, for instance middle-aged women.
Segment 2 (Follower) and Segment 4 (Conspicuous Green Life) can also be target
audiences. The second segment has a modest level of personal, social, and environmental
motivation and are not strongly engaged in pro-environmental purchasing. With increasing
experience and knowledge, however, these green consumers have the potential to be green
consumers to the level of Challenger and All-Rounder. Thus, knowing these consumers will have

91
behaviors like the Challenger and All-Rounder segments in the near future, companies can make
decisions to invest their marketing efforts to enhance Followers’ personal, social, and
environmental motivations.
Segment 4 (Conspicuous Green Life) can also be a good option for the second target
audience. Green consumers who are in Segment 4 have relatively high health concerns and
environmental motivations as well as a desire for social status. Among health- and environment-
friendly products, conspicuous or popular products, such as reusable and non- or less toxic
products, seem to be appropriate for these green consumers. Based on this information,
companies, which produce widely used conspicuous pro-environmental products, such as
tumblers, water bottles, eco-bags, solar energy cellphone chargers, and organic cotton clothing,
can easily attract green consumers.
Advertising Strategy
To appeal to green consumers, four advertising strategies are proposed: highlighting
motivations, providing information, educating consumers, and enhancing brand loyalty. For the
main target audiences, Segment 5 (All-Rounder), Segment 6 (Challenger), and Segment 3 (My
Green Life) segments, highlighting motivations and enhancing brand loyalty are appropriate
advertising strategies. This is especially true for green consumers categorized as All-Rounder
and Challenger because they have strong personal, social, and environmental motivations. Thus,
marketing and advertising professionals can highlight any personal, social, or environmental
benefits of the advertised products to stimulate their motivations. For the third segment’s
consumers, considering their health concerns and environmental motivations, advertising needs

92
to focus on how pro-environmental products improve their quality of health and the
sustainability of the environment.
In terms of their skepticism and attitudes toward pro-environmental advertising, green
consumers, who are included in Segment 5 (All-Rounder), Segment 6 (Challenger), and Segment
3 (My Green Life) segments, are the most appropriate target audience. The green consumers
have low skepticism and positive attitudes toward pro-environmental advertising. Because of
their low skepticism, green consumers trust pro-environmental messages that share the personal,
social, or environmental benefits of the advertised products. Their positive attitudes make green
consumers more likely to accept pro-environmental advertising messages, like the advertised
products, and ultimately purchase the products.
Additionally, marketing and advertising professionals make efforts to establish brand
loyalty for green consumers. Green consumers from the above three segments have strong
motivations, use various pro-environmental products, and are, therefore, attractive target
audiences to most companies that produce pro-environmental products. Competition to win over
green consumers is fierce. To be competitive, companies should use brand advertising. Through
brand advertising, companies show their brand names and logos repetitively, build specific brand
images (e.g., animal protection, sustainable development, or simple life), and form emotional
attachments with consumers. By establishing brand loyalty, companies earn the loyalty of green
consumers who have emotional connections with their brands and repetitively purchase their
various pro-environmental products.
For distributing pro-environmental advertising, companies should consider pro-
environmental magazines and online communities. The main target audiences for green products
regularly use pro-environmental magazines and online communities, and companies can access

93
the main target audience via pro-environmental media. Specifically, practitioners can advertise in
magazines that advocate sustainability, environmental protection, and green life. Moreover,
online communities, such as change.org and care2.com, which provide advertising opportunities
are regarded as media for their pro-environmental advertising.
For the second target audience, Segment 4 (Conspicuous Green Life) and Segment 2
(Followers), recommended advertising strategies include providing information and education.
Companies need to provide information about the environmental benefits of their pro-
environmental products and educate consumers about the importance of using pro-environmental
products to preserve the environment. Companies’ efforts can increase green consumers’
environmental motivations. The increased environmental motivations can then make green
consumers more engaged in pro-environmental purchasing.
Green consumers in Segment 4 and 2 show a modest level of skepticism toward pro-
environmental advertising. Therefore, when advertising pro-environmental products, companies
need to use a variety of marketing platforms, such as advertorials, media releases, and e-WOMs.
These marketing communications can help increase the credibility of information about the
companies’ products and can, therefore, help to overcome the fourth and second segments’
suspicion of pro-environmental advertising. Finally, companies can provide information and
education to green consumers to enhance those consumers’ confidence in pro-environmental
product knowledge which can play a role in reducing their skepticism.
LIMITATIONS AND SUGGESTIONS FOR FUTURE RESEARCH
This study has a few methodological limitations. The first limitation is that this study had
a low external validity because of MTurk’s worker population and sampling error. Although

94
MTurk has become a popular tool for obtaining high quality data for academic research, there is
concern about MTurk’s worker population. Compared to the US population, MTurk workers are
generally younger, more highly educated, and have a lower income (Kim & Pittman, 2016; Peer,
Vosgerau, & Acquisti, 2014; Shank, 2016). Thus, there is a possibility that workers with
particular sociodemographics are recruited more often for the survey, and the skewed survey
respondents may trigger biased results.
In terms of education and income level, to find green consumers, this study recruited only
highly educated (2-year college degree or over) and high income ($55,000 or more) workers by
using screening questions. Regarding age, survey participants had a wide range of ages with an
average age of 37.75. The average age of this study is similar to the median age of the US
population in 2015 (37.8). Thus, the survey participants were highly educated with high incomes
and were approximately the same average age as the US population. For these reasons, the study
samples are considered appropriate for the study population and not skewed.
In terms of sampling bias, the survey participants were not randomly selected, but
conveniently recruited among those who access MTurk within a specific time period. The
convenience of the sampling resulted in sampling bias. In this study, most survey participants
were White/Caucasian, and nearly 30% of the participants had relatively high household incomes
($90,000 or more). Prior research in green consumer segmentation showed a similar distribution
of race and household income level. Specifically, green consumers were 80% White/Caucasian
and 35% had a household income of $100,000 or more (Park & Lee, 2014). In addition,
according to the literature in pro-environmental purchasing, race is not a significant factor
influencing consumers’ pro-environmental purchasing (Staraughan & Robert, 1999). Thus, the
study data was expected to have little sampling error.
95
Nevertheless, this study used a specific online marketplace to specify green consumers
and recruit survey participants. In addition, the survey participants were conveniently selected.
Thus, the study’s results had an issue of generalizability. For future research, other methods
should be considered to access green consumers, such as online research companies, pro-
environmental media (magazines or online communities), and shopping data. In addition,
random sampling is needed to recruit study samples. The replication of these results in future
research would contribute to strong external validity and would result in better generalization to
all green consumers in the US.
Another limitation of the study is that different approaches should be considered to
address the relationships between green consumers’ experience, knowledge, and skepticism. This
study revealed the differences in experience, knowledge, and skepticism among six segments.
Based on the different levels of experience, knowledge, and skepticism, this study inferred a
negative relationship between green consumers’ experience, knowledge, and skepticism. To
support this argument, future research should use other methods, such as survey or experimental
design, to investigate causal relationships among these variables.
In addition, based on the results of this study, some suggestions are offered for future
research. To expand the current study’s findings, it would be beneficial for future researchers to
(1) explore the different types of consumer knowledge and their influence on skepticism, (2)
understand the six segments’ characteristics, and (3) develop advertising messages and media
strategies appropriate to each segment. First, future researchers should consider the different
types of consumer knowledge. Prior studies have suggested various types of consumer
knowledge, for example, subjective and objective knowledge, and consumer knowledge of
persuasive attempts, agent, and topic (Friestad & Wright, 1994; Flynn & Goldsmith, 1999;

96
Goldberg et al., 2006). This study focused exclusively on green consumers’ perceived
knowledge of pro-environmental products, yet such knowledge can be further categorized as
subjective and topical knowledge. While the present research revealed an inverse relationship
between knowledge and skepticism, it is recommended that the relationships between other types
of consumer knowledge and skepticism be explored. Specifically, future researchers could
attempt to determine how different types of consumer knowledge influence their skepticism and
attitudes and how the various types of consumer knowledge are inter-related to each other. t.
Such studies will contribute to our understanding of how consumers develop skepticism based on
the types and structure of their knowledge.
In terms of the characteristics of the six segments, this study provided basic information
regarding sociodemographics, media preferences, motivation, and knowledge. Although the
descriptions of the segments can help marketing and advertising professionals understand these
consumers’ characteristics, how to actually acces the green consumers in each segment remains
challenging. Thus, future research could try to develop specific consumer profiles comprising
more detailed information, including green consumers’ sociodemographics (e.g., age, gender,
education, income, and occupation), political tendencies, psychographics, geographic locations,
and lifestyles.
In particular, the political tendencies and geographic information could be used to
differentiate the consumers in the six segments. Palermo (2015) and Kennedy (2016) reported
that Democrats and liberals have a stronger interest in environmental issues and support stricter
environmental regulations than Republicans and conservatives. In terms of geographic location,
the northern and eastern states (e.g., California and Massachusetts) have shown more positive
attitudes toward environment protection than the southern states (e.g., Mississippi and Alabama)

97
(Kennedy, 2016). Thus, the consumers in the six segments may also have different political
tendencies and areas of residence. Such detailed political and geographical information will
enable marketing and advertising professionals to more easily access people in the specific
segments.
Moreover, green consumers in the six segments may have varying psychographic
characteristics and lifestyles. In this study, the researcher focused more on green consumers’
sociodemographic characteristics and their pro-environmental purchasing behaviors than their
psychographic attributes. Even though green consumers are generally grouped homogenously
according to their sociodemographic characteristics, they will likely have different
psychographic traits (e.g., introverted and extroverted), and thus show different pro-
environmental purchasing behaviors. Research has already shown that, for example, some green
consumers who are extroverted prefer to spend their time in nature visiting national parks while
their introverted counterparts favor making their home more pro-environmental through
gardening (Palermo, 2015). Thus, it is important to understand the psychographic variances
among the six segments and how these relate to their purchasing behaviors.
In a similar vein, lifestyles among green consumers may differ. In particular, green
consumers’ psychographic characteristics and their various interests in environmental issues
(e.g., energy conservation, animal protection, wildlife protection, and health) can be reflected in
their lifestyles (Ottman, 2010). Green consumers who are risk averse, for instance, may have
concerns about their health, with an allied interest in animal protection and a tendency to pursue
a vegetarian lifestyle to protect animals as well as themselves. Although this study described the
environmental and health-oriented lifestyles of Segments 3 and 4, it did not identify those of the
other segments. Accordingly, future researchers could perhaps explore the specific

98
environmental issues that interest the consumers in the different segments as well as their types
of lifestyles based on their psychographic characteristics and interests.
Lastly, it is recommended that future researchers consider developing appropriate
messages and media strategies for each segment. The green consumers in each segment have
different motivations and use different types of pro-environmental products; thus, advertising
message strategies should also vary depending on their appropriateness for each of the six
segments. The literature broadly divides advertising message strategies into two types: (1)
emotional and rational advertising messages and (2) ritual and transformational advertising
messages. Based on these categories, prior studies proposed diverse message strategies. For
example, Taylor (1999) advocated six advertising message strategies: ego, social, sensory,
routine, acute need, and ration. To establish the appropriate advertising message strategy for each
segment, future researchers should first consider the two types of advertising message strategies
and then apply the specific advertising message strategies suggested in prior studies.
In terms of media strategy, it is important to identify which types of media are available
to each segment and to specify how to use the relevant media to approach the consumers in the
segments. In this study, the researcher examined how green consumers use pro-environmental
magazines and online communities. The results showed that the “greener” consumers are, the
more they use pro-environmental magazines and online communities. Future researchers could
perhaps expand on this by exploring beyond pro-environmental magazines and online
communities to determine which media are relevant to each segment so that the full spectrum of
green consumers can be reached in more focused ways. By identifying the main media used by
each segment, future researchers could assist marketing and advertising professionals by
specifying the media class predominantly used by the respective segments. The magazines and

99
online communities used in this study came from three different media classes, namely
environmental protection, wildlife and nature, and green life. However, green consumers in each
segment may be interested in different environmental—or even other—issues and thus choose
magazines and online communities not mentioned in the present study. Consumer profiles, which
include sociodemographic, psychographic, and lifestyle information, can be beneficial in
locating the preferred media classes for the different segments. Accordingly, future research
should ideally aim to ascertain the most appropriate media types and media classes used by each
segment.

100
REFERENCES

101
Albayrak, T., Caber, M., Mountinho, L., & Herstein, R. (2011). The influence of skepticism on
green purchase behavior. International Journal of Business & Social Science, 2 (13),
189-197.
Amazon Mechanical Turk (n.a.). Retrieved from https://requester.mturk.com/tour.
Ajzen, I. (1991). The theory of planned behavior. Organizational Behavior and Human Decision
Processes, 50 (2), 179-211.
Banikarim, M. (2010, Apr 19). Seeing shades in green consumers. Adweek. Retrieved from
http://www.adweek.com/brand-marketing/seeing-shades-green-consumers-102096/.
Barber, N.A. (2014). Profiling the potential green hotel guest: Who are they and what do they
want? Journal of Hospitality & Tourism Research, 38 (3), 361-387.
Barbarossa, C., & Pastore, A. (2015). Why environmentally conscious consumers do not
purchase green products. Qualitative Market Research: An international Journal, 18 (2),
188-209.
Bertrandias, L., & Elaggied-Gambier, L. (2014). Others’ environmental concern as a social
determinant of green buying. Journal of Consumer Marketing, 31 (6/7), 417-429.
Bonini, S., & Oppenhein, J. (2008). Cultivating the green consumer. Stanford Social Innovation
Review, 6 (4), 56-61.
Boush, D. M., Freistad, M., & Rose, G.M. (1994). Adolescent skepticism toward TV advertising
and knowledge of advertiser tactics. Journal of Consumer Research, 21 (1), 165-175.
Brickart, C.A., & Ruth, J. (2012). Green eco-seals and advertising persuasion. Journal of
Advertising, 41 (4), 51-67.

102
Burnett, J. (2014, Oct 29). The new green consumers: Smart approaches to targeting. Marketing:
Green. Retrieved from https://www.mediapost.com/publications/article/237064/the-new-
green-consumers-smart-approaches-to-targe.html.
Carman, K.M.L., & Cheng, E.W.L. (2016). Green purchase behavior of undergraduate students
in Hong Kong. Social Science Journal, 53 (1), 67-76.
Chan, K. (1999). Market segmentation of green consumers in Hong Kong. Journal of
International Consumer Marketing, 12 (2), 7-24.
Chan, R.Y.K. (2001). Determinants of Chinese Consumers’ green purchase behavior.
Psychology & Marketing, 18 (4), 389-413.
Chang, C. (2011). Feeling ambivalent about going green. Journal of Advertising, 40 (4), 19-32.
Chang, H., Zhang, L., & Xie, G. (2015). Message framing in green advertising: The effect of
construal level and consumer environmental concern. International Journal of Advertising
34, 158-76.
Chekima, B., Chekima, S., Wafa, S.A., Wafa, S.K., Igau O.A., & Laison, S. (2016). Sustainable
consumption: The effects of knowledge, cultural values, environmental advertising, and
demographics. International Journal of Sustainable Development & World Ecology, 23
(2), 210-220.
Chen, F., & Leu, J. (2011). Product involvement in the link between skepticism toward
advertising and its effects. Social Behavior and Personality: An International Journal, 39
(2), 153-159.
Chen, N., & Wei, W. (2012). Ends justify means? Organic cotton products’ purchasing
motivations. Agribusiness, 28 (4), 440-450.

103
Clevland, M., Kalamas, M., & Laroche, M. (2005). Shades of green: Linking environmental
locus of control and pro-environmental behaviors. Journal of Consumer Marketing, 22
(4), 198-212.
Dagher, G.K., & Itani, O. (2014). Factors influencing green purchasing behavior: Empirical
evidence from the Lebanese consumers. Journal of Consumer Behavior, 13 (3), 188-195.
Diamatopoulos, A., Schlegelmilch, B.B., Sinkovics, R.R., & Bohlen, G.M. (2003). Can socio-
demographics still play a role in profiling green consumers? A review of the evidence
and an empirical investigation. Journal of Business Research, 56 (6), 465-480.
Diaz-Rainey, I., & Ashton, J.K. (2011). Profiling potential green electricity tariff adopters: Green
consumerism as an environmental policy tool. Business Strategy and the Environment, 20
(7), 456-470.
D’Souza, C., & Taghian, M. (2005). Green advertising effects on attitude and choice of
advertising themes. Asia Pacific Journal of Marketing and Logistics, 17 (3), 51-66.
Elving, W.J.L. (2013). Skepticism corporate social responsibility communications: the influence
of fit and reputation. Journal of Marketing Communications, 19 (4), 277-292.
Finisterra do Paco, A.M., & Barata Raposo, M. (2010). Green consumer market segmentation:
Empirical findings from Portugal. International Journal of Consumer Studies, 34 (4),
429-436.
Finisterra do Paco, A.M., Barata Rasposo, M., & Filho, W.L. (2009). Identifying the green
consumer: A segmentation study. Journal of Targeting, Measurement, & Analysis for
Marketing, 17 (1), 17-25.
Finisterra do Paco, A.M, & Reis, R. (2012). Factors affecting skepticism toward green
advertising. Journal of Advertising, 41 (4), 147-155.

104
Fransson, N., & Garling, T. (1999). Environmental concern: Conceptual definitions,
measurement methods, and research findings. Journal of Environmental Psychology, 19
(4), 369-382.
Friested, M., & Wright, P. (1994). The persuasion knowledge model: How people cope with
persuasion attempts. Journal of Consumer Research, 21 (1), 1-31.
Forehand, M.R. & Grier, S. (2003). When is honesty best policy? The effect of stated company
intent on consumer skepticism. Journal of Consumer Psychology, 13 (3), 349-356.
Gabler, C.B., Butler, T.D., & Adams, F.G. (2013). The environmental belief-behaviour gap:
Exploring barriers to green consumerism. Journal of Customer Behaviour, 12 (2), 159-
176.
Glein, M.R., Simith, J.S., Andrews, D., & Cronin Jr., J. (2013). Against the green: A multi-
method examination of the barriers to green consumption. Journal of Retailing, 89 (1),
44-61.
Goldberg, M.E., Niedermeier, K.E., Bechtel, L.J., & Gorn, G.J. (2006). Heightening adolescent
vigilance toward alcohol advertising to forestall alcohol use. Journal of Public Policy &
Marketing, 25 (2), 147-159.
Granzin, K. L., & Olsen, J. E. (1991). Characterizing participants in activities protecting the
environment: A focus on donating, recycling, and conservation behaviors. Journal of
Policy and Marketing, 10 (2), 1-27.
GreenBiz (2009). Several studies say conscious consumers willing to pay more for green.
Retrieved from https://www.greenbiz.com/news/2009/06/03/several-studies-say-
conscious-consumers-willing-pay-more-green.

105
Griskevicious , V., Tybur, J.M., & Van den Bergh, B. (2010). Going green to be seen: Status,
reputation, and conspicuous conservation. Journal of Personality and Social Psychology,
98, 392-404.
Hair, J.F., Anderson, R.E., Tatham, R.L., & Black, W.C. (2010). Multivariate data analysis.
Upper Saddle River, NJ:Prentice-Hall.
Hartmann, P., & Apaolaza-Ibanez, V. (2009). Green advertising revisited. Journal of
Advertising, 28 (4), 715-739.
Hartmann, P., Apaolaza, & Eisend, (2016). Nature imagery in non-green advertising; the effects
of emotion, autobiographical memory, and consumer’s green traits. Journal of
Advertising, 45 (4), 427-440.
Hassan, R., & Valenzuela, F. (2016). Customer perception of green advertising in the context of
eco-friendly FMCGs. Contemporary Management Research, 12 (2), 2016.
Hiu, A.S.Y., Sin, N.Y.M., Wang, C.C.L., & Chang, L.M.K. (2001). An investigation of decision-
making styles of consumers in China. Journal of Consumer Affairs, 35 (2), 326-345.
Hunter, L. M., & Hatch, Alison, & Johnson, Aaron. (2004). Cross-national gender variation in
environmental behaviors. Social Science Quarterly, 85 (3), 677-694.
Imran, R., Park, J., & Chi, C.G. (2015). Consequence of greenwashing consumers’ reactions to
hotels’ green initiatives. International Journal of Contemporary Hospitality
Management, 27 (6), 1054-1081.
Ipeirotis, P. (2015 Apr 6). Demographics of Mechanical Turk: Now live (April 2015 edition).
Retrieved from http://www.behind-the-enemy-lines.com/2015/04/demographics-of-
mechanical-turk-now.html.

106
Jain, S.K., & Kaur, G. (2006). Role of socio-demographics in segmenting and profiling green
consumers. Journal of International Consumer Marketing, 18 (3), 107-146.
Jansson, J., Marell, A., & Nordlund, A. (2010). Green consumer behavior: Determinants of
curtailment and eco-innovation adoption. Journal of Consumer Marketing, 27 (4), 358-
370.
Johnstone, M., & Tan, L. (2015). Exploring the gap between consumers’ green rhetoric and
purchasing behavior. Journal of Business Ethics, 132 (2), 311-328.
Kees, J., Berry, C., Burton, S., & Kim, S. (2017). An analysis of data quality: Professional
panels, student subject pools, and Amazon’s mechanical turk. Journal of Advertising, 46
(1), 141-155.
Kennedy, B. (2016, Feb 25). Public support for environmental regulations varied by state.
PewResearchCenter. Retrieved from http://www.pewresearch.org/fact-
tank/2016/02/25/public-support-for-environmental-regulations-varies-by-state/.
Kim, Y., & Choi, S.M. (2005). Antecedents of green purchase behaviors: An examination of
collectivism, environmental concern, and PCE. Advance in Consumer Research, 32 (1),
592-99.
Kim, B.S., & Pittman, M. (2016). Amazon’s Mechanical Turk for Academics: The Hit handbook
for social science research. Irvine, CA.
Kim, Y., Oh, S., Yoon, S., & Shin, H.H. (2016). Clothing the green gap: The impact of
environmental commitment and advertising believability. Social Behaviors and
Responsibility, 44 (2), 339-352.

107
Kim, Y., Yun, S., Lee, J., & Ko, E. (2016). How knowledge shapes green consumption: An
empirical study on voluntary carbon offsetting. International Journal of Advertising, 32
(1), 23-41.
Kyrousi, A.G., Panigyrakis, G.G., & Panopoulos, A.P. (2015). Attitudes toward ads portraying
women in decorative roles and female competition: An evolutionary psychology
perspective. International Journal of Advertising, 35 (5), 771-789.
Lai, C.K.M., & Cheng, E.W.L. (2016). Green purchase behaviors of undergraduate students in
Hong Kong. The Social Science Journal, 53, 67-76.
Lamda, J.L., & Reineke, J. B. (2009). Public attitudes about government involvement in
expressive controversies. Journal of Communication, 59, 225-242.
Lee, K. (2008). Opportunities for green marketing: Young consumers. Marketing Intelligence &
Planning, 26 (6), 573-586.
Leonidou, L.C., Leonidou, C.N., & Kvasova, O. (2010). Antecdents and outcomes of consumer
environmentally friendly attitudes and behavior. Journal of Marketing Management, 26
(13/14), 1319-1344,
Liu, H., McCarthy, B., & Chen, T. (2016). Green food consumption in China, Segmentation
based on attitudes toward food safety. Food & Agribusiness Marketing, 28 (4), 346-362.
Liu, X., Wang, C., Shishime, T., & Fujitsuka, T. (2012). Sustainable consumption: Green
purchasing behaviors of urban residents in China. Sustainable Development, 20 (4), 293-
308.
Macovei, O. (2015). Applying the theory of planned behavior in predicting pro-environmental
behavior: The case of energy conservation. Acta Universitatis Danubius, 11 (4), 15-32.

108
MacKenzie, S. B., Lutz, R.J., & Belch, G.E. (1986). The role of attitude toward the ad as a
mediator of advertising effectiveness: A test of competing explanations. Journal of
Marketing Research, 23 (May), 130-143.
Mainieri, T., Barnett, E.G., Valdero, T.R., Unipan, J.B., & Oskamp, S. (1997). Green buying:
The influence of environmental concern on consumer behavior. Journal of Social
Psychology, 137 (2), 189-204.
Marcacci, S. (2013, June 15th). The big green business opportunity for America’s economy.
Clean Techinca. Retrieved from https://cleantechnica.com/2013/06/15/the-big-green-
business-opportunity-for-americas-economy/.
Mason, W., & Suri, S. (2012). Conducting behavioral research on Amazon’s Mechanical Turk.
Behavior Research Method, 44 (1), 1-23.
Matthes, J., & Wonneberger, A. (2014). The skeptical green consumer revisited: Testing the
relationship between green consumerism and skepticism toward advertising. Journal of
Advertising, 43 (2), 115-127.
Michaelidou, N., & Hassan, L.M. (2008). The role of health consciousness, food safety concern
and ethical identity on attitudes and intentions toward organic food. International Journal
of Studies, 32 (2), 163-170.
Mittal, B. (1994). An integrated framework for relating diverse consumer characteristics to
supermarket coupon redemption. Journal of Marketing Research, 31 (4), 533-544.
Modi, A.G., & Patel, J.D. (2013). Classifying consumers based upon their pro-environmental
behaviour: An empirical investigation. Asian Academy of Management Journal, 18 (2),
85-104.

109
Mohr, L. A., Erogli, D., & Ellem, P.S. (1998). The development and testing of measure of
skepticism toward environmental claims in marketers’ communications. Journal of
Consumer Affairs, 32 (1), 30-55.
Mooi, E., & Starstedt, M. (2011). A Concise Guide to Market Research: The Process, Data, and
Methods Using IBM SPSS Statistics. Springer: London.
Mostafa, M.M. (2006). Antecedents of Egyptian consumers’ green purchase intentions: A
hierarchical multivariate regression model. Journal of International Consumer
Marketing, 19 (2), 97-126.
Mostafa, M.M. (2009). Shades of green: A psychographic segmentation of the green consumer in
Kuwait using self-organizing maps. Expert Systems with Applications, 36 (8), 11030-
11038.
Nasir, A.V., & Karakaya, F. (2014). Underlying motivations of organic food purchase intentions.
Agrbusiness, 30 (3), 290-308.
Nastu, P. (2007, Dec 4). Green awareness remains high, green purchases up. Retrieved from
https://www.environmentalleader.com/2007/12/green-awareness-remains-high-green-
purchases-up/.
Newell, S. J., Goldsmith, R.E., & Banzhaf, E.J. (1998). The effects of misleading environmental
claims on consumer perceptions of advertisements. Journal of Marketing Theory and
Practice, 6 (2), 48-60.
Newell, S.J., & Green, C.L. (1997). Racial differences in consumer environmental concern. The
Journal of Consumer Affairs, 31(1), 53-69.

110
Newton, J.D., Tsarenko, Y., Ferraro, C., & Sands, S. (2015). Environmental concern and
environmental purchasing intentions: The moderating role of learning strategy. Journal of
Business Research, 1974-1981.
Norusis, M.J. (2010). Cluster analysis in the PASW Statistics 18 Statistical Procedures
Companion (pp. 361-391). Upper Saddle River, NJ: Prentice Hall.
Obermiller, C., & Spangenberg, E.R. (1998). Development of scale to measure consumer
skepticism toward advertising. Journal of Consumer Psychology, 7 (2), 159-86.
Obermiller, C., Spangenberg, E., & MacLachlan, D.L. (2005). Ad skepticism: The consequences
of disbelief. Journal of Advertising, 34 (3), 7-17.
Osterhus, T.L. (1997). Pro-social consumer influence strategies: When and how do they work?
Journal of Marketing, 61 (4), 16-29.
Ottman, J. (2010, Feb 5). A smart way to segment green consumers. Harvard Business Review.
Retrieved from https://hbr.org/2010/02/a-smart-way-to-segment-green-c.
Palermo, E. (2015, Dec 9). 50 shaded of green? Environmental attitudes vary widely in US.
LiveScience. Retrieved from http://www.livescience.com/53022-american-
environmental-attitudes.html.
Park, K., & Lee, K. (2016). Is green product purchasing an innovative or conspicuous behavior?
Social Behavior and Personality, 44 (1), 29-44.
Park, J.S., & Lee, J. (2014). Segmenting green consumers in the United States: Implications for
green marketing. Journal of Promotion Management, 20 (5), 571-589.
Peattie, K. (2001). Golden goose or wild goose? The hunt for the green consumer. Business
Strategy & the Environment, 10 (4), 187-199.

111
Peer, E., Vosgerau, J., & Acuisti, A. (2014). Reputation as a sufficient condition for data quality
on Amazon Mechanical Turk. Behavioral Research Methods, 46 (4), 1023-1031.
Phau, I., & Ong, D. (2007). An investigation of the effects of environmental claims in
promotional messages for clothing brands. Marketing Intelligence & Planning, 25 (7),
772-788.
Pomering, A., & Johnson, L.W. (2009). Advertising corporate social responsibility initiatives to
communicate corporate image. Corporate Communications: An International Journal, 14
(4), 420-439.
Popsoap. (2013, Sep 11). German shoppers are ethical-elites while North Americans are ethical-
apathetic, new sustainability research by The Big Picture reveals. Retrieved from
http://popsop.com/2013/09/german-shoppers-are-ethical-elites-while-north-americans-
are-ethical-apathetics-new-sustainability-research-by-the-big-picture-reveals/.
Punj, G., & Stewart, D.W. (1983). Cluster analysis in marketing research: Review and
suggestions. Journal of Marketing Research, 20 (2), 134-148.
Rahbar, E., & Wahid, A. Nabsiah (2011). Investigation of green marketing tools effect on
consumers’ purchase behavior. Business Strategy Series. 12 (2), 73-83.
Reich, B.J., & Armstrong Soule, C.A. (2016). Green demarketing in advertisements: Comparing
buy green and buy less appeals in product and institutional advertising context. Journal of
Advertising, 45 (4), 441-458.
Rekom, L., Go, F.M., & Calter, D.M. (2014). Communicating a company’s positive impact on
society-Can plausible explanations secure authenticity? Journal of Business Research,
67, 1831-1838.

112
Roberts, J.A. (1995). Profiling levels of socially responsible consumer behavior: A cluster
analytic approach and its implications for marketing. Journal of Marketing Theory and
Practice, (Fall), 97-117.
Schlegelmilch, B.B., Bohlen, G.M., & Diamantopoulos, A. (1996). The link between green
purchasing decisions and measures of environmental consciousness. European Journal of
Marketing, 3 0(5), 35-55.
Schuitema, G., & De Groot, J.M. (2015). Green consumerism: The influence of product
attributes and values on purchasing intentions. Journal of Consumer Behavior, 14 (1), 57-
69.
Shank, D.B. (2016). Using crowdsourcing websites for sociological research: The case of
Amazon Mechanical Turk. The American Sociologist, 47 (1), 47-55.
Sharma, B., & Gadenne, D. (2014). Consumers’ attitudes, green practices, demographic and
social influences, and government policies: An empirical investigation of their
relationships. Journal of New Business Ideas & Trends, 12 (2), 22-36.
Shepherd, R., Magnusson, M., & Sjodem, P. (2005). Determinants of consumer behavior related
to organic foods. Ambio, 34 (4/5), 352-359.
Shrum, L.J., McCarty, J.A., & Lowery, T.M. (1995). Buyer characteristics of the green
consumers and their implications for advertising strategy. Journal of Advertising, 24 (2),
71-82.
Silk, K.J., Weiner, J., & Parrott, R.L. (2005). Gene cuisine or frankenfood? The theory of
reasoned action as an audience segmentation strategy for messages about genetically
modified foods. Journal of Health Communication, 10 (8), 751-767.

113
Singh, J. (1990). A typology of consumer dissatisfaction response styles. Journal of Retailing, 66
(1), 57-99.
Skarmeas, D., & Leonidou, C.N. (2013). When consumers doubt, watch out: The role of CSR
skepticism. Journal of Business Research, 66, 1831-1838.
SRDS Media Solution. Retrieved from http://next.srds.com/nmp/search/class/600-media?wp=y.
Staraughan, R.D.,& Roberts, J.A. (1999). Environmental segmentation alternatives: A look at
green consumer behavior in the new millennium. Journal of Consumer Marketing, 16 (6),
558-575.
Stern, P C., Dietz, T., Abel, T., Guagnano, G.A., & Kalof, L. (1999). A value-belief-norm theory
of support for social movements: The case of environmentalism. Research in human
Ecology, 6 (2), 81-97.
Suki, Norazah. M., & Suki, Norbayah.M. (2015). Consumption values and consumer
environmental concern regarding green products. International Journal of Sustainable
Development & World Ecology, 22 (3), 269-278.
Taylor, R.E. (1999). A six-segment message strategy wheel. Journal of Advertising Research, 39
(6), 7-17.
Taylor, D.C., & Nelson, B. (2012). Measuring the influence of persuasion marketing on young
wine consumers. Journal of Food Products Marketing, 18 (1), 19-33.
Teng, C., & Lu, C. (2016). Organic food consumption in Taiwan: Motives, involvement, and
purchase intention under the moderating role of uncertainty. Appetite, 105, 95-105.
The best green online communities. (n.a.). Retrieved from http://www.ranker.com/list/green-
online-communities/pilgrimsprogressive.

114
Thompson, D.W., Anderson, R.C., Hansen, E.N., & Kahle, L.R. (2010). Green segmentation and
environmental certification: Insights from forest products. Business Strategy and the
Environment. 19, 319-334.
Tseng, C., & Tasi, S. (2011). Effect of consumer environmental attitude on green consumption
decision-making. Pakistan Journal of Statistics, 27 (5), 699-708.
Tucker, E.M., Rifon, N.J., Lee, E.M., Reece, B.B. (2012). A test of green claim types and the
role of individual consumer characteristics for green ad response. Journal of Advertising,
41 (4), 9-23.
Venkatesh, V., and Davis, F.D. (2000). A theoretical extension of the technology acceptance
model: Four longitudinal field studies. Management Science, 46 (2), 186-204.
Vires, Gerdien., Terwel, B.W., Ellemers, N., & Daamen, D.D.L. (2015). Sustainability or
profitability? How communicated motives for environmental policy affect public
perceptions of corporate greenwashing. Corporate Social Responsibility and
Environmental Management, 22, 142-154.
Walker, L. (2013, Apr 3) 71% of consumers think green when purchasing. Environmental
Leader. Retrieved from https://www.environmentalleader.com/2013/04/71-of-consumers-
think-green-when-purchasing/.
Wigder ,D. (2008, Jul, 25). Getting smart about green targeting. GreenBiz. Retrieved from
https://www.greenbiz.com/blog/2008/07/25/getting-smart-about-green-targeting.
Webecoist (n.a.). 25 Environmental forums and social media sites. Retrieved from
http://webecoist.momtastic.com/2008/09/17/25-environmental-forums-and-social-media-
sites-get-connected-with-the-guide-to-green-online-communities/.

115
Wulandari, R., Suharjo, B., Soehadi, A.W., & Purnomo, H. (2012). Characteristic and
preferences of green consumer stratification as based to formulating marketing strategies
of ecolabel-certified furniture. Issues in Social & Environmental Accounting, 6
(1/2), 123-141.
Xie, C., Bagozzi, R.P., Grenhaug, K. (2015). The role of moral emotions and individual
differences in consumer responses to corporate green and non-green actions. Journal of
the Academy of Marketing Science, 43 (3), 333-356.
Xiao, C., & Hong, D. (2010). Gender differences in environmental behaviors in China.
Population and Environment, 32 (1), 88-104.
Xie ,G., & Kronrod, A. (2012). Is the devil in the details? The signaling effect of numerical
precision in environmental advertising claims. Journal of Advertising, 41 (4), 103-117.
Yang, D., Lu, Y., Zhu, W., & Su, C. (2015). Going green: How different advertising appeals
impact green consumption behavior. Journal of Business Research, 68 (12), 2663-2675.
Young, W., Hwang, K., McDonald, S., & Oates, C.J. (2010). Sustainable consumption: Green
consumer behaviors when purchasing products. , 20-31.
Zelezny, L.C., Chua, P., & Aldrich, C. (2000). Elaborating on gender differences in
environmentalism. Journal of Social Issues, 56 (3), 443-457.
Zimmer, M.R., Stafford, T.F., & Stafford, M.R. (1194). Green issues: Dimensions of
environmental concern. Journal of Business Research, 30 (1), 63-74.
Zinkhan, G. M., & Carlson, L. (1995). Green advertising and the reluctant consumer. Journal of
Advertising, 24 (2), 1-6.

116
APPENDICES

117
Appendix A. Online Survey.

118

119

120

121

122

123

124
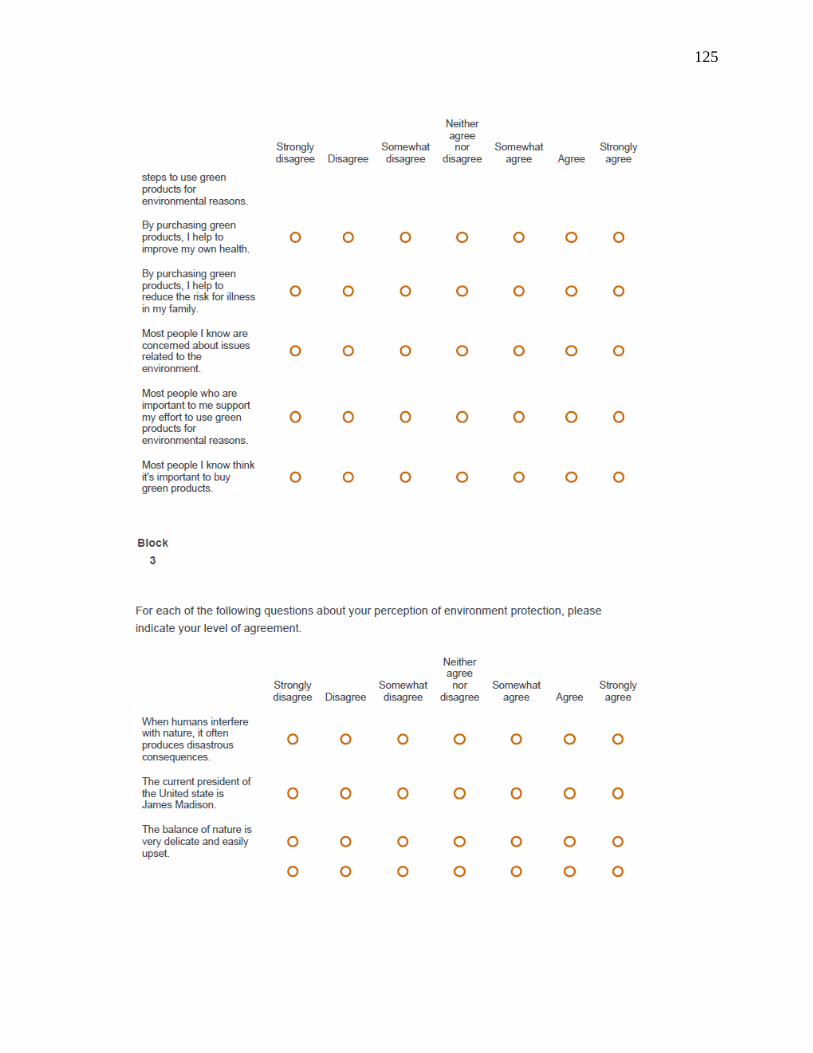
125

126

127

128

129

130
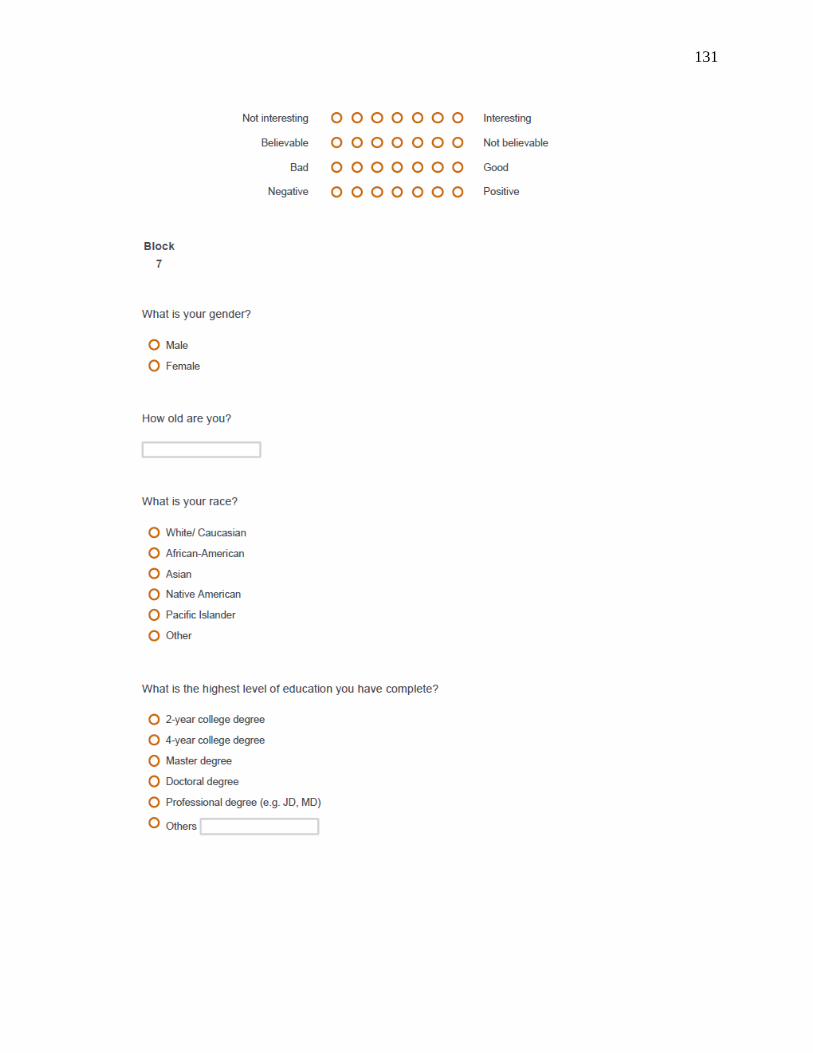
131

132

133
Appendix B. Amazon MTurk Recruitment Page.

134
VITA
Jinhee Lee is a doctoral candidate studying advertising at the University of Tennessee.
Lee’s research interests focus on consumers’ resistance to pro-environmental advertising that
includes; a) the impacts of consumer skepticism on their evaluation of pro-environmental
advertising, b) consumer cognitive processing of pro-environmental advertising, and c) pro-
environmental advertising message strategy. Lee earned her master‘s of science degree in
Advertising and Public Relation and Communition and Information at the Chung Ang University
in South Korea and Universtiy of Tennessee, repectively. Her Bachelor’s degree in
Environmental Science and Marketing at Kyung Hee University in South Korea. Before joining
the doctoral program, Lee worked as a researcher in a Korea Internet Advertising Deliveration
organiaztion.