greater anglia rus draft for consultation
TRANSCRIPT

Greater Anglia
Route Utilisation StrategyDraft for Consultation

2

3
Foreword
The Network Rail programme of Route
Utilisation Strategies is now well underway
and I am pleased to present our latest draft for
consultation covering the Greater Anglia area.
The document is the result of several months’
work in collaboration with rail industry partners
and wider stakeholders whom I thank for their
contribution.
The Greater Anglia route principally covers the
lines into London Liverpool Street and London
Fenchurch Street. It is a busy and growing
railway. In fact Liverpool Street is Britain’s
busiest station with more than 120 million
passengers each year making it twice as busy
as Heathrow Airport. The route extends into
Cambridgeshire, East Anglia, Essex and parts
of Hertfordshire.
This consultation document sets out the
options to improve the performance and grow
the capacity of the railway on the Greater
Anglia route. At this stage, it is a menu of
options. These options include the possibility
of more frequent services and longer trains,
as well as options to improve the reliability of
services. The RUS also considers options to
improve freight capacity, looking particularly at
the gauge on the cross country route from the
East Coast ports to the West Coast Main Line.
The views of stakeholders responding to this
consultation are of tremendous importance to
us, and we intend to undertake more work as
required to review these alternative options
before moving forward. The consultation
closes on 13 July and we intend to publish the
fi nal Greater Anglia RUS by Autumn 2007.
John Armitt
Chief Executive

4
Improved rail capacity is a central element of
the Government’s plans for effective delivery
of its objectives. The aim is to provide properly
performing train services which accommodate
aspirations for growth in a way that maximises
overall value for money and is affordable.
With the forecast growth contained in the
draft East of England Plan and the London
Plan driving passenger demand, and the
planned expansion of the East Coast ports
driving freight growth, the long-term use of the
routes in the Greater Anglia area needs urgent
consideration.
The Greater Anglia RUS encompasses
Thameside, Great Eastern and West Anglia
routes and covers the period to 2016/17,
although in order to tie in with the Regional
Spatial Strategy, the RUS also looks forward
to 2021.
Apart from the Colchester – Clacton
resignalling project, which is currently
underway, no major resignalling work is due
on these routes for around 10 years, when
parts of the rural lines will be candidates for
migration to ERTMS. In the longer term the
RUS will thus help scope the specifi cation for
the resignalling work on these routes.
The process followed in preparing this strategy
is consistent with that used in previous
RUSs and has involved: Obtaining a detailed
understanding of the base position; forecasting
passenger and freight demand up to 2016 and
2021; assessing and agreeing with the key
industry stakeholders the gaps which need to
be addressed; and optioneering to understand
what action can be taken to bridge the gaps.
From this process, the following gaps were
identifi ed:
■ Between existing/forecast peak capacity
and train service/infrastructure capacity.
- The analysis of the peak passenger
counts has shown the Great Eastern outer
services are already over capacity and the
demand forecasting indicates that virtually
all routes will be over capacity by 2016/17.
- The demand forecasts predict very strong
growth in the West Anglia corridor meaning
that this will then become the most
overcrowded route in the RUS area.
■ Between existing/forecast rural/inter-urban
capacity and frequency and required
capacity/frequency.
- The cross country routes are well used,
especially at peak times. There is already
localised overcrowding on services
operating to/from the regional centres
in the peak. In addition the service
frequency on the East Suffolk and Ipswich
– Peterborough routes is still two-hourly
whereas all the other rural services operate
hourly.
■ Between existing access to Stratford/
Docklands and that required to meet
market needs.
- With the growth of Docklands and
Stratford, journey opportunities need
to improve to/from West Anglia and
Great Eastern outer destinations. On
the Thameside route additional calls are
required at West Ham to provide a better
link to Docklands.
■ Between existing service frequencies and
the Mayor of London’s objective of 4 tph all
day on the suburban routes.
- There is a lower frequency on the
Cheshunt, Hertford East, Tottenham Hale
– Stratford and Tilbury Loop routes in the
off peak and parts of the peak.
Executive summary

5
■ Between the existing freight capacity and
forecast demand (especially for intermodal
and aggregate traffi c).
- With the strong growth, particularly in
maritime container traffi c, there is currently
a lack of paths to meet growth.
■ Between the existing freight gauge, train
length and route availability and those
required to meet market needs.
- With the increasing carriage of 9’6’’ high
containers, improved gauge clearance is
required on the Ipswich – Nuneaton route.
In addition some of the heavier aggregate
wagons are restricted on the Ipswich
– Peterborough route.
■ Between current and desired performance.
- The analysis of current performance
fi gures has highlighted a number of issues,
including level crossings, infrastructure
faults, Rules of the Plan compliances and
the turnround times on the rural routes.
■ Between existing engineering access and
the desired access regimes especially on
the Stansted, suburban and cross country
routes.
- The operators are seeking to reduce the
impact of possessions on the Stansted
route on the busiest nights of the week, as
well as longer hours of operation on the
suburban routes (plus less impact from
possessions/isolations on the operation
of depots/berthing sidings). Improved
engineering access is also sought on the
cross country route as traffi c rises.
■ Between current power supply and that
required for future services/rolling stock.
- The current power supply is known to be
limited in a number of areas and a study is
being undertaken to assess the impact of
the RUS options on power demand.
■ Between current passenger access to
train services and that required to meet
future needs.
- The study has shown that there are gaps in
the following areas: car parking availability,
DDA compliance, crowding, interchange
and in the provision of new stations to
provide access to the network from new
developments.
■ Between current berthing capacity and
future requirements.
- An analysis of current berthing capacity
has shown that there is little spare capacity
and thus new facilities are likely to be
required to meet growth requirements.
Options
From a sift of the above issues a number of
options were identifi ed for development and
testing. These were grouped to address the
gaps in the following way:
Options which address peak capacity, as
well as access to Stratford/Docklands and
TfL’s frequency aspirations in the peak:
■ Option 1 – Lengthen peak services on the
Thameside Main Line
This option proposes that all the main line
peak services are strengthened such that
the shoulder peak services operate as
8-car and the high peak services as
12-car trains.
■ Option 2 – Lengthen peak services on the
Tilbury Loop and Ockendon Branch
Under this option platforms on the Tilbury
Loop and Ockendon branch are extended

6
and peak services are strengthened such
that all shoulder peak services are 8-car
and high peak services are formed of
12-car units.
■ Option 3 – Replace inter-city rolling stock
on Anglia services
Due to capacity constraints on the Norwich
and Great Eastern outer suburban
services, this option proposes replacing
the existing inter-city sets with modern
rolling stock, which is assumed to be
similar to the class 444 units currently
used on South West Trains long distance
services. These are confi gured with low
density (2+2) seating and operate as 5
x 23m units, although the split between
fi rst and standard class seating will need
consideration on these services. An
alterative would be to deploy Intercity
Express trains when they enter service, or
other similar long distance multiple units.
■ Option 4 – Run two additional Great
Eastern outer services in the high peak
This option proposes running two
additional trains in the high peak hour,
one from Colchester Town and one from
Chelmsford.
■ Option 5 – Call all Great Eastern outer
services at Stratford
To meet market requirements and even up
the loading between trains, it is proposed
to extend Platform 10a, so that more/all
outer services can call at Stratford.
■ Option 6 – Run additional peak services
on the Great Eastern from Gidea Park
This option proposes running additional
peak services on the Great Eastern inners,
such that there are 4 additional services in
the high peak and 5 in the shoulder peak.
■ Option 7 – Lengthen the peak services on
the Chingford route
This option proposes lengthening the
peak services on the Chingford route to
nine cars, which is the limit of the current
infrastructure.
■ Option 8 – Lengthen peak services
between Cambridge/Stansted Airport and
London Liverpool Street to 12-car
This options builds on the fact that a
number of West Anglia outer stations
already have 12-car platforms, but
currently none of the peak services are
longer than 8-car formation. This requires
the intermediate stations to be extended to
accommodate 12 cars.
■ Option 9 – Lengthen all peak Hertford East
services to 12 cars
In order to provide relief capacity down
the central/inner section of the West
Anglia route, it is proposed to extend the
platforms on the Hertford East and Lea
Valley routes to 12 cars and lengthen all
peak services.
■ Option 10 – Operate the Enfi eld services
as 9-car trains
The infrastructure (except at Stoke
Newington) can accommodate 9 car trains
and this option proposes to operate these
services as 9-car in the peak.
■ Option 11 – Run two shuttle services to
Seven Sisters.
This option maximises the use of 8-car
high peak trains and proposes a shuttle
service to Seven Sisters (for interchange
with the Victoria Line) in order to provide
additional high peak capacity.
■ Option 12 – Increase capacity on the
West Anglia Main Line
In addition to the train lengthening on the
Cambridge/Stansted outer services, this
option proposes carrying out extensive
works in the Lea Valley, so that additional
Stansted and West Anglia services to
Stratford can be operated in the peak. The
services proposed are: 2 x Hertford East
– Stratford (8-car slow); 2 x Cambridge
– Stratford (8-car slow); 2 x Stansted
– Liverpool Street (12-car fast) via Clapton;

7
2 x Stansted – Stratford
(8-car slow).
Options to address capacity on the rural/
inter-regional routes
■ Option 13 – Increase frequency of Ipswich
– Peterborough services to hourly.
This option seeks to improve the cross
country service by running the Ipswich
– Peterborough services on an hourly
basis, which matches the frequency on
many other rural services.
■ Option 14 – Increase frequency on the
East Suffolk Line to hourly
This option increases the frequency on the
only other rural service with a non hourly
frequency to hourly and requires a new
loop at Beccles.
■ Option 15 – Provide an hourly service
between Ipswich and Saxmundham
This option looks at increasing the
frequency at the bottom end of the East
Suffolk Line to hourly to refl ect the growth
in the area.
■ Option 16 – Increase capacity on rural/
inter-urban services to meet peak demand
This option proposes strengthening a
number of services to increase peak
capacity on services radiating from the
regional centres of Cambridge, Norwich
and Ipswich.
Options which address freight capacity
and capability:
■ Option 17 – Increase freight gauge, train
length and capacity on the Felixstowe
– Nuneaton route
This option builds on the Hutchison Ports
UK (HPUK) planning commitments and
the Transport Innovation Fund (TIF) bid by
identifying the capacity works required to
provide long term freight capacity through
to the West Coast Main Line at Nuneaton.
■ Option 18 – Improve the Route Availability
for freight traffi c on the Ipswich –
Peterbough route.
Heavy freight trains are subject to speed
restrictions on the cross country route
and this option proposes works to remove
these restrictions.
Options to improve performance:
■ Option 19 – Improve performance through
a range of measures.
The key stakeholders identifi ed a number
of performance initiatives following a
review of the performance analysis work.
These include: Investigate closure of the
level crossings in the Lea Valley; review
the Rules of the Plan; prevent further
disruptive Overhead Line Equipment
(OHLE) failures; improve turnrounds
on rural services; carry out a range of
performance improvement schemes
using NRDF funding, including fully
commissioning Ely West Curve.
Option to improve the effi ciency of
engineering access:
■ Option 20 – Improve the effi ciency of
Engineering Access.
The RUS analysis has identifi ed a number
of areas where the disruption caused
by engineering work could be reduced.
These areas include: improved operating
hours on the Stansted route on the busiest
nights and reduced maintenance access
at weekends; accommodating longer
operating hours on the suburban routes
to match the Underground’s operating
hours; reducing the impact of engineering
works/ isolations on berthing and depots;
improved engineering access on the cross
country route, whilst increasing overnight
freight capacity; investigating the scope
for wider use of single line working across
the network, so that the number of all-line
blocks can be reduced.

8
Option to address power supply issues:
■ Option 21 – Improve the power supply to
match future requirements.
As part of the RUS analysis work,
Network Rail’s Electrifi cation and Plant
Engineer has been asked to assess
the increased power requirements in
order to accommodate the predicted
changes in train service and rolling stock
requirements.
Options to address passenger access to
the Network:
■ Option 22 – Improve passenger access to
the network
The analysis work carried out on the RUS,
including a car park study by Passenger
Focus, has shown that station facilities
need to be improved in a number of
areas. This work would be taken forward
and developed in a number of areas
by the Route Enhancement Team. The
areas identifi ed include: improved car
parks at key stations; DDA at stations not
currently covered by DfT’s ‘Access for All’
programme; improved interchange at key
LUL stations, including Seven Sisters,
Tottenham Hale, Walthamstow Central,
Stratford and West Ham; relief of peak
crowding at key stations including the
above plus the London termini, Cambridge
and Chelmsford; and the location of
stations to serve new developments.
Option to address berthing capacity:
■ Option 23 – Improve berthing capacity
The analysis of berthing capacity has
shown that the current facilities are nearly
at capacity and additional berthing will be
required if all capacity options are taken
forward.
The options to address both peak and rural
capacity issues have been subject to initial
appraisal and the business case results
currently indicate the following:

9
No. Option BCR Anticipated Crowding Impact Comment
1 Lengthen peak trains on Thameside Main Line
Approx. 2 (using Railplan)
Meets capacity to 2021
2 Lengthen trains on Tilbury Loop
1.3 Meets capacity to 2021 Phasing the works might improve the business case
3 New rolling stock on the Angliainter-city services
Financially positive
Meets capacity to beyond 2021
4 Run more peak Great Eastern outer services
32.7 Limited impact – no change to where standing starts with or without extra trains
Need to combine with Options 3 and 5 to meet capacity
5 Stop all Great Eastern outer services at Stratford
-3.7 Helps even up loadings Enables Option 4 and meets stakeholder aspirations for better serving Stratford
6 Run additional peak services on Great Eastern inners
1.2 Meets capacity to 2016 (i.e. crowding on Great Eastern inners is similar to base year by 2016)
Need further interventions (such as evening up stopping patterns to enable more trains to run) in order to meet growth to 2021
7 Lengthen peak trains on the Chingford route
1.3 Meets capacity to 2016 but more passengers travel to Liverpool Street so endure crowded conditions for longer
Need more interventions (such as high density rolling stock) to meet long term passenger demand growth
8 Lengthen peak trains on the Cambridge and Stansted routes
1.4 Meets capacity to 2016 such that crowding is similar to base year on outers and Stansted Express – on average – in 2016
Phasing works might improve the business case
9 Lengthen Hertford East peak services to 12-car
0.6 Meets capacity on the branch services to 2021
Option refi nement is required in combination with other options
10 Longer peak trains to Enfi eld Town
2.7 Does not provide suffi cient capacity
Needs more interventions (such as high density rolling stock) to meet predicted increases in demand
11 Run peak shuttles to Seven Sisters
4.6 Signifi cant impact on average crowding but still above base year levels and does not provide suffi cient capacity through to Liverpool Street
Needs more interventions (such as high density rolling stock or more trains) to meet predicted increases in demand
12 Increase capacity on the West Anglia Main Line
2.3 (peak)4.2 (all day)
Meets capacity to 2021 by reducing crowding below base year levels and avoids standing beyond 20 minutes on outer and Stansted services
Further development and refi nement of this option is needed to reduce cost and target supply to demand
13 Increase frequency between Ipswich and Peterborough
0.9 Needs further timetable changes to be operable
14 Increase frequency on the East Suffolk Line
0.9 Needs further infrastructure to be operable
15 Run an hourly service to Saxmundham
0.6 Needs further infrastructure to be operable

10
The development of the remaining options
will be carried out as part of on-going
programmes.
Many of the options tested meet predicted
demand to 2016/21, although further
refi nement is required to optimise value
for money and to enhance capacity where
required. The effect of packaging options
also needs to be evaluated. On the Great
Eastern inners rolling stock changes or
regularisation of stopping patterns may need
to be considered to increase capacity pending
Crossrail. On the West Anglia inner services
considerable refi nement is required to assess
the combination of longer trains, use of high
density stock and the impact of improvements
to the Broxbourne – Tottenham Hale corridor
on the Southbury Loop loadings.
The analysis of freight capacity has shown
that traffi c to/from the Haven Ports needs to
use both the Great Eastern Main Line (GEML)
and the cross country route. The fi rst phase
of development on the latter route is required
now and the second phase will be required
between 2014 and 2023. The upgrading of the
Gospel Oak – Barking route is also required
if freight growth from Thameside is sustained
and to avoid an increasing volume of freight
traffi c crossing the GEML between Stratford
and Forest Gate.
The RUS has considered a range of options
which attempt to address the gaps identifi ed.
The options range from those which address
capacity, through service changes and
enhancements, to those which address areas
such as stations and performance. We now
seek stakeholders’ views on the gaps and
options presented before fi nalising
the strategy.

11

Contents
12
1. Background 14
1.1 Introduction 14
1.2 Structure of the document 16
2. Scope and planning context 18
2.1 Geographic scope 18
2.2 Economic context 18
2.3 Timeframe 18
2.4 Planning context – Department for Transport (DfT) 20
2.5 East of England Regional Assembly and draft East of England Plan 20
2.6 Greater London Authority and Transport for London 21
2.7 Linkages to other planning strategies 22
2.8 Assumptions about other schemes 23
3. Current capacity, demand and delivery 24
3.1 Train operators 24
3.2 Profi le of the freight market 24
3.3 Profi le of the passenger market 30
3.4 Stations 44
3.5 Berthing 46
3.6 Infrastructure 47
3.7 Current network capacity and utilisation 48
3.8 Performance 55
3.9 Engineering Access - current situation 59
3.10 Summary of baseline gaps and issues 61
4. Forecast of change – wider demand 62
4.1 Context 62
4.2 Changes to population, housing and employment 62
4.3 Freight growth issues by commodity 69
4.4 Transports proposals and enhancement aspirations 72
4.5 Regional/Local funding 74
4.6 Summary of gaps identifi ed 75
13
5. Forecast of change – predicted demand increases 76
5.1 Introduction 76
5.2 Passenger demand 76
5.3 Freight demand 86
5.4 Summary of gaps identifi ed 92
6. Forecasts of change – committed schemes 94
6.1 Introduction 94
6.2 Recently completed schemes 94
6.3 Committed enhancement schemes 94
6.4 Renewals 96
7. Strategic Options 98
7.1 Summary of gaps 98
7.2 Option defi nition 99
7.3 Assessment of options 102
7.4 Emerging conclusions 123
7.5 Contingent projects 124
8. Stakeholder consultation 126
8.1 Introduction 126
8.2 How you can contribute 127
8.3 Response date 127
Appendices 128
A: Rural Routes - Loadings on busiest trains 129
B: Berthing summary 140
C: Congested stations and station facilities data 142
D: Delay data 150
E: Freight path analysis by commodity 155
F: GEML capacity utilisation 156
G: Glossary of terms 159

14
1. Background
1.1 Introduction
1.1.1
Following the Rail Review in 2004 and
the Railways Act 2005, The Offi ce of Rail
Regulation (ORR) modifi ed Network Rail’s
network licence in June 2005 to require the
establishment of RUSs across the network.
Simultaneously, ORR published guidelines on
RUSs. A RUS is defi ned in Condition 7 of the
network licence as, in respect of the network
or a part of the network1, a strategy which will
promote the route utilisation objective. The
route utilisation objective is defi ned as:
“the effective and effi cient use and development of the capacity available, consistent with funding that is, or is reasonably likely to become, available during the period of the route utilisation strategy and with the licence holder’s performance of the duty”.
Extract from ORR Guidelines on Route Utilisation Strategies, June 2005
1 The defi nition of network in Condition 7 of Network Rail’s network licence includes, where the licence holder has any estate or interest in, or right over a station or light maintenance depot, such station or light maintenance depot.

15
1.1.2
The “duty” referred to in the objective is
Network Rail’s general duty under Licence
Condition 7 in relation to the operation,
maintenance, renewal and development of
the network. ORR guidelines also identify two
purposes of RUSs, and state that Network
Rail should balance the need for predictability
with the need to enable innovation. Such
strategies should:
a) “enable Network Rail and persons providing services relating to railways better to plan their businesses, and funders better to plan their activities; and
b) set out feasible options for network capacity, timetable outputs and network capability, and funding implications of those options for persons providing services to railways and funders.”
Extract from ORR Guidelines on Route Utilisation Strategies, June 2005
1.1.3
The guidelines also set out principles for RUS
development and explain how Network Rail
should consider the position of the railway
funding authorities, the likely changes in
demand and the potential for changes in
supply. Network Rail has developed a RUS
Manual which consists of a consultation
guide and a technical guide. These explain
the processes we will use to comply with the
Licence Condition and the guidelines. These
and other documents relating to individual
RUSs and the overall RUS programme are
available on our website at www.networkrail.
co.uk.
1.1.4
The process is designed to be inclusive. Joint
work is encouraged between industry parties
who share ownership of each RUS through
its Industry Stakeholder Management Group.
There is also extensive informal consultation
outside the rail industry by means of a Wider
Stakeholder Group.
1.1.5
ORR guidelines require options to be
appraised. This is initially undertaken using
the DfT’s appraisal criteria and, in Scotland,
the Scottish Executive’s STAG appraisal
criteria. To support this appraisal work RUSs
seek to capture implications for all industry
parties and wider societal implications in
order to understand which options maximise
net industry and societal benefi t, rather than
that of any individual organisation or affected
group.
1.1.6
RUSs occupy a particular place in the planning
activity for the rail industry. They utilise
available input from processes such as the
DfT’s Regional Planning Assessments and
Wales Planning Assessment, and Transport
Scotland’s Scotland Planning Assessment.
The recommendations of a RUS and the
evidence of relationships and dependencies
revealed in the work to reach them in turn form
an input to decisions made by industry funders
and suppliers on issues such as franchise
specifi cations, investment plans or the High
Level Output Specifi cations.

16
1.1.7
Network Rail will take account of the
recommendations from RUSs when carrying
out its activities, particularly they will be used
to help to inform the allocation of capacity on
the network through application of the normal
Network Code processes.
1.1.8
ORR will take account of established RUSs
when exercising its functions.
1.2 Structure of the document
1.2.1
The remainder of this chapter describes the
structure of the RUS.
1.2.2
Chapter 2 covers the geographic scope of
the RUS, the time horizon and the planning
context within which it is being developed.
1.2.3
The current capabilities and usage of the
strategic routes within the Greater Anglia
area are summarised in Chapter 3, drawing
on input from key industry stakeholders, and
particular issues are highlighted. In Chapters 4
and 5 the drivers of change in future years are
considered, and estimates of future demand
are presented together with the aspirations of
stakeholders.
1.2.4
Chapter 6 discusses the committed schemes
for enhancement/improvement on the routes
covered by the study, as well as those
on adjacent routes. This helps to identify
the benefi ts which will fl ow from these
improvements, as well as the potential for
synergy between committed schemes and
those developed by the RUS.
1.2.5
A key step in the process is the sifting of the
issues and analysis of the future year forecasts
in order to identify gaps and develop options
for addressing them. These gaps and options
are discussed in Chapter 7.
1.2.6
The receipt of feedback from the consultation
process is an important part of the preparation
of the fi nal RUS document, and details of the
process are presented in Chapter 8.
1.2.7
The appendices contain supporting analysis
on the options developed in the RUS.

17

18
2.1 Geographic scope
2.1.1
The Greater Anglia RUS covers the whole of
East Anglia and includes the Thameside route,
the Great Eastern and the West Anglia Main
Lines, as well as the rural branches.
2.1.2
The RUS coverage by strategic route is as
follows:
Strategic Route 5 – West Anglia:
■ Liverpool Street – Kings Lynn
■ Southbury Loop and the West Anglia
branches (the Chingford, Enfi eld, Hertford
East and Stansted branches)
■ Hitchin – Shepreth Branch Jn, south of
Cambridge (in conjunction with the East
Coast Main Line RUS)
■ Haughley Jn – Ely – Peterborough
■ Cambridge – Chippenham Jn
■ Ely – Trowse Jn
■ Coppermill Jn, north of Clapton – Stratford
Strategic Route 6 (part) – Thameside:
■ Fenchurch Street – Shoeburyness
(including the Tilbury Loop and Ockendon
Branch)
Strategic Route 7 – Great Eastern:
■ Liverpool Street – Norwich
■ Great Eastern branches (the Romford,
Southend, Southminster, Clacton, Walton,
Harwich, Braintree and Sudbury branches)
■ Great Eastern rural routes (the Felixstowe,
East Suffolk, Lowestoft, Great Yarmouth
and Sheringham branches)
The RUS considers the effect of options for the
study area on other adjacent routes and vice
versa.
2.2 Economic context
2.2.1
The area covered by the Greater Anglia
RUS is one of the fastest growing and most
economically important in the country. The
fi nancial districts of London are within the
catchment of the RUS and these bring
substantial benefi ts to the UK and its economy.
Productivity in London is 25 percent greater
than in the rest of the UK and the economy
makes a net contribution of around £15bn a
year to the national exchequer.
2.2.2
The RUS area also includes key ports.
Felixstowe is the country’s largest container
port, handling around 40 percent of UK
deep sea container trade. With so many of
the goods consumed by the country being
manufactured overseas the container traffi c is
vital to the national economy.
2.2.3
Good rail links between the region and the
capital to serve the jobs market, as well
as capacity to ensure the smooth fl ow of
container traffi c from the container ports are
thus key themes of this RUS.
2.3 Timeframe
2.3.1
The RUS primarily examines a time period
of ten years commencing from the RUS
Establishment date (expected to be December
2007). However, in order to tie in with the
Government’s planning years and to be able
to assess the effects of longer term growth in
line with the draft East of England plan, the
RUS provides forecasts for 2016 and, where
appropriate 2021.
18
2. Scope and planning context

1919
NORWICH
Peterborough
KINGS LYNN
LONDON FENCHURCH STREET
COLCHESTER
LONDONLIVERPOOL STREET
Tilbury Freight Container Terminal
Thames Haven
IPSWICH
Harwich Parkeston Quay
Harlow Mill
Middleton Towers
Whitemoor Yard
Thetford
Bury St Edmunds
Diss
SheringhamCromer
Lowestoft
Great Yarmouth
Sizewell
Felixstowe
Harwich Town
Manningtree
Clacton
Walton-on-NazeColchester
Town
Southminster
Sudbury
Braintree
Chelmsford
Shenfield
Witham
MarksTey
Southend Victoria
ShoeburynessSouthend Central
Grays
PitseaUpminister
Romford
Barking
STANSTED AIRPORT
Hertford East
Harlow Town
BISHOPS STORTFORD
CAMBRIDGE
Letchworth
Broxbourne
Cheshunt
TottenhamHale
Stratford
Chingford
Enfield Town
Walthamstow Central
SevenSisters
Key
Single line
Multi Track
Double track
Greater Anglia Rail Utilisation Strategy – Geographic Scope

20
2.4 Planning Context - Department for Transport (DfT)
2.4.1
One of the prime objectives of the RUS is to
give the Government (via DfT) the opportunity
to consider the options recommended for
meeting growth on (and developing) these
routes. Whilst the DfT has set no specifi c
objectives for the route, the underlying
assumption is that demand should be met at
lowest cost/best value without, where possible,
detriment to performance.
2.4.2
The RUS outcome will help to inform the
Government’s High Level Output Specifi cation
(which is expected to be published in
mid 2007), as well as future franchise
specifi cations.
2.5 East of England Regional Assembly and the draft East of England Plan
2.5.1
In 2004 the East of England Regional
Assembly issued their draft Plan for
consultation, the plan numbers issued by the
Secretary of State in response to the Plan
consultation being published in December
2006. The Plan provides high level forecasts
of population, housing and employment growth
over the region. In addition, the document also
sets out the region’s objectives:
■ Increase prosperity and employment
growth to meet identifi ed employment
needs of the region, and achieve a more
sustainable balance between workers and
jobs.
■ Improve social inclusion and access
to employment, services, leisure and
tourist facilities among those who are
disadvantaged.
■ Maintain and enhance cultural diversity
while addressing the distinctive needs of
different parts of the region.
■ Increase the regeneration and renewal of
disadvantaged areas.
■ Deliver more integrated patterns of land
use, movement, activity and development,
including employment and housing.
■ Sustain and enhance the vitality and
viability of town centres.
■ Make more use of previously developed
land and existing buildings, and use
land more effi ciently, in meeting future
development needs.
■ Meet the region’s identifi ed housing
needs, and in particular provide suffi cient
affordable housing.
■ Protect and enhance the built and historic
environment and encourage good quality
design and use of sustainable construction
methods for all new development.
■ Protect and enhance the natural
environment, including its biodiversity and
landscape character.
■ Minimise the demand for use of resources,
particularly water, energy supplies,
minerals, aggregates, and other natural
resources, whether fi nite or renewable, by
encouraging effi cient use, re-use, or use
of recycled alternatives, and trying to meet
needs with minimal impact.
■ Minimise the environmental impact of
travel, by reducing the need to travel,
encouraging the use of environmentally
friendly modes of transport, and widening
the choice of modes.
■ Ensure that the infrastructure programmes,
whether for transport, utilities or social
infrastructure, will meet current defi ciencies
and development requirements; and that
the responsible agencies commit the
resources needed to implement these
programmes and co-ordinate delivery with
development.

21
■ Minimise fl ooding risk.
Thus the main thrust of the regional objectives
is to cater for growth in a sustainable way
by meeting housing and employment
needs, whilst minimising the impact on the
environment. Whilst the region seeks to
achieve a better balance between population
and jobs by providing access to local
employment, the size of the population growth
in various parts of the region means that there
will be a strong need for out commuting to
London.
Rail has a key role to play by providing an
environmentally friendly mode of transport for
access to jobs in London, as well as improved
links to jobs, services and leisure facilities
within the region. In addition rail freight is
of key importance in conveying increasing
volumes of aggregate and maritime containers
to/from and across the region in a sustainable
manner (as refl ected in bullets 10 and 13
above).
2.6 Greater London Authority and Transport for London
2.6.1
The key planning document for the capital,
the London Plan, was published in 2003. This
document considers forecasts for employment
and population growth, together with the main
locations which could be developed to meet
that growth. In addition, it sets out the Mayor’s
six key objectives for London:
1. To accommodate London’s growth within
its boundaries without encroaching on
open spaces.
2. To make London a better city for people to
live in.
3. To make London a more prosperous city
with strong and diverse economic growth.
4. To promote social inclusion and tackle
deprivation and discrimination.
5. To improve London’s accessibility.
6. To make London a more attractive, well-
designed and green city.
2.6.2
Objectives 4, 5 and 6 are particularly relevant
to the RUS and underpin the Rail Corridor
Plans produced by Transport for London (TfL).
To promote accessibility and social inclusion,
TfL are keen to see metro-style frequency on
a number of suburban passenger services in
East and North East London.
2.6.3
Objectives 2 and 5 are relevant to the
development of the freight services which
operate through the capital, whilst transiting
to/from the GEML and Thameside. An
extract from TfL’s Freight on Rail in London
publication states:
“123 million tons of freight pounded London’s
roads in 2002. That equates to 450,000
freight vehicle movements crossing the GLA
boundary every day: HGVs account for 56,000
alone. Goods vehicle traffi c on the major roads
in London went up by 17 percent between
1993 and 2002 and movements are getting
heavier with articulated vehicle movement
increasing most (by 21 percent). There are
another 250 million tonnes of road freight
movement every year to and from the South
East region, with trade from mainland Europe
transiting London and the South East on top of
that. Much of this traffi c passes on trunk roads
used daily by Londoners.”
The Cross London RUS looked at freight
growth and routing issues, and the relationship
between the via London and cross country
freight routes is developed further in this RUS.

22
2.7 Linkages to other planning strategies
2.7.1
The RUS covers three important radial routes
from London, which link the capital to different
parts of East Anglia, as well as containing a
number of rural and cross country lines. The
RUS is therefore related to a number of other
strategies and policies:
■ The Cross London RUS, which looked at
the links between certain orbital routes and
a number of other lines radiating out of the
capital.
■ TfL’s Eastern Rail Corridor Plan, which
has been prepared to consider the
service specifi cation options for service
improvements over the suburban routes
leading out of London.
■ The East Coast Ports planning inquiries
covering the proposed development of
Felixstowe (South), Bathside Bay and Shell
Haven. These proposals will increase the
demand to convey maritime containers
over the Greater Anglia routes.
■ The East Coast Main Line RUS, which
is looking at services out of Kings Cross
to Peterborough, Cambridge and the
North East.
■ The Freight RUS, which Network Rail has
recently published and which contains
industry agreed forecasts for future freight
growth (these have been fed into this
RUS). The Freight RUS also identifi ed a
number of capacity gaps (gaps D-H) for the
Greater Anglia RUS to address.
■ This RUS takes account of the existing
Midland Main Line RUS, produced by the
SRA, and it will also be linked in with the
forthcoming East Midlands RUS when
considering freight pathing requirements on
the Felixstowe - Nuneaton route.
■ The DfT has published the Regional
Planning Assessment for the East of
England and this document includes
a review of the radial routes out of
London serving East Anglia and the
East of England. The review considers
several proposals, which have now been
developed within the RUS.
■ In October 2006 HM Treasury published
the Stern Review on the Economics of
Climate Change which estimated that the
dangers of unabated climate change could
be equivalent to 20 percent of GDP or
more per year. Thus there is an increasing
focus on the environmental benefi ts of
modes of transport with lower emissions,
especially the movement of people and
freight by rail.
■ The Eddington Transport Study highlighted
the pivotal role that transport plays in the
UK’s economic productivity, growth and
stability, within the Government’s broader
commitment to sustainable development.
The report also emphasised the importance
of maximising the use of existing transport
corridors, which is a central objective of
the RUS programme. In addition recent
announcements by the Department for
Transport support the enhancement of
infrastructure to international gateways,
such as Felixstowe, in order to generate
greater volumes of freight moved by rail.

23
■ Finally in considering the freight context,
it is worth quoting from the Secretary of
State’s statement on rail freight made to
the House of Commons on 19 July 2005,
the fi fth bullet point being particularly
relevant to the RUS:
1. Continue to support the principle of
incremental access charges for freight
operators.
2. Work with the freight industry to
understand its needs when setting the
strategy for the rail network, and to
provide the greatest possible certainty
of access.
3. Ensure grant funding is targeted to
deliver the maximum benefi ts in terms
of reducing congestion, pollution and
accidents.
4. Work to ensure that regional and local
planning decisions refl ect Government
priorities relating to the sustainable
movement of goods.
5. Work with the industry and Network
Rail to establish how freight growth can
be accommodated on the network.
6. Work with the devolved administrations,
and with the EC to ensure a consistent
UK and Europe-wide approach to rail
freight.
2.8 Assumptions about other schemes
2.8.1
In considering future years in the RUS
forecasts, it has been assumed that only
committed (funded) schemes will go ahead.
These are assumed to be the following:
■ The Public Private Partnership (PPP)
scheme for London Underground.
■ East London Line Extension Project
Phases 1 and 2, including the connection
to the North London Line.
■ DLR extension from Stratford International
to Woolwich Arsenal.
■ High Speed One Section 2 including
Integrated Kent Franchise (IKF), Channel
Tunnel Rail Link (CTRL) domestic services
and the freight interchange sidings at
Ripple Lane (Dagenham).
■ The London 2012 Olympic Games and
Paralympic Games (The Games) and
associated work at Stratford.
■ The North London Line upgrade works (for
TfL London Rail).
2.8.2
The impact of the East Coast Ports study is
also tested.
2.8.3
For the purposes of this RUS, it is assumed
that the Crossrail and Thameslink projects
are not committed, however, the impact of
these schemes on the RUS will be examined,
Crossrail having the potential for considerable
impact in the longer term between Shenfi eld
and Liverpool Street.

24
3. Current capacity, demand and delivery
3.1 Train operators
3.1.1
At present, four passenger train operators run
services over the lines covered by this RUS.
These are:
■ ‘one’ Railway, who operate services from
Liverpool Street over both the GEML to
Norwich and West Anglia Main Line to
Kings Lynn. ‘one’ also operate services
on the Great Eastern and West Anglia
branches and over the rural routes in
Norfolk and Suffolk.
■ c2c, who operate the services on the
Thameside route between Fenchurch
Street and Shoeburyness via the main
line and the Tilbury Loop/Ockendon
branch.
■ First Capital Connect (FCC), who operate
services from Kings Cross to Cambridge
and Kings Lynn.
■ Central Trains, who operate the inter-
regional services into East Anglia.
These are the Liverpool – Norwich and
Birmingham – Stansted services, which are
currently subject to refranchising.
3.1.2
No other passenger operators regularly run
services into East Anglia.
3.1.3
All of the current freight operators run services
that pass into East Anglia and these operators
are listed below:
■ English Welsh and Scottish Railway
(EWS), which is the largest freight operator
in the UK and has a licence to operate
European services. EWS runs services for
a wide range of markets. It is organised
into four market-based groups, each led
by their own Managing Director. These are
Energy (which includes coal), Construction
(which includes domestic waste), Industrial
(which includes Metals and Petroleum),
and Network (which includes international,
automotive and express parcels services).
■ Freightliner, which has two divisions:
Freightliner Intermodal is the largest haulier
of containerised traffi c, predominantly in
the deep sea market. Freightliner Heavy
Haul is a signifi cant conveyor of bulk
goods, predominantly coal, construction
materials and petroleum.
■ GB Railfreight (GBRf), which is a
signifi cant operator of deep sea container
trains and infrastructure services. GBRf
also runs a number of services for bulk
market customers.
■ Direct Rail Services (DRS), which operates
traffi c for the nuclear industry in the
UK. In the last few years the company
has expanded into running services for
the domestic and short sea intermodal
markets.
3.2 Profi le of the freight market
3.2.1
The following are the key infl uences which
generate rail freight in the route;
■ The thriving economy draws aggregates for
construction into the area.
■ Raw materials from several production
sites (sand, petroleum products and
furnace feed).
■ The Port of Felixstowe and Thameside
ports (Tilbury and Purfl eet). This is
mainly, though not exclusively, Intermodal
(container) business. Developers have
proposals for signifi cant port expansions.

25
■ The concentration of heavy industry along
the Thames corridor.
3.2.2
In addition to these main themes, rail freight
serves a number of other locally important
roles including taking waste out of London,
serving other industrial sites such as power
stations and cement works and distribution of
the rail industry’s own construction materials.
3.2.3
The overall picture by commodity is as follows:
Aggregates/building materials
The terminals involved in this business are
listed in table 3.1.
Table 3.1 Aggregate rail terminals in the study area
Location Commodities Origins/destinations Main route Volume
Receiving terminals:
Barham Aggregate East Midlands Peterborough, Ely, Bury St Edmunds.
3 tpw
Bow Aggregate/ Building materials
East Midlands/Yorkshire MML/ECML, NLL 8 tpw
Broxbourne Aggregate East Midlands Peterborough, Ely, Cambridge
5 tpw
Bury St Edmunds Aggregate East Midlands Peterborough, Ely. 3 tpw
Chelmsford Aggregate East Midlands Peterborough, Ely, Ipswich
1 tpw
Chesterton Junction Aggregate East Midlands Peterborough, Ely 5 tpw
Dagenham Aggregate Mendips NLL, Barking 8 tpw
Ely Aggregate East Midlands Peterborough 3 tpw
Harlow Mill Aggregate 1. Mendips2. East Midlands
1. NLL,Cheshunt2. Peterborough, Ely, Cambridge
10 tpw
Kennett Aggregate East Midlands Peterborough, Ely 3 tpw
Parkeston Aggregate Mendips NLL, GE 1 tpw
Purfl eet Aggregate Mendips NLL, Barking 5 tpw
Trowse Aggregate East Midlands Peterborough, Ely 3 tpw
Forwarding Terminals:
Dagenham Sand West London Barking, NLL 5 tpw
Marks Tey Sand West and South London GE, NLL 5 tpw
Middleton Towers Sand for glass making
North of England Ely, Peterborough, ECML.
8 tpw
Ipswich Griffi n Wharf Dredged aggregate
East Anglia GE Sporadic

26
A new aggregate terminal is also due to open
at West Thurrock (on the Tilbury Loop) in late
2007. Rail features strongly in this market
because of its success in moving signifi cant
tonnages reliably and economically. The
products concerned have a relatively low unit
value so transport costs comprise a large
proportion of the end price. Rail secures its
market share through achieving the maximum
productive heavy-haul payload per train which,
typically, for the locations listed, means a daily
train service with a net payload of at least
1,000 tonnes.
Terminal operators mainly produce concrete
and coated (tarmac) products which are
‘perishable’ and need to be manufactured
close to end use. Thus London, as the
biggest focus for construction activity, has rail
depots which reach the fringes of the City.
The penetration of the rail hauled business
throughout the region is shown above.
Other bulk raw material production/
consumption
Other bulk material traffi c moved by rail in the
area is listed in Table 3.2.
Intermodal business
The presence of the East Coast and Thames
ports is the major infl uence on this business
in the route. Felixstowe is the UK’s biggest
container port with around 40 percent of UK
deep sea container trade passing through.
This amounts to nearly three million Twenty-
foot Equivelent Units (TEUs) pa, 27 percent
of which are moved by rail to a network of
terminals throughout the UK. Twenty-fi ve
intermodal trains per day (each way) currently
serve the Port. Trains mostly travel via the
Great Eastern and North London Line (NLL),
the remainder travels over the cross country
route from the port via Bury St Edmunds,
Ely and Peterborough. There are also port
Intermodal Terminals at Tilbury (two) and
Purfl eet which forward 8-10 trains per day via
Barking and the NLL.
Intermodal traffi c prospers best on rail where
long distance haulage is involved, hence
the predominance of trains passing through
the route from the ports of entry rather than
serving destinations within it. In fact despite
very keen competition from road, market share
has risen from 17 percent in 1997 to its current
level of 27 percent. To meet Government’s
objectives of more freight by rail, especially
to the international gateways, it is important
that fast reliable paths are available for these
services.
Ely and Ripple Lane (Barking) are the only
import container receiving terminals in the
route. Whilst the majority of traffi c passes via
London, it does not have an intrinsic need to
travel via the capital. However, if the Gospel
Oak – Barking is upgraded this will assist the
fl ow of traffi c through London and alleviate the
need for freight to cross the GEML on the fl at
at Forest Gate.
Table 3.2 Raw material rail terminals in RUS area – other than aggregates
Location Commodities Origins /destinations
Main routing Volume
North Walsham Gas distillate Harwich GE 4 tpw
Lowestoft Mud oil Parkeston GE Occasional
Snailwell (Newmarket)
Furnace feed Kent Bury, GE, NLL 1 tpw
Thameshaven Petroleum products
South Wales Barking, NLL 3 tpw
Foxton Industrial coal Avonmouth NLL, Royston 3 tpw

27
General merchandise
The only general merchandise rail traffi c in the
region is shown in Table 3.3.
Table 3.3 General merchandise rail terminal in the area
Location Commodities Origin Routing Volume
Ely Various Channel Tunnel.Felixstowe
NLL, Cambridge.GE, Cross-country
10 tpw
Rail market penetration is currently less
in this sector than that achieved with bulk
commodities. Rail success tends to require
long distance, high volume trunk haul into
large distribution centers.
Other trainload freight
Apart from that listed above, the other bulk
train services in the Region are shown in
Table 3.4.
Specialist freight business
Apart from that listed, some other specialist
freight movements occur in the area;
■ Nuclear traffi c is moved from two power
station rail heads via the Great Eastern
and the NLL.
■ Ministry of Defence trains serve
Shoeburyness.
Table 3.4 Bulk commodity rail terminals in study area
Location Commodities Origins/destinations
Main routing Volume
Dagenham Waste dispatch Bucks. landfi ll Barking, NLL 5 tpw
Dagenham (Ford) Import autos and auto parts.
Various in UK and Continent
Barking, NLL 15 tpw
Purfl eet Import and export autos
Various Barking, NLL 5 tpw
Tilbury Newsprint Various in UK Barking, NLL 5 tpw
Whitemoor Rail infrastructure related
Anywhere in area All routes Varies

28
Summary
3.2.4
The above has emphasised the importance
of the intermodal and aggregate traffi c in the
Greater Anglia RUS area. A summary of key
terminals listed above is shown in Figure 3.1
and the main daily freight fl ows in the area are
shown in Figure 3.2. The Freight RUS also
identifi ed a number of issues for this RUS to
address and these are covered in Chapter 5.
Figure 3.1 Distribution of rail freight terminals in the RUS area
Felixstowe
Harwich
Norwich
Ipswich
Peterborough
Cambridge
Stevenage
Luton
Reading
Bedford
Milton Keynes
Key
Aggregates Terminal
Other bulk raw materials
Intermodal terminal
General Merchandise
Waste and rail infrastructure
Automotive
Specialist freight

29
The size of the lines are in proportion to the size of the particular commodity flows
NORWICH
Peterborough
KINGS LYNN
LONDON FENCHURCH STREET
COLCHESTER
LONDONLIVERPOOL STREET
Tilbury Freight Container Terminal
Thames Haven
IPSWICH
Harwich Parkeston Quay
Harlow Mill
Middleton Towers
Whitemoor Yard
Thetford
Bury St Edmunds
Diss
SheringhamCromer
Lowestoft
Great Yarmouth
Sizewell
Felixstowe
Harwich Town
Manningtree
Clacton
Walton-on-NazeColchester
Town
Southminster
Sudbury
Braintree
Chelmsford
Shenfield
Witham
MarksTey
Southend Victoria
ShoeburynessSouthend Central
Grays
PitseaUpminister
Romford
STANSTED AIRPORT
Hertford East
Harlow Town
BISHOPS STORTFORD
CAMBRIDGE
Letchworth
Broxbourne
Stratford
Chingford
Enfield Town
Walthamstow Central
SevenSisters
Tottenham Hale
ELY
March
Barking
Key
Container
Channel Tunnel
Construction
Other
Automobile
Figure 3.2 Main daily freight fl ows in the Greater Anglia RUS area in 2006/07

30
3.3 Profi le of the passenger market
3.3.1
This RUS covers the three important radial
routes serving London and the East of England
as well as a number of rural and cross country
routes.
A number of data sources have been drawn
upon and assistance has been received
from Atkins Transport Planning in analysing
the available information. The primary data
sources are:
■ The London Area Travel Survey (LATS)
which was conducted in 2001.
■ Ticket sales data from the MOIRA model
which incorporates information from the
LENNON database.
■ Network Rail and TOC passenger counts.
■ Transport for London data from its rail
planning database.
Around 109 million rail journeys are recorded
in the LENNON database in 2005/06 in the
Greater Anglia RUS area.1 Most of these
journeys are wholly within the area. Fewer
than ten percent originate or end outside
of the area. London attracts more than
60 percent of the total journeys. Regional
centres also attract signifi cant passenger
fl ows. The greatest non-London fl ows are
attracted by Cambridge, Norwich
and Chelmsford.
London demand
3.3.2
Services from the RUS area terminate at
Liverpool Street and Fenchurch Street
stations in the City of London. These stations
primarily serve commuters and so passenger
use is characterised by high volumes of
arrivals in the morning peak and departures in
the evening. Figure 3.3 shows the passenger
usage of Liverpool Street station, as an
example. This confi rms that the greatest
volume of passenger use of services occurs
during the morning peak when there are more
than 100,000 journeys into London (Liverpool
Street plus Fenchurch Street) on a typical
weekday. The analysis shows that off-peak
demand growth has been signifi cant on all of
the routes into London. However, the analysis
has focussed on the morning peak period
as this is the time at which gaps are most
likely to be identifi ed between demand and
service provision. Lower pricing for off-peak
season tickets is offered on West Anglia and
c2c services in an attempt to encourage early
commuting. However, customer feedback
(received by c2c) indicates that few commuters
are able or willing to adjust their morning
arrival times in London. More than half of
peak passengers travel on services arriving in
London between 08:00 and 09:00.
1 LENNON records ticket sales but not travelcards sold at London Underground outlets or journeys made using Oyster cards.

31
3.3.3
Sales of travelcards are not fully recorded in
the industry systems and information about
journeys made using Oyster cards is not
available. In the rest of this section information
is presented from physical counts of
passengers. It is not possible to identify short
term growth rates from this data due to the
variability in train loadings from year to year.
However, they give an indication of longer
term changes and a useful snapshot of current
demand and peak crowding.
Thameside
3.3.4
The Thameside route carries around 25,000
passengers a day into London in the morning
peak. Figure 3.4 shows the number of
passengers counted on the service on a
typical autumn weekday for each of the last
ten years. The chart also shows the total
capacity of the rolling stock (which includes an
allowance for standing space of approximately
35 percent of the number of seats) and the
number of seats provided, for years where
that data has been recorded. Though there is
considerable variation in this count data the
chart shows an upward trend to 1999 with
a less pronounced trend since a short-term
decline in 2000 (at the time of an employment
downturn in the City).
Source: Atkins analysis of ‘one’ data
0
10000
20000
30000
40000
50000
60000
70000
80000
06:0
0
07:0
0
08:0
0
09:0
0
10:0
0
11:0
0
12:0
0
13:0
0
14:0
0
15:0
0
16:0
0
17:0
0
18:0
0
19:0
0
20:0
0
21:0
0
22:0
0
23:0
0
00:0
0
Gat
e E
ntry
and
Exi
ts (
Hou
rly M
ovin
g A
vera
ge)
Key
Weekday
Saturday
Sunday
Figure 3.3: Passenger Use of Liverpool Street Station(2005 All Day Recorded Gate Entries plus Exits)

32
3.3.5
Table 3.5 shows the number of passengers
counted on each of the three routes served by
c2c into London and the average load factor
against total capacity (seats plus standing
area) for the morning peak and for services
arriving at Fenchurch Street between 08:00
and 08:59, which is the busiest hour each day.
These loads are recorded at the busiest point
for each train which, on this line, is usually at
West Ham or Limehouse where passengers
have the opportunity to change onto London
Underground and Docklands Light Railway.
Source: c2c peak counts 1995 – 2006Note: 2006 data reports the average load on each arriving train over a number of days, typically more than twenty.
Note: There is no seating data available for certain years.
Table 3.5: Thameside Passenger Loads (2005)
LTS 08:00 - 08:59 07:00 - 09:59
Passengers Load Factor Passengers Load Factor
Main Line 8,868 80% 16,479 72%
Ockendon Branch 2,479 90% 3,435 79%
Tilbury Loop 2,173 76% 4,734 65%
Source: c2c peak count data 2005
0
5000
10000
15000
20000
25000
30000
35000
40000
1995
1996
1997
1998
1999
2000
2001
2002
2003
2004
2005
2006
Figure 3.4: Thameside am Peak Passenger Loads and Capacities 1995 – 2006
Key
Capacity
Seats
Passengers

33
3.3.6
The load factors indicate that crowding is most
severe on the Ockendon branch services on
this group. Closer examination of the data
revealed that nine trains were carrying more
passengers than they have capacity for and
that as a result six percent of all passengers
on the Thameside route (around 1,500 arriving
passengers per am peak) were standing in
overcrowded conditions.2
Examination of the loadings along the routes
has been possible using the train weighing
data supplied by c2c. Our analysis of this data
is shown in Figures 3.5, 3.6 and 3.7. These
show the number of passengers and seats on
all trains calling at each station on the route
and therefore how demand builds up along
each of the routes. The fi gures show that there
are more passengers than seated capacity
provided over the three hour morning peak
from Upminster for Main Line and Ockenden
Branch services and from Dagenham Dock on
services on the Tilbury Loop.
0
2000
4000
6000
8000
10000
12000
14000
Sho
ebur
ynes
s
Tho
rpe
Bay
Sou
then
d E
ast
Sou
then
d C
entr
al
Wes
tclif
f
Cha
lkw
ell
Leig
h-O
n-S
ea
Ben
fleet
Pits
ea
Bas
ildon
Lain
don
Wes
t Hor
ndon
Upm
inst
er
Bar
king
Wes
t Ham
Lim
ehou
se
Figure 3.5: Thameside am Peak Loads on trains departing stations on the Main Line
Key
Peak Seats
Total Load
Source: c2c Train weighing data 2007
2 The estimate of passengers standing in overcrowded conditions is the number of people standing on trains that had passengers standing in excess of total capacity, as defi ned for the PIXC measure.

34
Tho
rpe
Bay
Sou
then
d E
ast
Sou
then
d C
entr
al
Wes
tclif
f
Cha
lkw
ell
Leig
h-O
n-S
ea
Ben
fleet
Pits
ea
Sta
nfor
d-Le
-Hop
e
Eas
t Tilb
ury
Tilb
ury
Tow
n
Gra
ys
Pur
fleet
Rai
nham
Dag
enha
m D
ock
Bar
king
Wes
t Ham
Lim
ehou
se
0
1000
2000
3000
4000
5000
6000
Figure 3.6: Thameside am Peak Loads on trains departing stations on the Tilbury Loop
Key
Peak Seats
Total Load
Pits
ea
Sta
nfor
d-Le
-Hop
e
Eas
t Tilb
ury
Tilb
ury
Tow
n
Gra
ys
Cha
fford
Hun
dred
Ock
endo
n
Upm
inst
er
Bar
king
Wes
t Ham
Lim
ehou
se
0
500
1000
1500
2000
2500
3000
3500
4000
4500
Figure 3.7: Thameside AM Peak Loads on trains departing stations via Ockendon
Key
Peak Seats
Total Load
Source: c2c Train weighing data 2007
Source: c2c Train weighing data 2007

35
Great Eastern Main Line
3.3.7
The Great Eastern Main Line (GEML) carries
around 55,000 passengers a day into London
during the morning peak. This makes up more
than half of peak journeys into London from
the RUS area. Passenger count data from
the last ten years suggests that passenger
numbers - along with capacity - have
increased year on year on this route.
These are shown in Figure 3.8 along with
seated and total capacity, including standing
allowances. The standing allowances (which
with the number of seats make up the total
capacity) on the GEML are lower than on the
other main lines into London in the Greater
Anglia RUS area. This is because all of the
inter-city services from Norwich and some
of the outer services have no standing
allowance.
Source: GEML peak count data 1995 - 2006Note: There is no available data for 2003.
0
10000
20000
30000
40000
50000
60000
70000
1995
1996
1997
1998
1999
2000
2001
2002
2003
2004
2005
2006
Key
Capacity
Seats
Passengers
Figure 3.8: GEML am Peak Passenger Loads and Capacities 1995 - 2006

36
Table 3.6: GEML Passenger Loads (2005)
GEML 08:00 - 08:59 07:00 - 09:59
Passengers Load Factor Passengers Load Factor
Inter-City 2,072 110% 3,913 91%
Outer 7,725 109% 14,596 89%
Southend 7,422 95% 12,480 82%
Inner 11,779 98% 24,710 84%
Source: GEML PIXC count data 2005
3.3.8
Table 3.6 shows the number of passengers
counted and the load factor against total
capacity (seats plus standing allowances)
for each of the four GEML service groups in
2005: inter-city services from Norwich; outer
suburban services from Ipswich, Colchester,
Clacton, and Chelmsford; Southend and
Southminster services; and inner suburban
services from Shenfi eld and Gidea Park.
This data is recorded at the maximum load
point which is Stratford for trains that call there
and Liverpool Street for those that do not.
3.3.9
The load factors are not directly comparable
between the service groups or against the
other routes serving London in the Greater
Anglia RUS area because the allowances for
standing vary. Particularly, there is no standing
allowance for the inter-city service group.
Twenty-nine trains (35 percent) on the GEML
in the 2005 morning peak had no standing
allowance for the calculation of load factors.³
3.3.10
Across the service groups inner services
are most overcrowded with more than
2,500 passengers (12 percent of the total)
standing in overcrowded conditions: around
600 travelled in similarly overcrowded
conditions on outer services but there were
no passengers recorded as standing in such
conditions on the Southend/Southminster or
Anglia inter-city services.
West Anglia
3.3.11
The West Anglia Main Line (WAML) carries
about 25,000 passengers a day into London
during the morning peak. This is around
25 percent more than it carried ten years
ago. Figure 3.9 indicates that much of this
increase occurred through the late 1990s since
which morning peak passenger demand fi rst
declined before a period of apparently volatile
passenger count numbers with passenger
numbers returning only in 2006 to similar
levels to those counted in 2000. This recent
growth has occurred as capacity has been
increased and journey times reduced on
inner services while journey times have been
extended for passengers travelling on services
from Cambridge and Stansted Airport. The
chart also shows seated and total (seated plus
permitted standing) capacity.
3 A key element of crowding targets is that no passenger should stand for a journey of 20 minutes or more. All trains which make a call less than 20 minutes away from the maximum loading point have a standing allowance added.
37
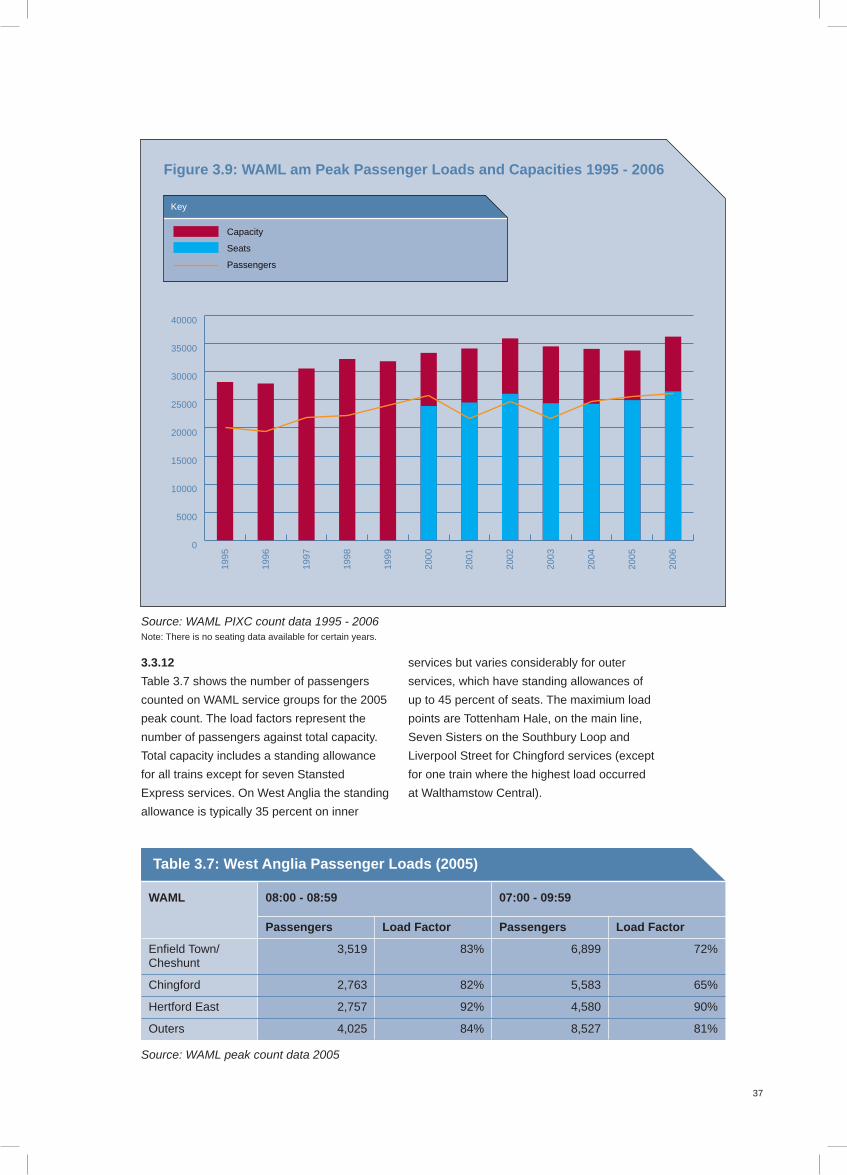
3.3.12
Table 3.7 shows the number of passengers
counted on WAML service groups for the 2005
peak count. The load factors represent the
number of passengers against total capacity.
Total capacity includes a standing allowance
for all trains except for seven Stansted
Express services. On West Anglia the standing
allowance is typically 35 percent on inner
services but varies considerably for outer
services, which have standing allowances of
up to 45 percent of seats. The maximium load
points are Tottenham Hale, on the main line,
Seven Sisters on the Southbury Loop and
Liverpool Street for Chingford services (except
for one train where the highest load occurred
at Walthamstow Central).
Table 3.7: West Anglia Passenger Loads (2005)
WAML 08:00 - 08:59 07:00 - 09:59
Passengers Load Factor Passengers Load Factor
Enfi eld Town/Cheshunt
3,519 83% 6,899 72%
Chingford 2,763 82% 5,583 65%
Hertford East 2,757 92% 4,580 90%
Outers 4,025 84% 8,527 81%
Source: WAML peak count data 2005
Source: WAML PIXC count data 1995 - 2006Note: There is no seating data available for certain years.
0
5000
10000
15000
20000
25000
30000
35000
40000
1995
1996
1997
1998
1999
2000
2001
2002
2003
2004
2005
2006
Key
Capacity
Seats
Passengers
Figure 3.9: WAML am Peak Passenger Loads and Capacities 1995 - 2006

38
3.3.13
The inner services are heavily loaded,
particularly those from Hertford East which
serve stations on the main line toward
Tottenham Hale. Although these are less
crowded than the GEML inner services in the
busiest hour, load factors are considerably
higher over the broader three hour peak.
3.3.14
Similar proportions of passengers were
standing in crowded conditions on the inner
and outer services - between fi ve and six
percent of the total - but a greater number
of people travel in these conditions on inner
services: around 1,000 a day in each direction
whereas around 500 travel in crowded
conditions on the outers.
Lea Valley station use
3.3.15
Ticket sales levels for travel to and from
some inner-suburban stations on the West
Anglia Main Line (particularly Angel Road and
Northumberland Park) indicate low passenger
usage of the stations. As ticket sales data is an
unreliable estimator of total patronage (though
a good indicator of it) at inner-surburban
stations, passenger counts were undertaken
at all stations from Northumberland Park to
Waltham Cross. Table 3.8 summarises these
data.
Table 3.8: West Anglia Main Line Station UseAll-Day Passenger Counts at Selected Inner Suburban Stations (January 2006)
Station Direction Liverpool Street Stratford
PassengersNumber of Trains
PassengersNumber of Trains
Waltham Cross UP 1,201 34 243 6
Waltham Cross DOWN 1,186 32 218 6
Enfi eld Lock UP 1,166 33 595 22
Enfi eld Lock DOWN 1,129 33 620 21
Brimsdown UP 1,247 35 14 1
Brimsdown DOWN 1,266 32 - -
Ponders End UP 797 34 10 1
Ponders End DOWN 791 33 - -
Angel Road UP 30 3 40 12
Angel Road DOWN 2 1 47 13
Northumberland Park UP 22 3 206 20
Northumberland Park
DOWN 6 1 206 22
Source: Network Rail Weekday Passenger Counts, January 2007.

39
Table 3.9: Stansted Express Passenger Loads (2006)
Stansted Express Busiest Hour Three Hour Peak
Passengers Load Factor Passengers Load Factor
AM Peak(To London)
(07:00 – 07:59 Departures)3,849 57%
2,012 86%
PM Peak(From London)
(17:00 – 17:59 Departures)3,646 60%
1,604 75%
Source: ‘one’ peak count data, 2006.Note: Passenger numbers are estimates of the number of standard class passengers. The total counted is reduced by 7 percent as an estimate of passengers travelling in fi rst class.
3.3.16
Very low patronage was observed at Angel
Road and Northumberland Park and for
Stratford services from Brimsdown and Ponders
End. Pedestrian access to Angel Road is also
inconvenient.
Stansted Airport
3.3.17
Stansted Airport serves around 21 million air
passengers a year (journeys starting or ending
at the airport). Of these, around a quarter
travel between the airport and central London
by rail. Stansted Express services between
Liverpool Street and Stansted Airport are
also used to provide a limited-stop service to
passengers at intermediate stations along the
West Anglia route. Table 3.9 summarises the
most recent passenger count data for these
services and shows load factors against total
capacity (seated plus standing allowance).4
This shows that morning peak demand is more
concentrated than evening demand (despite a
greater overlap between airport and commuter
demand during the evening peak).
3.3.18
In order to get a better understanding of rail
demand to and from the airport, passenger
counts were commissioned at Stansted
Airport station during the morning and evening
peaks. This data is summarised in Table 3.10
which shows the number of rail passengers
counted at the airport and the load factor as
a percentage of total capacity of the trains
on arrival at and departure from the airport.
These counts confi rm that there is more
airport passenger demand during the evening
commuter peak from London than there is
during the morning commuter peak towards
London. However, this data also indicates
that air passengers tend to travel later in
the morning and earlier in the evening than
commuters do. To cover the effect of airport
seasonability Network Rail aim to carry out
further counts during the development of
the RUS.
4 The standing allowance on Stansted Express trains confi gured as class 317/7+317/8 units is 40 percent of seats. All peak services counted were operated in this formation. The standing allowance applies to eight out of twelve trains in the morning peak (all in the busiest hour) and every other train throughout the evening peak.

40
3.3.19
In summary analysis of the London peak
services shows the following:
■ Increases in passenger demand have
been steadiest on the Great Eastern
services. Similar rates of growth have
been observed over the last ten years
on the Great Eastern and West Anglia
routes (around 30 percent) with lesser
increases observed on the Thameside
route. Variability has been greater on the
Thameside and West Anglia routes where
more housing growth is projected.
■ Passenger demand on the West Anglia
line appears to have been particularly
susceptible to economic fl uctuations in
the City and the short-term downturn in air
travel demand in 2001.
■ Capacity is exceeded on some trains on
all routes.
■ With the exception of one train from
Chingford, morning peak services are
busiest when arriving at key interchange
points (i.e. Stratford, Seven Sisters,
Tottenham Hale, West Ham and
Limehouse) rather than at the London
terminals.
■ Stansted Airport passengers account for
around a quarter of the passengers on
morning peak Stansted Express services
and around 40 percent of those on the
evening peak trains.
■ Angel Road station does not serve many
passengers. Service provision and access
to the station is poor and local residents
travelling to central London are better
served by other nearby stations.
■ Northumberland Park is also lightly used
for travel to London Liverpool Street but
around 200 passengers a day use Stratford
bound trains that serve the station.
Routes which do not serve London
3.3.20
The rural and inter-regional services have
also been analysed and the data for the most
heavily loaded is summarised in the tables
contained in the Appendix A. Plots showing
the maximum load per train over the day
compared with the number of seats are also
included in the Appendix A. The data in the
appendix also covers the Central Trains
services operating the Stansted – Birmingham
and Liverpool – Norwich services.
From the data presented the following can
be concluded on the rural and inter-regional
services:
■ The rural services are generally well
loaded to/from the regional centres at peak
times with some standing at the busiest
times of the day.
■ Few passengers relative to the amount
of capacity provided use the Ipswich
– Peterborough services. These services
operate two hourly through to London.
■ The Felixstowe branch service is not well
used in the peak.
Table 3.10: Stansted Airport Rail Passenger Counts
Stansted Express Busiest Hour Three Hour Peak
Passengers Load Factor Passengers Load Factor
AM Peak Borders(08:00 – 08:59 Departures)
1,062 21%540 23%
PM Peak Alighters(16:00 – 17:00 Departures)
1,339 27%629 38%
Source: Network Rail counts data from counts conducted on Tuesday 30 January, 2007

41
■ Non-London inter-urban services within
the region are well used over much of
the day. The greatest loads and some
standing occurs on these trains around
the main centres. The busiest corridor
being Cambridge – Ely – Peterborough.
These services are used for travel between
centres and for commuting into them.
3.3.21
The RUS presents an opportunity, in addition
to identifying where passenger demand is
expected to exceed capacity by 2016,
to consider how these routes could be better
utilised to deliver improved services for
passengers and freight customers.
3.3.22
Additional passenger counts were
commissioned on a number of these routes
to achieve a better understanding of usage
(by station and route section) and Passenger
Focus has made available the results of its
recent “Passenger Priorities” research on
relevant routes (discussed below).
3.3.23
The count data is shown in Table 3.11 and
gives the station use in terms of boarders
and alighters by route and service. It should
be noted that the fi gures for Cambridge, Ely
and Peterborough include passengers on the
services travelling beyond these locations.
Table 3.11: Daily Boarders + Alighters on Rural/Inter-regional Services
Service Stansted – Birmingham
London – Kings Lynn
Liverpool – Norwich
Cambridge – Norwich
Liverpool St./Ipswich – Peterborough
Total daily Boarders + Alighters
Section Cambridge – Peterborough
Cambridge – Kings Lynn
Peterborough – Norwich
Cambridge – Norwich
Ely – Peterborough
Station
Cambridge 3,106 7,533 1,378 12,017
Waterbeach 145 555 700
Ely 1,762 2,145 638 750 189 5,493
Manea 23 23
March 625 96 180 901
Whittlesea 22 28 50
Peterborough 2,028 1,020 562 3,610
Littleport 414 414
Downham Mkt 949 949
Watlington 322 322
Kings Lynn 1,713 1,713
Shippea Hill 2 2
Lakenheath 0 0
Brandon 1 91 92
Thetford 274 442 716
Harling Rd 28 28
Eccles Rd 1 18 19
Attleborough 54 428 482
Spooner Row 4 4
Wymondham 40 349 389
Norwich 1,131 1,546 2,677
Source: Network Rail Counts January 2007

42
This table emphasises the importance of the
services between the key regional centres
and particularly the heavy use of the corridor
between Ely and Cambridge. The stopping
patterns for these services are regular
throughout the day, except for calls at the
stations with very low use, where calls are
made only once or twice a day, generally with
one call in the morning and one in the evening.
The Passenger Focus “Passenger Priorities”
surveys carried out on the East Anglia
services (Peterborough – Ipswich, Stansted
– Birmingham, Liverpool – Norwich and
Cambridge – Norwich) showed the following
priorities and gaps (between expectation and
experience). Details for stations and trains are
summarised below:
Priorities:
Stations: Ticketing facilities, security, access
from other modes, availability of
information and cleanliness of
facilities.
Trains: Punctuality, frequency, value
for money and availability of
information.
Gaps:
Stations: Ticketing facilities, security, access
from other modes, cleanliness and
the range of facilities available.
Trains: Value for money, frequency,
punctuality and journey time.
This shows that in addition to the station
facilities and the ambience of the rolling stock,
punctuality, frequency and journey time are
also issues on some routes.
3.3.24
The station and rolling stock issues are largely
addressed through existing programmes, train
operator interventions or through Community
Rail Partnerships (which promote a number
of routes in the region). As has been noted
the majority of services are now hourly on a
regular stopping pattern, but there is scope
to re-assess the frequency on the Ipswich
– Peterborough and East Suffolk Line services.
The commissioning of bi-directional operation
through Ely West Curve also has the potential
to address both performance and journey
time issues, by removing the need for both
passenger and freight trains to reverse at Ely.
3.3.25
The Ipswich – Peterborough and East Suffolk
Line services raise further punctuality and
capacity issues. In the December 2004
timetable both these services were amended
to run through to London. This has produced
a number of benefi ts and disbenefi ts, which
may need to be considered further as the RUS
develops:
■ the through service removes the
interchange time penalty for passengers
travelling beyond Ipswich improving access
and journey time
■ patronage has increased with around a 15
percent increase in income
■ there is a capacity mismatch with trains
generally having too little capacity between
London and Ipswich and too much capacity
north of Ipswich
■ due to the need to match paths either
side of Ipswich, performance is now more
challenging.
Regional services into Cambridge
3.3.26
Services into Cambridge in the morning
peak have seen considerable increases in
passenger numbers over the last few years.
Table 3.12 summarises the current (autumn/
winter 2006/07) levels of demand and impacts
on travel conditions. The table excludes
services arriving from London.
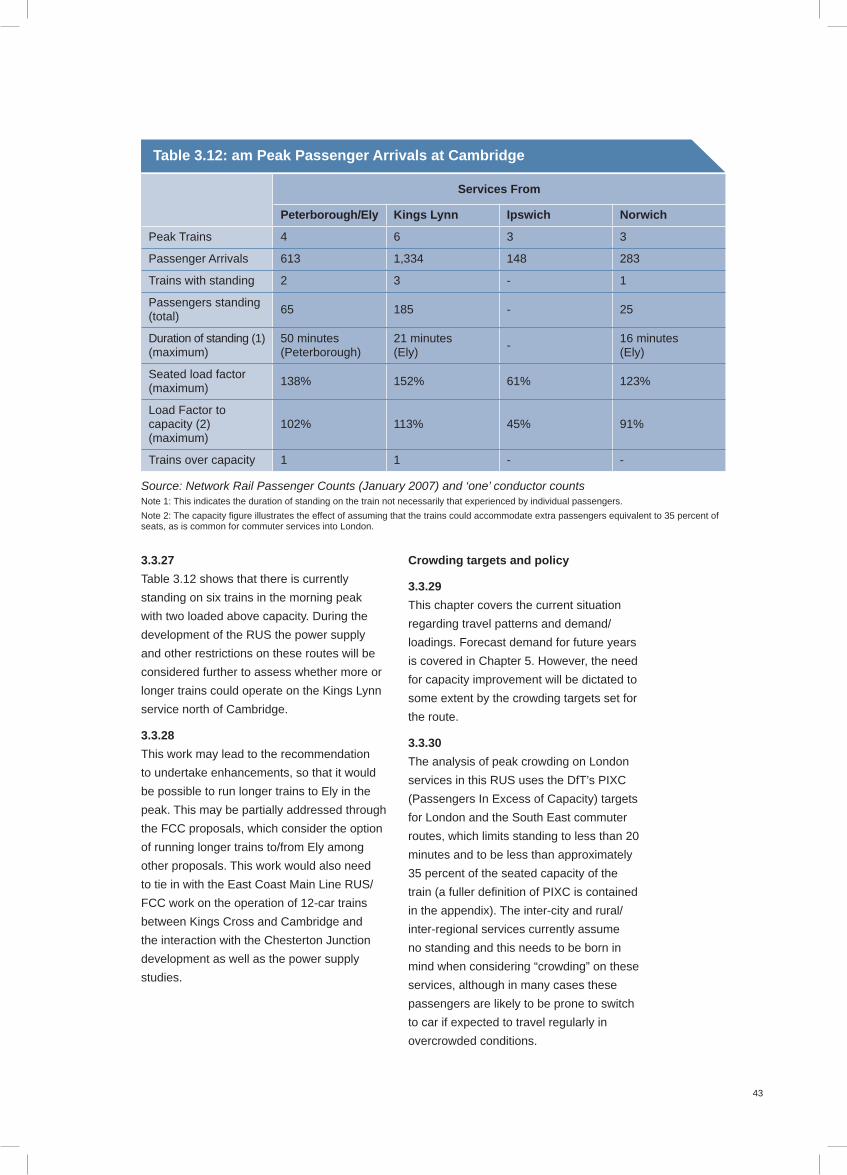
43
3.3.27
Table 3.12 shows that there is currently
standing on six trains in the morning peak
with two loaded above capacity. During the
development of the RUS the power supply
and other restrictions on these routes will be
considered further to assess whether more or
longer trains could operate on the Kings Lynn
service north of Cambridge.
3.3.28
This work may lead to the recommendation
to undertake enhancements, so that it would
be possible to run longer trains to Ely in the
peak. This may be partially addressed through
the FCC proposals, which consider the option
of running longer trains to/from Ely among
other proposals. This work would also need
to tie in with the East Coast Main Line RUS/
FCC work on the operation of 12-car trains
between Kings Cross and Cambridge and
the interaction with the Chesterton Junction
development as well as the power supply
studies.
Crowding targets and policy
3.3.29
This chapter covers the current situation
regarding travel patterns and demand/
loadings. Forecast demand for future years
is covered in Chapter 5. However, the need
for capacity improvement will be dictated to
some extent by the crowding targets set for
the route.
3.3.30
The analysis of peak crowding on London
services in this RUS uses the DfT’s PIXC
(Passengers In Excess of Capacity) targets
for London and the South East commuter
routes, which limits standing to less than 20
minutes and to be less than approximately
35 percent of the seated capacity of the
train (a fuller defi nition of PIXC is contained
in the appendix). The inter-city and rural/
inter-regional services currently assume
no standing and this needs to be born in
mind when considering “crowding” on these
services, although in many cases these
passengers are likely to be prone to switch
to car if expected to travel regularly in
overcrowded conditions.
Table 3.12: am Peak Passenger Arrivals at Cambridge
Services From
Peterborough/Ely Kings Lynn Ipswich Norwich
Peak Trains 4 6 3 3
Passenger Arrivals 613 1,334 148 283
Trains with standing 2 3 - 1
Passengers standing(total)
65 185 - 25
Duration of standing (1)(maximum)
50 minutes(Peterborough)
21 minutes(Ely)
-16 minutes(Ely)
Seated load factor (maximum)
138% 152% 61% 123%
Load Factor to capacity (2)(maximum)
102% 113% 45% 91%
Trains over capacity 1 1 - -
Source: Network Rail Passenger Counts (January 2007) and ‘one’ conductor countsNote 1: This indicates the duration of standing on the train not necessarily that experienced by individual passengers.
Note 2: The capacity fi gure illustrates the effect of assuming that the trains could accommodate extra passengers equivalent to 35 percent of seats, as is common for commuter services into London.

44
3.3.31
Whilst the RUS assumes that these targets
will continue to operate, it needs to be
remembered that if standing on the outer
services were to be removed completely then
the demand for rolling stock and track capacity
would rise, leading to congestion and cost
increases. Similarly if rolling stock on the inner
services were to be reconfi gured, similar to
class 378 rolling stock, for example, which is
on order for use on the North and East London
Lines, then rolling stock requirements and
costs would decrease. Both these issues are
considered in the options section of the RUS.
3.4 Stations
3.4.1
Whilst the above analysis has looked at the
capacity of train services it is also necessary to
consider stations from three perspectives: a)
station capacity, b) station facilities and c) car
parking. These elements are now considered
in turn.
3.4.2
In 2002 the SRA commissioned a study to
identify and prioritise the most congested
stations and to survey these with a view to
assessing potential mitigations. In the Greater
Anglia RUS area the stations surveyed were:
■ Liverpool Street
■ Fenchurch Street
■ Chelmsford
■ Seven Sisters
■ Stratford
■ Barking
■ Cambridge
■ Chafford Hundred
■ Walthamstow Central
Surveys were carried out at these stations
and the issues/mitigations are tabulated in
Appendix C.
Whilst the station facility owner (the train
operators at all these stations except Liverpool
Street and Fenchurch Street) is responsible for
mitigating overcrowding, the table also notes
a number of programmes that are already
looking into the crowding issues.
The demand modelling work is also
considering the issue of interchange with the
LUL services, especially at Stratford, Seven
Sisters, Tottenham Hale and West Ham. At
the latter station increased interchange will
also require station capacity improvements in
addition to improved track capacity.
3.4.3
A station acts as a gateway to the network and
thus its facilities should refl ect its throughput
and importance. The appendix contains a
list of stations and includes station category
together with the facilities at each station in the
RUS area. Whilst the RUS does not consider
the facilities in detail, this list will assist with
the identifi cations of additional facilities that
could be provided in conjunction with station
improvement schemes being undertaken from
time to time by Network Rail, the TOCs and
local authorities/TfL.
3.4.4
By defi nition, getting to the station is a
key element of any rail journey. The ease
with which passengers can get to stations
determines the attractiveness of rail relative
to other modes, and also whether rail can
fulfi l its potential in limiting car-borne journeys
that cause congestion and contribute to
carbon emissions. Prompted by poor National
Passenger Survey ratings for “facilities for
parking”, Passenger Focus commissioned a
report to look at access to the station issues,
including car parking availability, in the RUS
area. The report also looked in detail at how
passengers access the railway at four case
study stations (Harlow Town, Grays, Witham
and Royston) and the extent to which demand
for rail is being suppressed because of the
shortage of parking spaces at stations.
Table 3.13 gives a summary by train operator
of the number of car parks in the survey with
high utilisation.

45
Table 3.13 Car Park Utilisation Details
Train Operator
Less than 70%
70–80% 80-90% Over 90% No data (No car park or free)
‘one’ 18 12 12 13 23
FCC 4 0 0 4 3
c2c 7 7 1 1 1
Source: Passenger Focus survey 2006
This shows that of the 79 stations surveyed nearly half had over 70 percent car park utilisation. In terms of the
locations experiencing high utilisation (greater than 80 percent utilisation) Table 3.14 contains a breakdown of
the data for the stations surveyed.
Table 3.14 Car Park Utilisation Details
Operator Station Number of spaces
Utilisation at end of am peak
Non-railway car park within 1000 yards?
‘one’ Cambridge 458 100% Yes
Ipswich 448 100% Yes
Norwich 370 100% Yes
Ely 180 100% Yes
Great Yarmouth 25 100% Yes
Bury St Edmunds 26 96% No
Witham 430 93% Yes
Manningtree 481 91% No
Broxbourne 480 91% No
Harlow Town 365 91% Limited
Marks Tey 197 91% No
Clacton 26 91% Yes
Cheshunt 185 89% No
Gidea Park 78 89% Limited
Wivenhoe 75 89% No
Colchester 1493 87% Yes
Bishops Stortford 570 87% Yes
Kelvedon 285 87% No
Diss 168 87% No
Audley End 506 86% No
Stowmarket 300 86% No
Harold Wood 160 86% No
Billericay 383 82% Limited
Hatfi eld Peverel 201 81% No
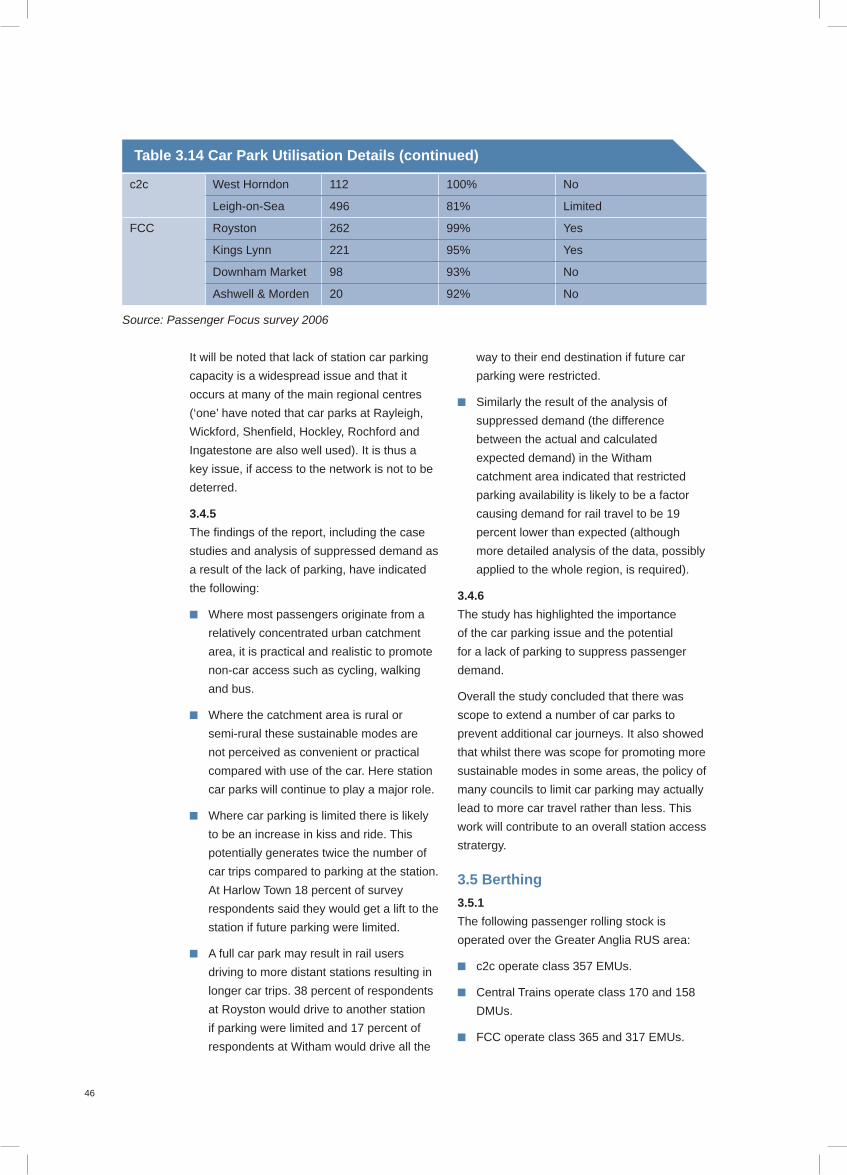
46
It will be noted that lack of station car parking
capacity is a widespread issue and that it
occurs at many of the main regional centres
(‘one’ have noted that car parks at Rayleigh,
Wickford, Shenfi eld, Hockley, Rochford and
Ingatestone are also well used). It is thus a
key issue, if access to the network is not to be
deterred.
3.4.5
The fi ndings of the report, including the case
studies and analysis of suppressed demand as
a result of the lack of parking, have indicated
the following:
■ Where most passengers originate from a
relatively concentrated urban catchment
area, it is practical and realistic to promote
non-car access such as cycling, walking
and bus.
■ Where the catchment area is rural or
semi-rural these sustainable modes are
not perceived as convenient or practical
compared with use of the car. Here station
car parks will continue to play a major role.
■ Where car parking is limited there is likely
to be an increase in kiss and ride. This
potentially generates twice the number of
car trips compared to parking at the station.
At Harlow Town 18 percent of survey
respondents said they would get a lift to the
station if future parking were limited.
■ A full car park may result in rail users
driving to more distant stations resulting in
longer car trips. 38 percent of respondents
at Royston would drive to another station
if parking were limited and 17 percent of
respondents at Witham would drive all the
way to their end destination if future car
parking were restricted.
■ Similarly the result of the analysis of
suppressed demand (the difference
between the actual and calculated
expected demand) in the Witham
catchment area indicated that restricted
parking availability is likely to be a factor
causing demand for rail travel to be 19
percent lower than expected (although
more detailed analysis of the data, possibly
applied to the whole region, is required).
3.4.6
The study has highlighted the importance
of the car parking issue and the potential
for a lack of parking to suppress passenger
demand.
Overall the study concluded that there was
scope to extend a number of car parks to
prevent additional car journeys. It also showed
that whilst there was scope for promoting more
sustainable modes in some areas, the policy of
many councils to limit car parking may actually
lead to more car travel rather than less. This
work will contribute to an overall station access
stratergy.
3.5 Berthing
3.5.1
The following passenger rolling stock is
operated over the Greater Anglia RUS area:
■ c2c operate class 357 EMUs.
■ Central Trains operate class 170 and 158
DMUs.
■ FCC operate class 365 and 317 EMUs.
c2c West Horndon 112 100% No
Leigh-on-Sea 496 81% Limited
FCC Royston 262 99% Yes
Kings Lynn 221 95% Yes
Downham Market 98 93% No
Ashwell & Morden 20 92% No
Source: Passenger Focus survey 2006
Table 3.14 Car Park Utilisation Details (continued)
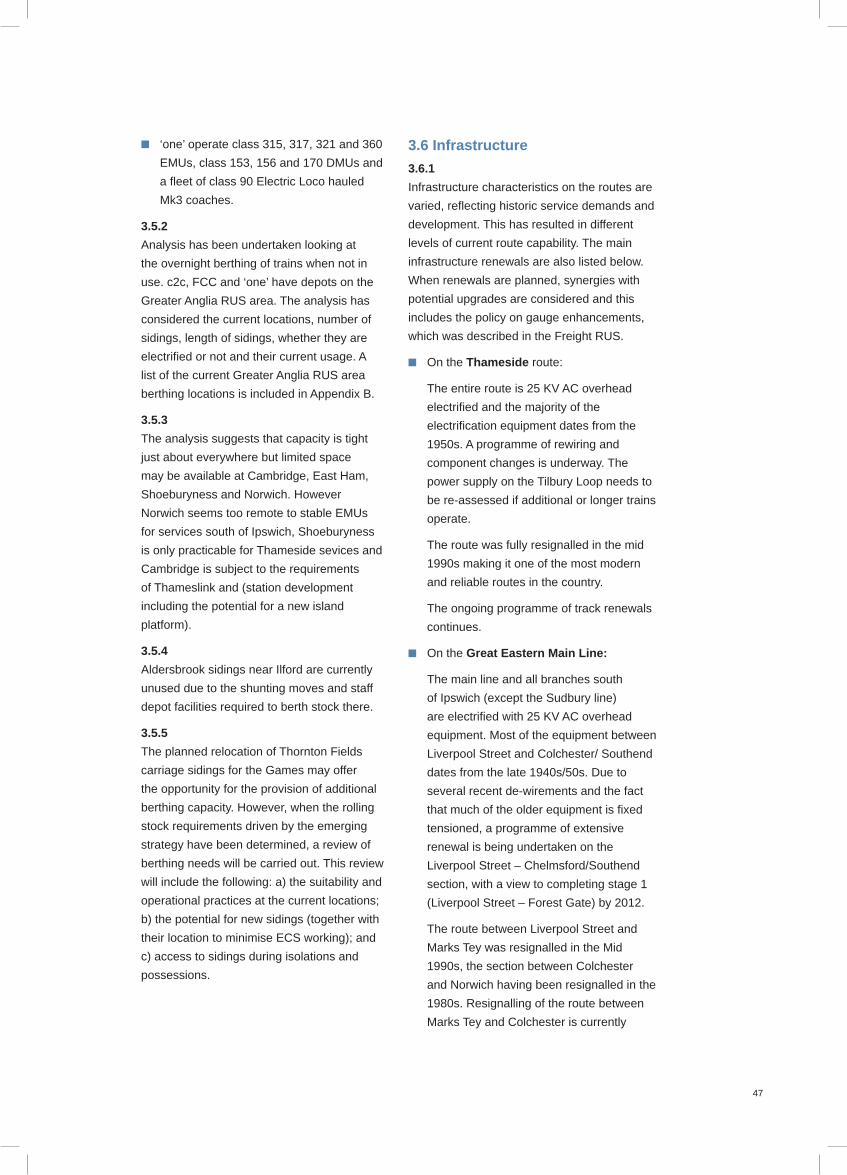
47
■ ‘one’ operate class 315, 317, 321 and 360
EMUs, class 153, 156 and 170 DMUs and
a fl eet of class 90 Electric Loco hauled
Mk3 coaches.
3.5.2
Analysis has been undertaken looking at
the overnight berthing of trains when not in
use. c2c, FCC and ‘one’ have depots on the
Greater Anglia RUS area. The analysis has
considered the current locations, number of
sidings, length of sidings, whether they are
electrifi ed or not and their current usage. A
list of the current Greater Anglia RUS area
berthing locations is included in Appendix B.
3.5.3
The analysis suggests that capacity is tight
just about everywhere but limited space
may be available at Cambridge, East Ham,
Shoeburyness and Norwich. However
Norwich seems too remote to stable EMUs
for services south of Ipswich, Shoeburyness
is only practicable for Thameside sevices and
Cambridge is subject to the requirements
of Thameslink and (station development
including the potential for a new island
platform).
3.5.4
Aldersbrook sidings near Ilford are currently
unused due to the shunting moves and staff
depot facilities required to berth stock there.
3.5.5
The planned relocation of Thornton Fields
carriage sidings for the Games may offer
the opportunity for the provision of additional
berthing capacity. However, when the rolling
stock requirements driven by the emerging
strategy have been determined, a review of
berthing needs will be carried out. This review
will include the following: a) the suitability and
operational practices at the current locations;
b) the potential for new sidings (together with
their location to minimise ECS working); and
c) access to sidings during isolations and
possessions.
3.6 Infrastructure
3.6.1
Infrastructure characteristics on the routes are
varied, refl ecting historic service demands and
development. This has resulted in different
levels of current route capability. The main
infrastructure renewals are also listed below.
When renewals are planned, synergies with
potential upgrades are considered and this
includes the policy on gauge enhancements,
which was described in the Freight RUS.
■ On the Thameside route:
The entire route is 25 KV AC overhead
electrifi ed and the majority of the
electrifi cation equipment dates from the
1950s. A programme of rewiring and
component changes is underway. The
power supply on the Tilbury Loop needs to
be re-assessed if additional or longer trains
operate.
The route was fully resignalled in the mid
1990s making it one of the most modern
and reliable routes in the country.
The ongoing programme of track renewals
continues.
■ On the Great Eastern Main Line:
The main line and all branches south
of Ipswich (except the Sudbury line)
are electrifi ed with 25 KV AC overhead
equipment. Most of the equipment between
Liverpool Street and Colchester/ Southend
dates from the late 1940s/50s. Due to
several recent de-wirements and the fact
that much of the older equipment is fi xed
tensioned, a programme of extensive
renewal is being undertaken on the
Liverpool Street – Chelmsford/Southend
section, with a view to completing stage 1
(Liverpool Street – Forest Gate) by 2012.
The route between Liverpool Street and
Marks Tey was resignalled in the Mid
1990s, the section between Colchester
and Norwich having been resignalled in the
1980s. Resignalling of the route between
Marks Tey and Colchester is currently

48
being carried out, including the branch to
Clacton, under the Colchester – Clacton
resignalling scheme. This scheme includes
installation of bi-directional signalling
between Colchester and Marks Tey. On
the rural branches there is a programme of
rewiring and life extensions to the existing
signalling, although more extensive work
will be required on the East Suffolk Line to
replace the RETB system.
Due to the age and condition of the track,
especially the number of wet spots on
the main line, caused by the clay sub-
strata, track renewals are concentrated on
the GEML. There is also a considerable
number of S&C renewals coming up
over the next few years, including works
at Shenfi eld, Clacton and Colchester.
Renewals are also continuing on the rural
and cross country routes.
■ On the West Anglia Main Line:
The main line and southern branches are
electrifi ed with 25KV AC overhead. The
oldest section of OHLE equipment (dating
from the 1960s) is between Liverpool
Street and Bishops Stortford (via Seven
Sisters), with the remainder dating from
the 1980s. The policy of component
changes will continue along with routine
maintenance but no major work is planned.
The power supply limitations between
Cambridge and Kings Lynn currently
restrict services north of Cambridge.
The route between Bethnal Green and
Elsenham was recently resignalled under
the West Anglia Route Modernisation
(WARM) project. The remainder of the
route is a mixture of relatively modern
power signalling and older mechanical and
electro mechanical equipment. Signalling
renewals are currently being undertaken in
the March area, as well as a programme
of life extension works on the remainder
of the route (pending resignalling in
2015/20). The resignalling at March is
planned to remove a level crossing issue
which currently delays some inter-regional
services.
Although the condition of the track
is generally good, the programme of
renewals and life extension work continues
to ensure that track quality does not
deteriorate. It is anticipated that as freight
traffi c grows on the Felixstowe – Nuneaton
route, the programme of track maintenance
and renewals will also need to increase.
3.6.2
For a more detailed description, Network Rail’s
Route Plans should be consulted. These are
available at www.networkrail.co.uk and form
part of the annual Business Plan.
3.7 Current network capacity and utilisation
Capacity analysis
3.7.1
In recent years Network Rail has developed
a measure of the level of congestion on the
network, known as the Capacity Utilisation
Index (CUI). The CUI is a measure of how
much of the available capacity on a section of
line is used by the train service taking account
of route characteristics, timetable, the order
of trains in the timetable and the headways.
The CUI map for the morning peak is included
in Figure 3.10 and more detailed capacity
analysis is included below.
3.7.2
The West Anglia Route carries a mixture of
traffi c types with signifi cant variations in speed,
acceleration and stopping pattern. There
are serious issues with capacity on the West
Anglia route because of this mix of services
and stopping patterns. The suburban lines into
Liverpool Street are heavily used in the peak
and there is little capacity to run additional
trains. The two track section on the Lea Valley
and the mix of services causes a performance
risk throughout much of the day.
The map also shows high utilisation on
single lines, this is partially a function of the
constricted geometry and partially the fact

49
NORWICH
STANSTED AIRPORT
LONDON FENCHURCH STREET
SheringhamCromer
Lowestoft
Great Yarmouth
Sizewell
Felixstowe
COLCHESTER
Harwich Town
Manningtree
Stratford
Chingford
Enfield Town
Clacton
Southend Victoria
Southminster
Walton-on-Naze
Sudbury
Braintree
Chelmsford
Shenfield
LONDONLIVERPOOL STREET
ShoeburynessSouthend Central
Upminister
Romford
Grays
IPSWICH
Colchester Town
Hertford East
Bury St Edmunds
Barking Pitsea
Witham
MarksTey
Cheshunt
Broxbourne
Harlow Town
BISHOPS STORTFORD
Walthamstow Central
Seven Sisters
TottenhamHale
DissThetford
KINGS LYNN
PeterboroughCresent Jn
March
ELY
CAMBRIDGE
Letchworth
Key
90% or more
70 - 90%
30 - 70%
< 30%
Figure 3.10: Peak Capacity Utilisation Index Map

50
that lines such as the Stansted Airport and
Felixstowe (on the Great Eastern) branches
are at or approaching capacity due to their
heavy use.
3.7.3
On the Thameside route the service structure
is infl uenced by the complexity of the network
and different stopping patterns. The limited
signal capacity at West Ham does not allow
additional trains to call without reducing
capacity between Fenchurch Street and
Barking. The single line track section between
Upminster and Grays via Ockendon has only
one passing loop which causes a capacity
constraint on this section. In addition peak
capacity is heavily used between Barking and
Upminster where the signalling headways
increase from two minutes to three.
3.7.4
The capacity analysis for the RUS in respect
of the GEML was undertaken by DfT and the
capacity analysis diagrams can be found in
Appendix F.
The DfT analysis shows that:
■ The GEML is almost at full capacity
in the peaks and is about 75 percent
utilised in the off-peak. The most heavily
utilised section is between Shenfi eld and
Colchester which reaches 90 percent in the
peaks and 55-65 percent off peak.
■ The difference between the route section
usage and Rules of the Plan usage shows
that the timetable pattern and difference
in speed of trains is utilising, at some
points, nearly 20 percent of the capacity.
This utilisation could be reduced by
standardising speeds and calling patterns
of services.
■ The analysis of the timetable shows that
the evening peak timetable is very well
constructed to utilise capacity with the mix
of calling patterns in different services. This
forms a more robust timetable than the
morning peak which shows greater route
section usage.
■ East of Colchester the capacity used is
much lower, typically between 10 and 30
percent. This analysis revealed that the
current Rules of the Plan values between
Ipswich and Norwich needed to be revised.
This value has been reviewed by the Train
Planning Centre (TPC) and amended in the
2008 version of Rules of the Plan.
■ The amending of calling patterns on the
GEML is very diffi cult as the peak services
are driven by demand at different stations.
In the RUS options, the timetable pattern
has been amended where necessary to
allow for more capacity to be realised.
Where stops have been removed from
services, a different service has been
called at the stop to ensure there is still
the same level of service available at the
station.
■ Standardising the speed of services can
realise further capacity but caution should
be taken as this will require slowing down
non-stop services, resulting in longer
journey times for passengers.
RailSys performance modelling
3.7.5
RailSys will be used in the RUS to assess
the performance impact of different timetable
and infrastructure options. The base RailSys
model can be examined to identify any issues
with the current infrastructure and timetable.
RailSys has been used to model a ‘normal’
weekday on the network, with all extreme
events (such as extreme weather or suicides)
excluded from the delay data.
3.7.6
The following results show the Principal 2006
Timetable on the current infrastructure. As
there is no option to compare this data to, this
just gives an indication of lateness of trains
within the model.

51
Unperturbed Model
3.7.7
The diagram below shows that if the Principal
2006 Timetable ran unperturbed then greater
than 90 percent of trains would arrive within
scheduled time. This shows that correct
planning rules have generally been used in
constructing the timetable however, it did
reveal some differences between sectional
running times (SRTs) and the point to point
times calculated in RailSys, at the following
locations:
■ Southbury Loop
■ Hertford East branch
■ Peterborough East Junction
■ Ely – Thetford
3.7.8
The SRT’s have been reviewed on the
Hertford East Branch and new SRTs will be
available in future timetables. The TPC is
currently reviewing the SRTs at Peterborough
East and Ely – Thetford. The details from
RailSys on point to point timings on the
Southbury Loop will be taken forward in the
Resilient Timetable work.
3.7.9
There are also Rules of the Plan non-
compliances within the existing timetable at
Tottenham Hale and Bethnal Green. The TPC
is working to resolve these issues in future
timetables but there are no plans to change
the planning rules at these locations.
Key
Limit for punctuality: 03:00 min
(<75.00%)
(<90.00%)
(>90.00%)
Punctuality at arrival – Time to 3 minutes
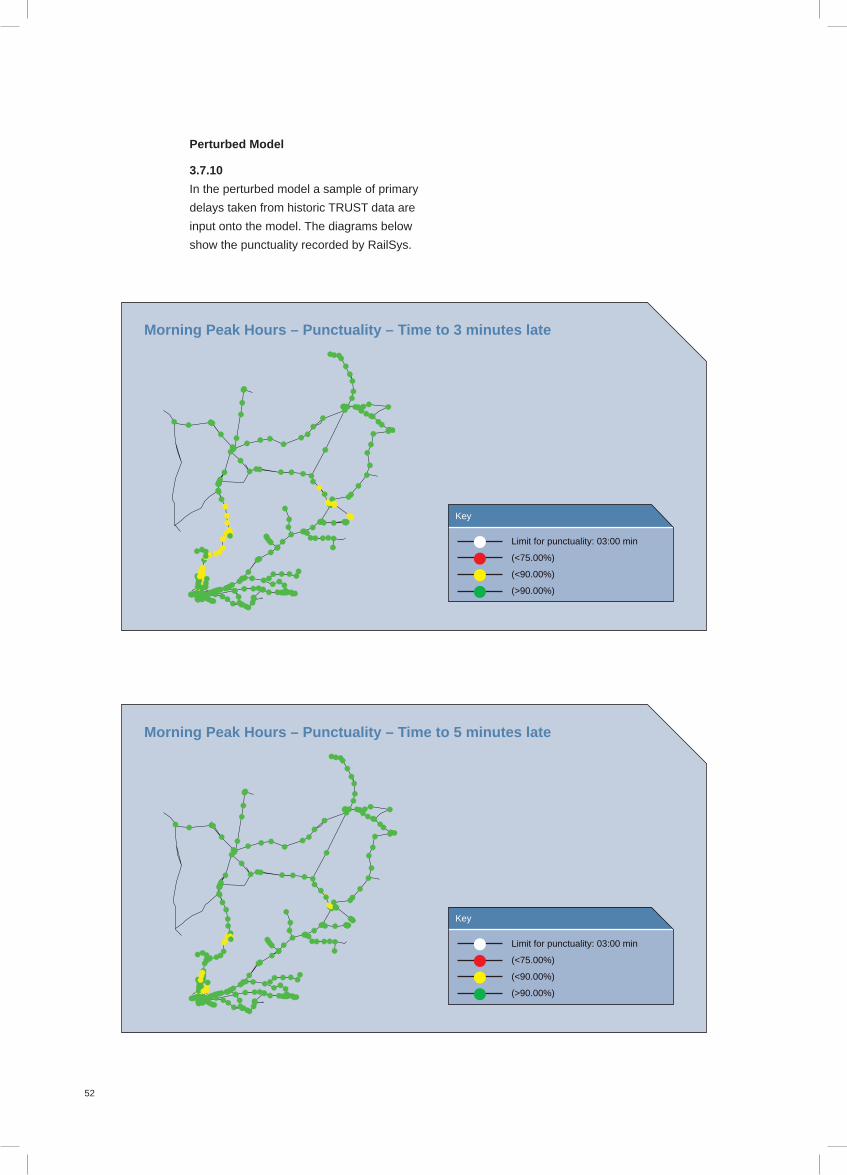
52
Perturbed Model
3.7.10
In the perturbed model a sample of primary
delays taken from historic TRUST data are
input onto the model. The diagrams below
show the punctuality recorded by RailSys.
Key
Limit for punctuality: 03:00 min
(<75.00%)
(<90.00%)
(>90.00%)
Morning Peak Hours – Punctuality – Time to 3 minutes late
Key
Limit for punctuality: 03:00 min
(<75.00%)
(<90.00%)
(>90.00%)
Morning Peak Hours – Punctuality – Time to 5 minutes late

53
The diagrams above show that in the morning
peak it is the West Anglia Route which shows
most lateness on arrival at stations. This is
due to the high capacity utilisation of this
route, which results in many services being
planned to minimum headways. Stratford also
shows less than 85 percent of trains arriving
within 10 minutes of scheduled time, although
the scale of the diagram makes this very
diffi cult to identify. Again the number of trains
using the GEML mean that under perturbation
reactionary delays can quickly become a
problem during peak hours.
Key
Limit for punctuality: 03:00 min
(<75.00%)
(<90.00%)
(>90.00%)
Off Peak Hours – Punctuality – Time to 3 minutes late
Key
Limit for punctuality: 03:00 min
(<75.00%)
(<90.00%)
(>90.00%)
Morning Peak Hours – Punctuality – Time to 10 minutes late
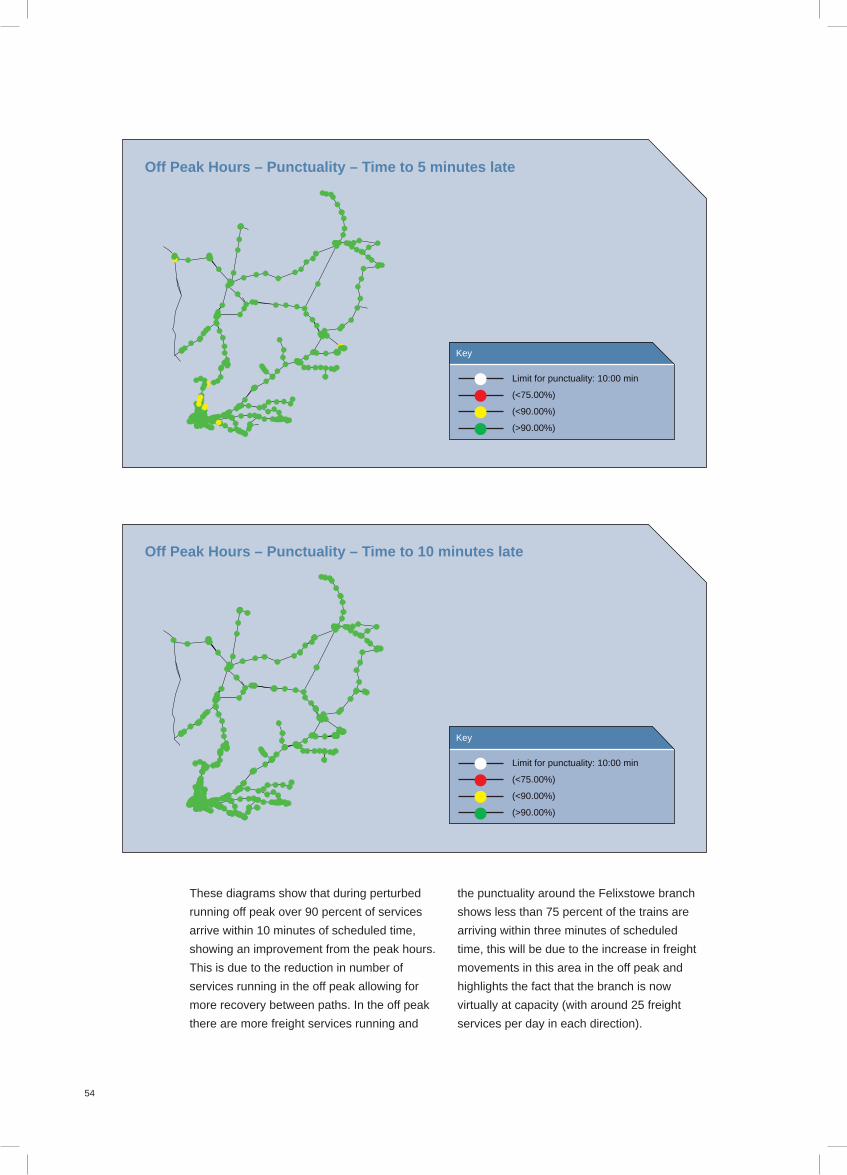
54
These diagrams show that during perturbed
running off peak over 90 percent of services
arrive within 10 minutes of scheduled time,
showing an improvement from the peak hours.
This is due to the reduction in number of
services running in the off peak allowing for
more recovery between paths. In the off peak
there are more freight services running and
the punctuality around the Felixstowe branch
shows less than 75 percent of the trains are
arriving within three minutes of scheduled
time, this will be due to the increase in freight
movements in this area in the off peak and
highlights the fact that the branch is now
virtually at capacity (with around 25 freight
services per day in each direction).
Key
Limit for punctuality: 10:00 min
(<75.00%)
(<90.00%)
(>90.00%)
Off Peak Hours – Punctuality – Time to 10 minutes late
Key
Limit for punctuality: 10:00 min
(<75.00%)
(<90.00%)
(>90.00%)
Off Peak Hours – Punctuality – Time to 5 minutes late

55
3.8 Performance
3.8.1
A number of generic factors contribute to
overall train service performance. These
include the extent of infrastructure and rolling
stock failure and, as the previous section
has emphasised, these factors also include
the ability of train operations to work within
timetable allowances and the structure of the
timetable given infrastructure and rolling stock
capability.
3.8.2
One measure of passenger train performance
is the Public Performance Measure (PPM),
which was introduced by the SRA and
continues under the DfT and ORR. The PPM
combines fi gures for punctuality and reliability
into a single performance measure and
covers all scheduled services, seven days a
week. The PPM measures the performance
of individual trains against their planned
timetable. The PPM is therefore the number
of trains arriving ‘on time’ as a percentage
of the total number of trains planned. For
London and South East operators (including
‘one’), a train is defi ned as ‘on time’ if it arrives
within fi ve minutes of the planned destination
arrival time shown in the public timetable,
the Norwich inter-city services is measured
against a ‘within 10 minute’ target.
3.8.3
The PPM for the train operators as a whole
in the 2nd Quarter of 2006/07 were c2c 94.5
percent, Central Trains 82.8 percent, First
Capital Connect 88.7 percent, ‘one’ (non inter
city) 87.8 percent, ‘one’ (inter city) 81.1 percent
and Silverlink 90.5 percent as published by the
ORR. These compare reasonably well with the
same quarter in the previous year, which were
c2c 94.1 percent, Central Trains 79.1 percent,
WAGN5 89.4 percent, ‘one’ Railway (non
inter city) 87.9 percent, ‘one’ (inter city) 81.8
percent and Silverlink 88.3 percent.
3.8.4
One factor which assists with freight
performance is the two class 4 freight paths
that have been built into each standard hour
on the GEML passenger timetable from
Ipswich to Stratford and onto the North London
Line. Since not all of these paths are currently
used every hour, this means that a train
running out of course can drop into an earlier
or later slot with a proven pathway.
3.8.5
Other specifi c freight delay issues are:
■ GEML – trains late to/from Thameside
cause delay between Stratford and Forest
Gate, where the have to cross all four
lines on the fl at between Forest Gate and
Stratford.
■ Automatic Route Setting (ARS) in Liverpool
Street IECC (Integrated Electronic Control
Centre) can occassionally cause delays
depending on which train it ‘sees’ fi rst. In
some cases it can cause trains to miss
their paths across junctions causing
delays.
■ In the Down direction trains can be held
at Stratford but bunching of freights off the
North London Line means that trains can
be held on Channelsea Curve and block
the NLL leading to delays.
Analysis of recent performance
3.8.6
Performance for 2005/06 has been analysed
over the Greater Anglia RUS routes.
5 FCC replaced the former GN routes of WAGN during refranchising.

56
3.8.7
The highest levels of delay are occurring at the
following key route sections:
■ Liverpool Street – Shenfi eld
■ Colchester – Norwich
■ Tilbury Loop
■ Liverpool Street - Broxbourne
■ Broxbourne - Cambridge
3.8.8
Analysis of the main delays has shown that
the primary causes of delay on these route
sections are due to infrastructure faults, train
regulation and train crew/rolling stock issues.
Details of the delay analysis are contained in
Appendix D.
3.8.9
Whilst generally the highest number of delay
minutes occur where train services are
the busiest, the average total (primary and
secondary) delay minutes per incident varies
across the RUS area. The effects are shown
in Tables 3.15 – 3.17, which indicates that
on the Great Eastern the highest average
delay per incident occurs not only where the
busiest passenger train services are but also
on the main freight route out of Felixstowe.
On Thameside the highest average delay per
incident occurs on the Tilbury Loop where the
freight services run and on West Anglia the
highest average delay per incident occurs
where the busiest main line passenger and
cross country passenger and freight services
operate. This confi rms the fi ndings of the
RailSys analysis described earlier.
Table 3.15
Great Eastern route section Average Delay per Incident (minutes)
Westerfi eld Jn – Felixstowe 48
Liverpool Street – Shenfi eld 45
Shenfi eld – Colchester 42
Colchester – Norwich 39
Table 3.16
Thameside route section Average Delay per Incident (minutes)
Tilbury Loop 31
Fenchurch Street – Shoeburyness 20
Ockendon Branch 19
Table 3.17
West Anglia route section Average Delay per Incident (minutes)
Liverpool Street – Broxbourne 34
Broxbourne – Cambridge 32
Haughley Jn – Cambridge/Ely 32
Cambridge – Kings Lynn 30

57
3.8.10
More detailed analysis has been undertaken
covering the main sources of delay in 2005/06
on each line and results are given in Tables
3.18 to 3.20.
Table 3.18
Great Eastern
Total delay minutes 1,169,862
Split (Network Rail/TOC/FOC) 53:47
Cause Issue Mitigations
Fleet failures Unit failures Monitored through Joint
Performance Improvement Plan
Track faults Broken rails and track geometry Action plans being implemented for
each maintenance depot
Commercial issues Train regulation, timetabling,
possession overruns.
Looking at TSRs, timetable
margins, dwell times and
possession planning (including the
scheduling of diverted services)
Freight terminal operations Late starts Performance effects of late running
freight services are currently being
analysed by Network Rail’s Six
Sigma team
Track circuit failures Mainly between Liverpool Street
and Shenfi eld
Action plans being implemented for
each maintenance depot
OHLE failures Dewirements and speed
restrictions between Liverpool
Street and Southend/Chelmsford
Rewiring programme being
prepared
Table 3.19
Thameside
Total delay minutes 194,426
Split (Network Rail/TOC/FOC) 32:68
Cause Issue Mitigations
Freight terminal operations Late starts and waiting acceptance Performance effects of late running
freight services are currently being
analysed by Network Rail’s Six
Sigma team
Fleet failures Mainly EMU traction problems Monitoring traction maintenance
OHLE faults Dewirements. Programme of OHLE rewiring
being undertaken
Train crew issues Awaiting train crew Revised instructions now in place
covering crew relief

58
Network Rail are also working with ‘one’ on
their ‘Challenge 90’ programme, which seeks
to bring their PPM above 90 percent. This
initiative includes a range of operational and
infrastructure improvements.
3.8.11
Analysis of secondary delay for 2005/06 also
shows that the highest number of minutes
per train delayed occur over lines where train
services run that start their journey outside of
the RUS area. These include the freight routes
to Felixstowe, both down the GEML and
cross country, as well as the Central Trains
services on the route from Peterborough to
Norwich via Ely. This again emphasises the
impact of mixing services, which operate
on and off route, and shows how services
travelling between routes can “transmit” delay.
In addition freight trains must unload/load
their cargo at the terminal. The terminal time
is fi xed and cannot be reduced. This means a
late arrival at a terminal will generally lead to a
late departure. Therefore delays to an inward
train will knock onto a return train, doubling the
delay. Details of the secondary delay analysis
are contained in Appendix D.
3.8.12
Discussions with stakeholders have
highlighted several opportunities for generating
performance improvements. These include:
■ Constructing a freight loop extending
from Platform 10a at Stratford towards
Maryland.
■ Greater use of the Willesden – Gospel Oak
– Barking line to enable trains to avoid
having to cross all four tracks on the GEML
between Stratford and Forest Gate. This
includes upgrading the gauge, capacity
and capability of the route, as well as
possible electrifi cation of the Gospel Oak
– Barking section.
■ Partial doubling of the Felixstowe branch.
■ Converting Haughley Junction to a double
junction from a single lead.
■ Removing the long signal blocks between
Kennett and Bury St Edmunds.
■ Removing speed restrictions on class
6 freight services on the Ipswich –
Peterborough route.
■ Review of Sectional Running Times
(SRTs).
Table 3.20
West Anglia
Total delay minutes 469,952
Split (Network Rail/TOC/FOC) 49:51
Cause Issue Mitigations
Fleet failures Unit problems Monitored through Joint
Performance Improvement Plan
Train crew issues Awaiting train crew Revised instructions now in place
covering crew relief
Freight terminal operations Late starts and waiting for shunters
or staff to operate ground frame
signals
Performance effects of late running
freight services are currently being
analysed by Network Rail’s Six
Sigma team
Track circuit failures Mainly between Bethnal Green and
Cambridge
Action plans being implemented for
each maintenance depot

59
■ The construction of dynamic loops in
connection with the proposed new station
north of Chelmsford.
■ Replacement of the level crossings in the
Lea Valley with bridges/underpasses.
■ Continuing with the development of
performance improvement schemes
using the NRDF, including the removal
of the restrictions on Ely West Curve
and linespeed improvements between
Upminster and Barking.
3.8.13
These various issues have been taken
account of in the options developed in later
chapters.
3.9 Engineering Access - current situation
3.9.1
Currently there are the following types of
possession for engineering access on the
Greater Anglia routes: normal possessions
taken overnight during “white periods” when no
trains are booked to run; cyclic possessions,
which are taken for maintenance on a route
section generally on a 12–13 week cycle; and
abnormal possessions, which are generally
taken as required over a weekend in order to
carry out renewal and enhancement works.
Both the cyclic and the abnormal possessions
require the train service to be diverted (in the
case of freight and some passenger services)
or a bus service substituted. Freight also
needs diversionary routes with adequate
capability. This includes gauge, train length
and weight. The current access situation
around the various route sections is briefl y
described below.
Liverpool Street – Shenfi eld
The route is maintained by taking two
track possessions on a Sunday, although
major maintenance items, renewals and
enhancements require more intrusive
possessions.
Shenfi eld – Ipswich
Maintenance is currently carried out using
overnight single line working and a limited
number of 15-hour Saturday night/Sunday
possessions. Bi-directional signalling is being
installed between Marks Tey and Colchester to
improve maintenance opportunities, however,
in the longer term, fully diversionary capability
is required.
Shenfi eld – Southend/Southminster
This route is maintained using cyclic
possessions and longer weekends. The
Southend area is also served by c2c trains
on the Thameside route, which allows some
of the traffi c to continue to use rail and the
presence of bi–directional signalling has the
potential to reduce the impact of overnight
possessions.
Ipswich – Felixstowe
The Felixstowe branch can only be maintained
on Saturday nights and Sundays when the
freight service is not running. The partial
doubling of the branch under the HPUK
proposals should help with this issue.
Harwich Branch
The Harwich branch does not currently
suffer from the restrictions that apply to the
Felixstowe branch but this may change as
freight demand rises when the Bathside Bay
development comes on stream.
Ipswich – Norwich
The route north of Ipswich does not normally
present access problems as suitable cyclic
patterns are available due to the lower levels
of demand. This may change as the level
of freight traffi c grows between Ipswich
and Haughley Jn. During longer periods of
disruptions limited passenger services can
run from Norwich to Liverpool Street via
Cambridge.
Other Great Eastern branches
The rural branches off the GEML do not
normally present access problems due the
lower levels of demand on these routes.
Ipswich – Ely – Peterborough
This two track section is currently maintained
using single line working overnight with
occasional longer blocks at weekends. As

60
the level of freight traffi c rises the lack of bi-
directional signalling and the delays to freight
services operating around the single line
working mean that this is not a longer term
solution to access problems.
Liverpool Street – Cheshunt and branches
The section of route between Bethnal Green
and Cheshunt can operate as two separate
railways, so that cyclic access is not a
signifi cant issue, although publicity needs to
pre-warn passengers interchanging off the
Underground at Tottenham Hale or Seven
Sisters, as to which line is blocked. The need
to keep the traction power live to Chingford
depot for as long as possible (so that units
can be prepared for service) can also restrict
possession times.
Cheshunt – Stansted Airport
This two track section is currently maintained
by possession of both tracks, generally
overnight or on Sunday mornings. There is no
realistic diversionary route for the Stansted
traffi c when the route is closed and under the
Effi cient Engineering Access review further
work is being undertaken, in conjunction
with the train operator, to look at ways of
reducing the overnight access, especially
when the traffi c is highest between Thursdays
and Sundays. Work undertaken to date
has identifi ed good opportunities to reduce
engineering access. Work is continuing on
ways of setting up maintenance and renewal
activities, so that such benefi ts might be
achieved.
Stansted – Kings Lynn
This route section is generally maintained
in two line possessions overnight and at
weekends. The Cambridge – Kings Cross
route provides some diversions for passengers
travelling between the Cambridge area and
London. The layout of the station at Cambridge
does create problems when the platforms
need to be blocked leading to considerable
busing. Further problems may arise as the
increase in cross country freight will reduce
access in the Ely area.
Liverpool Street station
The six-track approach to Liverpool Street
station is maintained by using two-track
possessions on Sundays tied in with the
possessions further out. The main problem
arises with the need to outberth stock from
the platforms, which can lead to diffi culties in
gaining possession of the line punctually.
Fenchurch Street – Barking
This two-track section is maintained using
overnight and Sunday possessions. Services
can be diverted into Liverpool Street during
such possessions.
Barking – Pitsea via Basildon
This section is maintained by two track
possessions overnight or on Sunday. Services
from the Southend direction can be diverted
via Grays and passengers from Upminster
can route via the adjacent District Line.
This section is equipped with bi-directional
signalling but it is not used during engineering
work.
Barking/Upminster to Pitsea via Grays
Again this section is maintained using two
track possessions mainly on Saturday nights
and Sundays. The growth of Shell Haven is
likely to lead to greater use of Sundays for
maintenance, although services to Barking
can generally be diverted by Ockendon or
Rainham. If single line working were used via
Rainham then there may be scope to reduce
busing at weekends.
Pitsea – Shoeburyness
This section of line is maintained using
overnight/weekend possessions, the main
problem being the need to bus passengers
or route them via the Great Eastern route to
Liverpool Street. An additional issue is the
restrictions on possessions due to the need
to keep Shoeburyness depot live for as long
as possible, to allow units to be prepared for
service.
3.9.2
The above section has described the current
access arrangements and some of the existing
restrictions. Whilst the arrangements are

61
largely satisfactory there are a number of
areas where improvement are or soon will be
required, either to meet the requirements of
the operators or those of the engineers. These
issues are discussed briefl y below:
■ Whilst there are generally diversionary
arrangements for many of the services
or traffi c overnight/at weekends is lighter,
analysis of the loadings on the Great
Eastern has shown that Saturday traffi c is
around 40 percent of weekday loadings
and Sunday around 20 percent (although
Saturday midday travel to London is
similar to weekday off peak loadings). In
addition on the inner suburban services
TfL are keen to extend operating hours.
Thus access needs to be used as
effi ciently as possible maximising the use
of diversionary routes and minimising
the impact of possessions on two-track
sections of line.
■ As demand for travel to and from Stansted
increases, Network Rail and the operator
are seeking ways of limiting access to the
less busy nights of the week and leaving
the weekends free of possessions where
possible.
■ The need to prepare units for service
means that the option of providing
alternative power feeds to the various
depots, especially Chingford and
Shoeburyness, is being considered
for potential funding under the NRDF,
however, the high indicative costs means
that this may not happen in the short term.
■ The growth in freight from Felixstowe
and Harwich will lead to increasing
maintenance diffi culties. Building on work
undertaken as part of the East Coast
Ports studies, Network Rail is currently
examining the potential for using the
Felixstowe – Peterborough – Nuneaton
and Ipswich – Stratford – ECML/WCML
as diversionary routes for each other.
However, this work is subject to clearance
of the Peterborough and ECML routes for
9’ 6” containers, as well as the review of a
number of potential operational issues that
such a proposal uncovers. These issues
will include an assessment of whether fast
reliable paths are available during times of
diversion.
3.9.3
The above issues are largely being taken
forward as part of the Effi cient Engineering
Access initiative. This exercise not only covers
investigation into ways of reducing overnight
and weekend access, but also considers
more widespread use of single line working
as a means of keeping trains running during
engineering work.
3.10 Summary of baseline gaps and issues
3.10.1
From the above the gaps identifi ed can be
summarised as follows:
1) Between existing peak capacity and train
service and/or infrastucture capacity.
2) Between existing rural/inter-urban train
service capacity/frequency and required
capacity/frequency.
3) Between existing access to Stratford/
Docklands and that required to meet
market needs.
4) Between existing freight gauge, train length
and route availability and desired gauge
and capability.
5) Between current and desired performance.
6) Between existing engineering access and
desired access requires especially on the
Stansted, suburban and cross country
routes.
7) Between current access to the network and
that required to meet current needs.

62
4. Forecast of change – wider demand
This chapter provides a summary of the
external drivers of change, together with a
description of stakeholder aspirations for
enhancements to the network. Where possible
these aspirations have been included in the
strategic options listed later in this document.
4.1 Context
4.1.1
In order to understand the extent and location
of development based growth, the Draft East
of England Plan (DEEP) and the London
Plan have been reviewed and a summary
of the drivers of growth has been included
in this section. The DEEP was published
in November 2004, with the Review Panel
recommendations being issued in June 2006.
The numbers issued by the Secretary of State,
in response to the consultation and Panel
report, are also included in this chapter. The
London Plan was published in February 2004.
4.1.2
The stakeholder aspirations have been
raised at the key Stakeholder Management
Group and in discussion with wider industry
stakeholders. The Stakeholder Management
Group has met regularly during the
development of the RUS and comprises
representatives of the following organisations:
Department for Transport
Transport for London
Association of Train Operating Companies
English Welsh and Scottish Railway
Freightliner
GB Railfreight
‘one’
c2c London Lines
First Capital Connect
BAA
Passenger Focus (as observers)
London Travelwatch (as observers)
Network Rail
Offi ce of Rail Regulation (as observers)
4.2 Changes to population, housing and employment
4.2.1
The DEEP sets out the strategy to guide
planning and development in the East
of England to 2021. It covers economic
development, housing, the environment,
transport, waste management, culture, sport
and recreation and mineral extraction. The
tables below show the employment and
housing fi gures to 2021 contained in the
DEEP. Each table is then followed by a table
summarising the fi gures published by the
Secretary of State in December 2006, together
with a brief description of the assumed
distribution of the main growth areas within the
region.
The tables exclude Bedfordshire for two
reasons: a) the DEEP only contains very
provisional fi gures for the county due to the
interaction with the Milton Keynes South
Midlands sub-regional strategy and b)
Bedfordshire is outside the area covered by
the Greater Anglia RUS.

63
Table 4.1 Regional Employment Growth 2001 – 2021
District Grouping Districts 2001 – 2021
Cambridgeshire and Peterborough
92,900
Cambridgeshire Cambridge City/South Cambs/Huntingdon/Fenland 71,000
Peterborough Peterborough UA 21,900
Essex and Unitaries 116,000
Essex Thames Gateway Thurrock/Basildon/Castle Point/Southend-on-Sea 55,000
Essex – Haven Gateway Colchester/Tendring 20,300
Rest of Essex Harlow/Uttlesford/Chelmsford/Braintree/Maldon/ Rochford/Epping Forest/Brentwood
40,700
Hertfordshire 64,700
Norfolk 42,600
Suffolk 51,900
Suffolk – Haven Gateway Ipswich/Suffolk Coastal/Babergh 29,400
Rest of Suffolk Mid Suffolk/St Edmunsbury/Forest Heath/Waveney 22,500
Overall Total (excl. Bedfordshire) 368,100
Source: DEEP December 2004

64
The numbers published by the Secretary of
State show a general increase spread over the
region with a small reduction in Suffolk.
Table 4.2 Summary of Employment totals published by the Secretary of State
District Grouping 2001 2001 – 2021
Cambridgeshire & Peterborough 359,100 95,000
Essex & Unitaries 648,100 131,000
Hertfordshire 481,800 68,000
Norfolk 347,000 55,000
Suffolk 305,700 53,000
East of England Total (excl. Bedfordshire) 2,141,700 402,000
Source: Plan totals published by Secretary of State 19 December 2006
The majority of the development of interest to
the RUS is concentrated in Cambridgeshire,
the Essex Thames Gateway and around
Norwich, the main developments being:
■ Essex Thames Gateway – development
of the old Shell Haven refi nery into a
container port, logistics terminal and
business centre creating 16,500 jobs;
redevelopment of the town centres
for retail, leisure and business; and
development of a university campus in
Southend providing 6,500 jobs.
■ Norwich – employment opportunities
building on the industries based on
biotechnology, food processing, fi nance,
insurance, business services, retail,
leisure, media and education.
■ Cambridgeshire – mainly centred around
the knowledge based industries in the city
and business/research parks, together with
the continued expansion of Addenbrookes
hospital. In addition there are distribution
centres in the west of the county around
Huntingdon and Peterborough, including
the development at Alconbury.
■ Other developments – Other developments
are also taking place in the regional
centres at Chelmsford, Colchester and
Ipswich, as well as those assiociated with
the ports developments at Felixstowe and
Bathside Bay, together with the airport and
associated development around Stansted.
Whilst the DEEP is based on the assumption
that the rate of out-commuting is reduced,
the scale of development, even if it fully
materialises, is unlikely to prevent increases in
commuting from the region into London.
4.2.2
The regional housing development is
presented in a similar format to that for
employment, the split by district grouping being
shown in Table 4.3 with the fi gures published
by the Secretary of State summarised in Table
4.4.

65
Table 4.3 Regional Housing Growth 2001 – 2021
District Grouping Districts 2001 – 2021
Cambridgeshire and Peterborough
89,300
Cambridgeshire Cambridge City/South Cambridgeshire/Huntingdon/Fenland
68,100
Peterborough Peterborough UA 21,200
Essex and Unitaries 123,400
Essex Thames Gateway Thurrock/Basildon/Castle Point/Southend-on-Sea 39,200
Essex – Haven Gateway Colchester/Tendring 25,600
Essex – London Arc Epping Forest/Brentwood 13,900
Rest of Essex Harlow/ Uttlesford/Chelmsford/Braintree/Maldon/ Rochford
44,700
Hertfordshire 79,600
Hertfordshire – London Arc Three Rivers/Watford/Hertsmere/Broxbourne/ Dacorum/St Albans/Welwyn Hatfi eld
36,600
Rest of Hertfordshire North Herts/Stevenage/East Hertfordshire 43,000
Norfolk 72,600
Kings Lynn & West Norfolk Kings Lynn & West Norfolk 11,000
Great Yarmouth Great Yarmouth 6,000
Breckland Breckland 15,200
North Norfolk North Norfolk 6,400
Greater Norfolk Norwich/Broadlands/South Norfolk 34,000
Suffolk 58,600
Suffolk – Haven Gateway Ipswich/Suffolk Coastal/Babergh 30,700
Waveney Waveney 5,800
Rest of Suffolk Mid Suffolk/St Edmunsbury/Forest Heath 22,100
Overall Total (excl. Bedfordshire) 423,500
Source: DEEP December 2004

66
Again the fi gures published by the Secretary
of State show an increase spread across the
region.
Table 4.4 Summary of Housing totals published by the Secretary of State
District Grouping 2001 2001 – 2021
Cambridgeshire & Peterborough 297,800 98,300
Essex & Unitaries 693,900 127,000
Hertfordshire 430,700 83,200
Norfolk 363,100 78,700
Suffolk 295,900 61,700
East of England Total (excl Bedfordshire) 2,081,500 448,900
Source: Plan totals published by Secretary of State 19 December 2006
The majority of the development of interest to
the RUS is concentrated in Cambridgeshire,
the Essex Thames Gateway, Central Essex
and around Ipswich and Norwich, the main
developments being:
Cambridgeshire – mainly concentrated
around Cambridge, with intensifi cation of
existing development in the city, as well as
new developments along the Cambridge
– Huntingdon corridor and around
Addenbrookes.
Peterborough – development is also centred
around Peterborough, including the Hamptons
development to the south of the city.
Essex Thames Gateway – new developments
along the Thames in the Barking – Thurrock
corridor as part of the Communities Plan.
Essex Haven Gateway – Development
around Colchester, including the Hythe
development to the east of the town.
Rest of Essex – Planned development
across the middle of Essex, especially around
Chelmsford and Harlow.
Greater Norfolk – Norwich and surrounding
region, including local towns such as
Wymondham.
Suffolk Haven Gateway – development in
and around Ipswich.
Rest of Suffolk – Development along the
Ipswich – Stowmarket – Bury St Edmunds
corridor.
Again this will lead to commuting into local
centres as well as further commuting to
London.
4.2.3
With regard to the growth of jobs in London
and the population changes in the east of the
city, the Greater London Authority Act 1999
placed responsibility for strategic planning in
London on the Mayor. The Act required him to
produce a Spatial Development Strategy for
London, referred to as the London Plan, which
covers the period until 2016.
4.2.4
Over the next 15 years the population of
London is forecast to grow by 810,000, with
the working population growing by 516,000.
It is also forecast that jobs, especially in
the fi nance and service sectors will rise by
636,000, many being in Central and East
London, including the City and the Isle of
Dogs.
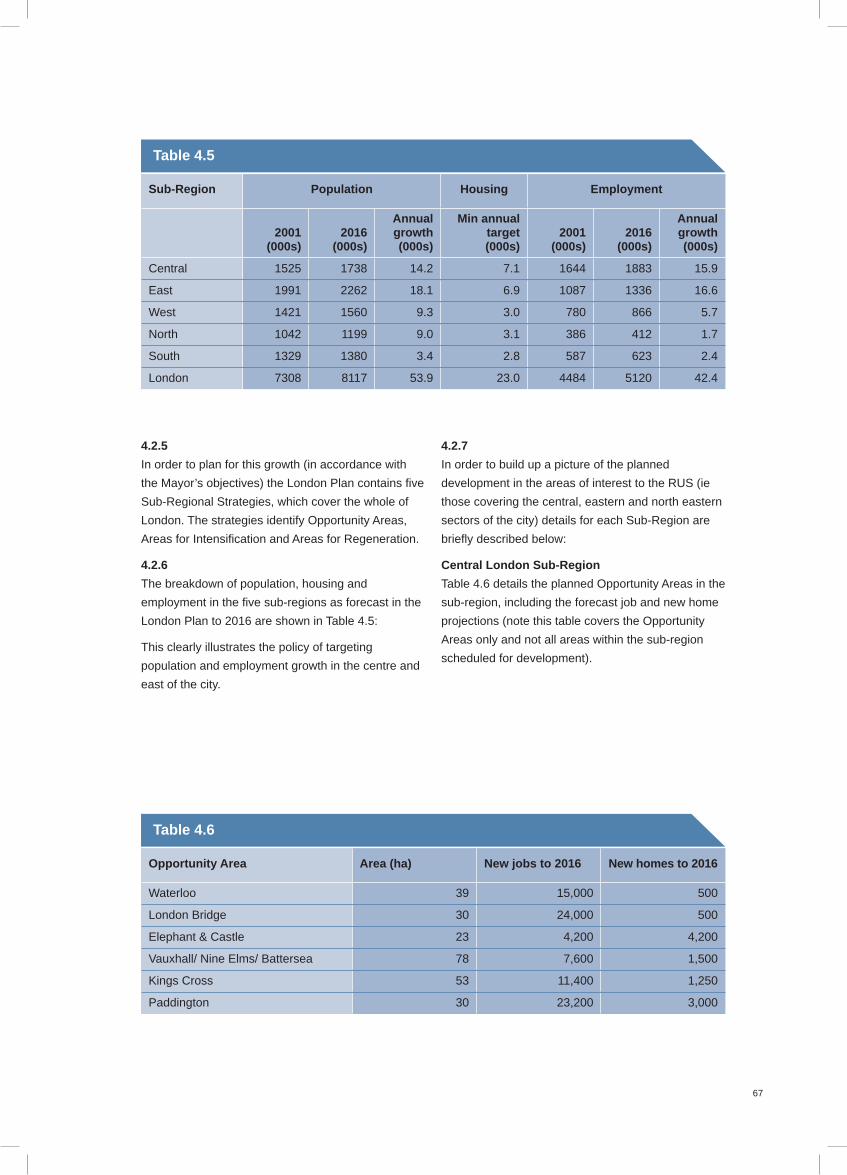
67
Table 4.5
Sub-Region Population Housing Employment
2001(000s)
2016(000s)
Annual growth(000s)
Min annual target(000s)
2001(000s)
2016(000s)
Annual growth(000s)
Central 1525 1738 14.2 7.1 1644 1883 15.9
East 1991 2262 18.1 6.9 1087 1336 16.6
West 1421 1560 9.3 3.0 780 866 5.7
North 1042 1199 9.0 3.1 386 412 1.7
South 1329 1380 3.4 2.8 587 623 2.4
London 7308 8117 53.9 23.0 4484 5120 42.4
4.2.5
In order to plan for this growth (in accordance with
the Mayor’s objectives) the London Plan contains fi ve
Sub-Regional Strategies, which cover the whole of
London. The strategies identify Opportunity Areas,
Areas for Intensifi cation and Areas for Regeneration.
4.2.6
The breakdown of population, housing and
employment in the fi ve sub-regions as forecast in the
London Plan to 2016 are shown in Table 4.5:
This clearly illustrates the policy of targeting
population and employment growth in the centre and
east of the city.
4.2.7
In order to build up a picture of the planned
development in the areas of interest to the RUS (ie
those covering the central, eastern and north eastern
sectors of the city) details for each Sub-Region are
briefl y described below:
Central London Sub-Region
Table 4.6 details the planned Opportunity Areas in the
sub-region, including the forecast job and new home
projections (note this table covers the Opportunity
Areas only and not all areas within the sub-region
scheduled for development).
Table 4.6
Opportunity Area Area (ha) New jobs to 2016 New homes to 2016
Waterloo 39 15,000 500
London Bridge 30 24,000 500
Elephant & Castle 23 4,200 4,200
Vauxhall/ Nine Elms/ Battersea 78 7,600 1,500
Kings Cross 53 11,400 1,250
Paddington 30 23,200 3,000

68
Table 4.7
Opportunity Area Area (ha) New jobs to 2016 New homes to 2016
Bishopsgate/South Shoreditch 35 16,000 800
Whitechapel/Aldgate 31 14,000 700
Isle of Dogs 100 100,000 3,500
Stratford 124 30,000 4,500
Lower Lea Valley 250 8,500 6,000
Royal Docks 368 11,000 5,500
Barking Reach 210 200 10,000
London Riverside 418 4,000 3,000
Deptford Creek/Greenwich Riverside
72 5,500 1,000
Greenwich Peninsular 104 15,000 7,500
Belvedere/Erith 242 5,000 1,400
Thamesmead 121 1,500 3,000
Ilford 56 - 5,500
Total 1,812 210,700 52,400
Areas scheduled for Intensifi cation in the Central
Sub-Region are largely concentrated in the West
End, especially around the proposed Crossrail
stations. The only location outside the central area
is the redevelopment around the new stadium in the
Arsenal/Holloway area.
East London Sub-Region
The East London Sub-Region is the largest and
covers the whole of East and South East London out
to the borders with Kent and Essex.
Table 4.7 details the planned Opportunity Areas in the
sub-region, including the forecast job and new home
projections:
Of particular importance to the RUS are the following:
a) The Bishopsgate, Shoreditch, Whitechapel and
Aldgate developments cover the eastern spread
of the city offi ces for use by the fi nancial business
sector.
b) The continued development of the Isle of Dogs
is seen as major source of employment in the
capital again with the majority of jobs being in the
fi nancial sector. Further east, the Royal Docks will
be a similar development but on a smaller scale.
c) The Stratford City development has gained
planning consent and will be a major retail, offi ce
and residential centre.
d) The Lower Lea Valley is scheduled for major
redevelopment by the London Development
Agency (LDA). This development will generate
both jobs and housing.
e) Barking Reach is seen as a major source of
housing in the Thames Gateway.

69
North London Sub-Region
Table 4.8 details the planned Opportunity
Areas in the sub-region, including the forecast
job and new home projections:
Table 4.8
Opportunity Area Area (ha) New jobs to 2016 New homes to 2016
Upper Lea Valley 416 10,000 700
Tottenham Hale 26 5,000 200
Cricklewood/Brent Cross 107 5,000 5,000
The Upper Lea Valley comprises a six–mile
corridor running north from Stratford. The
corridor includes Tottenham Hale and a
number of old industrial sites which are
scheduled for redevelopment. The jobs
created will be in the business park and the
new Middlesex University campus.
4.3 Freight growth issues by commodity
The freight growth forecasts described below
are from the Freight RUS and also, in the case
of the maritime container traffi c, from the port
planning inquiries.
Aggregates
4.3.1
The market will continue to enjoy underlying
growth but with fl uctuations according to the
general fortunes of the building industry and
major construction schemes. Within the route
potential schemes include;
■ Crossrail
■ M25 widening
■ Thames Gateway development
■ London Olympic Park/Lower Lea Valley
development
■ airport expansion at Stansted
■ fl ood defence work
■ London Underground infrastructure
renewals
4.3.2
Additional rail aggregate facilities have
been proposed or are being considered for
Bow, Bury St Edmunds, the Olympic Park,
West Thurrock and Whittlesea. Details of
the Olympic Park are still in development,
however, Bow is likely to feature strongly in
the plans for aggregate delivery, but the depot
may close temporarily during the Games
themselves. There are also plans for a new
connection between the network and LUL
at Barking, to enable Metronet
to deliver renewals materials to the
Underground system.
4.3.3
Whilst recycled aggregates are expected to
increase their market share this is from a very
small base. Primary aggregate tax encourages
use of re-cycled material but it has not
signifi cantly altered the economic advantage
of bulk primary production and rail movement.
The demand for quarried/dredged material
will remain high and continue to support and
expand the fl ows listed. As operators generally
maximize train payloads, volume increases
imply that additional trains will need to run.
Other bulk raw material production/
consumption
4.3.4
There is potential for expansion in non-
intermodal traffi c via ports, particularly Tilbury,
but these proposals are at an early stage of
development. The Olympics Park construction

70
Table 4.9 Likely train path demand arising from port expansion
Site Potential increase in trains per day each way
Bathside Bay (Harwich) 10 – 15
Felixstowe South (expansion of existing port) 15 – 20
Shell Haven 19 – 25
may attract steel and other commodities
by rail in addition to aggregates.
Intermodal business
4.3.5
This sector is likely to see very signifi cant
change. Deep sea containerised traffi c into
the UK is growing by around fi ve percent per
year, particularly from the far-east. The fi nite
capacity of existing major container ports will
start to curtail trade within the next few years
without expansion schemes.
4.3.6
Port developers have responded with a series
of proposals for signifi cant port expansions
with rail implications. Predicted demand from
these sites is shown in Table 4.9.
The actual numbers assumed in the future
year tables in Chapter 5 of this document are
shown in Tables 4.10 to 4.12. These are taken
from the Freight RUS for 2014/15 and the port
planning inquiry for 2023. In Table 4.11 the
Base Case scenario assumes no development
of Shell Haven by 2014/15 and Sensitivity Test
2 (Sense Test 2) assumes eight trains per day
by 2014/15 and consequently fewer additional
services from Felixstowe and Bathside Bay.
Table 4.10 Base Year trains per day each way (Deep sea intermodal only)
NLL & Stratford GOB if W10 GE Cross Country
Felixstowe 14 - 14 8
Bathside Bay - - - -
Shell Haven - - - -
Total 14 - 14 8
Table 4.11 Forecast trains per day each way in 2014/15. Unconstrained by capacity (Deep sea intermodal only)1
NLL & Stratford GOB if W10 GE Cross Country
Base Case
Sense Test 2
Base Case
Sense Test 2
Base Case
Sense Test 2
Base Case
Sense Test 2
Felixstowe 27 22 - - 27 22 12 11
Bathside Bay 6 5 - - 6 5 3 2
Shell Haven - 2 - 6 - - - -
Total 33 29 6 33 27 15 13
Source: Freight RUS data
1 The Freight RUS also predicts up to 4 additional container trains per day out of Tilbury by 2014/15 over the 2004/05 base of 5. Already 1-2 tpd of these additional services are running in line with forecast. Current services run via the NLL. Most of these additional services would run over the GOB if W10 gauge clearance was completed, though 1 or 2 could require use of the NLL if they are for east coast destinations or require electric traction.
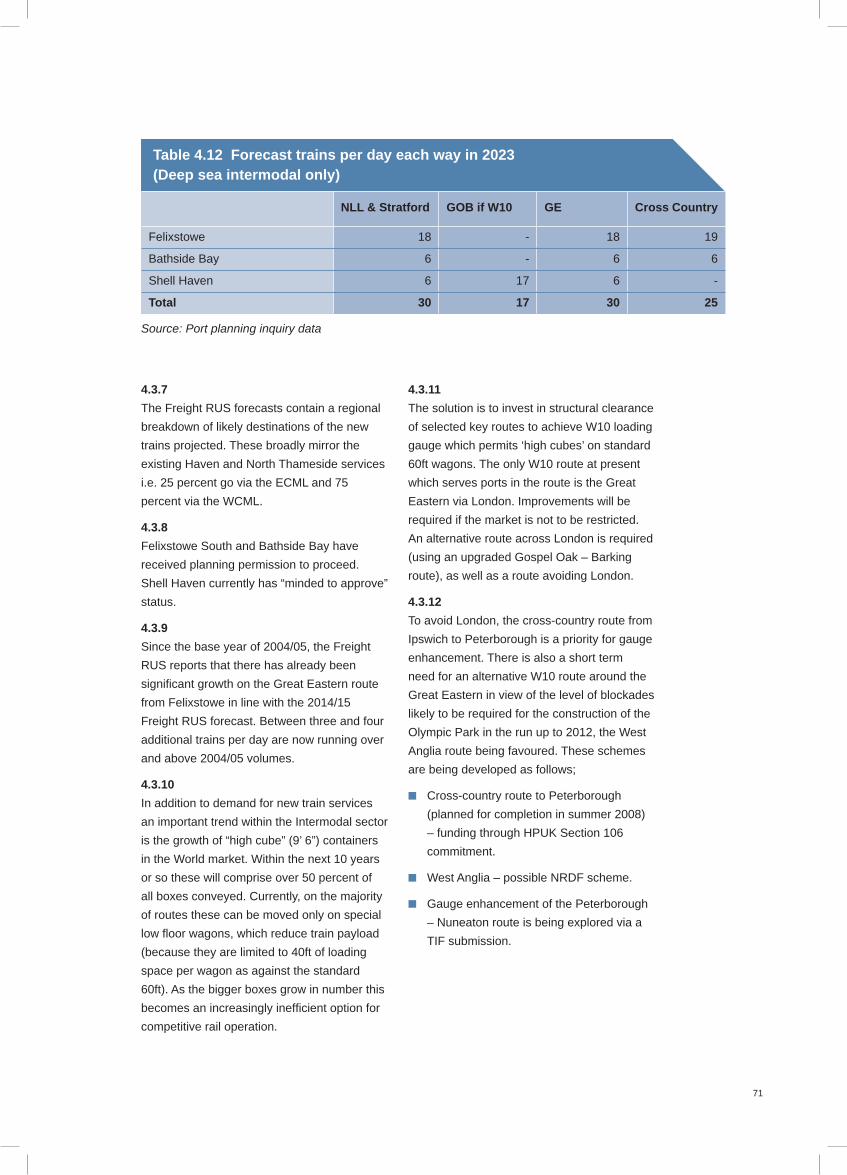
71
4.3.7
The Freight RUS forecasts contain a regional
breakdown of likely destinations of the new
trains projected. These broadly mirror the
existing Haven and North Thameside services
i.e. 25 percent go via the ECML and 75
percent via the WCML.
4.3.8
Felixstowe South and Bathside Bay have
received planning permission to proceed.
Shell Haven currently has “minded to approve”
status.
4.3.9
Since the base year of 2004/05, the Freight
RUS reports that there has already been
signifi cant growth on the Great Eastern route
from Felixstowe in line with the 2014/15
Freight RUS forecast. Between three and four
additional trains per day are now running over
and above 2004/05 volumes.
4.3.10
In addition to demand for new train services
an important trend within the Intermodal sector
is the growth of “high cube” (9’ 6”) containers
in the World market. Within the next 10 years
or so these will comprise over 50 percent of
all boxes conveyed. Currently, on the majority
of routes these can be moved only on special
low fl oor wagons, which reduce train payload
(because they are limited to 40ft of loading
space per wagon as against the standard
60ft). As the bigger boxes grow in number this
becomes an increasingly ineffi cient option for
competitive rail operation.
4.3.11
The solution is to invest in structural clearance
of selected key routes to achieve W10 loading
gauge which permits ‘high cubes’ on standard
60ft wagons. The only W10 route at present
which serves ports in the route is the Great
Eastern via London. Improvements will be
required if the market is not to be restricted.
An alternative route across London is required
(using an upgraded Gospel Oak – Barking
route), as well as a route avoiding London.
4.3.12
To avoid London, the cross-country route from
Ipswich to Peterborough is a priority for gauge
enhancement. There is also a short term
need for an alternative W10 route around the
Great Eastern in view of the level of blockades
likely to be required for the construction of the
Olympic Park in the run up to 2012, the West
Anglia route being favoured. These schemes
are being developed as follows;
■ Cross-country route to Peterborough
(planned for completion in summer 2008)
– funding through HPUK Section 106
commitment.
■ West Anglia – possible NRDF scheme.
■ Gauge enhancement of the Peterborough
– Nuneaton route is being explored via a
TIF submission.
Table 4.12 Forecast trains per day each way in 2023 (Deep sea intermodal only)
NLL & Stratford GOB if W10 GE Cross Country
Felixstowe 18 - 18 19
Bathside Bay 6 - 6 6
Shell Haven 6 17 6 -
Total 30 17 30 25
Source: Port planning inquiry data

72
General merchandise
4.3.13
Expressions of interest by developers in sites
which might create new general merchandise
rail business are as follows;
■ Barking – proposals to develop a site
adjacent to the new Channel Tunnel Rail
Link which could receive freight trains
composed of continental-sized wagons
directly from Europe via the new line,
which opens in late 2007. Traffi c over the
link will be dependant on charges via the
tunnel relative to other routes, however,
the overall market is assessed at around
80 million tonnes per year (source:
Intermodality report for EWS).
■ Stowmarket, Kings Dyke – new rail linked
distribution sites.
These proposals are at an early stage and
none has yet progressed to the point where a
fi rm rail demand exists.
Other trainload freight
4.3.14
Within this commodity group freight train
operators believe there are prospects for
growth on rail as follows;
■ Automotive – increasing movements
through ports.
■ Waste – possibility for additional fl ows on
rail as disposal pressures grow.
These prospects cannot be translated into
defi nite rail demand yet.
Specialist freight business
4.3.15
Nuclear traffi c from power stations will decline
over the long term as they approach the
decommissioning phase of their lives.
4.4 Transport proposals and enhancement aspirations
4.4.1
The TOCs and FOCs, who are principal users and
key stakeholders on the routes covered by the
Greater Anglia RUS, have the following aspirations:
■ c2c
c2c wish to continue to operate the best
performing route in the country. In terms of
passenger growth and market needs they
wish to see the following: improved capacity
and performance on services via Ockendon;
Grays bay platform extended, so that 8 car
trains can terminate; more trains calling at
West Ham for interchange to Docklands;
and trains lengthened to meet demand.
They also wish linespeeds to be improved
between Barking and Upminster.
■ ‘one’
‘one’ have aspirations to meet growth on
both the West Anglia and Great Eastern
routes, as well as a better service to
Stratford from main line destinations.
‘one’ also wish to see performance
on the routes improved through their
‘Challenge 90’ initiative (to achieve a PPM
of at least 90 percent), as well as local
enhancements to infrastructure. These
include enhancements such as improved
turnback facilities, as well as replacement
of the poorly performing sections of the
OHLE. Reduced overnight and weekend
engineering access is also being sought on
certain routes, in particular to Stansted.
In terms of access to the network ‘one’
will be continuing with the improvement
of car parks and have been involved in
the development of new stations, such as
those proposed at Great Blakenham and to
the north east of Chelmsford.
■ First Capital Connect
FCC are currently evaluating the operation
of longer trains on the Cambridge services
to reduce overcrowding.
■ Central Trains
Central Trains are currently being
refranchised, however, they have been
looking at ways of relieving overcrowding
on their inter-regional services.
■ Freight operators
Freight operators are keen to ensure that
adequate capacity exists to meet forecast

73
growth (as described in the Freight RUS),
especially for aggregate and intermodal
traffi c, particularly deep sea containers.
Intermodal traffi c from the ports to the
ECML/WCML routes will require W10 gauge
clearance, incremental train lengthening,
improved capacity and better engineering
access arrangements. The freight operators
also wish to ensure that the Rules of the
Plan are robust and that trains can operate
without the need for speed or weight
restrictions. EWS also wish to operate Class
92 locomotive (with regenerative braking)
to/ from Thameside in connection with the
operation of CTRL traffi c. Access to the
Thameside route for electric traction would
be enhanced if the Gospel Oak – Barking
route were electrifi ed.
EWS has developed the concept of the
“Big Freight Railway”, the purpose being
to maximise the use of each path on the
network. The key is trains which are longer,
heavier and bigger (both in width and height).
■ BAA
BAA have prepared their Surface Access
Strategy for the development of Stansted and
are seeking to provide additional capacity to
the airport, especially at peak times. In April
2006 BAA submitted a planning application
to make better use of the existing runway,
increasing capacity to around 35 million
passengers. This was refused by Uttleford
District Council in November 2006. BAA
has now appealed against this decision
and an enqiury is expected in 2007. BAA
are currently consulting on the G2 access
strategy and have recently published
the following documents: “BAA Stansted
Development, G2 Airport Rail Strategy, High
Level Option Statement” and “Stansted
Generation 2, Surface Access, February
2007 Consultation”.
■ TfL
TfL in preparing their Rail Corridor Plan
(RCP) and 2025 Vision wish to promote a
4 tph all day service on all the key radial
routes, as well as increased services via
Stratford. They seek to operate these as
at least eight car trains in the peak. They
also wish services to operate over the same
service hours as the Underground. The
2025 plans are also designed to build on the
capacity/opportunities provided by Crossrail.
■ Passenger Focus
Passenger Focus is the independent
National Rail consumer watchdog: its
mission is to get the best deal for Britain’s
rail passengers. Passenger Focus are keen
that a) the current need for passengers
to stand for in excess of 20 minutes is
eliminated; and b) that there is suffi cient
capacity on all routes to meet demand
to 2016. They stress that getting to the
station is integral to travelling by train, with
capacity to park cars a key area to address.
4.4.2
In terms of the wider stakeholders, the
aspirations of the East of England Regional
Assembly, the County Councils and London
Boroughs are briefl y listed below, their plans
being taken from the Regional Spatial Strategy/
Regional Transport Strategy, Local Transport
Plans and Local Implementation Plans:
■ East of England Regional Assembly
In their Regional Transport Strategy the
Assembly are seeking to promote the
following: the implementation of major
projects, including Thameslink, Crossrail
and access to Stansted; improvements
to the cross country and inter-regional
routes, as well as the key radial lines; and
enhancement of the cross country freight
routes to improve access to the region’s
main ports.
■ Norfolk County Council
Norfolk seek improvements to the radial,
rural and east – west rail routes. They
are also keen to see improved market
share for rail freight and development of
access to the passenger network through
improved car parking, interchange, DDA
and continued promotion of the County’s
successful Community Rail Partnerships.

74
■ Suffolk County Council
Suffolk seek improved rail freight through
completion of the Felixstowe – Nuneaton
route, improved services on the Ipswich
– Peterborough and East Suffolk lines,
together with improved interchange at
stations such as Ipswich and Lowestoft.
The County also wish to see new stations
provided at Moreton Hall and Great
Blakenham to serve local developments.
■ Cambridgeshire County Council
The Council are concentrating on improved
access to Cambridge through construction
of Chesterton station to act as a parkway for
access to the city. They are also keen to see
the cross country freight route upgraded to
provide relief to the county’s major roads.
■ Essex County Council
Essex seek improved access to stations,
especially DDA, car parks, interchange
and station facilities. They are also keen to
ensure that capacity on the radial routes
expands in line with growth and that
new stations are provided north-east of
Chelmsford and to serve Essex University.
Improvements are also sought to the
Braintree, Sudbury and Clacton branches.
■ Hertfordshire County Council
The County wish to see improved east
– west rail links to and from the region,
as well as the development of its main
interchanges, together with good links to
Stansted Airport and Stratford.
■ The London Boroughs
The boroughs’ aspirations cover improved
access to the network with extra
interchange stations, as well as improved
station security. They are keen to promote
rail freight but almost all advocate a freight
bypass for London.
4.5 Regional/local funding
4.5.1
There a number of mechanisms for funding
schemes identifi ed within the RUS, and these
are briefl y described below:
■ Department for Transport
The DfT, as procurer and specifi er of
passenger rail franchises, does have the
ability to fund major enhancements directly.
It also has other funding mechanisms and
these include: the Transport Innovation
Fund (TIF) for the promotion of schemes,
which enhance regional/national
productivity, together with the High Level
Output Specifi cation, in which the DfT
decides what outputs it wishes to buy from
the rail industry.
■ Network Rail
Network Rail has two potential funding
mechanisms for enhancements: the Network
Rail Discretionary Fund for relatively minor
schemes that improve capacity/performance
and the Outperformance Fund for the
development of larger enhancements.
(These programmes are subject to
continued DfT funding and ORR scrutiny
of business cases).
■ Transport for London (TfL)
While TfL is not generally responsible for
the funding of National Rail services, it
seeks to work closely with DfT and TOCs
to help ensure that they meet the needs of
London. The Mayor’s Transport Strategy
therefore seeks to better integrate National
Rail’s provision with that of other transport
providers and to raise the standards
of National Rail services and facilities
in London. To this end, TfL has funded
station access and passenger security
programmes and has now assumed
responsibility for re-franchising the Silverlink
Metro services. In addition it is funding
the East London Line Extension scheme,
as well as the development of Crossrail.
TfL is also promoting the development of
the radial suburban routes through its Rail
Corridor Plans and 2025 Vision.
■ London Boroughs’ Local
Implementation Plans and Borough
Spending Plans
TfL is also responsible for allocating
the Government’s annual Transport

75
Settlement, in respect of London, to
the London Boroughs. This is the main
source of London Borough funding for
capital expenditure on transport. London
Boroughs present an annual bid to TfL for
such funding via their Borough Spending
Plans. These in turn must be in line with
the Borough’s Local Implementation
Plan, a statement of how the borough is
going to implement the Mayor’s Transport
Strategy at local level. To date most
borough expenditure related to National
Rail has been related to improving access
to, the physical approach to, and the local
environment of stations.
■ Local authorities’ Local Transport Plans
These programme are submitted to the
DfT for funding and generally cover smaller
rail schemes, including improved station
facilities and interchange.
■ Planning Conditions/Section 106
Agreements
In order to ensure that the transport
system can cope with the additional trips
generated by development, the Planning
Authority can impose a planning condition
on the granting of planning permission.
It is more likely, however, that in the
case of large scale developments, the
Planning Authority negotiates a Section
106 agreement with the proposer whereby
money is made available for improvements
to the transport system. Whilst this may
lead to the funding of additional stations
on the Network (capacity permitting) and
a contribution to improvements such as
those on the West Anglia route (required
to meet the needs of Stansted), a more
radical pooling of developers’ 106 monies
may be required if the there is a gap in
funding the enhancements necessary to
meet regional growth.
■ The Transport Plan for the London 2012
Olympic Games and Paralympic Games
In the context of this RUS, the access
to Stratford from the West Anglia, Great
Eastern outer and c2c routes has an
important role to play in the transport plans
for the Games. Network Rail is working
with the Olympics Delivery Authority to
help deliver the enhancements needed
to handle the passenger traffi c generated
by the Games. It is the intention that
the enhancements will provide a legacy
of improved services to Stratford and
Docklands.
4.6 Summary of gaps identifi ed
4.6.1
The following gaps have been identifi ed in this
chapter:
1) Strong growth is predicted in the region
through the coming years, with a growing
need for increased commuting to meet the
needs of London.
2) Strong regional growth also leads to a
requirement for improved local services
between regional centres.
3) There is a need to ensure that peak
crowding is dealt with and does not worsen
as demand rises.
4) The growth of Docklands and the
development of East and North East
London leads to a requirement for
improved access to Stratford and
interchange for Docklands.
5) Mayoral objectives to achieve a four train-
per-hour “metro-style” frequency on the
suburban radial routes, including extended
service hours to match those of LUL.
6) Strong growth in intermodal traffi c leads to
a requirement for increased capacity and
enhanced gauge on the cross county route
and the Gospel Oak – Barking – Willesden
line (electrifi cation of the latter would
enhance the routeing opportunities for
electrically hauled freight from Thameside).

76
5. Forecast of change – predicted demand increases
5.1 Introduction
5.1.1
Our forecasts for changes in passenger and
freight demand to 2016 and 2021 are set out
in this chapter. Passenger demand forecasts
have been made by Atkins Transport Planning
using a forecasting tool to produce future
year demand matrices in the PLANET South
AM demand model. To estimate future freight
demand in the area the RUS draws on specifi c
market information for short term predictions,
the 2014/15 demand forecasts from the
Freight RUS and information from the port
planning inquiries for longer term estimates of
intermodal freight demand.
5.2 Passenger demand
Methodology
5.2.1
The passenger demand forecasts are
driven by a number of underlying planning
assumptions. The key sources of these data
are shown in Table 5.1.
Table 5.1: Drivers of passenger demand and planning data sources
Demand Driver Source of Planning Assumption
Population and employment forecasts
Tempro version 4.3 policy data (03/08/2005) for the South East and trend based data (09/05/2002) for the rest of the country.1
Consumer response elasticities PDFH v4.1
Fares Growth RPI+1%
Gross Value Added Cambridge Econometrics
Fuel Cost TEMPRO guidance
Car Availability TEMPRO v4.3
Car Journey Time PLANET Strategic Highway Model
Stansted Airport Rail Access Passenger demand forecast overlay provided by BAA; sensitivity overlay provided by DfT.
Service Changes Do-minimum timetable (December 2005)
Committed Schemes London Underground PPP schemes
Integrated Kent Franchise
Channel Tunnel Rail Link
East London Line Phase 1
Docklands Light Railway extended to Woolwich Arsenal and Stratford International
North London Lines capacity works at Stratford
1 These data were supplied by Faber Maunsell and are the same as those used for demand forecasting work that they have undertaken for BAA. This data is augmented with data from the Draft East of England Plan and the London Plan.

77
5.2.2
The base year in the PLANET South AM model
is 2002. The forecasting process was: fi rst,
to predict a base year – in this case 2004/05
– and to calibrate that base prediction to
observed ticket sales, survey and passenger
count data; and second, to make future year
forecasts based on the underlying assumptions
from the base year (which is itself a modelled
outcome). PLANET South AM makes these
predictions for morning peak passenger
fl ows around London. The model also
predicts passengers’ responses to crowding
as a constraint on demand which results
(for demand increases) in a combination
of passengers enduring more crowded
conditions, trip suppression (or use of other
modes), and switching between alternative
heavy rail or London Underground routes.
Passenger demand forecasts
5.2.3
The estimated rates of change in passenger
demand for each route are shown in Table
5.2 and the base and future levels of demand
for each route are shown in Figure 5.1.
These rates of increase are constrained by
crowding in the do-minimum forecast.2 The
unconstrained forecasts are much higher: the
weighted averages being 23 percent and 28
percent, for 2016 and 2021 respectively.3
Table 5.2: Predicted Changes in Passenger Journeys (AM Peak UP Direction; Do-minimum)
Route 2016 2021
Thameside 15% 17%
Great Eastern 8% 9%
West Anglia 37% 42%
Weighted Average 17% 19%
Source: PSAM Outputs, Atkins
2 The do-minimum scenario is a future year (2016 or 2021) scenario with the current network and train service provision plus any committed changes. These are known changes which are defi ned for the RUS.
3 The constrained and unconstrained forecasts are both made from the same base level of patronage, which is itself constrained by current crowding. Constrained demand assumes that no additional capacity is added in future years (other than do-minimum changes) and unconstrained demand assumes that capacity is added to ensure that crowding is no worse than current levels as demand rises.

78
5.2.4
There is considerable variation in the
predictions of changes in passenger journeys
towards London across routes and between
service groups within routes. Especially
large proportionate increases are predicted
for Stansted Express and services via the
Southbury Loop and Seven Sisters on the
West Anglia route, due to increasing air
passenger demand and regional housing
growth. The predicted increases in passenger
numbers at the service group level are shown
in Figure 5.2.
Source: PLANET South AM Peak, Atkins
0
10000
20000
30000
40000
50000
60000
70000
80000
West AngliaGreat EasternThameside
Key
2004
2016
Figure 5.1: Base and Future Modelled Levels of Demand (am peak journeys to London; Do-minimum)
2021
Supressed Journeys by 2021

79
5.2.5
The predicted increases in passenger journeys
are constrained by crowding on trains.
Atkins analysis shows that demand would be
considerably higher if capacity were increased
in line with demand. Around 10,000 morning
peak trips into London a day are predicted to
be crowded off the network by 2021 in the do-
minimum scenario.
5.2.6
The predicted daily levels of crowding-off for
passengers in the morning peak are shown
in Table 5.3 for each of the routes. These are
PLANET estimates which are determined
within the model by the estimated passenger
demand and load factors in the forecast year.
Table 5.3: Estimated Crowding Off of Passengers (Daily)AM Peak; UP Direction; Do-minimum
Route Trips a day Crowded Off (Do-minimum; AM Peak; Up Direction)
2016 2021
Thameside 800 1,500
Great Eastern 3,800 4,500
West Anglia 2,900 4,000
Total 7,500 10,000
Source: PLANET South AM outputs, Atkins
Source: PLANET South AM outputs, Atkins
Tha
mes
ide
Ang
lia In
ter
City
GE
Out
ers
GE
Inne
rs
GE
Sou
then
d
Chi
ngfo
rd
Sta
nste
d E
xpre
ss
Sou
thbu
ry L
oop
Cam
brid
ge
Her
tford
Eas
t0
5000
10000
15000
20000
25000
30000
35000
40000
Key
Modelled Base Demand
2016 Passenger Forecast
Figure 5.2: Base and Future Modelled Demand by Service Group(am peak journeys to London; Do-minimum)
Predicted Crowding Off
2021 Passenger Forecast

80
Crowding
5.2.7
The impact of the predicted increase in
morning peak journeys to London will vary
across trains according to their calling
patterns and timing. A constrained growth
factor has been applied from the demand
forecast uniformly to the observed passenger
count data from the PIXC counts taken in the
base year (2004/05 Autumn counts). This
gives a simple estimate of the future year
travelling conditions for passengers, in terms
of crowding, and PIXC under the do-minimum
scenario. These estimates are shown in Table
5.4. Base year and predicted PIXC are shown
in Table 5.5 at the service group level. The key
assumption in this analysis is that passengers
continue to travel at the same time as they do
now no matter how crowded the trains. In fact,
it is expected that some passengers at the
margin would travel at different times once the
trains for which the unconstrained demand is
greatest are suffi ciently full for passengers to
trade their ideal travel time for less crowded
conditions. The impact of this peak spreading
is that the results in Table 5.4 are conservative:
it should be expected that more trains will be
over their PIXC capacity than are estimated in
the analysis for the forecast years on all routes
in the do-minimum scenario.
Table 5.4: Predicted Crowding on Passenger ServicesAM Peak; UP Direction; Do-minimum
Thameside Great Eastern West Anglia
Passengers standing in “unacceptable” conditionsNumber of people a day in Up directionPercentage of total in parentheses
2004 (Actual) 1,600 (6%) 3,400 (6%) 1,500 (6%)
2016 (Forecast) 5,600 (18%) 6,300 (10%) 8,900 (25%)
2021 (Forecast) 5,900 (18%) 6,500 (10%) 10,300 (27%)
Trains over PIXC CapacityNumber of trains in Up directionPercentage of total in parentheses
2004 (Actual) 9 (20%) 17 (20%) 6 (10%)
2016 (Forecast) 23 (50%) 29 (35%) 33 (52%)
2021 (Forecast) 23 (50%) 30 (36%) 37 (59%)
Source: Network Rail Analysis of PSAM Outputs and passenger count data.Note: “unacceptable conditions” are defi ned as being reached when passenger are standing on trains which have exceeded their standing allowance.

81
5.2.8
The predicted changes in the levels of
crowding and the number of over-crowded
trains (defi ned in terms of PIXC capacity)
show that the proportions of passengers
travelling in crowded conditions are very
similar across the three routes in the base
year though a lower proportion of trains are
over PIXC limits on West Anglia than on the
other routes. This indicates that crowding
affects more passengers on each train on
West Anglia than it does on Great Eastern or
the Thameside route.4
Time spent standing
5.2.9
It is not possible to tell whether passengers
have stood for more than 20 minutes from the
PIXC count data. Typically, where average
load factors over the three hour morning peak
are 70 percent or greater this indicates that
passengers during the busiest hour would
often have to stand from stops where a 70
percent average load factor is exceeded.
Modelled load factors have been examined to
estimate where standing starts.
Table 5.5: Predicted Percentage PIXCAM Peak; UP Direction; Do-minimum
2004 (Actual) 2016 (Estimate) 2021 (Estimate)
Thameside 2% 7% 8%
Great Eastern Inner 4% 5% 6%
Great Eastern Outer (including Anglia inter-city)
3% 7% 7%
Great Eastern Southend - - 1%
West Anglia Inner 1% 12% 13%
West Anglia Outer (including Stansted Express)
3% 15% 19%
Source: Network Rail analysis of 2004/05 peak counts, Department for Transport and PLANET South AM Outputs.
4 This because the allowance for standing passengers within PIXC capacity on (some variants of) the class 317 rolling stock used on the West Anglia route is a much higher proportion of seated passengers than it is on Great Eastern or Thameside rolling stock. About a third of services on the Great Eastern Outers and all of the Anglia inter-city services allow no standing within the PIXC capacity.

82
5.2.10
Estimates of the station at which standing
starts and typical journey time from those
stations to the maximum loading stop are
shown in Table 5.6 for each of the outer
service groups.5
Table 5.6: Estimates of Time Spent StandingAM Peak; UP Direction; Do-minimum
2004 2016 2021
ThamesideBasildon – Benfl eet(27 – 40 minutes)
Basildon - Benfl eet(27 – 40 minutes)
Southend(52 minutes)
GE OuterChelmsford(28 minutes)
Witham(37 minutes)
Witham(37 minutes)
GE SouthendShenfi eld - Billericay(14 – 23 minutes)
Wickford(30 minutes)
Wickford(30 minutes)
Anglia inter-cityColchester(57 minutes)
Ipswich(76 minutes)
Ipswich(76 minutes)
West Anglia Outer including Stansted Express
Cheshunt/Broxbourne(8 - 13 minutes)
Harlow/Bishop’s Stortford(21 - 32 minutes)
Bishop’s Stortford/ Stansted Airport(32 - 34 minutes)
Source: Network Rail estimates
5.2.11
There are train by train estimates of the
average number of passengers travelling
stop to stop for the Thameside route. This
data (presented in chapter 3) is provided by
c2c from its train load weighing equipment.6
This shows that standing begins at Benfl eet
suggesting that the estimates in Table 5.6
are conservative. Where standing typically
starts on each of the Thameside service
groups is shown in Table 5.7. These are the
stations from where passengers stand on an
average day on the busier services during
the morning peak.
Table 5.7: Time Spent StandingThameside
Standing From Time Spent Standing
Main Line Services Benfl eet 40 minutes
Tilbury Loop Services Grays 35 minutes
Ockenden Branch Services Ockenden 30 minutes
Source: Network Rail analysis of c2c data.
5 These estimates show stations where modelled load factors surpass 70 percent over the 3 hour peak.
6 One is not able to provide equivalent data for the Great Eastern and West Anglia routes.

83
Regional demand forecast
5.2.12
PLANET South AM models services that arrive
and depart London termini between 07:00
and 10:00. Our regional demand forecasts
for non-London trips have been modelled
using a more appropriate industry model,
RIFF Lite. This model has been used to make
unconstrained passenger demand forecasts
for non-London fl ows in the Greater Anglia
RUS area. Demand forecasts have been
made for journeys to and journeys from the
fi ve demand zones shown in Figure 5.3.
NORWICH
Peterborough
KINGS LYNN
LONDON FENCHURCH STREET
COLCHESTER
LONDONLIVERPOOL STREET
Tilbury Freight Container Terminal
Thames Haven
IPSWICH
Harwich Parkeston Quay
Harlow Mill
Middleton Towers
Whitemoor Yard
Thetford
Bury St Edmunds
Diss
SheringhamCromer
Lowestoft
Great Yarmouth
Sizewell
Felixstowe
Harwich Town
Manningtree
Clacton
Walton-on-NazeColchester
Town
Southminster
Sudbury
Braintree
Chelmsford
Shenfield
Witham
MarksTey
Southend Victoria
ShoeburynessSouthend Central
Grays
PitseaUpminister
Romford
Barking
STANSTED AIRPORT
Hertford East
Harlow Town
BISHOPS STORTFORD
CAMBRIDGE
Letchworth
Broxbourne
Stratford
Chingford
Enfield Town
Walthamstow Central
Seven Sisters
TottenhamHale
March
ELY
Key
Zone A - Peterborough to March
Zone B - West Anglia
Zone C - Anglia (Longer)
Zone D - Anglia (Shorter)
Zone E - c2c
Figure 5.3: Regional Demand Forecasting Zones

84
5.2.13
The non-London demand forecasts are shown
in Table 5.8. Table 5.8 shows the number
of trips recorded in the RIFF Lite model in
2005/06 and our ten year forecast rates of
increase for non-London journeys that start
and end in each of the zones. Within this total
we would expect considerable variation in
rates of change between stations within the
zones.
Demand sensitivities
Stansted Airport
5.2.14
The level of unconstrained rail passenger
demand at Stansted Airport outlined above
has been overlaid into the future year demand
matrix. In the data reported in this chapter
demand forecasts provided by BAA have been
used. These predictions were made using their
surface access strategy model.
5.2.15
A second (higher) demand forecast for
Stansted Airport rail passengers has also been
provided by the Department for Transport.
Both demand predictions are shown in Table
5.9. When assessing options to address gaps
for West Anglia Outer services both of these
sets of forecasts have been considered as
alternative base cases against which to test
interventions in PLANET South AM.
Table 5.8: Non-London Demand Forecasts(Annual Trips, Greater Anglia RUS Zones Outside London)
non-London Trips from Zone non-London Trips to Zone
Number of Trips, million (2005)
Forecast Change(Ten Years)
Number of Trips, million (2005)
Forecast Change(Ten Years)
Zone APeterborough – March
3.3 19.5% 3.1 16.7%
Zone B West Anglia
5.2 22.9% 5.7 20.5%
Zone C Anglia (Longer)
3.6 19.5% 3.6 19.0%
Zone D Anglia (Shorter)
6.0 17.2% 5.1 16.9%
Zone E c2c
2.9 17.1% 3.5 17.3%
Total 21.0 19.3% 21.0 18.3%
Source: RIFF Lite Demand Forecasts prepared by Network Rail

85
Source: PLANET South AM Outputs, Atkins
Tempro v5.3 Population Forecasts
5.2.16
Since Atkins completed their demand
forecasting work new Tempro (version 5.3)
forecasts of population have been made
available. Consideration has been given
to how much difference these would have
made to the demand forecasts had they been
available at the time. The change in population
relative to the average in London, the East
and South East of England is a key driver of
passenger demand predictions in the RUS.
For given changes in other key variables – e.g.
central London employment – changes in the
population level drive unconstrained commuter
demand for rail travel in the modelling
framework. The impact is determined by the
change in population (relative to the average)
for each area linked to stations in the model
and the trip rate in the catchment area for
each station.
5.2.17
The change in population - relative to the
average for London, the South East and
East – for each of the arterial routes into
London is shown in Table 5.10 for the RUS
planning assumptions and the newer ones
in Tempro V5.3. As an example, the table
shows that (if all other variables were equal)
on the Great Eastern route the newer Tempro
forecasts would have resulted in an increase
in passenger demand of six percent more
than has been predicted in the RUS in 2016,
i.e. less than 0.5 percent difference in the
predicted increase in passenger volume. In
the case of the Great Eastern and West Anglia
routes our analysis shows that there would be
very little difference in the demand forecasts
had the alternative Tempro v5.3 data been
available. Certainly, for those two routes the
differences would have been, in aggregate on
each route, within the margin of forecasting
error. However, the impact on the Thameside
route would be that the rate of increase in
passenger numbers would be about twice that
predicted in the RUS.
Table 5.9: Constrained Demand Forecast – Stansted Airport BordersAM Peak; Up Direction
2016 2021
BAA 2,167 2,663
DfT 2,490 2,856
Difference 323 (15%) 193 (7%)

86
5.2.18
There would also be some differences
because of changes to predicted trip origin
on all lines. This particularly affects the West
Anglia route. The more recent planning data
suggests that there would be greater increases
in population further out from London and less
closer in. The impact of these assumptions
being that slightly greater increases in demand
for West Anglia Outers and slightly lower
increases in passenger trips on inner services
would be expected but that in aggregate the
increase in passenger numbers would be
similar. The actual increases in the number
of trips will depend largely on where the
proposed housing increases are actually
located in the East of England and future trip
rates generated from this new housing. Those
rates will also depend on the housing type and
precise location of it (e.g. proximity to stations,
etc.) which, in turn, will depend on future
planning policy.
5.3 Freight demand
5.3.1
Chapter 4 concluded that there was scope
for growth in intermodal (especially deep sea)
and construction traffi c. In order to look at
the options for delivering freight growth, it is
necessary to assess the current path use and
future requirements in each route section.
5.3.2
Using actual train running data from TRUST
(for 12 months May 2004 to May 2005),
the key route sections in the Greater Anglia
RUS have been examined (by location and
commodity) and the results are tabulated in
the appendix. The summary of paths used,
paths planned and growth requirements are
given in Table 5.11 (all fi gures are trains per
day each way and are based on an analysis
of Thursdays as this is generally the busiest
day of the week). The future growth fi gures are
shown for both 2014/15 (based on the fi gures
from the Freight RUS) and 2023 (using the
Freight RUS fi gures for all commodities except
intermodal, proportioned up over a further 9
years). Unlike most commodities, forecasts
exist for intermodal traffi c from the ports up
to 2023 and thus the 2023 fi gures are based
on the planning inquiry numbers discussed in
Chapter 4. The only other differences between
the 2014/15 and 2023 requirements being that
a degree to which some of the freight growth
has been diverted to the cross county route in
the 2023 fi gures.
Table 5.10: Predicted Changes in Population(Relative to London, South East and East Average)
2016 2021
GA RUS Tempro v5.3 GA RUS Tempro v5.3
Thameside -50% +1% -47% +3%
Great Eastern - +6% +13% +5%
West Anglia +69% +66% +65% +61%
Source: Network Rail Analysis

87
5.3.3
Table 5.11 shows that there is a defi ciency
in currently planned paths mainly due to the
growth in intermodal traffi c from the ports.
5.3.4
Due to the predominance of the intermodal
traffi c from the East Coast Ports a timetabling
exercise was undertaken by Network Rail’s
Strategic Access Planning (SAP) unit to
assess the number of paths that could be
identifi ed on the key route sections. The
outcome is shown in Table 5.12.
Table 5.11 Freight path requirements in 2014/15 and 2023(All fi gures are paths per day each way)
Section Ave
rag
e P
ath
s U
sed
– 2
005
Max
imu
m P
ath
s U
sed
– 2
005
Pla
nn
ed P
ath
s20
05
Additional paths required by 2014/15
Ad
dit
ion
al
pat
hs
req
uir
ed
by
2023
(w
ith
so
me
div
ersi
on
to
Cro
ss
Co
un
try
rou
te)
FRUS Base Case
FRUS Sensitivity 2
Manor Park – Ilford 16 25 26 20 14 12
Maryland – Forest Gate Jn 29 39 49 22 18 21
Shenfi eld 17 25 26 20 14 13
Ipswich – Halifax Jn 21 31 27 20 14 11
Stowmarket – Haughley Jn 13 25 14 6 4 16
Whittlesea – Peterborough (East) 23 41 27 6 8 20
Base Case assumes no development of Shell Haven by 2014/15
Sensitivity 2 assumes Shell Haven developed by 2014/15
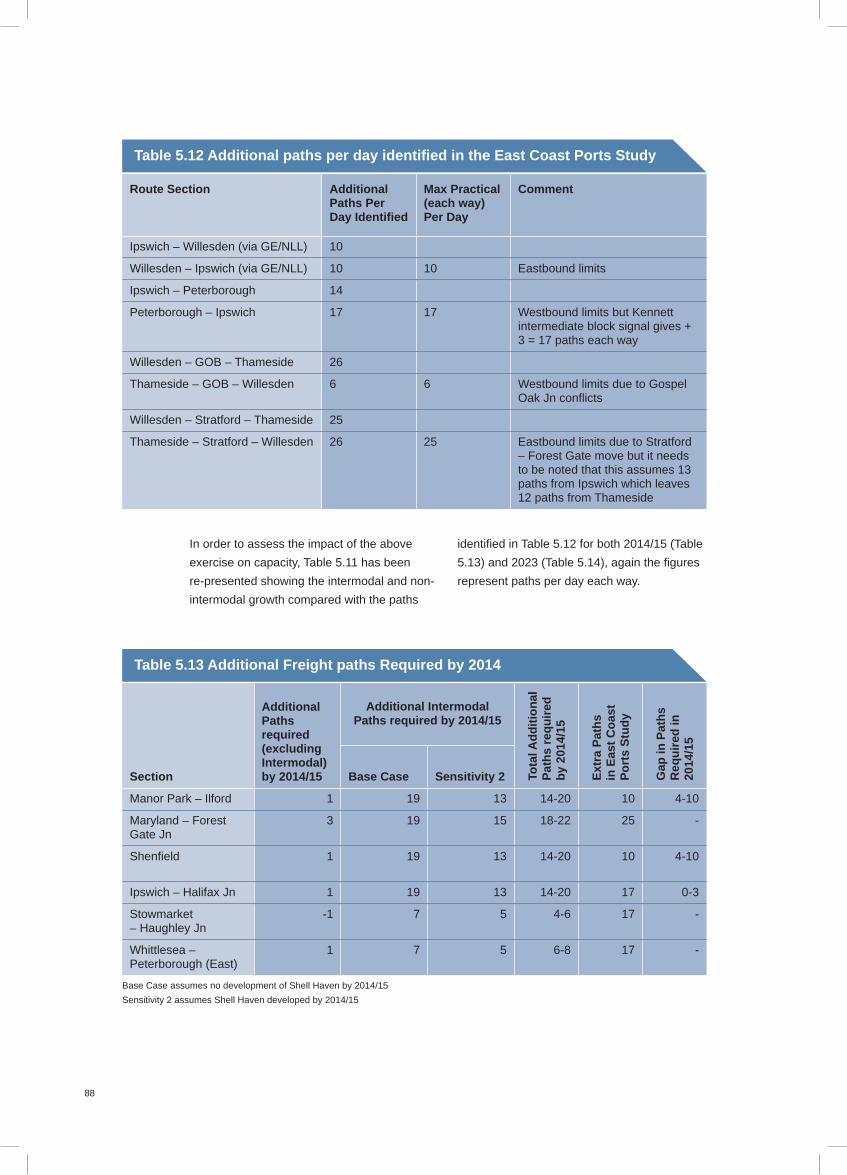
88
In order to assess the impact of the above
exercise on capacity, Table 5.11 has been
re-presented showing the intermodal and non-
intermodal growth compared with the paths
identifi ed in Table 5.12 for both 2014/15 (Table
5.13) and 2023 (Table 5.14), again the fi gures
represent paths per day each way.
Table 5.12 Additional paths per day identifi ed in the East Coast Ports Study
Route Section Additional Paths Per Day Identifi ed
Max Practical (each way) Per Day
Comment
Ipswich – Willesden (via GE/NLL) 10
Willesden – Ipswich (via GE/NLL) 10 10 Eastbound limits
Ipswich – Peterborough 14
Peterborough – Ipswich 17 17 Westbound limits but Kennett intermediate block signal gives + 3 = 17 paths each way
Willesden – GOB – Thameside 26
Thameside – GOB – Willesden 6 6 Westbound limits due to Gospel Oak Jn confl icts
Willesden – Stratford – Thameside 25
Thameside – Stratford – Willesden 26 25 Eastbound limits due to Stratford – Forest Gate move but it needs to be noted that this assumes 13 paths from Ipswich which leaves 12 paths from Thameside
Table 5.13 Additional Freight paths Required by 2014
Section
Additional Paths required (excluding Intermodal)by 2014/15
Additional Intermodal Paths required by 2014/15
Tota
l Ad
dit
ion
al
Pat
hs
req
uir
ed
by
2014
/15
Ext
ra P
ath
s in
Eas
t C
oas
t P
ort
s S
tud
y
Gap
in P
ath
s R
equ
ired
in
2014
/15
Base Case Sensitivity 2
Manor Park – Ilford 1 19 13 14-20 10 4-10
Maryland – Forest Gate Jn
3 19 15 18-22 25 -
Shenfi eld 1 19 13 14-20 10 4-10
Ipswich – Halifax Jn 1 19 13 14-20 17 0-3
Stowmarket – Haughley Jn
-1 7 5 4-6 17 -
Whittlesea – Peterborough (East)
1 7 5 6-8 17 -
Base Case assumes no development of Shell Haven by 2014/15
Sensitivity 2 assumes Shell Haven developed by 2014/15

89
This shows that the Great Eastern cannot
quite meet freight growth in the Freight RUS
Sensitivity 2 test up to 2014/15, and in the
Base Case the route is up to 10 paths short.
The situation has been examined for 2023,
showing the impact of diverting growth to the
cross country route. The results are shown in
Table 5.14.
This table together with table 5.11 shows the
following:
■ depending on the rate of port development
at Felixstowe/Bathside and Shell Haven,
there is likely to be a need to divert some
container trains via the cross country route
by 2014/15
■ by 2023 due to freight growth being
diverted to the cross country line both
routes are now tight for capacity
■ cross country has a small defi cit between
Whittlesea and Peterborough.
5.3.5
In all the assessments it has been assumed
(based on current trends in new build) that
the freight locomotive fl eet will tend to see
an increase in diesel traction (however, it is
understood that electric traction will continue
to be essential to meet timings on the WCML
north of Preston). Otherwise it is assumed
that the growth in freight traffi c will not see an
increase in electric traction for the foreseeable
future, however, this may be reviewed on
environmental grounds, but the impact of
such changes will be beyond the period of
the RUS. The future traction policy and the
extent of further network electrifi cation will,
however, have a bearing on the routeing and
diversionary opportunities for freight traffi c.
5.3.6
In order to address the small defi cit in capacity
between Whittlesea and Peterborough
forecast to occur by 2023, and to look at
pathing through to the West Coast Main Line
at Nuneaton, SAP undertook further work
(reported in the Freight RUS), which has
indicated the following:
■ If the fi rst phase of planned works are
completed (ie the following):
– Felixstowe Branch partial doubling
– improvements to Ipswich Yard
– Kennett improved headways and open
24 hrs
– fl yover at Nuneaton
– gauge clearance Ipswich –
Peterborough – Nuneaton
■ then (compared with today) it is possible to
get an additional nine tpd each way from
Ipswich to South Yorkshire and fi ve tpd
to the WCML at Nuneaton (plus three tpd
between Ipswich and Peterborough).
Table 5.14 Additional Freight paths Required by 2023
Section
Additional Paths required (excluding Intermodal)by 2023
Additional Intermodal Paths required by 2023
Total Additional Paths required by 2023
Extra Paths in East Coast Ports Study
Gap in Paths Required in 2023
Manor Park – Ilford 2 10 12 10 2
Maryland – Forest Gate Jn 5 16 21 25 -
Shenfi eld 3 10 13 10 3
Ipswich – Halifax Jn 1 10 11 17 -
Stowmarket – Haughley Jn -1 17 16 17 -
Whittlesea – Peterborough (East)
3 17 20 17 3
90
■ If a second phase of infrastructure works
were completed, then it would be possible
to get at least 14 tpd from Ipswich to the
WCML each way (as well as the nine East
Coast ports paths and the three Ipswich
– Peterborough services). Infrastructure
required is likely to be:
– Double East Suffolk Jn (to give parallel
moves to/from the Norwich Main Line
and the Felixstowe/East Suffolk Line
direction).
– Improve the run round at Barham
– Double Haughley Jn
– Provide loops at Ely
– Commission bi-directional working on
Ely West Curve
– A bi-directional loop at Peterborough (if
remodelling were to include an island
platform, this would give fl exibility
that may allow an additional hourly
passenger service as well as the extra
freight services)
– Double Syston East – South Jns
– Double the Up/Down slow line from
Syston – Wigston (also need to look at
reducing the headways to three mins).
– Long crossovers to give parallel
moves to the Glen Parva line across
the MML (also need run round for the
Burton Line). (These last three items
would need to be tied in with Leicester
resignalling in 2012 – 2015 as noted in
the Freight RUS)
– Loop east of Nuneaton
■ The current timetable does not permit an
hourly passenger service on the Ipswich
– Peterborough route in addition to the
above, mainly due to the irregular timings
of the class 6 freight services.If the
existing timetable were revisited based
on the infrastructure alterations proposed
above, a timetable could possibly be
produced which would provide an hourly
passenger service between Ipswich and
Peterborough, as well as standard class
four and six freight paths under each of the
above scenarios. A further review would
need to assess the impact on long distance
services, but may also identify additional
freight paths.
5.3.7
The lack of spare freight paths on the
Felixstowe branch was raised in Chapter 3
along with the comparatively low passenger
use. Work undertaken has indicated that only
a few additional paths would be released if the
passenger service were reduced. Therefore
the planned doubling on the branch must take
place if forecast freight demand is to be met.
5.3.8
The above section has identifi ed the need to
use both the GEML/Cross London and the
cross country routes in order to accommodate
intermodal freight growth to the WCML. The
strategy assumes that some of the growth
will be absorbed by the GEML but that the
bulk of growth will be routed via the upgraded
cross country route (which will become a
strategic freight route). The earlier discussion
on engineering access highlighted the need
for the cross country and GEML routes to act
as diversionary routes for one another, so that
both routes can be maintained in the long term
as traffi c rises.
5.3.9
The works between the ports and
Peterborough/South Yorkshire will be funded
as part of the Felixstowe South and Bathside
Bay projects under Section 106 agreements.
It is assumed that the remainder of the works
in the fi rst phase will be funded via the current
TIF submission. It is anticipated that the
second phase of works described above will
be funded as part of a further TIF submission.
5.3.10
The paths from Shell Haven need to be routed
cross-London because the connections
between the Thameside route and the rest of
the Network face westwards with no option
for trains to reverse before reaching London.

91
The option of east facing connections onto the
GEML leads to a number of problems:
■ Construction of an east facing connection
onto the GEML at Forest Gate would be
extremely diffi cult (due to land take and
environmental issues), and would lead to
severe pathing diffi culties;
■ The GEML has limited spare capacity for
freight;
■ The cross-country capacity is required for
Felixstowe traffi c; and
■ Running via Ipswich would add
considerable unproductive mileage to
journeys.
5.3.11
Shell Haven is planned to generate around
20 tpd each way (over the next 15-20 years)
and the results of the pathing analysis were
included in the Tables 5.12, 5.13 and 5.14.
5.3.12
The short to medium term strategy for meeting
intermodal growth is therefore to route the
Shell Haven traffi c via the North London Line
(NLL) and Gospel Oak - Barking route. The
Felixstowe/Bathside traffi c would use most of
the remaining off peak capacity on the Great
Eastern and then run over the NLL to the
WCML. The balance of the traffi c would run
via the cross county route. In the longer term,
in order to meet growth on the North London
Line, it may be necessary to divert more
intermodal traffi c destined for the WCML to the
cross country route.
5.3.13
In the Construction Materials market, the
earlier analysis has included the growth
forecast for this traffi c and has shown the
there are suffi cient paths to meet this growth.
5.3.14
Given the fact that 40 percent of London’s
aggregate is delivered by rail and a number of
terminals are wholly rail served, there is little
scope for diversion of any traffi c away from
London to relieve the current paths. Whilst it
is assumed that the number of trains per day
to the various terminals will change with the
construction market (with local peaks such as
the Olympic works), the overall volumes and
patterns of feed from the quarries are unlikely
to change dramatically and thus it is assumed
that the above additional paths will be found
on the existing routes to meet growth.
5.3.15
In the International sector, it has already
been noted that Channel Tunnel traffi c will
interchange at Barking, however, overall the
growth in this and other traffi c is assumed to
be accommodated within the existing paths.
5.3.16
The ability to meet freight growth from
Felixstowe and Bathside Bay through the
operation of longer trains has been examined
in the Freight RUS. Whilst the Thameside
to North London Line route allows the
operation of 775m trains (36 wagons plus 2
locomotives), investigations show that the
GEML and cross country routes can only
operate 24 wagon intermodal trains. The
restriction is caused by a number of factors,
principally terminal capacity, the restricted
length of Ipswich yard and the ability of class
66 locomotives to meet point-to-point timings
with longer trains. Any further alteration to
Ipswich yard beyond the essential HPUK
works would not take place until the Ipswich
area is resignalled in around 2015.

92
5.3.17
The Freight RUS remitted a number of gaps
for the Greater Anglia RUS to address and
these have been covered by the above
analysis (as well as the proposals developed
in the Cross London RUS). Table 5.15
summarises the gaps and the mitigations.
5.4 Summary of gaps identifi ed
5.4.1
The analysis carried out in Chapter 4 and 5
emphsises that the gaps identifi ed in Chapter
3 will get worse under forecast growth.
Additionally Chapters 4 and 5 identify other
gaps, which are summarised as follows:
1) Between existing service frequencies and
the Mayor‘s objective of four tph all day on
suburban routes.
2) Between existing freight capacity and
forecast demand (especially for intermodal
and aggregate traffi c).
Table 5.15 Freight RUS gaps
Gap Location Issue Mitigation
D Stratford – Camden Road
Interface with access to/ from the GEML
Loops proposed at Channelsea and Stratford 10a to regulate freight services. Former funded by TfL under NLL upgrade and the latter probably via the ODA/Network Rail Outperformance Fund.
E GEML Available class 4 and 6 paths between off peak passenger services
GA/CL RUS strategies propose use of Great Eastern off peak freight paths plus upgraded cross country route in order to meet freight growth.
E-F Haughley Jn – Peterborough
Single Lead at Haughley JnHeadways at KennettConfl ict at Ely
The removal of these restrictions is being taken forward for potential NRDF funding. Failing this it is assumed that these will be funded through a TIF submission.
G-H Forest Gate - Channelsea
Confl icting moves on the GEML
The Greater Anglia and CL RUS strategies propose the use of an upgraded Gospel Oak – Barking route to take some of the traffi c away from Stratford. This is being pursued via engineering renewals, TIF and TfL funding.

93

94
6.1 Introduction
6.1.1
This chapter looks at the recent improvements
to the route and also covers the committed
enhancements over the next 10 years. It
also looks at the renewals programme, so
that the opportunities for considering any
enhancements proposed by the RUS can be
taken into account when planning renewals.
6.2 Recently completed schemes
6.2.1
Whilst no major enhancement work has been
carried out in recent years, signifi cant gauge
clearance works have been undertaken to
clear the GEML and the Thameside route,
so that W10 containers can be conveyed on
standard freight wagons on the main routes
from the region’s ports to the West Coast Main
Line.
6.2.2
Under the terms of their franchise ‘one’ have
funded the extension of platforms at some
stations and SDO at others on the Braintree
branch to accommodate 12-car trains and the
extension of the bay platform at Cheshunt, so
that 8-car trains can terminate.
6.2.3
Within the last 10 - 12 years Railtrack/Network
Rail have completed the resignalling of the
GEML out to Marks Tey; the West Anglia route
out to Elsenham and Stansted and the whole
of the c2c route.
6.3 Committed enhancement schemes
6.3.1
There are a number of committed schemes
affecting the route, most of which are
concentrated in the Stratford area.
■ Stratford Stations
Stratford International Station on the
CTRL has been completed. Work has
now commenced on the Stratford City
Development (SCD). The Section 106
provisions negotiated with the developer
include a new northern ticket hall to the
existing Stratford Station, now more
usually called Stratford Regional Station.
Pedestrian routes between both stations
and between the SCD and Stratford
Regional Station have been negotiated
through the planning process.
Stratford station capacity works also
include re-opening the eastern subway
and decluttering platforms. These works
will provide step free access and will
include lifts to all platforms.
London Underground have proposals for
capacity enhancement of the existing LU
Ticket Hall as well as the PPP provisions
for a station refurbishment at Stratford
and the enhancement of the Jubilee Line
service.
■ Docklands Light Railway (DLR)
In addition to the new terminating platforms
at Stratford and the extension to City
Airport, the DLR has also commenced
work on providing a link between
Stratford International and Woolwich
Arsenal, running over the North London
Line between Stratford (Low Level) and
Canning Town. The project involves
the construction of two new high level
terminating platforms for the North London
Line services adjacent to Platforms 11 and
12 (planned for 2009).
6. Forecast of change – committed schemes

95
■ The London 2012 Olympic Games and
Paralympic Games (“The Games”)
As Stratford will be the focus of the
Games, Network Rail and Transport
for London are working closely with the
Olympic Delivery Authority to ensure
required infrastructure enhancements are
in place well in advance. The schemes
currently in development include the
following:
a) Extension of Platforms 11 and 12 at
Stratford to accommodate 8-car trains, plus
an additional crossover and bi-directional
signalling. These facilities will improve the
turnround on services running to/from the
West Anglia route.
b) Relocation of the Great Eastern carriage
stabling sidings from Thornton Fields.
d) Possible provision of closing up signals on
the Great Eastern fast lines approaching
Stratford from the east to improve
performance.
e) Extension of Platform 10a to allow 12-car
trains to call and extension of the platform
track to allow an eastbound freight loop to
be provided.
f) The Olympic Park proposals also include
the construction of a number of bridges
over the railway to provide access to the
venue.
g) West Ham will provide another access
point to the Games and closing up signals
enabling more trains to call there are
proposed.
■ Grays 8-car Bay Platform
Funded by NRDF, the bay platform at
Grays is to be extended to eight cars to
permit the operation of more 8-car trains
on the Tilbury Loop.
■ Cambridge Guided Bus scheme
This scheme is now underway and will see
improved access to Cambridge station
from St Ives/Huntingdon, the Science Park,
Addenbrooks Hospital and Trumpington.
Further developments in the Cambridge
area are likely to include the forecourt
redevelopment and the proposal for a
new station and transport interchange at
Chesterton sidings.
■ New stations to serve proposed
developments
Network Rail is working with a number
of developers, who are considering the
provision of new stations to serve their
developments. Whilst none of these
stations is yet committed and many are still
subject to assessment of their impact on
capacity, if and when they are built they will
improve access to the network.

96
6.4 Renewals
6.4.1
Major renewals offer the ability to consider
synergy with enhancements and align
capability with future requirements
(the policy regarding gauging and track
renewals being contained in the Freight RUS).
Details of renewals over the next 3 - 5 years
are contained in the Route Plan volumes of
Network Rail’s Business Plan, which were
published in March 2007. The scope for
synergy with RUS enhancements is limited,
but on an asset by asset basis the situation
can be summarised as follows:
■ Signalling
Colchester – Clacton Resignalling
This project is now underway and resignals
the Clacton Branch and the GEML
(between Marks Tey and Colchester). The
scheme incorporates provision for the
platform extensions required by Essex
County Council, as well as including
bi-directional signalling between
Marks Tey and Colchester.
■ Other signalling
The main scope for combining renewals
and enhancements is on the rural sections
of the route. On the East Suffolk Line work
will commence within the next few years
and consideration will need to be given
to the replacement of the RETB system.
This may be dependant on ERTMS
radio based signalling, which is unlikely
to be implemented before 2012. On the
remaining rural branches life extension
works will be carried out until the policy
on the introduction of ERTMS radio based
signalling is confi rmed.
■ Track
On the Great Eastern and West Anglia
route a number of S&C and plain line
renewals are planned, these include
Shenfi eld, Colchester and Clacton S&C
renewals, together with a number of
plain line renewals. Owing to a lack
of funding for advanced works on the
Crossrail project, it has not been possible
to incorporate these within the S&C
renewals at Shenfi eld, however, renewals
are reviewed regularly by the route, with a
view to incorporating enhancements when
sensible. The main opportunity identifi ed
on these routes cover the potential to raise
speeds on the rural routes in conjunction
with track renewals.
■ Electrifi cation
There is extensive work planned to
renew the over head line on the GEML
between Liverpool Street and Chelmsford/
Southend, this should also enable some
speed restrictions to be removed. On the
Thameside route theis also being replaced
on sections of the main line.

97

9898
7. Strategic Options
7.1 Summary of gaps
7.1.1
The purpose of the RUS is to meet the route
utilisation objective quoted in Section 1.1.
Analysis of the current position and expected
changes has revealed gaps between what the
railway system delivers and what is required.
These are summarised in Table 7.1.
Table 7.1: Identifi cation of Gaps
No. Nature of Gap Key Issues
1 Between existing/forecast peak capacity and train service and/or infrastructure capacity
Need to increase peak capacity across all routes by train lengthening, frequency and infrastructure improvements
2 Between existing/forecast rural/inter-urban train service capacity/frequency and required capacity/frequency
Need to increase train service capacity/ frequency on rural/inter-urban routes
3 Between existing access to Stratford/Docklands and that required to meet market needs
Lack of services that call at Stratford on the West Anglia and Great Eastern outer services and at West Ham on the Thameside route
4 Between existing service frequencies and the Mayor’s objective of 4 tph all day on suburban routes
Lack of service frequency on certain routes
5 Between existing freight capacity and forecast demand (especially for intermodal and aggregate traffi c)
Lack of paths to meet growth also identifi ed as gaps D-H in the Freight RUS
6 Between existing freight gauge, train length and route availability and desired gauge and capability
RA, loading gauge and train length
7 Between current and desired performance Level crossings, Rules of the Route compliance,failures, turnrounds on rural lines, scope for performance improvements
8 Between existing engineering access and desired access regimes especially on the Stansted, suburban and cross country routes
Need for extended operating hours on certain routes. Clash between engineering access/isolations and use of berthing
9 Between current power supply and that required for future services/rolling stock
Limited capacity in existing supply for passenger and freight services
10 Between current passenger access to train services and that required to meet future needs
Car parking, DDA compliance, crowding, interchange and provision of new stations
11 Between current berthing capacity and future requirements
Berthing capacity required for additional trains

9999
7.2 Option defi nition
7.2.1
Each gap was considered using a standard
‘toolkit’ of types of solution, and those, where
applicable, were developed into options.
These options were then reviewed and agreed
by the key stakeholders prior to testing.
Options were tested in isolation to assess
their impact, however, further optimisation/
combination of the options will be required
when working towards the fi nal strategy. Most
options can be combined although others,
such as the East Suffolk and Saxmundham
options, would be mutually exclusive. A brief
description of the options is given in Table 7.2
and it will be noted that some are related to
performance improvement or enhancement
schemes, which are currently being
developed.
Table 7.2: Initial Options
Option 1: Lengthen peak services on the Thameside Main LineWe tested extending trains to 12-car to accommodate increases in passenger demand. This is intended to alleviate crowding for passengers and to handle predicted demand growth. This would require additional rolling stock but no infrastructure.
Option 2: Lengthen peak services on the Tilbury Loop and Ockendon BranchWe tested extending trains to 12-car to accommodate increases in passenger demand. This is intended to alleviate crowding for passengers and to handle predicted demand growth. In addition to a requirement for additional rolling stock, platforms on the Tilbury Loop and Ockendon branch would be extended to accommodate the longer trains.
Option 3: Replace inter-city rolling stock on Anglia inter-city services We tested replacing inter-city sets with more up to date rolling stock - assumed to be similar to class 444 currently used on SWT’s long distance services – on the Anglia inter-city route. Class 444s operate as 5 x 23m units and are confi gured as low seating density units (2 + 2) to retain standards of passenger comfort. This would increase seated capacity on the services by almost 50 percent. An alterative would be to deploy Intercity Express trains when they enter service, or other similar long distance multiple units. In testing this option the costs of class 444 rolling stock has been considered.
Option 4: Run two additional Great Eastern outer services in the high peak hourWe tested running two additional trains in the high peak hour, one starting from Colchester Town and the other starting from Chelmsford. This is intended to alleviate crowding for passengers and to handle predicted demand growth.
Option 5: Call all Great Eastern outer services at StratfordWe tested changing calling patterns so that all services on the GEML will stop at Stratford. This is intended to provide a direct link between Norwich, Ipswich and Stratford and improve connectivity between the Eastern region and London Docklands/other transport links at Stratford including JLE/CTRL. It is expected that the proposal would even-out passenger loadings between Great Eastern outer services. Stratford Platform 10a would need to be extended to handle 12-car trains in order to implement this option.
Option 6: Run additional peak services on the Great Eastern from Gidea ParkWe tested running nine extra services on the Great Eastern inners over the three peak hours. This is intended to alleviate crowding for passengers and to handle predicted demand growth.
Option 7: Lengthen peak services on the Chingford routeWe tested operating 9-car trains on the Chingford Branch of the West Anglia route. The existing infrastructure can accommodate 9-car trains on that route (although a check against modern standards is required). This is intended to alleviate crowding for passengers and to handle predicted demand growth.

100
Option 8: Lengthen West Anglia services between Cambridge/Stansted Airport and London to 12 carsWe tested operating 12-car trains during the peak on West Anglia outer services to/from Cambridge and Stansted Airport. This increases seated capacity by about 50 per cent during the peak. This is intended to alleviate crowding for passengers and to handle predicted demand growth. Some stations on the route can already handle 12-car trains but currently no services operate in more than 8-car formation. The option requires platform extensions (or SDO) at a number of stations.
Option 9: Lengthen Hertford East – London services to 12 carsWe tested operating 12-car trains during the peak on West Anglia services running to/from Hertford East and Broxbourne. This increases seated capacity by around 50 percent. This is intended to alleviate crowding for passengers and to handle predicted demand growth. All platforms north of Tottenham Hale to Hertford East would need to be extended (or SDO introduced) to handle the longer trains.
Option 10: Operate 9-car trains from Enfi eld TownWe tested operating 9-car trains on this route to add around 12 percent capacity to peak services. This would alleviate crowding and contribute toward handling predicted demand growth on the route. The infrastructure (except at Stoke Newington) can accommodate 9-car trains (subject to a check against modern standards). In our estimates the use of SDO at Stoke Newington has been assumed because it is expected that the cost of extending the platform there would be very high.
Option 11 – Operate shuttle services between Cheshunt and Seven SistersWe tested operating an 8-car shuttle service between Seven Sisters and Cheshunt in the busiest peak hour. Capacity is available over this route for the two trains an hour if an improved turn-back facility is provided south of Seven Sisters.
Option 12: Increase capacity on the West Anglia Main LineWe proposed increasing line capacity on the West Anglia route and tested an illustrative train service specifi cation, which comprised the operation of eight extra services an hour on the West Anglia main line. Two of these (starting at Stansted Airport) are tested as operating through to Liverpool Street. The other six would run to and terminate at Stratford. Two each of these are tested to serve Hertford East, Stansted Airport and Cambridge. In combination with these service changes running longer trains has been tested on Stansted Airport services and semi-fast Cambridge services, which would only serve those stations that can already handle 12-car trains. This is intended to provide suffi cient capacity to handle predicted increases in passenger numbers and to provide regular direct rail links between all stations on the West Anglia main line and London Docklands. Operating these additional services would require signifi cant capacity increases between Broxbourne Junction and Coppermill Junction as well as investment in rolling stock.
Option 13: Increase frequency of Ipswich – Peterborough services to hourly.We tested operating a regular hourly service between Ipswich and Peterborough throughout the day.
Option 14: Increase frequency of East Suffolk Line services to hourlyWe tested operating a regular hourly service on the East Suffolk Line between Ipswich and Lowestoft throughout the day. This requires the building of a new passing loop at Beccles.
Option 15: Provide an hourly service between Ipswich and SaxmundhamWe tested operating a regular hourly service between Ipswich and Saxmundham throughout the day.
Option 16: Increase capacity on rural/inter-urban services to meet peak demandThis option proposes strengthening a number of services to increase peak capacity on services radiating from the regional centres of Cambridge, Norwich and Ipswich.
Option 17: Increase freight gauge, train length and capacity on the Felixstowe – Nuneaton routeThis option describes the two phases of work required to meet freight growth to both 2014/15 and 2023 by enhancement of the cross country route.
Option 18: Improve the Route Availability for freight traffi c on the Ipswich – Peterborough routeHeavier freight trains are subject to speed restrictions on the cross country route and this option proposes works to remove these restrictions.
Option 19: Improve performance through a range of measuresThe key stakeholders identifi ed a number of performance initiatives following a review of the performance analysis work. These include: Investigate closure of the level crossings in the Lea Valley; review the Rules of the Plan; prevent further seriousfailures; improve turnarounds on rural services; carry out a range of performance improvement schemes using NRDF funding, including fully commissioning Ely West Curve.
Table 7.2: Initial Options (continued)

101
7.2.2
Table 7.3 shows which gaps are addressed by
which options. It should be noted that some
gaps may only be partially addressed by
individual options, and conversely that some
options may address more than one gap.
Option 20: Improve the effi ciency of Engineering AccessThe RUS analysis has identifi ed a number of areas where the disruption caused by engineering work could be reduced. These areas include: longer operating hours, reducing the impact on berthing and depots and improving engineering access on the cross country route, whilst increasing overnight freight capacity.
Option 21: Improve the power supply to match future requirementsAs part of the RUS analysis work, Network Rail’s Electrifi cation and Plant Engineer has been asked to assess the increased power requirements in order to accommodate the predicted changes in train service and rolling stock requirements.
Option 22: Improve passenger access to the networkAnalysis carried out for the RUS, including the car park study by Passenger Focus, has shown that improving station facilities may be benefi cial in a number of areas.
Option 23: Improve berthing capacityThe analysis of berthing capacity has shown that the current facilities are nearly at capacity and additional berthing will be required if there are signifi cant changes in rolling stock volumes.
Table 7.3: Gap/Options Matrix
No. Nature of Gap Option by which Gap Addressed
1 Between existing/forecast peak capacity and train service and/or infrastructure capacity
Options 1–12
2 Between existing/forecast rural/inter-urban train service capacity/frequency and required capacity/frequency
Options 13,14,15,16
3 Between existing access to Stratford/Docklands and that required to meet market needs
Options 5,12,22
4 Between existing service frequencies and the Mayor’s objective of 4 tph all day on suburban routes
Options 6,11,12
5 Between existing freight capacity and forecast demand (especially for intermodal and aggregate traffi c)
Option 17
6 Between existing freight gauge, train length and route availability and desired gauge, length and capability
Options 17,18
7 Between current and desired performance Option 19
Table 7.2: Initial Options (continued)

102
7.3 Assessment of options
7.3.1
Each of the options outlined in the RUS has
been assessed. Options intended to address
increased passenger demand and on-train
crowding have been tested using industry
standard models. Options for changes to
services into London have been modelled
by Atkins, using PLANET South AM . We
have also drawn on analysis conducted by
Arup (for TfL) that modelled service changes
in Railplan. For non-London passenger
demand options where over-crowding is not
a signifi cant issue, the intervention has been
modelled using MOIRA.
7.3.2
For each of options 1 to 15 the costs and
benefi ts have been quantifi ed by applying DfT
appraisal values to the model outputs.These
have been tabulated with summary information
in the rest of this section. The benefi ts and
costs are those associated with each option
if implemented individually. In some cases
options are complementary. Others would
work less well if grouped together as a
package. None has been optimised in terms
of timetabling or utilisation of rolling stock; and
none has been subject to detailed operational
testing and performance modelling at this
stage. The benefi t cost ratios are not intended
to be used to determine strategy by choosing
schemes from the list. The summaries are
intended to be informative, indicating the
type and size of interventions that will, say,
meet crowding targets, deliver value for
money for funders and communicate whether
the interventions will handle future levels of
demand.
7.3.3
A number of assumptions have been made
when evaluating the options. The key general
assumptions are:
■ Options modelled in PLANET are tested as
if implemented in 2016
■ Options modelled in MOIRA are tested as
if implemented in 2008
■ All value estimates are presented as 2002
present values in 2002 prices
■ Cost estimates include an adjustment for
optimism bias
■ Non-user benefi ts include only the highway
decongestion elements (but not reduced
fuel duty collected by the exchequer)
■ Benefi t cost ratios are calculated as:
(User Benefi ts + Non-user benefi ts)
[(Capital cost + Operating cost)-Revenue]
8 Between existing engineering access and desired access regimes especially on the Stansted, suburban and cross country routes
Option 20
9 Between current power supply and that required for future services/ rolling stock
Option 21
10 Between current passenger access to train services and that required to meet future needs
Option 22
11 Between current berthing capacity and future requirements Option 23
Table 7.3: Gap/Options Matrix (continued)

103
Assessment of Option 1: Lengthen peak services on the Thameside Main Line
Concept
This option proposes that all main line peak services are strengthened to 12-car formations to meet passenger demand.
Operational analysis
This option will require adjustments to the working of trains at Fenchurch Street.
Infrastructure Required
No major infrastructure will be required as 12-car services already operate on the route, however, additional platform equipment may be required to assist the dispatch of more 12 car trains. Power requirements will need to be checked.
Crowding Impact
Extending trains across the peak would provide suffi cient additional capacity to meet predicted increases in passenger demand to both 2016 and 2021 while maintaining average load factors in the high peak hour and over the three peak hours.
Freight impact
There would be no impact on freight services from implementing this option.
Financial and economic analysis
As this option requires no identifi ed infrastructure investment and trains can be lengthened to meet increasing demand this option has not been modelled in PLANET. TfL had tested two variants of the option using Railplan – selected train lengthening and lengthening all trains – and both of these generated benefi t cost ratios of around 2.
Conclusion
This option allows capacity to be met as demand rises and requires no infrastructure development on the route.
Assessment of Option 2: Lengthen peak services on the Tilbury Loop and Ockendon Branch
Concept
Extend all platforms to 12-car length and run peak trains at a minimum of 8-car formation with 12-car running in the busiest hour of the peak.
Operational analysis
This option will require adjustments to the working of trains at Fenchurch Street.
Infrastructure Required
The platforms on the Tilbury Loop and Ockendon branch would need to be extended to 12-car length and additional platform equipment will be required to facilitate the dispatch of 12-car trains. A check on power supply will also be required.
Crowding Impact
This option provides capacity to meet demand in both 2016 and 2021. By 2016 crowding would be below current levels on the Ockendon branch and Tilbury Loop, on average.
Freight Impact
There would be no impact on freight services from implementing this option.

104
Assessment of Option 2 (continued)
Financial and economic analysis
The option was modelled in PLANET and outputs were valued following DfT appraisal guidance. The results are shown in the table:
£million (2002 PV)
Cost (PV)
Investment cost 24
Operating Cost 206
Revenue -82
Total Cost 148
Quantifi ed Benefi t (PV)
Rail user benefi ts 176
Non user benefi ts 16
Total quantifi ed benefi ts 191
Quantifi ed BCR 1.3
Conclusion
This option allows trains to be lengthened to suit the rates of development on the route and offers some fl exibility in our approach to meeting increased passenger demand. The busiest trains operate via Ockendon and it is worth examining whether a stronger business case can be developed by phasing the intervention.
Assessment of Option 3: Replace inter-city rolling stock on Anglia inter-city services
Concept
This option replaces the Anglia inter-city sets with up-to-date rolling stock to increase capacity on these services. The impact is to increase seated capacity by a little under 50 percent.
Operational analysis
This option does not require timetable changes.
Infrastructure Required
This option will require works to permit the new trains to be operated, including any gauge, berthing and power supply works. Our initial view is that the capital costs associated with this will not be signifi cant.
Crowding Impact
Standing is eliminated on Anglia inter-city services to beyond 2021. The capacity increase at Colchester also helps alleviate crowding on Great Eastern outer services but average load factors across the inter-city and outer services would be at similar levels as in 2004/05.
Freight impact
There would be no impact on freight services from implementing this option.

105
Assessment of Option 3 (continued)
Financial and economic analysis
The option was modelled in PLANET and outputs were valued following DfT appraisal guidance. The results are shown in the table:
£million (2002 PV)
Cost (PV)
Investment cost 2
Operating Cost 151
Revenue -303
Total Cost -150
Quantifi ed Benefi t (PV)
Rail user benefi ts 627
Non user benefi ts 54
Total quantifi ed benefi ts 681
Quantifi ed BCR Financially Positive
Our analysis shows a very strong case for increasing capacity on this route. The scheme has been described as fi nancially positive because the discounted fl ow of predicted revenue is greater than the discounted capital and operating costs of the intervention.
Conclusion
This option adds suffi cient seated capacity to accommodate existing passenger demand and increases predicted over the next ten to fi fteen years, although the required ratio of standard to fi rst class seating would need to be checked to confi rm the fi nal seating provision. The option also provides a modern homogenous fl eet, which could be operated in 5-car formations - at times of the day when demand is lower - to reduce running costs.
Assessment of Option 4: Run two additional Great Eastern outer services in the high peak
Concept
This option proposes running two additional 12-car trains in the high peak hour, one from Colchester Town and one from Chelmsford.
Operational analysis
Provided Platform 10a at Stratford is lengthened and all outer services stop at Stratford (see option 5), then the extra trains can be operated without further modifi cation to infrastructure on the route. The impact on performance has been assessed in RailSys. This work estimated that performance would improve in the Up direction during the morning peak, but that the average delay per train would worsen by 12 seconds in the Down direction, because of extended journey times (and tighter timetabling) for trains using Platform 10a.
Infrastructure Required
This option will require Platform 10a at Stratford to be lengthened. This was not considered in the initial fi nancial and economic analysis of this option (reported below). The additional requirement, if any, for power supply also needs to be established.
Crowding Impact
This option does not provide enough capacity to accommodate predicted increases in passenger numbers to 2016 on the GEML. There is little impact in the model: there is no impact, for example, on how far out passengers have to start standing in the high peak hour.
Freight impact
As services run in the high peak there would be no impact on freight services from implementing this option.

106
Assessment of Option 4 (continued)
Financial and economic analysis
The option was modelled in PLANET and outputs were valued following DfT appraisal guidance. The results are shown in the table:
£million (2002 PV)
Cost (PV)
Investment cost -
Operating Cost 108
Revenue -102
Total Cost 6
Quantifi ed Benefi t (PV)
Rail user benefi ts 184
Non user benefi ts 19
Total quantifi ed benefi ts 204
Quantifi ed BCR 32.7
Our analysis shows a strong case for increasing peak service frequency and passenger capacity at stations along the Great Eastern route.
Conclusion
The option could generate substantial socio-economic benefi ts and offers strong value for money. It is inadequate on its own to meet rising passenger demand and has little impact on crowding on the service group, however, combining this option with others and provision of more capacity in the shoulder peak is likely to enable demand to be met.
Assessment of Option 5: Call all Great Eastern outer and Anglia inter-city services at Stratford
Concept
This option proposes calling all services on the Great Eastern outer and Anglia inter-city services at Stratford. This is intended to provide a direct link between Norwich, Ipswich and Stratford and improve connectivity between the Eastern region and London Docklands. It is also expected that the proposal would even out passenger loadings between Great Eastern outer services.
Operational analysis
Platform 10a at Stratford would have to be extended to handle 12-car trains. Closing up signals could also improve performance approaching Stratford but are not required for all services to stop. If the loop is extended to allow freight services to stand clear of the GEML (as proposed in the Cross London RUS) then performance would be improved signifi cantly (relative to having no facility for standing freight off the GEML or NLL).
Infrastructure Required
This option will require Platform 10a at Stratford to be lengthened.
Crowding Impact
By evening out loadings between trains for passengers who want to disembark at Stratford there would be some de-crowding benefi ts, but these are not predicted to be substantial in the model.

107
Assessment of Option 5 (continued)
Freight impact
We have tested calling all peak services at Stratford so there would be no impact on freight from the extra calls proposed. If the service pattern change were implemented all day then there may be some impact on freight, although it is likely that all Down main line services would continue to use Platform 10 in the off peak. If the loop were extended as proposed (and costed in this appraisal of passenger impacts) then it would provide a facility to regulate freight services.
Financial and economic analysis
The option was modelled in PLANET and outputs were valued following DfT appraisal guidance. The results are shown in the table:
£million (2002 PV)
Cost (PV)
Investment cost 25
Operating Cost 0
Revenue -8
Total Cost 17
Quantifi ed Benefi t (PV)
Rail user benefi ts -64
Non user benefi ts 2
Total quantifi ed benefi ts -63
Quantifi ed BCR -3.7
The model outputs show that the impacts of this scheme are about neutral on passengers overall, i.e. the convenience of the improved connectivity is off-set by additional journey time to and from Liverpool Street. This is valued as a net disbenefi t when applying the DfT values of time in the appraisal because of the balance of the types of passenger (business, leisure and commuters) between those who prefer greater frequency to Stratford and those who would rather get to Liverpool Street more quickly.
Conclusion
The option has a poor socio-economic case within the appraisal framework, despite enhancing journey opportunities signifi cantly and allowing ‘one’ to serve Docklands more effectively. If two additional services (Option 4) were to be delivered then all services would have to stop at Stratford on the GEML. This option meets a number of objectives including spreading peak loads and improving access to one of London’s key business centres.
Assessment of Option 6: Run additional peak services on the Great Eastern from Gidea Park
Concept
This option proposes running nine extra trains during the morning peak between Gidea Park and Liverpool Street. Four extra trains in the busiest hour and fi ve across the two shoulder peak hours have been tested.
Operational analysis
On-going analysis for the RUS has found that pathing four additional trains in the busiest hour does not appear to be possible within the existing infrastructure. Three trains an hour could be fi tted in (compared to the 2004 timetable). These may need some additional infrastructure: the construction of a loop at Chadwell Heath to assist with turning trains back early is being investigated. In developing this option, performance modelling in RailSys will be needed.
Infrastructure Required
A new loop may be required at Chadwell Heath. Power supply requirements are yet to be established.

108
Assessment of Option 6 (continued)
Crowding Impact
Nine extra morning peak trains in 2016 would maintain passenger conditions at 2004/05 levels.
Freight impact
As these services are peak only this option has no impact on freight.
Financial and economic analysis
The option was modelled in PLANET and outputs were valued following DfT appraisal guidance. The results are shown in the table:
£million (2002 PV)
Cost (PV)
Investment cost 6
Operating Cost 210
Revenue -5
Total Cost 212
Quantifi ed Benefi t (PV)
Rail user benefi ts 253
Non user benefi ts 1
Total quantifi ed benefi ts 254
Quantifi ed BCR 1.2
Conclusion
The option, as proposed, provides suffi cient peak capacity on the Great Eastern inners to maintain crowding conditions until 2016 but is not fully deliverable within the existing infrastructure. A reduced scheme is unlikely to provide suffi cient passenger capacity to maintain crowding at current levels. This option needs to be developed in conjunction with other measures, such as alteration to stopping patterns, to improve capacity. The development of Crossrail may also assist with longer term capacity gains.
Assessment of Option 7: Lengthen the peak services on the Chingford route
Concept
This option proposes lengthening trains on the Chingford route to a maximum of 9-car during the peak. The current infrastructure allows for 9-car running (although this is subject to a check against modern standards).
Operational analysis
This option does not necessitate changes to the timetable. Current practice is to diagram some of the Chingford trains to operate on other routes on West Anglia, so if longer trains were run on the Chingford branch it would be necessary to either: ensure that the longer rolling stock is diagrammed to routes that it can operate over; and/or re-timetable and re-diagram the route. It would be necessary to ensure that the diagramming of the longer trains does not cause operational diffi culties.
Infrastructure Required
It is currently assumed that no infrastructure is required on the Chingford route to accommodate 9-car trains. The adequacy of power supply on the route needs to be established.
Crowding Impact
Lengthening 8-car trains to 9-car adds around 12 percent to capacity. On the Chingford route this would be suffi cient to maintain current travelling conditions until 2012/13 (at predicted rates of passenger demand increases). Some rolling stock on this route provides low seat density (relative to class 315 units which operate most services) and in the shoulder peak some trains are operated in 4-car formations. It is expected that switching all peak trains to 9-car running would provide suffi cient capacity over the peak to accommodate predicted increases in demand until 2016.

109
Assessment of Option 7 (continued)
Freight impact
There would be no impact on freight services from implementing this option.
Financial and economic analysis
The option was modelled in PLANET and outputs were valued following DfT appraisal guidance. The results are shown in the table:
£million (2002 PV)
Cost (PV)
Investment cost -
Operating Cost 38
Revenue -1
Total Cost 37
Quantifi ed Benefi t (PV)
Rail user benefi ts 50
Non user benefi ts -
Total quantifi ed benefi ts 50
Quantifi ed BCR 1.3
Conclusion
Operating 9-car trains on the Chingford branch of the West Anglia route would provide suffi cient capacity to accommodate predicted increases in passenger numbers until 2016 though our appraisal of the modelled impacts suggests that the case for doing so is not strong on a stand-alone basis. Consideration needs to be given to how the option interacts with the running of other inner services on the West Anglia route.
Assessment of Option 8: Lengthen peak services between Cambridge/Stansted Airport and London Liverpool Street to 12-car
Concept
This option proposes lengthening all platforms between Cambridge and Cheshunt to accommodate 12-car trains and operating longer trains (up to 12-car) during the peaks. This increases seated capacity by around 50 percent which is intended to accommodate the increase of the 53 percent increase in morning peak journeys to London that is predicted for the outer services to 2016.
Operational analysis
No changes to the timetable are required. Other requirements, particularly platform occupation at Liverpool Street and Stansted Airport, need to be established.
Infrastructure Required
Some platforms on the West Anglia route can already handle 12-car trains. Platform extensions (or SDO equipment) would be required at: Cheshunt, Broxbourne, Roydon, Harlow Mill, Sawbridgeworth, Stansted Mountfi tchet, Elsenham, Newport, Great Chesterford and Shelford. It is also thought that a new island platform will be required at Cambridge to allow these services to operate, as well as proposed increases in 12-car operation on the Great Northern route to Kings Cross. At this early stage there is no assessment of power supply and berthing needs nor track circuit occupation or platform use at terminal stations.
Crowding Impact
Our demand forecasts indicate that this option would provide too much passenger capacity on the route north of Stansted Mountfi tchet but not enough further south. The intervention provides enough capacity to maintain current average morning peak load factors until 2016.

110
Assessment of Option 8 (continued)
Freight impact
There would be no impact on freight services from implementing this option.
Financial and economic analysis
The option was modelled in PLANET and outputs were valued following DfT appraisal guidance. The results are shown in the table:
£million (2002 PV)
Cost (PV)
Investment cost 100
Operating Cost 362
Revenue -245
Total Cost 218
Quantifi ed Benefi t (PV)
Rail user benefi ts 264
Non user benefi ts 38
Total quantifi ed benefi ts 302
Quantifi ed BCR 1.4
The analysis indicates that there is too much capacity being added for passengers north of Stansted Mountfi tchet. This suggests that a stronger socio-economic case would develop if operating costs were reduced by optimising the allocation of additional capacity. A demand sensitivity case provided by the DfT (which estimates increases in passenger demand from the Stansted area about 15 percent greater than those estimated in the RUS) has also been tested. Testing the option against this alternative base scenario in PLANET results in estimates of passenger benefi ts of more than £500 million (2002 PV) and a benefi t cost ratio of 2.7.
Conclusion
This option provides an increase of around 50 percent in peak passenger capacity. It is expected that the socio-economic case for train lengthening would improve with better allocation of capacity over the route which might be achievable through timetable and rolling stock optimisation.
Assessment of Option 9: Lengthen peak Hertford East – London services to 12-car
Concept
This option proposes lengthening the Hertford East branch platforms and running the peak services as 12-car. This allows passenger capacity to be added to alleviate crowding from current levels on the service group and to accommodate predicted increases in passenger numbers during the peak.
Operational analysis
There would be no impact on freight services from implementing this option.
Infrastructure Required
None of the stations on the route between Northumberland Park and Hertford East can currently handle 12-car trains. Platform extensions (or SDO) would be needed at Hertford East, Ware, St Margarets, Rye House, Broxbourne, Cheshunt, Waltham Cross, Enfi eld Lock, Brimsdown, Ponders End, Angel Road and Northumberland Park. At this early stage there is no assessment of power supply and berthing needs nor track circuit occupation or platform use at terminal stations.
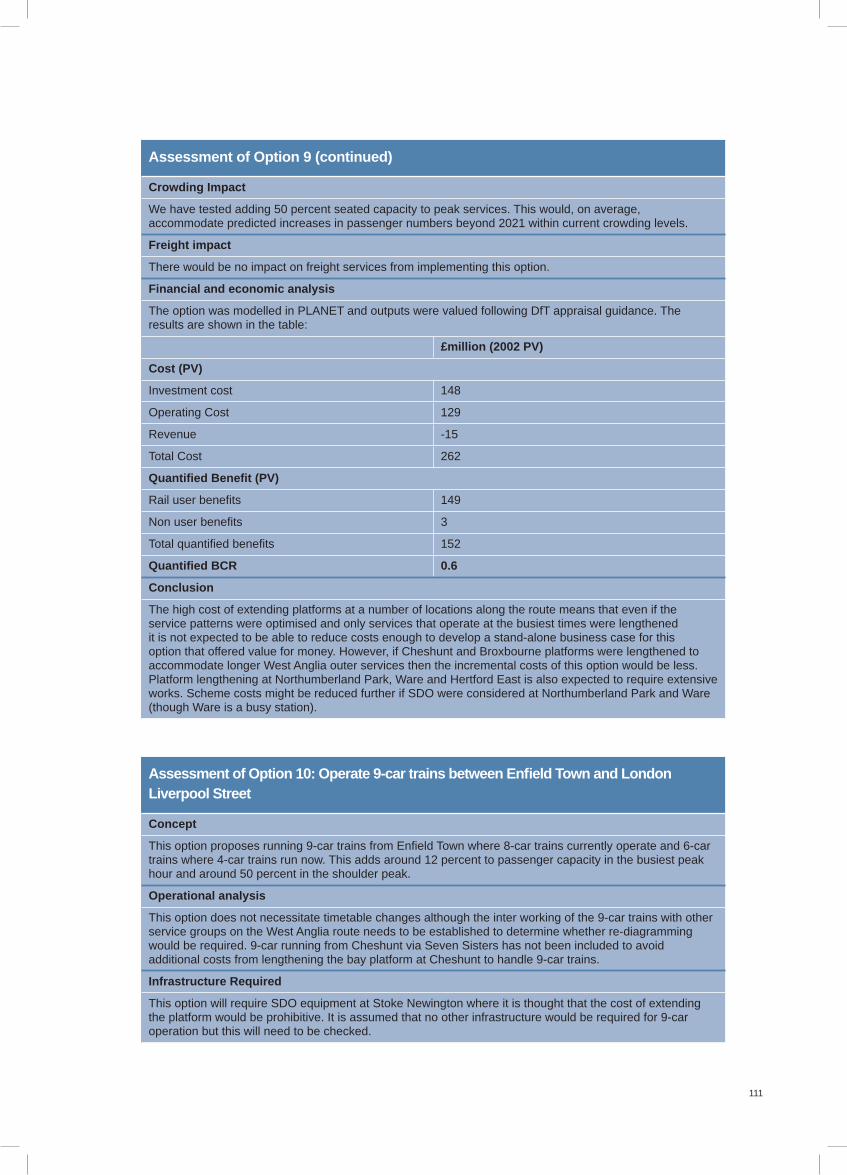
111
Assessment of Option 9 (continued)
Crowding Impact
We have tested adding 50 percent seated capacity to peak services. This would, on average, accommodate predicted increases in passenger numbers beyond 2021 within current crowding levels.
Freight impact
There would be no impact on freight services from implementing this option.
Financial and economic analysis
The option was modelled in PLANET and outputs were valued following DfT appraisal guidance. The results are shown in the table:
£million (2002 PV)
Cost (PV)
Investment cost 148
Operating Cost 129
Revenue -15
Total Cost 262
Quantifi ed Benefi t (PV)
Rail user benefi ts 149
Non user benefi ts 3
Total quantifi ed benefi ts 152
Quantifi ed BCR 0.6
Conclusion
The high cost of extending platforms at a number of locations along the route means that even if the service patterns were optimised and only services that operate at the busiest times were lengthened it is not expected to be able to reduce costs enough to develop a stand-alone business case for this option that offered value for money. However, if Cheshunt and Broxbourne platforms were lengthened to accommodate longer West Anglia outer services then the incremental costs of this option would be less. Platform lengthening at Northumberland Park, Ware and Hertford East is also expected to require extensive works. Scheme costs might be reduced further if SDO were considered at Northumberland Park and Ware (though Ware is a busy station).
Assessment of Option 10: Operate 9-car trains between Enfi eld Town and London Liverpool Street
Concept
This option proposes running 9-car trains from Enfi eld Town where 8-car trains currently operate and 6-car trains where 4-car trains run now. This adds around 12 percent to passenger capacity in the busiest peak hour and around 50 percent in the shoulder peak.
Operational analysis
This option does not necessitate timetable changes although the inter working of the 9-car trains with other service groups on the West Anglia route needs to be established to determine whether re-diagramming would be required. 9-car running from Cheshunt via Seven Sisters has not been included to avoid additional costs from lengthening the bay platform at Cheshunt to handle 9-car trains.
Infrastructure Required
This option will require SDO equipment at Stoke Newington where it is thought that the cost of extending the platform would be prohibitive. It is assumed that no other infrastructure would be required for 9-car operation but this will need to be checked.

112
Assessment of Option 10 (continued)
Crowding Impact
We predict considerable increases in passenger numbers on this route. This option would accommodate some but not all of that increase predicted by 2016. Without further intervention it is expected that there would be continued overcrowding on this route by 2016. The proposal would provide only marginal relief from 2016 do-minimum crowding levels.
Freight impact
There would be no impact on freight services from implementing this option.
Financial and economic analysis
The option was modelled in PLANET and outputs were valued following DfT appraisal guidance. The results are shown in the table:
£million (2002 PV)
Cost (PV)
Investment cost 3
Operating Cost 25
Revenue 21
Total Cost 50
Quantifi ed Benefi t (PV)
Rail user benefi ts 137
Non user benefi ts -4
Total quantifi ed benefi ts 133
Quantifi ed BCR 2.7
Conclusion
We are predicting high rates of increase in passenger volumes on this route. This option goes part of the way to accommodating this predicted demand but is inadequate by itself to meet crowding targets to 2016. There is a good fi t between this and other options to operate 9-car trains on the West Anglia Route, in terms of rolling stock diagramming.
Assessment of Option 11: Run two shuttle services to Seven Sisters
Concept
This option proposes running two 8-car shuttles between Cheshunt and Seven Sisters in the peak hour to provide crowding relief on the Southbury Loop route along its busiest section. Simultaneously, it provides frequency increases to four trains an hour at Theobalds Grove and Turkey Street.
Operational analysis
Paths for two trains an hour between the bay platform at Cheshunt and Seven Sisters are available in the morning peak.
Infrastructure Required
Power operation of the crossover at Seven Sisters is probably required to implement this option.
Crowding Impact
This proposal would have a minimal impact on passengers’ travel experience in terms of crowding conditions for most passengers on the route (though it would reduce average load factors to a similar extent as would be achieved with 9-car running from Enfi eld Town – Option 10). As a stand-alone intervention to accommodate predicted increases in passenger demand along this route it is inadequate.

113
Assessment of Option 11 (continued)
Freight impact
There would be no impact on freight services from implementing this option.
Financial and economic analysis
The option was modelled in PLANET and outputs were valued following DfT appraisal guidance. The results are shown in the table:
£million (2002 PV)
Cost (PV)
Investment cost 1
Operating Cost 91
Revenue -31
Total Cost 60
Quantifi ed Benefi t (PV)
Rail user benefi ts 270
Non user benefi ts 5
Total quantifi ed benefi ts 275
Quantifi ed BCR 4.6
Conclusion
The socio-economic case for this option is strong but the proposal does not make good use of the available capacity because it serves only those passengers travelling to Seven Sisters. The minority of passengers who would use the shuttle are likely to travel in uncrowded conditions whilst those travelling to Liverpool Street would travel on more crowded trains.
Assessment of Option 12: Increase capacity on the West Anglia Main Line
Concept
This option proposes increasing line capacity between Broxbourne Junction and Coppermill Junction by three/four-tracking the route to provide additional services. An illustrative timetable has been tested comprising eight additional peak services: four from the Stansted area; two from Hertford East; and two from Cambridge. Two extra Stansted Airport services would run to Liverpool Street (via Clapton) and all others would run to Stratford via Tottenham Hale so providing frequent services between all stations and Stratford/Docklands. Journey times could also be reduced for West Anglia outer services and service frequency increased at stations in the lower Lea Valley where service levels and patronage are currently poor. To provide adequate capacity from Stansted Airport for airport passengers lengthening Stansted Express trains to 12-car has been included, as well as lengthening the semi-fast trains from Cambridge but removing the call at Broxbourne to avoid the cost of extending the platforms and remodelling the existing track layout there (though the cost estimate for the all-day scheme includes the cost of new 12-car platforms at Cheshunt and Broxbourne).
Operational analysis
This option requires extensive timetabling and performance modelling and more detailed work on its feasibility is required. If services run in the off peak to provide four trains per hour at all inner stations protection of the hourly freight path on the WAML would need to be ensured.
Infrastructure Required
This option will require extensive works and 3/4 tracking between Broxbourne Junction and Coppermill Junction. Neither the scope of works nor the berthing and power supply needs have yet been fully assessed.
Crowding Impact
Overcrowding would be eliminated on the West Anglia route north of Tottenham Hale until beyond 2021. In 2016 the model predicts that there would be no standing on outer services during the morning peak.

114
Assessment of Option 12 (continued)
Freight impact
If a scheme is progressed that involves increasing service frequency all-day on the route then there may be an impact on freight, however, the increase in infrastructure proposed is signifi cant and should (subject to more detailed timetabling) allow for both the existing hourly freight path, as well as further freight growth.
Financial and economic analysis
The option was modelled in PLANET and outputs were valued following DfT appraisal guidance for two schemes:
12(a) a scheme that allows tidal fl ows of traffi c in the peak The capital cost estimate for this (peak-only) scheme is a Network Rail estimate from the West Anglia Route Modernisation (Enhancement) programme. This estimate includes – inter alia – costs for mixed 3 and 4 tracking between Coppermill Junction and Cheshunt, and Broxbourne and Broxbourne Junction, and removal of at grade road crossings of the line between Broxbourne and Coppermill junctions.
Scheme 12(a)
£million (2002 PV)
Cost (PV)
Investment cost 253
Operating Cost 1,161
Revenue -689
Total Cost 725
Quantifi ed Benefi t (PV)
Rail user benefi ts 1,566
Non user benefi ts 110
Total quantifi ed benefi ts 1,676
Quantifi ed BCR 2.3
12(b) a second scheme allowing all-day operation of increased service levels.The cost estimate for the all-day capacity scheme was provided by TfL. This is the highest of various estimates available to us. The cost estimate includes – inter alia – four-tracking Coppermill Junction to Broxbourne Junction, grade separation at Coppermill Junction and new station platforms at Stratford, Tottenham Hale, Cheshunt and Broxbourne.
Scheme 12(b)
£million (2002 PV)
Cost (PV)
Investment cost 608
Operating Cost 1,287
Revenue -1,289
Total Cost 606
Quantifi ed Benefi t (PV)
Rail user benefi ts 2,311
Non user benefi ts 205
Total quantifi ed benefi ts 2,516
Quantifi ed BCR 4.2
We also tested a demand sensitivity case provided by the DfT which estimates increases in passenger demand from the Stansted area about 15 percent greater than those estimated in the RUS. Testing the option against this alternative base scenario in PLANET results in estimates of passenger benefi ts of an additional £79 million (2002 PV) and a benefi t cost ratio of 3.2 for the more limited scheme; and £116 million additional benefi ts (2002 PV) and a benefi t cost ratio of 4.3 for the four-tracking scheme.

115
Assessment of Option 12 (continued)
We have also tested the option with Crossrail in the base-case and found that this did not worsen the socio-economic case for this intervention. Indeed, there are synergies between this scheme and Crossrail, because Crossrail would allow some (or all) of the additional services on West Anglia to continue to Liverpool Street, once capacity is released on the Great Eastern route between Liverpool Street and Stratford.
Conclusion
We think that there is considerable scope for improving the socio-economic case for this scheme by cutting rolling stock costs and better matching supply to demand. This option has the potential to be developed into a scheme that can meet growing demand on the West Anglia main line through and beyond the RUS timescale.
Assessment of Option 13: Increase frequency of Ipswich – Peterborough services to hourly
Concept
This option seeks to improve the cross country service by running the Ipswich – Peterborough services hourly throughout the day.
Operational analysis
It is not possible to create a regular hourly service on this route within the existing timetable. However, if the cross country timetable was reviewed and service patterns changed it is thought that a more effi cient timetable could be planned, to the benefi t of all parties and the additional service could be pathed.
Infrastructure Required
If the timetable review were conducted then it is thought that no infrastructure would be necessary. No capital costs have been assumed in the appraisal. However, the infrastructure identifi ed under Option 17 (improve cross country freight capacity) would greatly assist with timetabling a regular hourly passenger service over the route.
Crowding Impact
Careful timetabling of the services may help reduce the limited crowding on the route. This impact has not been valued.
Freight impact
Without a review of the timetable this option would have an impact on existing class 6 freight services serving local aggregate depots. This option would reduce the cross country freight capacity thus resulting in more trains via GEML and London.
Financial and economic analysis
The option was modelled in MOIRA and outputs were valued following DfT appraisal guidance. The results are shown in the table:
£million (2002 PV)
Cost (PV)
Investment cost -
Operating Cost 45
Revenue -6
Total Cost 39
Quantifi ed Benefi t (PV)
Rail user benefi ts 26
Non user benefi ts 9
Total quantifi ed benefi ts 35
Quantifi ed BCR 0.9

116
Assessment of Option 13 (continued)
Conclusion
This option is only feasible if the timetable over the route is reviewed. The business case at base year levels of demand is weak. The scheme does not offer value for money. At predicted rates of passenger demand increases it is expected that the additional services would generate a positive socio-economic case (on the basis that it has been quantifi ed now) around 2019, though this may be sooner if greater increases in demand materialise or if the service offered was viewed by consumers as being signifi cantly more attractive relative to car than it is now.
Assessment of Option 14: Increase frequency on the East Suffolk Line to hourly
Concept
This option seeks to improve the East Suffolk Line service by operating an hourly service throughout the day between Ipswich and Lowestoft.
Operational analysis
This option requires a new passing loop at Beccles and is diffi cult to timetable between Westerfi eld and East Suffolk Junction.
Infrastructure Required
A passing loop is required at Beccles and it is also desirable that East Suffolk Junction is doubled in order to reduce some of the confl icts in the Ipswich area. The cost of a loop at Beccles has been included in the appraisal but not the cost of doubling East Suffolk Junction.
Crowding Impact
This option could help relieve the standing on the route that occurs at peak times if the service was carefully timetabled.
Freight impact
It is likely that East Suffolk Junction would need to be doubled in order to maintain capacity for current freight services and future growth of Felixstowe port.
Financial and economic analysis
The option was modelled in MOIRA and outputs were valued following DfT appraisal guidance. The results are shown in the table:
£million (2002 PV)
Cost (PV)
Investment cost 6
Operating Cost 23
Revenue -3
Total Cost 26
Quantifi ed Benefi t (PV)
Rail user benefi ts 17
Non user benefi ts 6
Total quantifi ed benefi ts 23
Quantifi ed BCR 0.9
Conclusion
This option is only feasible if the timetable over the route is reviewed. The business case at base year levels of demand is weak. At predicted rates of passenger demand increases it is expected that the additional services would generate a positive socio-economic case (on the basis that it has been quantifi ed now) around 2012, though this may be sooner if greater increases in demand materialise or if the service offered was viewed by consumers as being signifi cantly more attractive relative to car than it is now.

117
Assessment of Option 15: Provide an hourly service between Ipswich and Saxmundham
Concept
This option seeks to increase service frequency on this route to provide a regular hourly service throughout the day to serve an increasing market.
Operational analysis
This option is diffi cult to timetable between Westerfi eld and East Suffolk Junction.
Infrastructure Required
It is desirable that East Suffolk Junction is doubled in order to reduce some of the confl icts in the Ipswich area. The cost of this has not been included in the appraisal results.
Crowding Impact
We have not assessed this option’s impact on crowding
Freight impact
It is likely that East Suffolk Junction would need to be doubled in order to maintain capacity for current freight services and future growth of Felixstowe port.
Financial and economic analysis
The option was modelled in MOIRA and outputs were valued following DfT appraisal guidance. The results are shown in the table:
£million (2002 PV)
Cost (PV)
Investment cost -
Operating Cost 16
Revenue -1
Total Cost 15
Quantifi ed Benefi t (PV)
Rail user benefi ts 7
Non user benefi ts 2
Total quantifi ed benefi ts 9
Quantifi ed BCR 0.6
Conclusion
The business case at base year levels of demand is weak. At predicted rates of passenger demand increases it is expected that the additional services would generate a positive socio-economic case (on the basis that it has been quantifi ed now) around 2035, though this may be sooner if greater increases in demand materialise or if the service offered was viewed by consumers as being signifi cantly more attractive relative to car than it is now.

118
Assessment of Option 16: Relieve crowding on non-London services
Description Increase capacity on rural/inter-urban services to meet peak demand.
Issue Even before the regional growth takes place some services are near or over capacity at peaks times when arriving/departing regional centres. Crowding relief on these trains will also improve rail’s image for discretionary travellers.
Under this option the loadings on the Cambridge – Kings Lynn services have also been considered and running longer trains at least as far as Ely needs to be examined further. This needs to be progressed in conjunction with the FCC proposals and the other developments being planned in the Cambridge area
Progress/recommendation It is recommended that TOCs review rolling stock diagramming/ allocation with a view to strengthening services locally to reduce peak crowding. The strengthening of London services which operate north of Cambridge also needs to be progressed.
Assessment of Option 17: Accommodate higher demand for containerised traffi c
Description Increase freight gauge, train length and capacity on the Felixstowe – Nuneaton route
Issue Need to increase gauge, train length and number of paths available to accommodate the growth of intermodal freight especially from the East Coast Ports.
Progress/recommendation Chapter 5 has covered the timetabling work carried out to assess the number of paths available and the increase in infrastructure required in order to accommodate the freight paths.
This work has so far concluded that:
■ In order to accommodate the freight growth both the GE/NLL/WCML and the Felixstowe – Nuneaton cross country routes need to be used (with around 10 additional paths routed via London).
■ With the existing infrastructure together with the fi rst phase of enhancements (i.e. those contained in the HPUK Section 106 and the TIF submission works) around 5 additional paths can be found on the cross country route to Nuneaton in addition to the 9 paths to/from South Yorkshire.
■ With additional infrastructure proposed in a second phase of enhancement works, it is possible to path the additional Yorkshire trains as well as 14 additional services to/from Nuneaton.
■ If the existing cross country freight and passenger services were reviewed it may be possible to path additional freight services.
■ Reducing the passenger service on the Felixstowe branch will not release suffi cient capacity to meet freight growth and is not recommended – the planned partial doubling of the branch is required.
The development of this option is to continue with refi nement of the timetable and infrastructure works. Further TIF submissions can then be made. This option has also addressed gaps D-H highlighted in the Freight RUS (see table 7.4). Chapter 5 contains details of these gaps as well as a note on the issue of train lengthening.
7.3.4
The assessment of the remaining options is set out
below. The table also advises on how it is planned/
recommended to take these options forward.

119
Table 7.4 Freight RUS gaps
Gap Location Issue Mitigations
D Stratford – Camden Road
Interface with access to/ from the GEML
Loops proposed at Channelsea and Stratford Platform 10a to regulate freight services. The former funded by TfL under NLL upgrade and the latter probably via the ODA/NR Out Performance Fund.
E GEML Available Class 4 and 6 slots between off peak passenger services
GA/CL RUS strategies propose use of Great Eastern off peak freight paths plus an upgraded cross country route in order to meet freight growth.
E-F Haughley Jn – Peterborough
Single Lead at Haughley JnHeadways at KennettConfl ict at Ely
The removal of these restrictions is being taken forward for potential NRDF funding. Failing this it is assumed that these will be the subject of a TIF submission.
G-H Forest Gate - Channelsea
Confl icting moves on the GEML
The Greater Anglia and CL RUS strategies propose the use of an upgraded Gospel Oak – Barking route to take some of the traffi c away from Stratford. This is being pursued via engineering renewals, TIF and TfL funding.
Assessment of Option 18: Improved Route Availability, Ipswich – Peterborough
Description Improve the Route Availability for freight traffi c on the Ipswich – Peterborough route
Issue Class 6 freight trains are subject to speed restrictions on the Ipswich – Peterborough route and the line needs to be able to carry this traffi c at speeds of up to 50 mph.
Progress/recommendation This scheme is to be investigated and developed as a potential NRDF scheme.

120
Assessment of Option 19: Improvements to train performance
Description Improve performance through a range of measures
Issue The stakeholders identifi ed performance issues under 6 headings.
Progress/recommendation The performance issue and the recommendations/progress with their development are summarised below:
■ Close the crossings in the Lea Valley
The RSSB Level Crossing model has been obtained and the cases for closing or replacing the crossings are being assessed using it. If the business case looks acceptable, continue to develop closure options.
■ Review/improve Rules of the Plan
The Rules of the Plan have been reviewed and changes are being investigated between Ipswich and Norwich and between Liverpool Street and Shenfi eld.
■ Replace poorly performing sections of the OHLE
Design and development is being worked up for the replacent of thebetween Liverpool Street and Southend/Chelmsford.
■ Improve turnrounds on the rural routes
The turnrounds on the Ipswich – Cambridge service need to be improved. Speeds could be improved as a result of track renewals but signalling works are also required. The scheme is being developed under NRDF.
■ Remove the restrictions on Ely West Curve
Restrictions were placed on the curve when it was commissioned in the 1990s and the business case is being developed with a view to using NRDF funding in order to remove both the directional and double blocking restrictions in the area.
■ Increase speeds between Barking and Upminster
An increase in speed is being investigated in order to improve journey times/performance margins. Work may also be required in conjunction with this to improve the regulation of trains running to/ from the Ockendon Branch. This work would be funded through the NRDF.

121
Assessment of Option 20: Improve industry Effi ciency of Egineering Access
Description Improve the effi ciency of Engineering Access
Issue The review of engineering access referred to earlier in this document has shown that access needs to be improved in the 5 areas discussed below:
■ Reducing the impact of possessions on the Stansted route has been the subject of an Effi cient Engineering Access cross industry study.
The operator requires improved access to Stansted on the busiest nights of the week and at weekends due to the high level of traffi c. In order to address the issue, the study assessed low cost options which would maximise industry benefi ts and concluded that it was possible to change maintenance and renewals delivery to reduce engineering access time.
■ Assess the impact of TfL’s proposed hours of operation on suburban routes.
Once TfL have specifi ed the hours required on the suburban routes it will be necessary for Network Rail to check these times against engineering requirements and the needs of other operators including freight.
■ Reduce the impact of possessions on berthing and depots
There are a number of areas were alternative power feeding arrangements need to be investigated for berthing sidings and depots, so that train maintenance and stabling are not affected by engineering works. This work is to be undertaken with funding from the NRDF for any cost effective schemes.
■ Improve engineering access on the cross country freight route
Increasing freight traffi c on the Great Eastern and especially the cross country route means that proper diversionary arrangements are required to permit good engineering access at night and weekends. The proposals being worked up consider making the GE/NLL/WCML and the cross country routes diversionary routes for each other. This requires the enhancement works to the cross country route and ECML (South) to be in place, as well as a check on the operational feasibility of the option.
■ In conjunction with the above, the engineering access review process is also examining ways of increasing the use of single line working, as a means of reducing the number of all line blocks across the network.
Progress/recommendation These schemes are being taken forward as part of a number of initiatives, including the engineering access, NRDF and cross country freight projects.
Assessment of Option 21: Match Power Supply to future needs
Description Improve the power supply to match future requirements.
Issue The power supply is known to be operating close to the limit in several areas, requiring a check whether any enhancements are required in order to meet future needs. A number of electric multiple units will also need to operate with regenerative braking and this includes an EWS proposal to operate class 92 locomotives in regenerative mode between the NLL and Ripple Lane (following the opening of CTRL Phase 2) – these impacts will also need to be checked as part of the study.
Progress/recommendation A remit covering the likely future growth requirements, as identifi ed in this RUS, has been issued to the Electrifi cation and Plant Engineer. The assessment is now underway and the outputs will feed into the fi nal RUS document.

122
Assessment of Option 22: Improve Access to the Network
Description Improve passenger access to the network.
Issue The analysis carried out as part of the RUS has shown that station facilities need to be improved in a number of areas.
Progress/recommendation The station issues and the recommendations/progress with their development are summarised below:
■ Car park capacity needs to be improved at a number of locations
The Route Enhancement Manager’s team are discussing car park schemes with the train operators, including a number identifi ed in the Passenger Focus study. The supressed demand work in the study will be used to assist in making the case for car park expansion schemes.
■ Improve DDA compliance at stations
Ipswich station has now been added to the list of stations covered by the DfT’s DDA compliance programme and further stations are being identifi ed to add to the project.
■ Improve interchange at LUL stations.
The demand modelling has identifi ed the increase in use at stations giving interchange with LUL. Projects are getting underway to improve facilities at Stratford and Tottenham Hale, however, works are also likely to be required at West Ham (being considered for NRDF funding), Seven Sisters and Walthamstow Central.
■ Improve crowding relief at key stations
The SRA/Railway Estates study identifi ed a number of stations where crowding is or will become a problem. Those with interchange have been discussed above, however, improvements at the London termini will need to be taken forward as part of their master plans. It is anticipated that improvements at Cambridge will be undertaken as part of the station forecourt development and those at Chelmsford will be improved under an NRDF/property/local authority scheme.
■ Provide new stations to improve access to the network.
A number of developments are currently at the planning stage and (generally under Section 106 agreements), the developers are often seeking to provide new stations. Some current proposals are listed below, however, individual stations have been (or will be) subject to an assessment of their impact on capacity. The stations/ developments currently include: Chesterton at Cambridge, a station north-east of Chelmsford, Southend Airport, Great Blakenham (to serve Snoasis and its associated development) and Moreton Hall (to serve a new development near Bury St Edmunds).
■ Develop an overall access to the station strategy.
Recent disccussions with stakeholders have shown that a station access strategy is needed that encompasses all modes of transport to/from stations.
Assessment of Option 23: Meet future berthing need
Description Improve berthing capacity.
Issue The analysis of berthing capacity has shown that it is becoming almost fully utilised at the majority of locations in the RUS area.
Progress/ recommendation An assessment of additional capacity required will be made once the stock requirements from the options have been determined.

123
7.4 Emerging conclusions
7.4.1
A summary of the appraised options and their
performance is given in Table 7.5 and this is
followed by our initial conclusions:
Table 7.5 Summary of option performance
No. Option BCR Crowding Impact Comment
1 Lengthen peak trains on Thameside Main Line
Approx. 2 (using Railplan)
Meets capacity to 2021
2 Lengthen trains on Tilbury Loop
1.3 Meets capacity to 2021 Phasing the works might improve the business case
3 New rolling stock on the Anglia inter-city services
Financially positive
Meets capacity to beyond 2021
4 Run 2 additional peak Great Eastern outer services
32.7 Limited impact – no change to where standing starts with or without extra trains
Need to combine with options 3 and 5 to meet capacity
5 Stop all Great Eastern outer services at Stratford
-3.7 Helps even up loadings Enables Option 4 and meets stakeholder aspirations for improved access to Stratford
6 Run additional peak services on Great Eastern inners
1.2 Meets capacity to 2016 (i.e. crowding on Great Eastern inners is similar to base year by 2016)
Need further interventions (such as evening up stopping patterns to enable more trains to run) in order to meet growth to 2021
7 Lengthen peak trains on the Chingford route
1.3 Meets capacity to 2016 but more passengers travel to Liverpool Street so endure crowded conditions for longer
Need more interventions (such as high density rolling stock) to meet long term passenger demand growth
8 Lengthen peak trains on the Cambridge and Stansted routes
1.4 Meets capacity to 2016 such that crowding is similar to base year on outers and Stansted Express – on average – in 2016
Phasing works might improve the business case
9 Lengthen Hertford East peak services to 12-car
0.6 Meets capacity on the branch services to 2021
Option refi nement is required in combination with other options
10 Longer peak trains to Enfi eld Town
2.7 Does not provide suffi cient capacity
Needs more interventions (such as high density rolling stock) to meet predicted increases in demand
11 Run peak shuttles to Seven Sisters
4.6 Signifi cant impact on average crowding but still above base year levels and does not provide suffi cient capacity through to Liverpool Street
Needs more interventions (such as high density rolling stock) to meet predicted increases in demand
12 Increase capacity on the West Anglia Main Line
2.3 (peak)4.2 (all day)
Meets capacity to 2021 by reducing crowding below base year levels and avoids standing beyond 20 minutes on outer and Stansted services
Further development and refi nement of this option is needed to reduce cost and target supply to demand. 12(b) provides suffi cient capacity to meet long term demand growth on inner and outer services

124
7.4.2
Many of the options tested meet predicted
demand to 2016/21, although further
refi nement is required to optimise value
for money and to enhance capacity where
required. The effect of packaging options also
needs to be evaluated. On the Great Eastern
inners rolling stock changes or regularisation of
stopping patterns may need to be considered
to increase capacity pending Crossrail. On
the West Anglia inner services considerable
refi nement is required to assess the
combination of longer trains and use of high
density stock. The impact of improvements
to the Broxbourne – Tottenham Hale corridor
on the Southbury Loop loadings also need
to be considered further. The development
of the options which have not been subject
to quantitative appraisal will continue to be
developed under existing programmes.
7.4.3
The analysis of freight capacity has shown
that freight needs to use both the GEML and
the cross country route. The fi rst phase of
development on the latter route is required
now and the second phase will be required
between 2014 and 2023. The upgrading of the
Gospel Oak – Barking route is also required
if the freight growth from Thameside is to be
sustained and to avoid an increasing volume
of freight traffi c crossing the GEML between
Stratford and Forest Gate.
7.4.4
The RUS has considered a range of options
which attempt to address the gaps identifi ed.
The options range from those which
address capacity though service changes
and enhancements to those which address
areas such as stations and performance.
Stakeholders’ views on the gaps and options
presented are now sought before fi nalising the
strategy.
7.5 Contingent projects
7.5.1 Crossrail
7.5.1.1
The Crossrail project would provide a new
link between GWML and the GEML with links
to Docklands and South East London. It is
designed primarily to relieve the Central and
Hammersmith & City London Underground
lines, as well as providing improved access
between Heathrow/Central London and
Docklands/South and East London. The
project is currently at the House of Commons
Select Committee stage and it
is envisaged that if approved and funded
the project would be completed after the 2012
Olympics and towards the end of the period
covered by the RUS.
7.5.1.2
Whilst the Crossrail project is not yet a
committed scheme, it will have a considerable
impact on the area covered by the RUS. As
planned it will assist in providing additional
passenger capacity on the following routes
and has the following synergies with the RUS
and TfL’s 2025 Vision:
Table 7.5: Summary of option performance (continued)
No. Option BCR Crowding Impact Comment
13 Increase frequency between Ipswich and Peterborough
0.9 Needs further timetable changes to be operable
14 Increase frequency on the East Suffolk Line
0.9 Needs further infrastructure to be operable
15 Run an hourly service to Saxmundham
0.6 Needs further infrastructure to be operable

125
■ On the West Anglia route, Crossrail would
enable services routed to Stratford (such
as those proposed in Option 12 or TfL’s
proposals) to run through to Liverpool
Street. This would involve moving the
existing tracks across or building a fl yover
to bring the services over onto the current
Great Eastern ‘E’ lines, which would have
been diverted into Crossrail.
■ The impact of the West Anglia link would
be a way of increasing capacity into
Central London directly whilst serving
Stratford and Docklands at the same time.
■ On the Great Eastern, Crossrail would
not only have the potential to increase
suburban capacity by operating longer
trains in addition to some residual
Liverpool Street services, but also give
the potential to move some outer services
across onto the former ‘E’ lines between
Stratford and Liverpool Street thereby
increasing capacity on this section of the
route.
7.5.1.3
The development of the Crossrail timetable
needs to make assumptions of future freight
services operating on the GEML. These
assumptions will need to be refreshed using
the recently published Freight RUS demand
forecasts as a base. The access to freight
depots also needs to be preserved.
7.5.2 Thameslink
7.5.2.1
The Thameslink project, like Crossrail, seeks
to provide improved journey opportunities
across the centre of the capital. The project
is designed to improve the links between the
lines leading into London Bridge and those
running north to Bedford and Peterborough/
Cambridge/Kings Lynn. The project has
completed its passage through the planning
process and now awaits funding.
7.5.2.2
If approved the project would not be completed
until the end of the RUS period. However, its
impact on the RUS will be more limited as it
is only the section to Cambridge/Kings Lynn,
which affects the RUS. The current plans by
FCC to extend train lengths on the Cambridge
– Kings Cross corridor refl ect the plans for this
corridor contained in the Thameslink plan.

126126
8. Stakeholder consultation
8.1 Introduction
8.1.1 Purpose
Consultation with stakeholders within and
outside the rail industry is essential to the
successful development of a Route Utilisation
Strategy. Close involvement of stakeholders
helps to ensure that:
■ the widest range of options is considered
■ the resulting decision approaches
optimality
■ delivery of the solution is faster.
According to Network Rail’s network licence:
3A.3(a) the licence holder shall develop a draft route utilisation strategy in consultation with:
(i) providers and potential providers of services relating to railways
(ii) funders and potential funders of services relating to railways
(iii) the Rail Passengers’ Council or such other public body or bodies as may be performing the Council’s duties, other representatives of persons using services for the carriage of passengers by railway, and representatives of persons using services for the carriage of goods by railway
(iv) the Secretary of State [for Transport] and, in relation to a route utilisation strategy that involves Scotland-only services or cross-border services, the Scottish Ministers.
Network Licence Condition 7 as modifi ed 10 June 2005
In order to deliver this obligation in an effective
and consistent manner, two consultative
groups have been established for the Greater
Anglia RUS.
8.1.2 Industry Stakeholder Management
Group (SMG)
The SMG consists of representatives from
passenger and freight train operators, ATOC,
DfT, ORR, TfL, BAA, Passenger Focus and
London Travelwatch.
This group meets regularly, acting as a
steering group for the RUS.
Although formal presentations are made to
the SMG of work done, the emphasis is on
informality and openness in discussion.
8.1.3 Wider Stakeholder Group (WSG)
The WSG is a larger, and hence necessarily
more formal, group than the SMG.
Representatives are invited from:
■ DfT
■ London Travelwatch
■ Local authorities
■ Highways Agency
■ Rail user groups
■ Ports and airports
■ Other bodies

127127
This group exists to ensure that stakeholders
beyond the rail industry have the opportunity
to contribute to the RUS process and are
briefed and prepared to make best use of the
formal consultation period. For the Greater
Anglia RUS the fi rst meetings were held in
June 2006 and the second meetings were held
in February 2007. In each case the meetings
were held at two venues, one in Ipswich and
one in London to allow many people across
the Greater Anglia area to attend. Additional
meetings will be arranged prior to the fi nal
publication of the document.
8.1.4 Individual briefi ngs
Meetings have also been held on an individual
basis with a number of key stakeholders to
understand their aspirations and concerns.
8.2 How you can contribute
We welcome contributions to assist us in
developing this RUS. Specifi c consultation
questions have not been set as we would
appreciate comments on the content of the
document as a whole. Particular reference
should, however, be made in response to the
options that have been developed as solutions
for the identifi ed gaps.
8.3 Response date
8.3.1
This RUS will have a formal consultation
period of twelve weeks. The deadline for
receiving responses is therefore 13 July
2007. Earlier responses would be very much
appreciated in order to maximise the time
available to consider and respond in the fi nal
RUS document.
8.3.2
Consultation responses can be submitted
either electronically or by post to the
addresses below and these will be published
on our web site following the completion of the
consultation process:
Greater Anglia RUS Consultation Response
National RUS Consultation Manager
Network Rail
8th Floor
40 Melton Street
London
NW1 2EE

128
9. Appendices
Appendix A: Rural Routes – Loadings on busiest trains
Appendix B: Berthing summary
Appendix C: Congested stations and station facilities data
Appendix D: Delay data
Appendix E: Freight path analysis by commodity
Appendix F: GEML capacity utilisation
Appendix G: Glossary of terms

129
Appendix A – Rural Routes – Loadings on busiest trains
Max. Load Capacity Most Loaded Section
Norwich - Cambridge
16.40 124 110 Norwich – Attleborough
17.35 116 110 Norwich – Attleborough
18.40 73 110 Norwich – Attleborough
Cambridge - Norwich
07.05 112 110 Wymondham – Norwich
16.12 97 110 Cambridge – Ely
17.12 122 110 Cambridge – Ely
Source: ‘one’ conductor counts Sept 2006
Max. Load Capacity Most Loaded Section
Ipswich - Cambridge
06.13 62 65 Ipswich - Bury St Edmunds
06.52 138 144 Ipswich – Stowmarket
18.16 60 65 Ipswich – Stowmarket
Cambridge – Ipswich
15.43 76 65 C’bridge – Bury St Edmunds
16.43 108 144 Cambridge – Newmarket
17.43 97 144 Cambridge – Newmarket
Source: ‘one’ conductor counts Sept 2006
Max. Load Capacity Most Loaded Section
Ipswich - Peterborough
16.02 58 189 Ipswich – Bury St Edmunds
18.03 74 189 Ipswich – Bury St Edmunds
Peterborough – Ipswich
07.52 74 189 Stowmarket – Ipswich
Source: ‘one’ conductor counts Sept 2006

130
Max. Load Capacity Most Loaded Section
Lowestoft – Norwich
07.51 155 189 Reedham – Norwich
08.43 87 144 Brundall – Norwich
17.48 85 144 Reedham – Norwich
Norwich – Lowestoft
08.57 68 144 Norwich – Brundall
15.57 92 144 Norwich – Reedham
16.57 134 144 Norwich – Reedham
Source: ‘one’ conductor counts Sept 2006
Max. Load Capacity Most Loaded Section
Gt Yarmouth – Norwich
08.17 113 144 Brundall – Norwich
09.17 94 144 Brundall – Norwich
16.17 106 189 Brundall – Norwich
Norwich – Gt Yarmouth
16.40 77 144 Norwich – Brundall
17.36 108 144 Norwich – Brundall
18.40 70 189 Norwich – Brundall
Source: ‘one’ conductor counts Sept 2006
Max. Load Capacity Most Loaded Section
Sheringham – Norwich
08.25 82 144 Sheringham – Cromer
09.46 79 144 North Walsham – Norwich
Norwich – Sheringham
07.15 88 144 Cromer – Sheringham
14.45 81 144 Norwich – Wroxham
17.45 103 144 Norwich – Wroxham
Source: ‘one’ conductor counts Sept 2006
Max. Load Capacity Most Loaded Section
Felixstowe – Ipswich
07.51 41 65 Westerfi eld – Ipswich
Ipswich – Felixstowe
08.26 46 65 Ipswich – Derby Rd
17.26 58 65 Ipswich – Derby Rd
Source: ‘one’ conductor counts Sept 2006

131
Max. Load Capacity Most Loaded Section
Lowestoft – Ipswich
06.43 111 187 Westerfi eld – Ipswich
08.58 93 187 Westerfi eld – Ipswich
Ipswich – Lowestoft
17.02 107 187 Ipswich – Westerfi eld
Source: ‘one’ conductor counts Sept 2006
Max. Load Capacity Most Loaded Section
Cambridge – Ely/Peterborough
07.27 104 122 Whittlesea – Peterborough
16.04 147 196 Cambridge – Ely
17.03 210 122 Cambridge – Waterbeach
17.49 129 189 Cambridge – Waterbeach
Peterborough/ Ely –Cambridge
07.10 168 122 Ely – Cambridge
08.31 141 122 Ely – Cambridge
17.18 162 122 Peterborough – Whittlesea
Source: Network Rail counts January 2007
Max. Load Capacity Most Loaded Section
Norwich - Peterborough
07.57 169 196 March – Peterborough
Peterborough - Norwich
06.27 116 196 Wymondham – Norwich
Source: Network Rail counts January 2007

132
0
50
100
150
200
22:4320:4519:4518:4317:4316:4315:4314:4313:4312:4311:4310:439:438:437:436:43
Key
Rural Routes – Graphs of loadings across the day (Source ‘one’ conductor counts)
Seats
Load
Cambridge – Ipswich
0
50
100
150
200
21:1619:1618:1617:1616:1615:1614:1613:1612:1611:1610:169:168:166:526:135:10
Key
Seats
Load
Ipswich – Cambridge

133
0
50
100
150
200
22:5621:4821:1220:2019:1219:2518:0517:1216:1215:1214:1213:1212:1211:1210:129:128:137:05
Key
Seats
Load
Cambridge – Norwich
0
50
100
150
200
22:1020:4219:4518:4017:3516:4015:4014:4013:4012:4011:4010:409:408:407:376:335:53
Key
Seats
Load
Norwich – Cambridge

134
0
50
100
150
200
22:5620:5619:5618:5617:5616:5615:5614:5613:5612:5611:5610:569:568:567:516:395:34
Key
Seats
Load
Felixstowe – Ipswich
0
50
100
150
200
22:2620:2619:2618:2617:2616:2615:2614:2613:2612:5611:2610:269:268:267:136:045:04
Key
Seats
Load
Ipswich – Felixstowe

135
0
50
100
150
200
20:5818:4316:5814:5812:5810:588:586:435:31
Key
Seats
Load
Lowestoft – Ipswich
0
50
100
150
200
22:1520:5218:5518:1317:0215:0213:0211:029:026:48
Key
Seats
Load
Ipswich – Lowestoft

136
0
50
100
150
200
20:1618:0316:0214:0312:0310:038:035:35
Key
Seats
Load
Peterborough – Ipswich
0
50
100
150
200
22:0519:4917:4715:4713:4711:489:477:52
Key
Seats
Load
Ipswich – Peterborough

137
0
50
100
150
200
23:3122:4621:4320:5019:4818:4817:4816:4815:4314:5013:4312:5011:4310:509:438:437:517:406:405:40
Key
Seats
Load
Lowestoft – Norwich
0
50
100
150
200
22:4021:5720:5719:5718:5717:5716:5715:5714:5713:5712:5711:5710:579:578:577:546:566:265:45
Key
Seats
Load
Norwich – Lowestoft

138
0
50
100
150
200
23:3322:1721:1720:1719:1718:1417:4317:1716:1715:1714:1213:1712:1711:1710:179:178:177:457:176:426:00
Key
Seats
Load
Great Yarmouth – Norwich
0
50
100
150
200
23:0021:4020:4019:3618:4017:3617:0516:4015:3614:3613:3612:3611:3610:369:368:367:367:056:365:15
Key
Seats
Load
Norwich – Great Yarmouth

139
0
50
100
150
200
23:4622:1620:4919:4818:4917:4816:4915:4614:4613:4612:4611:4610:469:468:257:176:32
Key
Seats
Load
Sheringham – Norwich
0
50
100
150
200
22:4521:1519:4518:4517:4516:4515:4514:4513:4512:4511:4510:459:458:237:155:505:20
Key
Seats
Load
Norwich – Sheringham

140
Ber
thin
g P
oint
s
Usage 3-car
Usage 4-car
Usage vehicles
Usage 1-car
Usage 2-car
Usage 3-car
Usage vehicles
Number of Sidings
Number of Sidings
Approx. Capacity vehicles
Approx. Capacity vehicles
Approx. Spare Capacity vehicles
Approx. Spare Capacity vehicles
Ele
cE
lec
Ele
cD
iese
lD
iese
lD
iese
lD
iese
lE
lec
Unw
ired
Ele
cU
nwire
dE
lec
Unw
ired
Ald
ersb
rook
00
00
00
05
040
040
0U
nuse
d 5x
8-c
ar
wire
d ro
ads
Bis
hops
Sto
rtfo
rd0
28
00
00
10
80
00
Pla
tform
3 u
sed
Bis
hops
Sto
rtfo
rd
CS
05
200
00
03
032
012
0In
clud
es
pass
enge
r lo
op
Cam
brid
ge C
S0
3012
00
00
012
516
028
4028
No
dies
els
bert
hed
Chi
ngfo
rd s
tatio
n0
416
00
00
20
240
80
2 pl
atfo
rms
used
Chi
ngfo
rd C
E
Sdg
s0
832
00
00
50
400
80
Chi
ngfo
rd L
E
Sdg
s0
1040
00
00
50
400
00
Cla
cton
CS
020
800
00
07
092
012
0
Col
ches
ter
stat
ion
09
360
00
04
036
00
0B
ay p
latfo
rms
+
sidi
ngs
Col
ches
ter
CS
018
720
11
58
282
810
3
Eas
t Ham
023
920
10
220
022
40
132
-2D
iese
ls b
erth
ed
on w
ired
road
Gid
ea P
ark
CS
018
720
00
012
096
024
0
Her
tford
Eas
t0
28
00
00
20
80
00
Ilfor
d st
atio
n0
28
00
00
10
80
00
Bay
pla
tform
us
ed
Ilfor
d E
MU
D0
3915
60
00
019
016
00
40
Ipsw
ich
stat
ion
03
120
00
01
012
00
0
Ap
pen
dix
B –
Ber
thin
g s
um
mar
y

141
Ipsw
ich
CS
00
03
10
52
012
012
-5D
iese
ls b
erth
ed
on w
ired
road
s
Kin
g’s
Lynn
CS
04
160
00
02
016
00
0
Letc
hwor
th12
660
00
00
100
800
200
Live
rpoo
l Str
eet
stat
ion
012
480
02
618
020
40
156
-62
wire
d pl
atfo
rms
used
Nor
wic
h st
atio
n0
624
00
00
60
566
326
2 w
ired
plat
form
s us
ed
Nor
wic
h C
row
n P
oint
018
723
64
279
684
4312
16Lo
co h
aule
d se
ts
= 3
x4-c
ar E
MU
Nor
wic
h C
S0
00
02
210
04
040
030
She
nfi e
ld D
own
CS
04
160
00
03
024
08
01
road
OO
U
She
nfi e
ld M
iddl
e C
S0
28
00
00
20
200
120
Sho
ebur
ynes
s0
5421
60
00
031
036
00
144
0
Sou
then
d V
ic C
S0
3614
40
00
015
015
20
80
Sou
then
d V
ic
DS
S0
312
00
00
30
280
160
Tho
rnto
n F
ield
s C
S0
00
00
00
102
112
011
20
Not
use
d ov
erni
ght.
2 un
wire
d ro
ads
OO
U. D
ue to
be
rep
lace
d as
pa
rt o
f Oly
mpi
cs
wor
k
No.
of u
nits
1233
813
886
119
5521
819
2210
125
822
70
Ap
pen
dix
B –
Ber
thin
g s
um
mar
y (c
on
tin
ued
)

142
Appendix C – Congested stations and station facilities data
Congested Stations
Station Congestion
Station Issue Mitigation
Liverpool Street Circulation around ticket barriers, interchange with LUL and access to/ egress from the station concourse.
Improve barrier line, access to LUL and the Bishopsgate entrance.
To be taken forward in the station Master Plan
Fenchurch Street Circulation through and from subway. Circulation up main stairs, around ticket widows and barrier line. Circulation on platforms
Widen subway and improve access stairways. Move main stairway back to improve ticket hall/circulation at platform level. Move CIS to improve barrier line circulation. Review seating layout on platforms.
To be taken forward in the station Master Plan
Chelmsford Congestion on stairs leading up to platforms (especially Up platform). Circulation around ticket barrier and ticket offi ce.
Provide addition access to Up platform to relieve circulation on stairs and through ticket hall/barriers.
Being considered in conjunction with Essex County Council under NRDF.
Seven Sisters Congestion on the platforms and the stairs. Circulation through the subway and interchange with LUL.
Widen platforms and staircases. Improve subway/access to LUL.
Stratford Congestion in subways and on platforms
Re-open eastern subway and de-clutter platforms.
Improvements being taken forward as part of 2012 Olympic programme.
Barking Congestion in the ticket hall Potential to improve the gate line.
Cambridge Congestion in the ticket hall. Enlarge ticket hall and improve circulation.
Being considered in conjunction with the station forecourt development.
Chafford Hundred Congestion on platforms, stairs, barrier line during evening peak.
Increase capacity of stairs, gate line and entrance.
Walthamstow Central Congestion around ticket hall and access to LUL.
Improve number of ticket machines and access to LUL.
Colchester North
(Location advised by Passenger Focus)
Congestion on island platform. De–clutter platform

143
Station name Station Category
Platforms Car Park Information Transport Interchange
Disabled Access
Has a car park
10% spare peak utilisation
PA System
CIS Taxi Bus Cycle
Angel Road F
Ashwell & Morden E Y Y Y Y
Attleborough F Y
Audley End D Y Y Y Y Y Y
Baldock E Y Y Y Y Y
Bethnal Green F Y
Bishops Stortford C Y Y Y Y Y Y Y
Brandon F Y Y Y
Brimsdown E Y Y Y Y
Broxbourne C Y Y Y Y Y Y
Bruce Grove E Y Y Y
Bury St Edmunds C Y Y Y Y Y
Bush Hill Park D Y Y Y Y Y Y
Cambridge B Y Y Y Y Y Y Y
Cambridge Heath F Y
Cheshunt C Y Y Y Y Y Y Y
Chingford C Y Y Y Y Y Y
Clapton D Y Y
Downham Market E Y Y Y Y Y
Dullingham F Y Y Y Y
Eccles Road F Y Y Y
Edmonton Green C Y Y Y Y
Elmswell F
Station facilities
West Anglia station facilities
Key
A National hub
A (MS) National hub (Major Station)
B Regional hub
C Important feeder
D Medium, staffed
E Small, staffed
F Small, unstaffed
P Facility exists in part only
Y Facility exists

144
Station name Station Category
Platforms Car Park Information Transport Interchange
Disabled Access
Has a car park
10% spare peak utilisation
PA System
CIS Taxi Bus Cycle
Elsenham E Y
Ely D Y Y Y Y Y Y
Enfi eld Lock E Y Y Y Y
Enfi eld Town C Y Y Y Y Y Y
Foxton F Y Y
Great Chesterford E Y Y
Hackney Downs C Y Y Y Y
Harling Road F Y Y Y Y
Harlow Mill E Y Y Y Y Y
Harlow Town C Y Y Y Y Y Y
Hertford East E Y Y Y Y Y Y Y
Highams Park C Y Y Y Y Y
Kennett F Y Y Y
Kings Lynn D Y Y Y Y Y Y Y
Lakenheath F Y
Letchworth D Y Y Y
Littleport F Y Y
London Fields F
Manea F Y
March E Y Y Y Y
Meldreth E Y Y Y
Melton F Y Y Y Y
Newmarket F Y Y Y Y Y Y Y
Newport (Essex) E Y Y Y
Northumberland Park
E Y Y Y
Ponders End C Y Y Y Y Y
Rectory Road E Y Y
Roydon E Y Y Y Y
Royston D Y Y Y Y Y Y Y
Rye House E Y
Sawbridgeworth E Y Y Y
Seven Sisters D Y Y Y
Shelford E Y Y
West Anglia station facilities (continued)

145
Station name Station Category
Platforms Car Park Information Transport Interchange
Disabled Access
Has a car park
10% spare peak utilisation
PA System
CIS Taxi Bus Cycle
Shepreth F Y Y
Shippea Hill F Y Y Y
Silver Street D Y Y Y
Southbury E Y Y
Spooner Row F Y
St James St D Y Y Y
St Margarets (Herts) E Y Y Y Y Y Y
Stamford Hill E Y Y Y
Stansted Airport B Y Y Y Y
Stansted Mountfi tchet
E Y Y Y Y Y
Stoke Newington E Y Y Y Y
Theobalds Grove D Y Y
Thetford E Y Y Y
Thurston F Y Y Y
Tottenham Hale D Y Y Y Y Y
Turkey Street E Y Y Y Y Y
Waltham Cross E Y Y Y Y Y Y
Walthamstow Central C Y Y Y Y
Ware D Y Y Y Y Y Y
Waterbeach F Y Y Y Y
Watlington F Y Y Y
White Hart Lane E Y Y
Whittlesea F Y
Whittlesford E Y Y Y Y Y Y
Wood Street D Y Y
Wymondham F Y Y
West Anglia station facilities (continued)

146
Station name Station Category
Platforms Car Park Information Transport Interchange
Disabled Access
Has a car park
10% spare peak utilisation
PA System
CIS Taxi Bus Cycle
Barking B Y Y Y Y
Basildon C Y Y Y Y
Benfl eet C Y Y Y Y Y Y
Chafford Hundred E Y Y Y Y Y Y Y Y
Chalkwell C Y Y Y Y Y
Dagenham Dock E Y Y Y Y Y
East Tilbury E Y Y Y
Fenchurch Street A (MS) Y Y Y Y
Grays C Y Y Y Y Y Y Y Y
Laindon C Y Y Y Y Y Y
Leigh-on-Sea C Y Y Y Y Y Y Y Y
Limehouse E Y Y Y
Ockendon E Y Y Y Y Y Y
Pitsea C Y Y Y Y Y Y
Purfl eet D Y Y Y Y Y Y
Rainham (Greater London)
C Y Y Y Y Y Y Y Y
Shoeburyness E Y Y Y Y Y Y Y
Southend Central D Y Y Y Y Y Y
Southend East D Y Y Y
Stanford Le Hope D Y Y Y Y Y
Thorpe Bay D Y Y Y Y Y Y Y Y
Tilbury Town D Y Y Y
Upminster C Y Y Y Y Y Y Y Y
West Ham (c2c Platforms)
F Y Y Y
West Horndon E Y Y Y Y Y Y
Westcliff D Y Y Y Y Y Y Y
Thameside station facilities
146

147
Great Eastern station facilities
Station name Station Category
Platforms Car Park Information Transport Interchange
Disabled Access
Has a car park
10% spare peak utilisation
PA System
CIS Taxi Bus Cycle
Acle F Y Y Y Y
Alresford E Y Y Y Y
Althorne F Y Y Y Y Y
Battlesbridge F Y Y Y Y Y
Beccles F Y Y Y Y Y
Berney Arms F Y
Billericay B Y Y Y Y Y Y Y Y
Braintree C Y Y Y Y Y Y Y Y
Braintree Freeport F Y Y Y Y Y
Brampton (Suffolk) F Y
Brentwood B Y Y Y Y Y Y Y
Brundall F Y Y Y
Brundall Gardens F Y Y
Buckenham F
Bures F Y Y Y Y Y
Burnham on Crouch D Y Y Y Y Y Y
Cantley F Y Y Y Y Y
Chadwell Heath C Y Y Y
Chappel & Wakes Colne
F Y Y Y Y Y Y Y
Chelmsford B Y Y Y Y Y Y Y Y
Clacton on Sea C Y Y Y Y Y Y Y Y
Colchester (North) B Y Y Y Y Y Y Y
Colchester Town E Y Y Y Y Y
Cressing F Y Y Y Y Y Y
Cromer F Y Y Y
Darsham F Y Y
Derby Road F Y
Diss C Y Y Y Y Y
Dovercourt E Y Y Y Y
Emerson Park F Y Y Y Y Y
Fambridge F Y Y Y Y Y
Felixstowe F Y Y Y
Forest Gate C Y Y Y
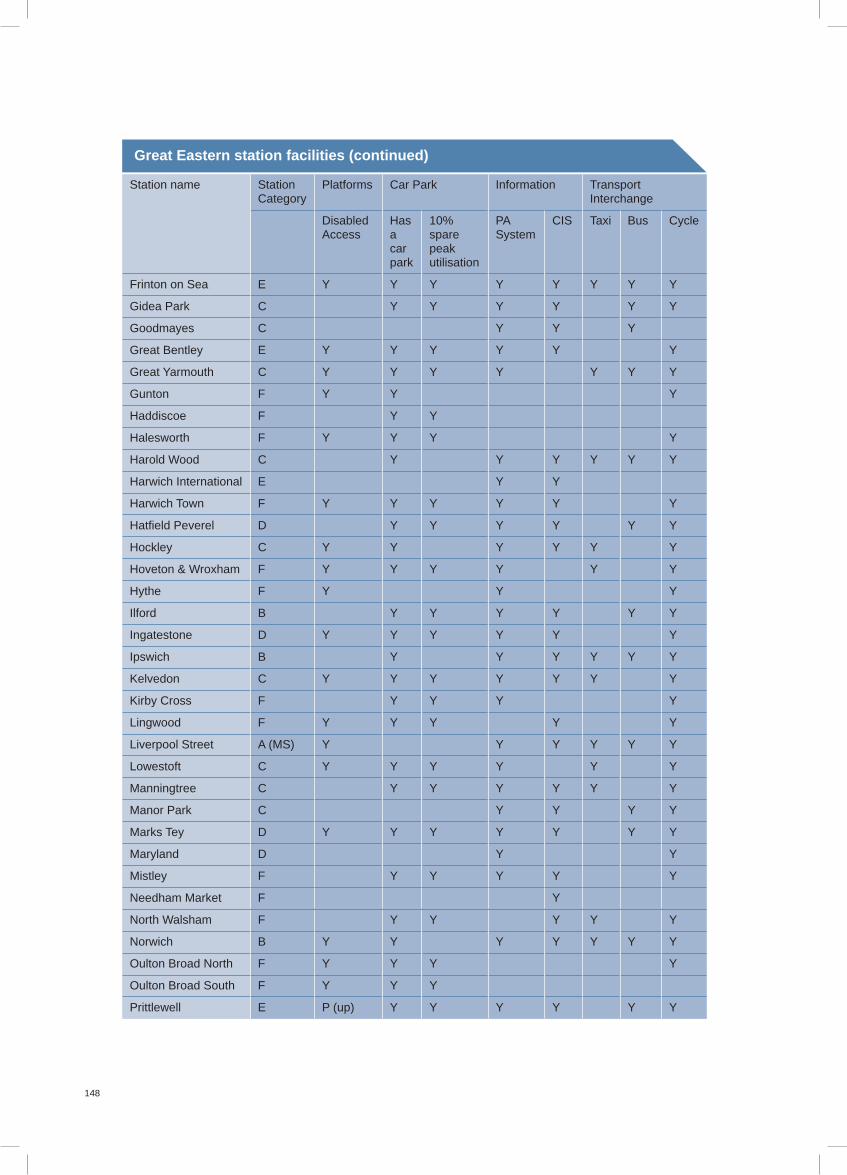
148
Station name Station Category
Platforms Car Park Information Transport Interchange
Disabled Access
Has a car park
10% spare peak utilisation
PA System
CIS Taxi Bus Cycle
Frinton on Sea E Y Y Y Y Y Y Y Y
Gidea Park C Y Y Y Y Y Y
Goodmayes C Y Y Y
Great Bentley E Y Y Y Y Y Y
Great Yarmouth C Y Y Y Y Y Y Y
Gunton F Y Y Y
Haddiscoe F Y Y
Halesworth F Y Y Y Y
Harold Wood C Y Y Y Y Y Y
Harwich International E Y Y
Harwich Town F Y Y Y Y Y Y
Hatfi eld Peverel D Y Y Y Y Y Y
Hockley C Y Y Y Y Y Y
Hoveton & Wroxham F Y Y Y Y Y Y
Hythe F Y Y Y
Ilford B Y Y Y Y Y Y
Ingatestone D Y Y Y Y Y Y
Ipswich B Y Y Y Y Y Y
Kelvedon C Y Y Y Y Y Y Y
Kirby Cross F Y Y Y Y
Lingwood F Y Y Y Y Y
Liverpool Street A (MS) Y Y Y Y Y Y
Lowestoft C Y Y Y Y Y Y
Manningtree C Y Y Y Y Y Y
Manor Park C Y Y Y Y
Marks Tey D Y Y Y Y Y Y Y
Maryland D Y Y
Mistley F Y Y Y Y Y
Needham Market F Y
North Walsham F Y Y Y Y Y
Norwich B Y Y Y Y Y Y Y
Oulton Broad North F Y Y Y Y
Oulton Broad South F Y Y Y
Prittlewell E P (up) Y Y Y Y Y Y
Great Eastern station facilities (continued)

149
Station name Station Category
Platforms Car Park Information Transport Interchange
Disabled Access
Has a car park
10% spare peak utilisation
PA System
CIS Taxi Bus Cycle
Rayleigh C Y Y Y Y Y Y Y
Reedham (Norfolk) F Y Y Y Y
Rochford C Y Y Y Y Y Y Y
Romford B Y Y Y Y
Roughton Road F
Salhouse F Y Y Y
Saxmundham F Y Y Y Y
Seven Kings C Y Y
Shenfi eld B Y Y Y Y Y Y Y
Sheringham F Y Y Y Y
Somerleyton F Y Y Y Y
Southend Victoria C Y Y Y Y Y Y Y Y
Southminster F Y Y Y Y Y Y Y
Stowmarket C Y Y Y Y Y Y Y
Stratford B Y Y Y Y Y
Sudbury F Y Y Y Y Y Y
Thorpe le Soken E Y Y Y Y Y
Trimley F Y Y Y
Walton on Naze E Y Y Y Y Y Y
Weeley F Y Y Y Y Y Y
West Runton F Y Y
Westerfi eld F Y
White Notley F Y Y Y Y
Wickford C Y Y Y Y Y Y Y
Wickham Market F Y Y Y Y
Witham C Y Y Y Y Y Y Y
Wivenhoe E Y Y Y Y Y Y Y
Woodbridge F Y Y Y Y
Woodham Ferrers C Y Y Y Y Y Y Y
Worstead F Y Y
Wrabness F Y Y Y Y Y
Great Eastern station facilities (continued)

150
Appendix D – Delay Data
27615
16736
15345
43402
35719
32412
28618
15101
West Anglia Route Top 10 Delays 2005/06
Key
Track Circuit Failures
External Fatalities and Trespass
Production Responsibility
Broken Rail/Track Faults
Points Failures
Fleet Electric Traction
Traincrew Crew Used
Freight Terminal Operations
Fleet Diesel Traction
External Other
Total Delays 2005/06 469,952 minutes
10647
5414
5330
5273
4104
66295
12861
9170
63895807
Thameside Route Top 10 Delays 2005/06
Key
Track Circuit Failures
External Fatalities and Trespass
Production Responsibility
Broken Rail/Track Faults
Points Failures
Fleet Electric Traction
Traincrew Crew Used
Freight Terminal Operations
Fleet Diesel Traction
External Other
Total Delays 2005/06 194,426 minutes

151
64757
57912
55182
51947
51214113932
55815
43390
39405
36760
Great Eastern Route Top 10 Delays 2005/06
Key
Track Circuit Failures
External Fatalities and Trespass
Production Responsibility
Broken Rail/Track Faults
Points Failures
Fleet Electric Traction
Traincrew Crew Used
Freight Terminal Operations
Fleet Diesel Traction
External Other
Total Delays 2005/06 169,862 minutes
Secondary Delay
Mins Strategic Route
Delay Section Sub Route Section Total trains per year
mins/train
1806 5 Middleton Towers Total Cambridge-Kings Lynn 766 2.358
50016 7 Westerfi eld Jcn-Felixstowe Total
Westerfi eld Jcn-Felixstowe 25489 1.962
46797 7 Ipswich-Stowmarket Total Colchester-Norwich 76171 0.614
22099 5 March-Peterborough Total Ely-Peterborough 37622 0.587
12184 5 Chippenham-Haughley Jcn Total
Haughley Jcn-Cambridge/Ely
21569 0.565
Key
<0.099
0.100-0.199
0.200-0.299
0.300-0.399
0.400-0.499
>0.500

152
Mins Strategic Route
Delay Section Sub Route Section Total trains per year
mins/train
50492 7 Shenfi eld-Chelmsford Total Shenfi eld-Colchester 91921 0.549
11462 5 Ely-Trowse Total Ely-Norwich 21225 0.540
25288 7 Trowse-Norwich Total Colchester-Norwich 47672 0.530
50648 5 Coppermill Jcn-Cheshunt Total
Liverpool Street-Broxbourne
101828 0.497
532 6 Thameshaven Branch Total
Tilbury Loop 1079 0.493
12472 5 Broxbourne-Hertford East Total
Hertofrd East Branch 25464 0.490
5164 7 Cromer-Sheringham Total Whitlingham Jcn-Sheringham
10736 0.481
7035 7 Wickford-Southminster Total
Shenfi eld-Southend Victoria/Southminster
14630 0.481
5910 7 Sudbury Branch Total Sudbury Branch 12405 0.476
5782 7 Whitlingham Jcn-Cromer Total
Whitlingham Jcn-Sheringham
12170 0.475
12307 7 Colchester-Clacton Total Colchester-Clacton/Walton 27035 0.455
6544 7 Braintree Branch Total Braintree Branch 14528 0.450
28004 7 Colchester-Manningtree Total
Colchester-Norwich 64755 0.432
6162 7 Westerfi eld-Saxmundham Total
Ipswich-Lowestoft 14494 0.425
14205 5 Ely-Kings Lynn Total Cambridge-Kings Lynn 33868 0.419
21955 5 Stansted Airport Branch Total
Broxbourne-Cambridge 58070 0.378
31360 5 Bishops Stortford-Cambridge Total
Broxbourne-Cambridge 84255 0.372
17569 6 Barking-Grays Total Tilbury Loop 47565 0.369
20469 7 Manningtree-Ipswich Total Colchester-Norwich 55670 0.368
7 Liverpool Street-Bethnal Green Total
Liverpool Street-Shenfi eld 431144 0.346
14465 5 Cambridge-Ely Total Cambridge-Kings Lynn 43251 0.334
38223 5 Cheshunt-Bishops Stortford Total
Broxbourne-Cambridge 114937 0.333
5024 7 Harwich International-Harwich Town Total
Harwich Branch 15244 0.330
7488 7 Stowmarket-Trowse Total Colchester-Norwich 27069 0.277
21987 7 Marks Tey-Colchester Total
Shenfi eld-Colchester 79836 0.275
21877 7 Witham-Marks Tey Total Shenfi eld-Colchester 79625 0.275
2542 5 Temple Mills-Coppermill Jcn Total
Liverpool Street-Broxbourne
9342 0.272
Secondary Delay (continued)

153
Mins Strategic Route
Delay Section Sub Route Section Total trains per year
mins/train
7856 5 Enfi eld Town Branch Total Enfi eld Town Branch 30145 0.261
1325 5 Stratford-Temple Mills Total
Liverpool Street-Broxbourne
5494 0.241
21654 7 Chelmsford-Witham Total Shenfi eld-Colchester 90912 0.238
1443 7 Saxmundham-Oulton Broad Total
Ipswich-Lowestoft 6563 0.220
48461 7 Ilford-Gidea Park Total Liverpool Street-Shenfi eld 228618 0.212
6144 7 Brundall-Great Yarmouth Total
Brundall/Reedham Jcn-Great Yarmouth
29088 0.211
51934 7 Stratford-Forest Gate Total Liverpool Street-Shenfi eld 247001 0.210
9652 5 Chingford Branch Total Chingford Branch 47580 0.203
2192 5 Soham Branch Total Haughley Jcn-Cambridge/Ely
10869 0.202
21281 6 Fenchurch Street-Barking Total
Fenchurch Street-Shoeburyness
107477 0.198
6472 5 Ely-March Total Ely-Peterborough 33960 0.191
3022 7 Walton Branch Total Colchester-Clacton/Walton 16127 0.187
39380 7 Gidea Park-Shenfi eld Total Liverpool Street-Shenfi eld 214006 0.184
7190 7 Norwich-Lowestoft Total Norwich-Lowestoft 41042 0.175
3755 7 Manningtree-Harwich International Total
Harwich Branch 21513 0.175
1925 6 Forest Gate-Woodgrange Park Total
Gospel Oak-Barking 11344 0.170
798 6 Coppermill Jcn-South Tottenham Total
Gospel Oak-Barking 4853 0.164
4461 6 Upminster-Grays Total Ockendon Branch 28216 0.158
5360 6 Grays-Pitsea Total Tilbury Loop 35690 0.150
31136 7 Bethnal Green-Stratford Total
Liverpool Street-Shenfi eld 229217 0.136
3916 5 Bury Street Jcn-Cheshunt Total
Liverpool Street-Broxbourne
29647 0.132
6794 7 Shenfi eld-Wickford Total Shenfi eld-Southend Victoria/Southminster
54375 0.125
9570 6 Pitsea-Shoeburyness Total Fenchurch Street-Shoeburyness
77451 0.124
4642 6 Barking-Woodgrange Park Total
Gospel Oak-Barking 39813 0.117
8596 6 Barking-Upminster Total Fenchurch Street-Shoeburyness
83468 0.103
Secondary Delay (continued)

154
Mins Strategic Route
Delay Section Sub Route Section Total trains per year
mins/train
19453 5 Bethnal Green-Hackney Downs Total
Liverpool Street-Broxbourne
197143 0.099
22245 7 Forest Gate-Ilford Total Liverpool Street-Shenfi eld 231358 0.096
4267 7 Wickford-Southend Victoria Total
Shenfi eld-Southend Victoria/Southminster
44387 0.096
4295 5 Cambridge-Royston Total Shepreth Branch 46490 0.092
4925 6 Upminster-Pitsea Total Fenchurch Street-Shoeburyness
55283 0.089
920 5 Cambridge-Chippenham Jcn Total
Haughley Jcn-Cambridge/Ely
10904 0.084
2594 7 Colchester Town Total Colchester-Clacton/Walton 33645 0.077
4403 5 Hackney Downs-Bury Street Jcn Total
Liverpool Street-Broxbourne
59760 0.074
6422 5 Clapton-Coppermill JCN Total
Liverpool Street-Broxbourne
92423 0.069
4196 5 Hackney Downs-Clapton Total
Liverpool Street-Broxbourne
140078 0.030
Secondary Delay (continued)

155
Appendix E – Freight path analysis by commodity
Paths per day each way
Cross country route
Whittlesea – Peterborough (East) Stowmarket – Haughley Jn
Commodity AV paths Max paths Commodity AV paths Max paths
Aggregate 4 6 Aggregate 1 1
Automotive 0 0 Automotive 0 0
Channel Tunnel 0 0 Channel Tunnel 0 0
Intermodal 7 15 Intermodal 7 16
Infrastructure 2 10 Infrastructure 0 1
Light engines 1 5 Light engines 1 6
Other 9 N/A Other 4 N/A
Total 23 Total 13
Great Eastern Main Line
Ipswich – Halifax Jn Shenfi eld
Commodity AV paths Max paths Commodity AV paths Max paths
Aggregate 0 1 Aggregate 1 3
Automotive 0 0 Automotive 0 0
Channel Tunnel 0 0 Channel Tunnel 0 0
Intermodal 16 20 Intermodal 14 19
Infrastructure 0 1 Infrastructure 0 3
Light engines 1 2 Light engines 1 3
Other 4 N/A Other 1 N/A
Total 21 Total 17
Manor Park – Ilford Maryland – Forest Gate
Commodity AV paths Max paths Commodity AV paths Max paths
Aggregate 1 3 Aggregate 4 7
Automotive 0 0 Automotive 0 1
Channel Tunnel 0 0 Channel Tunnel 3 4
Intermodal 14 19 Intermodal 19 35
Infrastructure 0 3 Infrastructure 0 3
Light engines 1 3 Light engines 2 5
Other 0 N/A Other 1 N/A
Total 16 Total 29

156
Appendix F – GEML capacity utilisation
The colour coded lines on the following graphs
show how capacity is used over the GEML:
■ Timetable Usage – Capacity used by the
timetable over the whole route
■ Route Section Usage – Capacity used by
the timetabled mix of trains over a route
section with a constant number of trains
■ ROTP Usage – Capacity required to run
the timetabled number of trains at the
minimum planning headway
■ Infrastructure Limit – Absolute theoretical
minimum capacity consumption if
timetabled trains could run at signalling
headway
0%
10%
20%
30%
40%
50%
60%
70%
80%
90%
100%
Cap
acity
Usa
ge
Nor
wic
h
Dis
s
Sto
wm
arke
tN
eedh
am M
arke
t
Ipsw
ich
Man
ning
tree
Col
ches
ter
Mar
ks T
ey
Kel
vedo
n
With
amH
atfie
ld P
ever
el
Che
lmsf
ord
Inga
test
one
She
nfie
ldB
rent
woo
d
Gid
ea P
ark
Rom
ford
Ilfor
dF
ores
t Gat
eS
trat
ford
Bow
Jn
Bet
hnal
Gre
enLi
verp
ool S
tree
tGEML Capacity Analysis – Up Main Line, am peak
Key
Timetabled Usage
Route Section Usage
ROTP Usage
Infrastructure Limit

157
0%
10%
20%
30%
40%
50%
60%
70%
80%
90%
100%
Cap
acity
Usa
ge
Nor
wic
h
Dis
s
Sto
wm
arke
tN
eedh
am M
arke
t
Ipsw
ich
Man
ning
tree
Col
ches
ter
Mar
ks T
ey
Kel
vedo
n
With
amH
atfie
ld P
ever
el
Che
lmsf
ord
Inga
test
one
She
nfie
ldB
rent
woo
d
Gid
ea P
ark
Rom
ford
Ilfor
dF
ores
t Gat
eS
trat
ford
Bow
Jn
Bet
hnal
Gre
enLi
verp
ool S
tree
t
GEML Capacity Analysis – Up Main Line, off-peak
0%
10%
20%
30%
40%
50%
60%
70%
80%
90%
100%
Cap
acity
Usa
ge
Live
rpoo
l Str
eet
Bet
hnal
Gre
enB
ow J
nS
trat
ford
For
est G
ate
Ilfor
d
Rom
ford
Gid
ea P
ark
Bre
ntw
ood
She
nfie
ld
Inga
test
one
Che
lmsf
ord
Hat
field
Pev
eril
With
am
Kel
vedo
n
Mar
ks T
ey
Col
ches
ter
Man
ning
tree
Ipsw
ich
Nee
dham
Mar
ket
Sto
wm
arke
t
Dis
s
Nor
wic
h
GEML Capacity Analysis – Down Main Line, am peak

158
0%
10%
20%
30%
40%
50%
60%
70%
80%
90%
100%
Cap
acity
Usa
ge
Live
rpoo
l Str
eet
Bet
hnal
Gre
enB
ow J
nS
trat
ford
For
est G
ate
Ilfor
d
Rom
ford
Gid
ea P
ark
Bre
ntw
ood
She
nfie
ld
Inga
test
one
Che
lmsf
ord
Hat
field
Pev
eril
With
am
Kel
vedo
n
Mar
ks T
ey
Col
ches
ter
Man
ning
tree
Ipsw
ich
Nee
dham
Mar
ket
Sto
wm
arke
t
Dis
s
Nor
wic
h
GEML Capacity Analysis – Down Main Line, off-peak
Key
Timetabled Usage
Route Section Usage
ROTP Usage
Infrastructure Limit

159
Appendix G – Glossary of terms
Term Meaning
AC Alternating Current
Access Charges Review
A review of Network Rail’s funding requirements for the operations, maintenance and renewal of the rail network undertaken by the Offi ce of Rail Regulation. This establishes the level of track access charges that are paid for a fi ve year period, along with the associated output commitments that are expected at this level of funding
ACTRAFF A database for recording actual traffi c movement across the network
ARS Automatic Route Setting
ATOC Association of Train Operating Companies
BCR Benefi t-Cost Ratio
Bi-di Signalling Bi-directional (a form of signalling that allows trains to run safely in the opposite direction to the normal fl ow of traffi c on a single track)
CCTV Closed Circuit Television
CIS Customer Information System
Class 4 Freight train permitted to run at more than 60mph
Class 6 Freight train permitted to run at more than 50, 55 or 60mph
CTRL Channel Tunnel Rail Link
CUI Capacity Utilisation Index
DC Direct Current
DDA Disability Discrimination Act
DEEP Draft East of England Plan
DfT Department for Transport
DLR Docklands Light Railway
Down Where referred to as a direction i.e. Down direction, Down peak, Down line, Down train, this generally but not always refers to the direction that leads away from London
DRS Direct Rail Services
Dwell time The time a train is stationary at a station
E lines The Electric or suburban stopping lines between Liverpool Street and Shenfi eld
EC European Commission
ECML East Coast Main Line
ECS Empty coaching stock
Effi cient Engineering Access
A generic term for an initiative aimed at establishing a more effi cient access regime for the delivery of the required maintenance and renewal of the railway infrastructure, balancing engineering requirements with passenger and freight demand
ELL East London Line
ERTMS European Rail Traffi c Management System
EWS English, Welsh and Scottish Railway
F2N The route between Felixstowe and Nuneaton via Ipswich, Ely, Peterborough and Leicester
FCC First Capital Connect
FOC Freight Operating Company
GBRf GB Railfreight
GE Great Eastern
GEML Great Eastern Main Line
GLA Greater London Authority
GOB The Gospel Oak - Barking Line
GSM-R Global System for Mobile Communications - Railway

160
Term Meaning
GW Great Western
Headway The minimum interval possible between trains on a particular section of track
HLOS High Level Output Specifi cation
HPUK Hutchison Ports UK
HST High Speed Train
IECC Integrated Electronic Control Centre
IKF Integrated Kent Franchise
JLE Jubilee Line Extension
Junction margin
The minimum interval possible between trains operating over the same junction in confl icting directions
LATS London Area Travel Survey
LDA London Development Agency
LENNON
Loading gauge Maximum dimensions to which a vehicle can be built or loaded without being at risk of striking a lineside structure
LTP Local Transport Plan
LTS London, Tilbury and Southend line also refered to as the Thameside route
LUL London Underground Limited
MML Midland Main Line
MOIRA
mtpa million tonnes per annum
N/A not applicable
NLL North London Line
NPV Net Present Value
NR Network Rail
NRDF Network Rail Development Fund
NRN The National Radio Network
OHLE Overhead Line Equipment
OOU Out of use
ORR Offi ce of Rail Regulation
PDFH Passenger Demand Forecasting Handbook. An industry document that summarises the effects of service quality, fares and external factors on rail demand
PIXC Passengers In Excess of Capacity. Passengers In Excess of Capacity only applies to weekday commuter trains arriving in London between 07:00 and 09:59 and those departing between 16:00 and 18:59. Capacity is deemed to be the number of standard class seats on the train for journeys of more than 20 minutes; for journeys of 20 minutes or less, an allowance for standing room is also made. The allowance for standing varies with the type of rolling stock but, for modern sliding door stock, is typically approximately 35 percent of the number of seats. The PIXC measure for a Train Operating Company (TOC) as a whole is derived from the number of passengers travelling in excess of capacity on all services divided by the total number of people travelling, expressed as a percentage. PIXC counts are carried out once a year, on a typical weekday during the autumn. The DfT has set limits on the level of acceptable PIXC at 4.5 per cent on one peak (morning or afternoon) and three percent across both peaks. The DfT monitors the level of PIXC across peaks (both individually and combined).
PLANET A demand forecasting model developed by the SRA
Possession Where part of the infrastructure is closed to services to carry out maintenance, renewal or enhancement works
PPM Public Performance Measure
PPP Public Private Partnership
PV Present Value

161
Term Meaning
RA Route Availability – a system to determine which types of locomotive and rolling-stock may travel over a route, normally governed by the strength of underline bridges in relation to axle-loads and speed
RAB Regulatory Asset Base
RailSys A modelling tool used to analyse proposed timetable and infrastructure confi gurations
RCP Rail Corridor Plan
RETB Radio Electronic Token Block
ROTP Rules of the Plan
RPA Regional Planning Assessment
RUS Route Utilisation Strategy
S&C Switches and Crossings
SAP Network Rail’s Strategic Access Planning Unit
SCD Stratford City Development
SDO Selective Door Opening
Seated Load factor
The amount of seats occupied on a train service expressed as a percentage of total seats available
Section 106 Agreement
A condition attached to a planning consent, which typically requires the developer to fund associated improvements to infrastructure which supports the development
SRA Strategic Rail Authority
SRT Section Running Time
STAG Scottish Transport Appraisal Guidelines
SWT South West Trains
T&H Tottenham and Hampstead (Gospel Oak to Barking line)
TEMPRO The Trip End Model Presentation Program
TEU Twenty-foot Equivalent Unit
TfL Transport for London
TIF Transport Innovation Fund
TOC Train Operating Company
tpa tonnes per annum
TPC Train Planning Centre
tph trains per hour
tpw trains per week
Train path A slot in a timetable for running an individual train
TRUST A computer system which records actual train running times at strategic locations
TSR Temporary Speed Restriction
UIC International Union of Railways
Up Where referred to as a direction i.e. Up direction, Up peak, Up line, Up train, this is generally but not always refers to the direction that leads towards London
W10 The loading gauge which enables 9’ 6” containers to be conveyed on conventional wagons
WAGN West Anglia Great Northern former rail franchise, which has been subsumed into the current ‘one’ and FCC franchises
WAML West Anglia Main Line
WARM West Anglia Route Modernisation project was a programme of works completed in 2003, which removed signalling control from many invividual signal boxes to a centrailised point within the Liverpool Street IECC
WCML West Coast Main Line
WebTAG The Transport Analysis Guidance website, which provides detailed guidance on the appraisal of transport schemes and wider advice on scoping and carrying out transport studie

162

163

Network Rail
40 Melton Street
London NW1 2EE
Tel: 020 7557 8000
www.networkrail.co.uk 08
4/A
pri
l 20
07