gravity waves in the tropical middle atmosphere: characteristics and wave-mean flow interaction
TRANSCRIPT
Available online at www.sciencedirect.com Pergamon
www.elsevier.com/locate/asr doi: lO.l016/SO273-1177(03)00403-4
SCIENCE DIRECT.
GRAVITY WAVES IN THE TROPICAL MIDDLE ATMOSPHERE: CHARACTERISTICS AND WAVE-MEAN FLOW INTERACTION
K.Rajeev’, K.Parameswaran’, M.N.Sasi’, Geetha Ramkumarl, and B.V.Krishna Mm-thy2
‘Space Physics Laboratory, Vikram Sarabhai Space Centre, Trivandrum, INDIA. ‘Department of Physics, Anna University, Chennai, INDIA.
ABSTRACT
High-resolution Rayleigh lidar observations of temperature in the altitude region. of 27-60 km over Gadanki (13S0N, 79.2”E) during the period of January 18 to March 5 1999 and February 29 to March 31 2000 were used to study the gravity wave characteristics in the tropical middle atmosphere. The vertical wavenumber spectra of gravity waves and the altitude variation of the potential energy per unit mass (E,,) associated with gravity wave activity are found to be similar during both these years. Altitude profile of Ep indicates that sigmficant wave damping occurs in the stratosphere while nearly non-dissipating gravity wave growth is observed in the lower mesosphere. The slope of the vertical wave number spectra is observed to be about -2.1, which is less than that expected for saturated spectra (-3). The gravity wave activity in the stratosphere and lower mesosphere is found to undergo temporal variations, which are correlated with the temperature fluctuations in the middle atmosphere. A longer period wave with a mean vertical wavelength of about 12.8 km and wave period of about 8-14 hours is also observed on several nights. 0 2003 COSPAR. Published by Elsevier Ltd. All rights reserved.
INTRODUCTION
Energy and momentum fluxes due to upward propagating atmospheric gravity waves (AGW) that are generated in the troposphere play a significant role in controlling the large-scale dynamics of the middle atmosphere. The AGW characteristics vary significantly with the geographical location, season and altitude. The amplitude of the vertically propagating gravity wave is expected to increase exponentially, up to the altitude where the vertical gradient of the resultant wind or temperature becomes unstable. Propagation of AGWs through the atmosphere is significantly controlled by the background atmospheric conditions and the wave characteristics. Strong wave damping occurs because of the wave-mean flow interaction at the altitude where the phase speed of the wave approaches the mean wind. Dissipation of AGW results in the deposition of its energy and momentum, which leads to acceleration of the mean flow. Momentum deposition by the high speed gravity waves is at least partly responsible for driving the quasi-biennial oscillation in the lower stratosphere and the semi-annual oscillation in the stratopause and mesopause regions (Lindzen and Holton, 1968; Canziani and Holton, 1998).
Extensive studies on the source and propagation characteristics of gravity waves in the high latitude middle atmosphere have been carried out in the past several years using both observations and theoretical models (Fritts and Vincent, 1987; Hines, 1991; Wilson et al., 1991; Tsuda et al., 1994). Over the tropical regions, observations using high-resolution radiosonde data have shown a strong correlation between the strength of convection in the troposphere and the level of wave activity in the lower stratosphere (Wada et al., 1999; Vincent and Alexander, 2000). We present here the temporal and altitude variations of gravity wave activity and wave characteristics in the middle atmosphere over the tropical station, Gadanki (13S0N, 79.2’E), during the period of January 18 to March 5 1999 and February 29 to March 3 1 2000, studied using the Rayleigh lidar observations of temperature.
DATA
Nighttime temperature profiles over Gadanki were derived using Rayleigh lidar measurements. The lidar employs a Nd: YAG laser operated at its harmonic wavelength of 532 nm as the transmitter. The pulse energy is 0.4
Adv. Space Res. Vol. 32, No. 5, pp. 807-812, 2003 8 2003 COSPAR. Published by Elsevier Ltd. All tights reserved Printed in Great Britain 0273-l 177/$30.00 + 0.00
808 K. Rajeev er al.
J and pulse width is 7 ns. The lidar is operated with an altitude resolution of 300 m and a pulse repetition frequency of 20 Hz. The system provides backscattered signals, which are integrated over 5000 transmitted pulses, corresponding to a temporal averaging of 250 s and this form the basic raw data for further analysis. Estimation of temperature from lidar data and the sources of errors are explained in detail by Parameswaran et al. (2000). In order to reduce the statistical error associated with the data, the raw lidar data is integrated in height and time such that the temperature profiles are derived with a height resolution of 900 m and a time resolution of 12.5 minutes in the present study. The reference altitude required for the lidar inversion is taken as 80 km. A 10% bias error in the reference level temperature contributes an error of 2.5%, 0.16%, and 0.024% at altitudes of 70, 50, and 30 km respectively (Parameswaran et al., 2000). Statistical error due to signal variance, in general, is small (-1 K) at lower altitudes (30 - 50 km), which increases with increase in altitude (-2.5 .K at 65 km). Though the temperatures are derived up to 80 km, to minimise the uncertainty due to the various errors discussed above, data in the 27 to 60 km altitude region only is used for the present study. It may also be noted that the absolute temperature calibration is not critical in the present study since the deviations from the mean temperature is more important. During January 18 to March 5 1999, the lidar was operated for about 6 hours on 28 days and for 2 to 5 hours on 12 days (from -2000 IST to -0200 IST). Due to operational constraints, the lidar was operated continuously only for 3 hours (from 2000 IST to 2300 IST) for 30 days during the period of February 29 to March 31 2000, except for 3 days on which the lidar was operated continuously for 6 hours between 2000 IST and 0200 IST.
Potential energy per unit mass (E, in units of Jkg-‘) due to gravity wave activity is estimated from the temperature data using the relation (Wilson et al., 1991)
where g is the acceleration due to gravity, T/ (z) is the temperature fluctuation about a mean temperature of To (z) at the altitude, z. To is obtained by averaging all the temperature values during the particular night at the corresponding altitude. The brackets indicate the temporal average for the data period. N is the local Brunt-Vaisala frequency and is obtained from the altitude profile of temperature. The temperature fluctuation e(z)) at a given altitude and time is estimated by subtracting the corresponding temperature (T(z)) from the mean temperature for that night. In order to have intercomparison, the data during the year 1999 was truncated for a duration of 3 hours for the computation of I$, since the period of observation during 2000 was only 3 hours. The contribution from equatorial waves to the estimated values of E, will be negligible since their periods are significantly longer than the duration of observation
60.
g 5o
al
$ 40-
z
30.
lo9
0” 9 p lo8
2
Normalized Spectrum 27-47 km + 2000 - 1999
h +29 Feb -31 Mar 2000 4
--v----l .-- , --- 1 10 100 1 E-5 1 E-4 1 E-3
EP (J Kg-‘) Vertical Wavenumber (m-l)
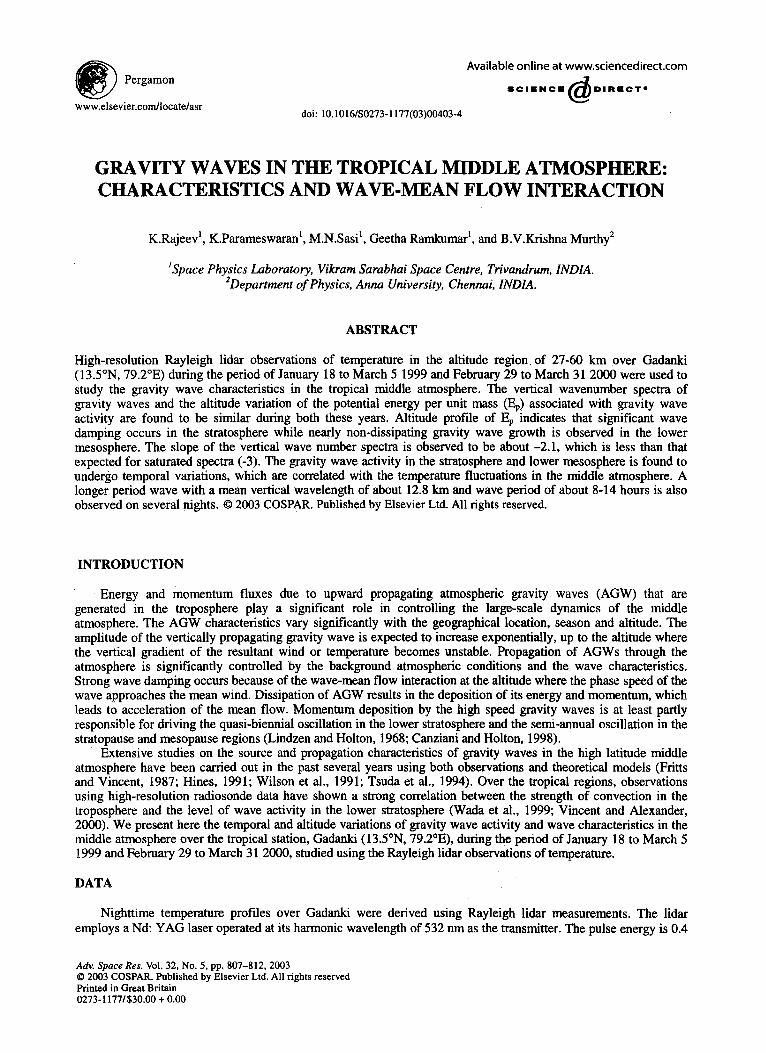
Fig. 1. Altitude profiles of the mean E, during January 18 - March 5 1999 and February 29 - March 31 2000. The dashed line indicates the non- dissipating wave growth (exp(z/H)) for H=6 km.
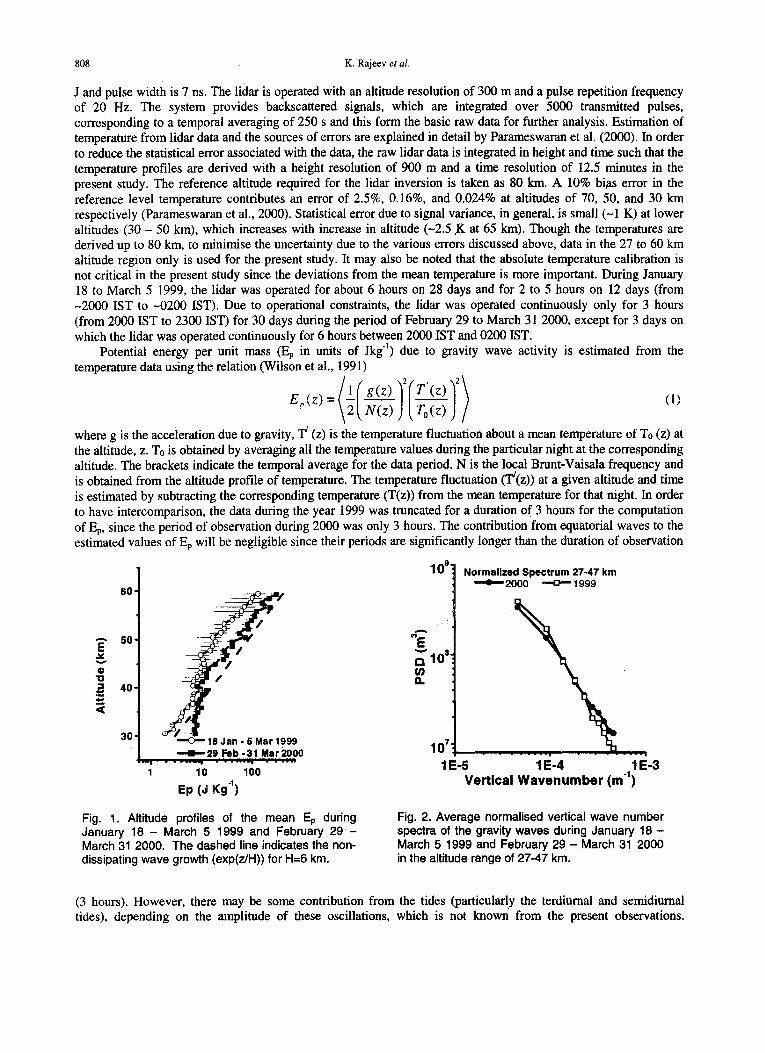
Fig. 2. Average normalised vertical wave number spectra of the gravity waves during January 18 - March 5 1999 and February 29 - March 31 2000 in the altitude range of 27-47 km.
(3 hours). However, there may be some contribution from the tides (particularl~y the terdiumal and semidiumal tides), depending on the amplitude of these oscillations, which is not known from the present observations.

Gravity Waves in the Tropical Middle Atmosphere 809
However, the amplitudes of the tidal components observed in the tropical middle atmosphere reported in the literature are small (~4 K) (Sasi and Krishna Murthy, 1993) which amounts to the variability in temperature in the range of 1 K to 2 K around the mean temperature over a period of 3 hours. While these values are not negligible, they are significantly smaller than the fluctuations in temperature at shorter time scales observed in the present study (-5 K to 10 K). Since variability appears as <IJ2> in the computation of Ep, the contribution from the tides is expected to be less than 20%. Thus, more than 80% of the Ep values estimated here are the potential energy of all the short period gravity waves with time scales more than 25 minutes and less than approximately 3 hours. The time scales of these temperature fluctuations correspond to the apparent frequency of the wave and not the intrinsic frequency in the reference frame of the flow.
‘RESULTS
Altitude variation of gravity wave activity Figure 1 shows the altitude profiles of the mean Ep during January 18 to March 5 1999 and the February 29 to
March 31 2000. The horizontal bars indicate the standard error in Er, at each altitude, which is smaller at lower altitudes. Considering that the observed temporal variation in temperature is -5K to 1OK below 60 km, the increase in the computed Et, with altitude due to increase in signal variance is expected to be less than 5% below 50 km, while it will be less than -10% between 50 and 60 km. Altitude variation in Ep is similar during 1999 and 2000, though Ep is smaller during 1999 compared to that during 2000. The increase in Et, with altitude is small between 35 km - 47 km during 1999 and below 40 km during 2000, above which E,, increases almost .exponentially with increase in altitude at a rate that is expected for non-dissipating gravity waves (assuming that the non-dissipating wave growth is exp (z/H), &here H is the scale height). Assuming’s scale height of 6 km, the altitude variation of the mean Ep indicates an average wave dissipation of 30% to 45% between 35 km and 47 km during January-March period.of 1999. Above -47 km the wave growth is close to the non-dissipating wave growth for a scale height of about 6 km. Du.ring the February-March period of 2000, gravity wave dissipation of 40-60% is observed up to 40 km, above which the wave growth is close to that for the non-dissipating gravity waves. Thus, although the extent of wave dissipation and the altitude region in which major dissipation occurs are slightly different, the wave dissipation is larger in the stratosphere and nearly non-dissipating wave growth is observed in the lower mesosphere during both the years of observation.
The vertical wave number spectra of the normal&d temperature fluctuations [g/N’(T’IT,), where T/ is the temperature fluctuation around a mean temperature T, at any altitude, z, and the Brunt-Vaisala frequency varies with z due to altitude variation in temperature] in the altitude range of 27-47 km are computed for the individual profiles and the mean spectra averaged for the whole period of observation in each year are shown in Figure 2. The vertical wave number spectra are similar in 1999 and 2000. The average slope of the vertical wave number spectra is about -2.1, which is smaller than that expected for saturated spectra (-3). It may be noted that the above spectra are limited to vertical wavelengths greater than 2 km and that the Doppler effect is not corrected for. However, the ‘horizontal phase speeds of gravity waves are expected to be significantly larger than the background wind speed and hence Doppler effect is expected to be very small in the wavenumber spectra shown in Figure 2.
Temporal variations in E,: wave-mean flow interaction The temporal variations in gravity wave activity in the middle atmosphere can be affected by the conditions
prevailing in the background atmosphere through which they propagate by affecting the vertical propagation of gravity waves (Isler and Fritts, 1994; Parameswaran et al., 2002). In this section we examine the temporal variability of the daily mean Ep values and the associated changes in the mean temperature during January 18 - February 24 1999 (due to nonavailability of data on several days, data after February 24 1999 is not included here). ‘Figure 3a shows the daily variations in the average Ep at two different altitude ranges (30-35 km representing the lower stratosphere and 50-55 km representing the lower mesosphere) during January 18 -February 24 1999 obtained by averaging the estimated Et, in the respective altitude regions. The Er, values are found to have significant day-to-day fluctuations, which are superposed on variations at longer time-scales. (Note that Er, mainly depends on the strength of the gravity wave sources, which itself may have day-today variability, and this might have contributed to the random variations in Er). The temporal variations in l$, are similar at both the altitudes, except for the magnitude in the variation that is larger in the 50-55 km region. In order to study the association between the temporal variability in Ep and changes in the background atmospheric conditions, the daily variations in the mean temperature for the 3 hour observation period for each day is obtained by subtracting the mean temperature during January 18 to February 24 1999 from the 3 hour mean temperature for a given day at a given altitude. These deviations in temperature for each day are averaged in the altitude ranges of 30-35 km and 50-55 km and are also

810 K. Rajeev et al.
shown in Figure 3a (indicated by dT). These dT values indicate the variations in the background atmospheric temperature mainly due to long period equatorial waves. Though significant random day-to-day variations are seen in E$ and dT, in general, the longer time-scale variations in I$, are almost anti-correlated with the variations in dT. For example, between day number 5 and 17, dT at both the altitude region increases with time, which is associated with a decrease in & during the same period. It should also be noted that increase in the mean temperature will cause a decrease in E$ (see Eq.( 1)). However, the observed temporal variation in Ep is significantly larger than that can be caused by the change in dT. For example, at 50-55 km, the average E, between the day numbers 1 and 6 is 31.5 Jkg“ and that between day numbers 10 and 16 is 15.4 Jkg-’ (change of about 5$%). The corresponding increase in the mean temperature observed is about 8.1 K, which can cause a decrease in Ep by about 6% only (for a mean temperature of 255K in the 50-55 km altitude region).
+B- Mean Ep (30 - 35 km) -o- Mean Ep (50 - 55 km)
Mean dT (30 - 35 km) P -a- Mean dT (50 - 55 km)
0 5 10 15 20 25 30 35 40 96 Day Number (since 18 Jan 1999) .w.
‘;m 1’ ) C -A- Ep (50 - 55 km) -@- dT (SO - 55 ky)
2
lm5 (cl) Perioi YDays)
1.2 1
-r-- Ep(30 - 36 km), dT(30 - 36 km) --e-- Ep(60 - 81 km), dT(B0 - S6 km) --+- Ep(S0 - 55 km)$T(30 - 3,5 km)
0.9
3 2 3 0.6
.Z 0.3
2.7 (b). I + Ep (30 - 35 km) -e- dT (30 - 36 km)
Period (Days) Period (Days)
Fig. 3 (a)Temporal variations of E, and the deviations in the mean temperature (indicated by dT) averaged over the altituae regions of 30 -35 km and 50-55 km, (b) spectral amplitudes of the temporal variations in dT and E, at the 30-35 km region, (c) same as (b) but for the 50-55 km region, and (d) cross spectral power (CSP) of E, and dT variations at 30-35 km and 50-55 km, and the cross spectrum of E, at 50-55 km and.dT at 30-35 km.
Figures 3b shows the spectral amplitudes of the temporal variations in dT and Ep at the 30-35 km region obtained by Fourier analysis. Major periods of variation observed in dT and Ep at the 30-35 km region are around 19, 12, 6 and 3 days. Figure 3c is similar to Figure 3b, but for the 50-55 km altitude region. At 50-55 km, major periods observed are around 38, 19, 9, and 3 days in Ep and around 38, 19, 9 and 6 days in dT. However, the spectral peak seen at a period of 38 days corresponds to the total duration of data (fundamental frequency), and hence is not emphasised here. Thus, spectral peaks in EP and dT at both the altitude ranges are observed at nearly the same wave periods. The cross spectrum of Ep and dT variations at 30-35 km and 50-55 km, and the ‘cross spectrum of Ep at 50-55 km and the dT at 30-35 km are shown in Figure 3d. The cross spectrum shown in Figure 3d are normalised with the highest spectral power of the corresponding spectrum, for comparison. The cross-spectral amplitudes of Ep and dT at 30-35 km is high at around 38, 19,9 and 3 days. Cross-spectral amplitudes of E,, and dT at 50-55 km are high at 38 and 19 days period. The cross spectral amplitudes of Ep at 50-55 km and dT at 30-35 km are high at around 38, 19, 12 and 3 days (dominantly at 19 and 3 days) period. This might be indicative of the influence of the background atmospheric variations (in temperature, with corresponding variations expected in wind) at the stratosphere on the gravity wave activity at the lower mesosphere. However, this hypothesis needs
Gravity Waves in the Tropical Middle Atmosphere 811
more support using the background wind data (since the vertical propagation of gravity waves are affected mainly by the background winds), which was lacking during the 1999 observation period.
The variability in Er, along with that in the background atmospheric wind was studied using the lidar derived temperature and rocket measured wind data obtained during February 29 to March 31 2000 by Parameswaran et al., (2002). They showed that the minimum gravity wave activity in the lower mesosphere occurred during the southward phase of meridional wind and the westward phase of zonal wind oscillations in the lower stratosphere. Higher values of Ep were observed when the background wind in the 30-37 km was a maximum in the eastward and southward directions. This indicates that part of the variation of Ep in the middle atmosphere may be caused by the filtering process due to the interaction between gravity waves and the background wind. The cross-spectrum between E, and zonal wind variations showed largest amplitudes at periods of 4- and 1Zdays while that between Er and the meridional wind variations shows largest amplitude at 4-days (Parameswaran et al., 2002).
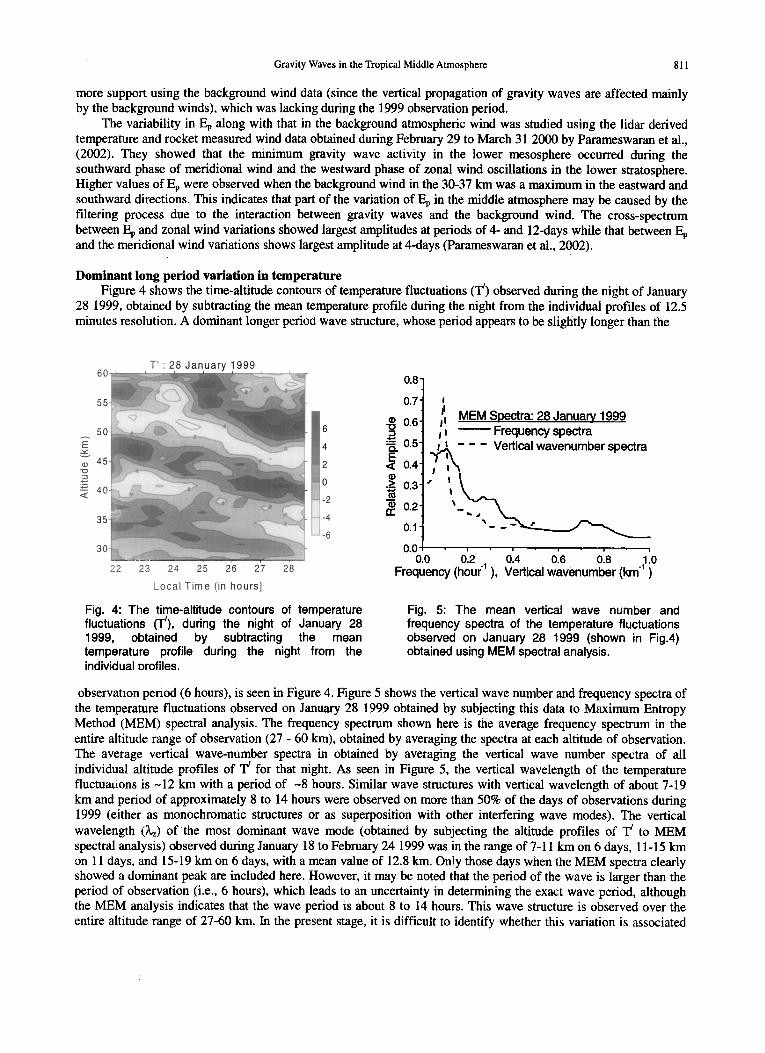
Dominant long period variation in temperature Figure 4 shows the time-altitude contours of temperature fluctuations (T’) observed during the night of January
28 1999, obtained by subtracting the mean temperature profile during the night from the individual profiles of 12.5 minutes resolution. A dominant longer period wave structure, whose period appears to be slightly longer than the
T’ : 28 January 1999 0.8
1
MEM Snectra: 28 Januarv 1999 -- Frequency spectra
Vertical wavenumber spectra
2’2 23 24 25 26 2; 28
Local Time (in hours]
Fig. 4: The time-altitude contours of temperature fluctuations (T’), during the night of January 28 1999, obtained by subtracting the mean temperature profile during the night from the individual orofiles.
Frec$ncy (fktr’ ), kkkaf ikenurn’ir (km-l )”
Fig. 5: The mean vertical wave number and frequency spectra of the temperature fluctuations observed on January 28 1999 (shown in Fig.4) obtained using MEM spectral analysis.
observation period (6 hours), is seen in Figure 4. Figure 5 shows the vertical wave number and frequency spectra of the temperature fluctuations observed on January 28 1999 obtained by subjecting this data to Maximum Entropy Method (MEM) spectral analysis. The frequency spectrum shown here is the average frequency spectrum in the entire altitude range of observation (27 - 60 km), obtained by averaging the spectra at each altitude of observation. The average vertical wave-number spectra in obtained by averaging the vertical wave number spectra of all individual altitude profiles of T/ for that night. As seen in Figure 5, the vertical wavelength of the temperature fluctuations is -12 km with a period of -8 hours. Similar wave structures with vertical wavelength of about 7-19 km and period of approximately 8 to 14 hours were observed on more than 50% of the days of observations during 1999 (either as monochromatic structures or as superposition with other interfering wave modes). The vertical wavelength &) of the most dominant wave mode (obtained by subjecting the altitude profiles of T’ to MEM spectral analysis) observed during January 18 to February 24 1999 was in the range of 7-l 1 km on 6 days, 1 l-15 km on 11 days, and 15-19 km on 6 days, with a mean value of 12.8 km. Only those days when the MEM spectra clearly showed a dominant peak are included here. However, it may be noted that the period of the wave is larger than the period of observation (i.e., 6 hours), which leads to an uncertainty in determining the exact wave period, although the MEM analysis indicates that the wave period is about 8 to 14 hours. This wave structure is observed over the entire altitude range of 27-60 km. In the present stage, it is difficult to identify whether this variation is associated

812 K. Rajeev et al.
‘with tides or gravity waves. The identification of the wave type (i.e:, gravity wave or tide) and the wave characteristics such as phase velocity and direction of propagation requires information on wind fluctuations,
CONCLUSIONS
The vertical wavenumber spectra of gravity waves and the spatio-temporal variations in the gravity wave activity and its variation with the background atmospheric temperature during January 18 - March 5 1999 and February 29 - March 3.1 2000 are studied. The vertical wavenumber spectra in the stratosphere are similar during 1999 and 2000 and the slope of the spectra is -2.1, which is less than that for the saturated spectra. Altitude variation in Er is similar during 1999 and 2000, though I$, is smaller during 1999 compared to 2000. The increase in Er with altitude is small between 35 and 47 km during 1999 and up to 40 km during 2000. Above this, Er increases almost exponentially with altitude, as expected for non-dissipating gravity waves. The gravity wave activity is found to undergo variations that are correlated with the variations in the background atmospheric temperature. A dominant wave mode with vertical wavelength of about 12 km and period of about 8-14 hours was observed on about 50% of the days of observation during 1999. Type of the wave and its characteristics are being investigated.
ACKNOWLEDGEMENTS
Lidar data was obtained from the National MST Radar Facility at Gadanki, which is operated as an autonomous Facility under Department of Space (DOS) with partial support from Council of Scientific and Industrial Research (CSIR). The authors are thankful to the technical and scientific personnel of NMRF, SDSC, and VSSC whose dedicated efforts made it possible to conduct this experimental program. B V Krishna Murthy would like to acknowledge CSIR for grant of Emeritus Scientistship.
REFERENCES
Canziani, P.O., and J. R. Holton, Kelvin waves and the quasi-biennial oscillation: An observational analysis, J. Geophys. Res., 103,31,509-31,521, 1998.
Fritts, D. C., and R. A. Vincent, Mesospheric momentum flux studies at Adelaide, Australia: Observations and a gravity wave-tidal interaction model, J. Afmos. Sci., 44,605-619, 1987.
Hines, C. O., The saturation of gravity waves in the middle atmosphere. Part II: development of Doppler-spread theory, J. Atmos. Sci., 48, 1360-1379, 1991.
Isler, J. R., and D. C. Fritts, Gravity wave variability and interaction with lower-frequency motions in the mesosphere and lower thermosphere over Hawaii, J. Atmos. Sci., 53.37-48, 1996.
Lindzen, R. S., and J. R. Holton, A theory of the quasi-biennial oscillation, J. Atmos. Sci., 25, 1095-l 107, 1968. Parameswaran, K., M.N.Sasi, Geetha Ramkumar, P.R.Nair, V.Deepa, B.V.Krishna Mm-thy, S.R.Prabhakaran Nayar,
K.Revathy, G.Mridula, K.Satheesan, Y.Bhavanikumar, W.Sivakumar, K.Reghunath, T.Rajendraprasad, and MKrishnaih, Altitude profiles of temperature from 4 to 80 km over the tropics from MST radar and lidar, J. Atmos. Sol. Terr. Phys., 62, 1327-1337,200O.
Parameswaran, K., K. Rajeev, M.N.Sasi, Geetha Ramkumar, and B.V.Krishna.Murthy, First observational evidence of the modulation of gravity wave activity in the low latitude middle atmosphere by equatorial waves, Geophys. Res. Z.etts., 29, NO. 6, 10.1029/2001GL013625,2002
Sasi, M.N., and B. V. Krishna Murthy, An observational study of middle atmospheric diurnal tides over Trivandrum (8.5N, 77 E), J. Geomag. Geoelectr., 45547-561, 1993.
Tsuda, T., Y. Murayama, T.Nakamura, R.A.Vincent, A.H.Manson, C.E.Meek, and R.L.Wilson; Variations of the gravity wave characteristics with height, season and latitude revealed by comparative observations, J. Atmos. Terr. Phys., 56,555-568, 1994.
Vincent, R.‘A., and M. 9. Alexander, Gravity waves in the tropical lower stratosphere: An observational study of seasonal and interannual variability, J. Geophys. Res., 105, 17,971-17,982,2000.
Wada, K., T. Nitta, and K. Sato, Equatorial inertia-gravity waves in the lower stratosphere revealed by TGGA- COARE IOP data, J. Meteorol. Sot. Jpn, 77,721-736, 1999.
Wilson, R., M. L. Char&, and A. Hauchecome, Gravity waves in the middle atmosphere observed by Rayleigh lidar 1. Case studies, J. Geophys. Res., 96,5153-5165, 1991.
E-mail address: [email protected] ; for K. Rajeev: [email protected] Manuscript received 1 December 2002; revised 4 February 2003; accepted 2 April 2003.