grass-legume seed institute presentation roseau, … · grass-legume seed institute presentation...
TRANSCRIPT

prepared by
N. Ehlke, D. Vellekson, and D.Grafstrom
Department of Agronomy and Plant Genetics
University of Minnesota
St. Paul, Minnesota 55108
Grass-Legume Seed Institute Presentation
Roseau, MN - February 27, 2013
Yearly Data Summaries are on the Web at:http://www.mnturfseed.org/html/progress_reports.html
Table 1.Variety Performance Trials:
Table 2. Kentucky Bluegrass seeded in 2008.
Table 3. Kentucky Bluegrass seeded in 2009.
Table 4.
Table 5. Perennial Ryegrass seeded in 2011.
Table 6. Tall Fescue seeded in 2011.
Perennial Ryegrass Management Trials:
Table 7. Nitrogen Rates/Timing-4 Yr.Yield Summary
Table 7A. Nitrogen Rates/Timing-MagPlots
Table 8. Stabilized Nitrogen Applications-2 Locations
Table 9. 30 Lbs. Nitrogen Added to Standard Application-2 Locations
Table 10.
Table 11.
Table12. Fungicides/Liquid Nitrogen Applications- Helmstetter-MagPlotsTable 13. Apogee Split Applications-MagPlotsTable 14. Apogee Rates-MagPlots
Table 15. Late Rescue Herbicide Applications-Magnusson Farm
Table16. Assure II/Fusilade Fall/Spring Applications-MagPlotsTable 17. Date of Swath-MagPlots
Other Trials:
Table 18. Herbicides Applied to Underseeded Grasses in Wheat- MagPlots
Table 19. Tall Fescue Establishment-Management- MagPlotsTable 20. Junegrass Seeding Date x Rate-MagPlots
Table 21.Table 22. In Furrow Fertility- Wheat Summary 2010-2012-MagPlots
Table 22a&b. In Furrow Wheat Fertility 2011 &2012-MagPlotsTable 23. 50/50 ESN-Urea Blends in Spring Wheat-2 LocationsTable 24. ESN Blends in Water Logged Soil on Spring Wheat-MagPlots Table 25. In Furrow-Liquid Applications to Spring Wheat-Magnusson Farm
PROGRESS REPORT ON GRASS SEED PRODUCTION RESEARCH
Junegrass Variety x Growth Regulator x Fertilizer-MagPlots.
Liquid Nitrogen Added to Standard Pesticide Apps-MagPlots-Erickson
Perennial Ryegrass winter hardiness trial seeded 2011.
Fertilizer Sources- Helmstetter Farm
Precipitation Data 1967-2012

Table 1. Monthly and Year End Precipitation Totals*
Roseau ,Mn 1967-2012.
DEVIATION Park' blg.
Yearly FROM mean yield
Year Jan Feb Mar Apr May June July Aug Sept Oct Nov Dec Total(in.) MEAN lbs/A
1967 1.13 0.39 0.59 2.89 0.89 2.23 4.95 1.69 0.83 1.11 0.70 1.76 19.16 -2.61
1968 0.62 T 1.25 0.63 1.46 6.47 6.13 8.49 2.35 1.26 1.06 0.21 29.93 8.16 650
1969 3.07 0.11 0.05 1.27 3.31 2.29 3.70 4.28 3.29 1.91 0.30 0.73 24.31 2.54 488
1970 0.71 0.41 1.38 2.56 5.93 4.07 3.55 0.83 2.77 1.49 1.21 0.37 25.28 3.51 673
1971 0.54 0.13 0.26 1.50 2.24 2.29 3.58 0.69 3.33 2.97 0.29 0.50 18.32 -3.45 492
1972 0.68 0.76 0.50 0.70 1.66 5.03 1.92 1.53 4.22 1.40 0.38 0.32 19.10 -2.67 405
1973 0.09 0.17 1.18 0.90 2.46 2.21 4.04 2.09 5.67 1.19 0.67 0.75 21.42 -0.35 422
1974 0.88 0.87 0.16 2.72 4.12 1.56 2.56 11.00 0.42 0.66 0.15 1.40 26.47 4.70 642
1975 1.10 0.29 0.64 1.40 1.52 4.96 2.26 1.75 1.79 1.49 0.20 0.65 18.05 -3.72 504
1976 1.13 0.50 1.05 0.77 0.54 5.82 1.52 3.72 0.34 0.07 T 0.37 15.83 -5.94 146
1977 0.14 0.62 1.02 0.27 2.43 3.71 2.28 1.74 3.83 0.87 2.27 0.26 19.44 -2.33 140
1978 0.36 0.26 0.17 1.00 1.97 1.92 6.25 3.25 3.44 0.23 0.98 0.79 20.62 -1.15 507
1979 0.50 1.01 1.06 2.77 1.89 1.91 3.70 1.59 0.45 1.40 1.02 0.16 17.46 -4.31 415
1980 0.55 0.82 0.35 0.00 0.24 1.75 3.35 5.19 4.12 1.66 0.94 0.18 19.15 -2.62 62
1981 0.27 0.16 0.66 0.56 2.79 6.85 2.63 2.41 3.63 1.75 0.90 0.99 23.60 1.83 625
1982 1.30 0.45 0.74 0.24 1.38 2.00 5.53 2.71 1.92 2.91 0.46 0.57 20.21 -1.56 595
1983 1.31 1.26 1.17 0.53 2.76 4.03 1.62 3.34 2.91 2.26 0.66 0.10 21.95 0.18 605
1984 T 0.95 T 0.72 0.72 4.46 3.78 0.99 0.37 4.32 0.10 1.02 17.43 -4.34 613
1985 0.12 0.33 0.06 1.07 4.35 4.62 1.08 8.72 1.60 1.04 1.68 0.38 25.05 3.28 525
1986 0.30 0.90 0.26 2.96 1.40 2.43 3.59 2.04 2.52 0.65 1.97 0.36 19.38 -2.39 488
1987 0.47 0.30 0.10 0.59 4.37 2.25 4.80 2.22 0.82 0.92 0.73 0.35 17.92 -3.85 288
1988 0.60 0.09 1.75 0.00 1.74 1.34 5.53 1.70 2.24 0.12 0.77 1.05 16.93 -4.84 152
1989 3.27 0.32 2.86 0.10 2.82 5.46 1.60 2.56 1.24 0.41 0.62 0.45 21.71 -0.06 320
1990 0.55 0.20 1.12 1.09 0.46 3.19 2.48 0.62 0.91 0.16 0.18 0.72 11.68 -10.09 160
1991 0.56 0.64 0.58 2.87 3.19 5.94 3.40 1.99 7.42 1.64 1.36 0.70 30.29 8.52 210
1992 0.61 0.68 0.45 2.27 1.99 2.36 2.72 4.51 2.76 0.12 1.27 0.88 20.62 -1.15 630
1993 0.68 0.05 0.27 1.01 1.63 5.06 5.87 4.69 0.72 0.71 0.45 0.65 21.79 0.02 490
1994 0.21 0.33 0.47 0.02 0.16 2.54 3.03 3.48 3.94 1.38 2.72 0.32 18.60 -3.17 230
1995 0.57 0.59 1.23 0.61 2.50 2.13 4.59 3.59 1.81 1.33 1.54 1.46 21.95 0.18 300
1996 0.94 0.48 0.22 1.65 4.62 1.64 7.34 1.78 1.77 1.75 2.73 1.07 25.99 4.22 250
1997 1.06 0.14 1.02 0.84 2.02 3.36 4.02 1.31 4.01 2.45 0.19 0.25 20.67 -1.10 350
1998 0.69 1.05 0.21 0.77 4.55 5.39 3.01 2.20 0.31 4.42 1.39 0.95 24.94 3.17 275
1999 0.15 0.77 0.23 1.31 4.09 6.97 3.46 1.38 3.16 0.43 0.38 0.56 22.89 1.12 400
2000 0.45 0.14 0.79 0.38 1.83 7.38 1.63 6.45 2.14 2.89 3.41 0.74 28.23 6.46 550
2001 0.21 0.52 0.46 1.89 3.27 1.76 4.74 1.40 0.72 1.76 1.50 0.56 18.79 -2.98 575
2002 0.19 0.10 0.45 1.44 2.79 9.94 2.96 4.47 1.62 1.02 0.30 0.54 25.82 4.05 300
2003 0.80 0.77 1.60 1.75 2.95 3.56 1.92 1.78 4.55 1.32 1.52 1.95 24.47 2.70 550
2004 2.85 0.70 2.14 2.61 8.19 2.98 2.42 5.50 2.97 2.36 0.08 1.33 34.13 12.36 650
2005 2.33 0.67 0.82 0.73 3.62 7.55 3.37 3.24 1.77 3.48 2.06 1.65 31.29 9.52 400
2006 2.52 0.95 1.01 1.23 1.97 1.00 0.94 2.18 2.42 1.54 0.17 0.56 16.49 -5.28 300
2007 0.44 0.56 1.25 0.95 2.75 7.75 2.92 1.37 0.92 5.14 0.39 0.86 25.30 3.53 200
2008 0.25 1.29 0.46 2.17 1.56 3.93 4.33 3.63 3.06 2.37 2.00 1.47 26.52 4.75 275
2009 1.25 1.75 4.45 1.37 3.59 3.72 1.28 3.92 2.67 1.06 0.28 1.22 26.56 4.79 375
2010 0.80 0.43 0.55 1.23 6.47 2.88 3.79 1.50 6.09 2.42 1.14 0.61 27.91 6.14 350
2011 1.15 0.20 0.23 3.14 2.63 3.87 2.38 1.63 0.89 1.34 0.19 0.07 17.72 -4.05 375
2012 0.59 1.06 2.06 1.39 1.48 3.32 2.74 1.42 0.18 3.64 1.22 0.24 19.10 -2.67 275
21.77
*Precipitation amounts used are from the Roseau research site April-September
and the National Weather Service the remainder of the year.
46 year average annual precipitation

Table 2.
2008 Kentucky Bluegrass Variety Trial
Magnusson Research Farm
Seed 2010-12
Variety lot %of Mean 2012 2011 2010 Ht.(In.) Lodging* Date 5/22 6/1 6/6 6/10
Dragon 3671 152 192 760 633 15 1 6/29 1 33 68 95
Abbey 3608 138 91 758 591 14 1 7/6 0 2 15 50
A99-2679 3774 101 109 607 337 14 1 7/6 0 3 20 50
A99-3124 3872 101 123 607 326 16 1 7/7 0 3 20 55
A99-2626 3792 96 100 600 299 13 1 7/7 0 1 15 50
Unique 3794 96 136 560 303 15 1 7/3 0 4 23 63
A99-2950 3771 88 58 535 321 16 1 7/6 0 13 35 83
Park 3888 80 60 408 368 24 1 7/3 9 79 100 100
A97-1436 3764 76 42 433 314 13 1 7/7 0 4 30 65
Midnight 3539 71 67 390 281 16 1 7/4 0 0 1 18
LSD @ 5%Level 11 24 49 81 2 0 5 2 5 9 11
Mean seed yield 2010-12= 347#/ac.
Experimental Design: RCB w/4 reps
*Lodging-1=no lodging; 9=flat
Management:
All plots burned 7/30/2011
110+30+40+8s applied 10/20/11
.75pt. 2,4-D+.75pt Banvel applied 9/20/11
3 oz. Tilt applied 6/1/12
XXXXXXXXXXXXXXXXXXXXXXXXXXXXXXXXXXXXXXXXXXXXXXXXXXXXXXXXXXXXXXXXXXXXXXXXXXXXXXXXXXXXXXXXXXX
Table 3.
2009 Kentucky Bluegrass Variety Trial
Magnusson Farm-
Fall
Seed 2011-12 #/acre Regrowth1
Variety lot %of Mean 2012 2011 22-Aug Ht.(In.) Lodging* Date 5/22 6/1 6/6 6/10
Dragon 3671 145 339 615 5.8 16.0 1 7/1 0 43 80 97
Abbey 3608 126 263 562 6.5 16.0 1 7/1 0 10 33 80
A99-2679 3774 113 279 462 2.5 16.0 1 7/8 0 10 28 68
A99-3124 3897 113 283 457 2.3 16.0 1 7/8 0 6 23 60
A99-2626 3899 96 230 401 2.3 15.0 1 7/8 0 6 23 60
A99-2950 3898 84 158 390 3.5 16.0 1 7/8 0 18 35 85
Midnight 3539 74 149 332 5.0 18.0 1 7/8 0 1 13 43
Park 3888 50 161 169 7.5 28.0 1 6/27 14 90 100 100
LSD @5%Level 21 72 92 0.9 1.5 0 0.8 1 7 8 9
Experimental Design: RCB w/4 reps
Mean seed yield 2011-12=328 #/ac.
*Lodging-1=no lodging; 9=flat
1Fall regrowth-1=none;9=best
Management:
All plots burned 7/30/2011
110+30+40+8s applied 10/20/11
.75pt. 2,4-D+.75pt Banvel applied 9/20/11
3 oz. Tilt applied 6/1/12
Harvest-2012 % Heading-2012
Seed Yield
Seed Yield
#/acre % Heading-2012 Harvest-2012

Table 4.
2011 Seeding Perennial Ryegrass Winter Hardiness Variety Trial
St.Paul Campus and Magnusson Research Farm Roseau,Mn
St.Paul Roseau Mean
Winter Winter WI
Seed Injury1 Vigor2 Injury1Roseau-
Variety Source Lot 3/27/12 3/27/12 4/26/12 St.Paul
Brightstar SLT check 3661 NA NA 5.8 NA
Affinity check 3500 NA NA 4.8 NA
Arctic Green U of M 3953 1.1 5.8 3.0 2.1
FTM WH C4-10 pickseed 3963 1.9 3.8 4.3 3.1
FTM WH C2-09 pickseed 3962 1.8 3.5 6.0 3.9
FTM BL C2-09 pickseed 3960 1.5 4.3 4.3 2.9
NK-200 check 3917 1.3 6.3 3.0 2.1
08 FTMSESL pickseed 3961 1.8 3.8 5.0 3.4
Quebec check 3964 1.6 3.5 5.0 3.3
Forageur U of M 3942 1.1 6.8 3.3 2.2
WH select U of M 3931 1.0 6.5 3.3 2.1
Ribeye(annual) check 3689 4.8 5.0 9.0 6.9
3934 U of M 3934 1.4 6.0 4.3 2.8
Survivor U of M 3848 1.3 6.3 3.3 2.3
922-tetraploid check 3926 3.0 2.2 7.8 5.4
MSP U of M 3955 1.4 4.5 5.0 3.2
LSD @5% level 0.5 1.0 0.7 0.5
Planted 9/8/2011 and 8/25/2011 at St.Paul with no cover crop.
Experimental Design:RCB with 4 Reps1Winter injury--1=no injury; 9=dead2Plant vigor-- 1=least; 9=most
NA=Poor stand
XXXXXXXXXXXXXXXXXXXXXXXXXXXXXXXXXXXXXXXXXXXXXXXXXXXXXXXXXXXXXXXXXXXXXXXXXXXXXXXXXXXXXXXXXXXX
Table 5.
2011 Perennial Ryegrass Seed Production Variety Trial
Magnusson Research Farm- Roseau,Mn
Seed Yield Winter
Variety seed lot (#/ac.) Injury1 Lodging2Ht.(in.) Date 2-Jul 10-Jul 5-Jun 8-Jun 13-Jun 17-Jun
Arctic Green 3953 1773 2.3 3.3 21 23-Jul 507 379 10 27 50 77
3934 3934 1803 2.3 2 22 22-Jul 558 437 13 27 53 83
Brightstar SLT 3661 1176 2.7 1.7 20 23-Jul 527 409 10 30 58 77
Affinity 3500 1328 3 2.3 24 22-Jul 468 386 13 47 77 92
NK-200 3917 1277 2.3 3.3 28 28-Jul 553 423 2 7 20 47
MSP 3955 1619 3 2 19 22-Jul 549 435 10 28 47 72
LSD @5% level 325 0.8 1.5 1.3 0.4 76 48 7.8 13.7 18.8 12.4
CV(%) 11.9 16.6 34.8 3.2 1 7.9 6.4 44 27 20 9
Planting date--8/25/2011
Experimental Design:RCB with 3 Reps1Winter injury-1=No injury; 9=Dead2Lodging-1=Upright;9=flat3RCI(relative chlorophyll index)-higher number means more chlorophyll.
Management:
60-30-30-7s 10/15/2011
3/4pt 2,4-D+3/4pt.Banvel and 10 oz. Quilt applied as separate applications
Harvest RCI Rating3 % Heading

Table 6.
2011 Tall Fescue Seed Production Variety Trial
F7NE- Magnusson Research Farm-Roseau,Mn
Seed Yield Harvest
Variety msp# #/acre 6/4/2012 6/9/2012 6/14/2012 Ht.(in.)
1 PSG 85 P1 3952 840 33 63 91 35
2 Speedway 3950 1022 18 45 76 34
3 Brockton 3944 967 20 50 85 36
4 Kentucky 31 3947 771 43 75 99 44
5 Crossfire 3 3948 851 18 38 65 32
6 Mustang 4 3949 936 23 55 88 34
7 D3- WH* 3943 1005 18 40 78 34
8 Greystone 3946 913 20 48 88 36
9 Durana 3945 1098 10 38 73 36
10 SR 8650 3951 1002 13 40 81 32
LSD @5% level 144 6 9 12 2
Experimental Design: RCB with 4 reps.
Tall fescue underseeded with spring wheat 5/22/2011.
Plot size= 5' x 20'
Tall fescue seeding rate= 6#/acre
% Heading

Table 7.
2009-12 Perennial Ryegrass Fertility Overall Yield Summaries
Magnusson Research Farm
Total # Application Application
trt# Nitrogen Rate2 timing 2010-201232009-2012 2012 2011 2010 2009
1 0 0 0 29 35 21 36 31 51
2 60 60+0+0 Fall 76 58 69 82 82
3 100 60ESN+40 Fall 91 91 80 93 101
4 100 100+0+0 Fall 98 99 83 110 100 101
5 100 100+0+0+22s Fall 104 77 105 103 100
6 140 140+0+0 Fall 114 84 119 109 107
7 100 30ESN+70 Split1
103 103 104 108 96
8 100 100+0+0 Split1
107 108 112 108 100 111
9 100 100+0+0+22s Split1
107 106 111 110 101 102
10 140 140+0+0 Split1
117 112 118 118 114 99
11 60 60+0+0 spring 96 96 93 98 96
12 100 20ESN+80 spring 110 110 102 121 106
13 100 100+0+0 spring 104 108 96 108 108 119
14 100 100+0+0+22s spring 105 106 92 115 107 110
15 140 140+0+0 spring 118 120 119 115 121 126
LSD @5% level 9 10 11 12 13 16
Mean Yield #/acre 1499 1313 1136 1274
Plot size= 10' x 12'
7+31+40 Fall applied to all plots.
Variety- Arctic Green(Ragnar II in 2009) planted in spring under wheat.1Split applications had 30# N urea in fall and remainder of application in spring
except 2009 was 50% of total applied fall and 50% in spring.
AMS applications made in fall.2ESN and urea splits may vary slightly from year to year but
total nitrogen rates are as stated.3 2010-2012 may be best data. 2009 had high carryover soil nitrogen.4 Missing data did not have treatments applied in those years.
Observations/Conclusions:
1)140# N rate generally produced the highest seed yields.
2)Split application(2/3 or more applied in spring) or spring only applications generally produced
higher yields than fall applications.
3)Spring nitrogen applications with 20%ESN sometimes produced higher yields than 100% urea.
Seed Yield as % of Yearly Means4

Table 7A.
2011-12 Perennial Ryegrass Fertility Trial
Magnusson Research Farm
Application Application Color %Hding
trt# Rate timing #/acre % of mean1Date Lodging
2 Ht.(in.) 6/22 7/17 6/12 6/12
1 0 0 311 21 19-Jul 1.0 16 289 124 2.0 18
2 30urea+70coated Fall 1194 80 21-Jul 2.8 22 669 160 4.8 28
3 100+0+0 Fall 1251 83 20-Jul 2.5 22 736 165 5.3 30
4 100+0+0 clip*/split11827 122 21-Jul 4.5 22 832 160 8.0 35
5 140+0+0 clip*/split11804 120 22-Jul 7.0 23 946 164 8.8 45
6 30coated/70urea Split1
1555 104 21-Jul 4.5 22 725 172 5.8 35
7 100+0+0 Split1
1682 112 21-Jul 4.8 23 791 182 6.8 38
8 100+0+0+22s Split1
1668 111 21-Jul 5.3 23 816 166 6.5 28
9 140+0+0 Split1
1764 118 21-Jul 7.3 23 910 170 8.3 33
10 80urea+20coated spring 1534 102 21-Jul 4.8 23 813 170 6.5 40
11 100+0+0 spring 1440 96 21-Jul 4.3 21 743 150 6.8 35
12 100+0+0+22s spring 1386 92 22-Jul 4.5 22 818 164 6.8 33
13 140+0+0 spring 1786 119 22-Jul 6.5 23 904 181 8.0 40
14 100+0+0 Split1+SuperU 1470 98 21-Jul 5.0 23 791 158 7.0 40
15 100+0+0 Split1+Agrotain 1640 109 21-Jul 5.3 23 797 164 6.3 28
16 100+0+0 Split1+40#Liquid 1675 112 22-Jul 5.3 22 781 177 6.0 35
LSD @5% level 163 11 2 1.8 1.6 76 24 1.3 12
*Trts 4&5 had straw removed 9/2011(not a recommended management practice) to test
amount of nitrogen bound up with residue.1Split applications had 30# N urea in fall and remainder of application in spring.
Trt #8 had sulfur+N (AMS) fall applied.1Test Mean Yield=1499#/ac.2 Lodging-1=none;9=flat3RCI-Relative Chlorophyll Index; higher number = more chlorophyll
Variety- Arctic Green planted under wheat 5/11/2011.
7+31+40 applied to all plots and all fall treatments 10/22/2012.
Spring applications 4/16/2012
Plot size= 10' x 12'
Observations/Conclusions:
1)Removal of straw in the fall(clip/split) increased yield indicating significant nitrogen tied
up breaking down the residue. Increasing applied nitrogen to compensate may be needed to reduce deficiencies.
2)Fall only nitrogen applications produced lower yields than split or spring only applications.
3)Higher rates (140#N) produced higher yields than lower rates(100#N).
4)Split application(30#N fall) vs spring only (trt#7 vs. trt#11) produced a higher seed yield at 100# rate.
Split applications vs. spring only at the 140# rate(trt#9 vs. trt#13) did not have significantly different seed yield.
Seed Yield Harvest RCI3

Table 8.
2012 Perennial Ryegrass Fertility Trial using Stablized Nitrogen Sources
Magnusson Research Farm and Magnusson Farms Locations
Nitrogen Mag 2 Location Lodging Ht(in.) 18-Jul 23-Jun
Trt1Source Grower U of M Plots Mean3
MagPlots MagFarm MagFarm MagPlots
1 Urea 1188 1092 1133 1113 1.7 22.7 191 522
2 Super U 1133 1110 1343 1227 3.3 23.7 223 596
3 50%ESN+50%Urea 1101 990 1114 1052 1.3 22.3 174 510
4 Urea+Agrotain 1239 1050 1341 1196 2.3 22.7 182 588
LSD @ 10% level 125 113 NS NS(186) 2.0 0.9 31 67
CV(%) 7 7 15 7 58.0 2.5 10 8
All treatments spread at 80#/ac. N on 4/5/2012.
October fertility=30-30-30 on Magnusson Farm and 50-30-30-6s on MagPlot location1All treatments applied with 12' Gandy drop spreader.2U of M harvested samples from both location. In addition,grower harvested entire plot area(25' x 500').3Mean of U of M harvest at both locations.4RCI(Relative Chlorophyll index)-higher number=higher relative level of chlorophyll.
Magnusson Farm -on farm location 3 miles northwest of Roseau,Mn.
MagPlots- University of Minnesota Research farm - 6 miles northwest of Roseau,Mn .
Observations/Conclusions:
ESN/urea blend had lower seed yield than Urea+Agrotain or SuperU treatments at the Magnusson Farm location.
No significant seed yield differences overall among any of the treatments.
XXXXXXXXXXXXXXXXXXXXXXXXXXXXXXXXXXXXXXXXXXXXXXXXXXXXXXXXXXXXXXXXXXXXXXXXXXXXXXXXXXXXXXXXXX
Table 9.
2012 Perennial Ryegrass +30 Added Nitrogen Trial
At 2 Locations in Northern Minnesota.
18-Jul 16-Jul 12-Jul 16-Jul
Fertility Level-Urea source N Carlson5 Mag5Mag Carlson Carlson Carlson Mag Carlson
110#-Nitrogen1924 1175 182 203 1.7 1.3 22 20
110#+30# -Nitrogen 1 1170 1271 233 240 3.7 3.7 23 22
LSD @ 5% Level 92 87 27 24 NS 1.4 NS NS
CV 6.7 2.1 3.8 3.2 46 16.3 8 4
Additional +30#N urea spring applied
Treatments all grower applied and harvested.
Harvested plot area 48' x 500'1Location 1= Dean Carlson 14 miles southeast of Roseau 50# N in October+60# +Agrotain 4/12/2012-Variety-Arctic Green
Location 2= Magnusson Farms 3 miles northwest of Roseau 30# N in October + 80#N 4/6/2012- Variety-Provocative.2= Clean seed determined by subsample each plot- corrected to 11%moisture. 3RCI= Relative chlorphyll index- higher number=more chlorophyll present.4Lodging;1=none;9=flat5The +30 rate plots were swathed 3 days later at Magnusson location but all cut at the same time at Carlson location.
Observations/Conclusions:
The addition of 30#N/acre increased seed yields at both locations.
Carlson location +30#N treatment plots had higher seed yields than the standard rate but may
have been higher with a delay of swathing date.
Ht.( in.)
Seed Yield2 Harvest
RCI4Seed Yield -#/Ac.2
Magnusson Farm
RCI3 Lodging4

Table 10.
2011-12 Spring Wheat/Perennial Ryegrass Fertility Source Trial
Helmstetter Farm-Roosevelt,Mn.
Wheat-2011
Seed Yield Yield Test
Trt# Treatment1#/Ac. % Clean2 Bu/Ac.3
Wt./Bu. %Protein
1 MES10+Liquid 903 82.0 66.4 63.2 13.8
2 MAP+Liquid 905 80.5 68.6 62.7 13.8
3 MES10+ESN 866 81.4 64.5 64.0 13.7
LSD @10% level NS 0.01 NS 1.1 NS
CV(%) 3.8 0.9 4.0 1.0 2.1
Spring wheat underseeded with perennial ryegrass planted 4/28/2011.
Wheat variety-Barlow ; perennial ryegrass variety-Arctic Green
Experimental Design: RCB w/3 reps.
Plot size= 79' x 500' grower harvest.
Ryegrass fertility treatments applied by U of M. Grower applied wheat fertility treatments.
All other field operations performed by the grower using best management practices.1All treatments have equal amounts of N,P,K and Sulfur. P and S sources and N application timing are treatments.
Year1 Spring wheat=60-0-0 applied preplant and 60-0-0 applied post emergent to entire area.
MES10 or MAP applied to all plots in furrow.
Treatment #3=30#N/ac. ESN applied in furrow;other plots 30#N liquid applied.
Year2 Ryegrass= Oct.16,2011 --MAP,MES10,and MES10+30# N(ESN) applied by U of M;
30# N urea applied to remaining plots by grower. 120# N urea split applied by grower in spring 2012.2% clean seed at harvest. Yields reported as clean seed. 3Yields corrected to 12% moisture.
Fertilizer applied/acre
MAP=12-30-20-8s(added AMS for sulfur)-grower standard
MES10=9-30-20-8s
ESN=30-0-0
Observations/Conclusions:
There were no significant differences in either wheat or ryegrass yields with applications of MAP vs. MES10
or ESN vs. split liquid / urea applications.
Ryegrass - 2012

Table 11.
Liquid Nitrogen added to Standard Pesticide Applications*
of Perennial Ryegrass at 2 Locations-2012.
Douglas Erickson Farm-NW of Roseau variety 'Cutter II'
Magnusson Research Farm-variety'Arctic Green'
Broadleaf App Grass App1Growth Reg Fungicide
Trt# 5/15 5/24 5/29 6/15 Erickson MagPlots Average Erickson MagPlots Average
1 2,4-D+Clarity Grass control Apogee Quilt+N 100 93 96 973 1261 1117
2 2,4-D+Clarity+N Grass control Apogee Quilt+N 100 100 100 967 1359 1163
3 2,4-D+Clarity Grass control Apogee+N Quilt+N 110 115 113 1065 1568 1316
4 2,4-D+Clarity Grass+N Apogee Quilt+N 104 106 105 1007 1446 1226
5 2,4-D+Clarity+N Grass control Apogee+N Quilt+N 103 101 102 998 1370 1184
6 2,4-D+Clarity+N Grass+N Apogee+N Quilt+N 99 104 102 962 1414 1188
7 MCPE+Clarity+N Grass control Apogee Quilt+N 99 103 101 965 1401 1183
8 MCPE+Clarity+N Grass control Apogee Quilt 104 100 102 1018 1352 1185
9 2,4-D+Clarity Grass control Apogee Quilt 94 91 92 916 1232 1074
10 Huskie complete NONE Apogee Quilt+N 43 37 39 421 497 459
11 2,4-D+Clarity Permit Apogee Quilt+N 98 101 100 953 1370 1162
12 No treatment 87 86 87 851 1169 1010
LSD @ 5% Level 17.0 13.4 10.0 165 182 117
CV(%) 12.4 9.8 7.3 12.4 9.8 7.3
Mean seed yield by location 970 1358 1164
Other Data.
Broadleaf App Grass App1Growth Reg Fungicide Harvest RCI3
Harvest RCI3 RCI3
Trt# 5/15/12 5/24/12 5/29/12 6/15/12 Ht.(in.) Lodging27/17 Ht.(in.) Date 6/22 7/17
1 2,4-D+Clarity Grass control Apogee Quilt+N 21 1.5 247 21 7/20 193 618
2 2,4-D+Clarity+N Grass control Apogee Quilt+N 21 2.0 259 21 7/20 187 614
3 2,4-D+Clarity Grass control Apogee+N Quilt+N 21 1.8 285 21 7/21 203 684
4 2,4-D+Clarity Grass+N Apogee Quilt+N 20 1.3 253 21 7/21 211 687
5 2,4-D+Clarity+N Grass control Apogee+N Quilt+N 20 2.0 262 21 7/21 201 667
6 2,4-D+Clarity+N Grass+N Apogee+N Quilt+N 20 1.3 303 21 7/21 225 730
7 MCPE+Clarity+N Grass control Apogee Quilt+N 20 1.0 224 21 7/21 219 706
8 MCPE+Clarity+N Grass control Apogee Quilt 20 1.0 234 21 7/20 208 679
9 2,4-D+Clarity Grass control Apogee Quilt 21 1.3 276 21 7/20 181 621
10 Huskie complete NONE Apogee Quilt+N 20 1.0 273 18 7/21 290 570
11 2,4-D+Clarity Permit Apogee Quilt+N 20 1.5 273 21 7/20 216 702
12 No treatment 23 6.3 263 21 7/19 174 651
LSD @ 5% Level 2 1.1 64 1 11 21 92
CV(%) 4 44 17 6 4 7 10
Harvest Date - Erickson 7/22/2012, MagPlots 7/20/2012
* Add 3 gallons NPAK 28%N (10#N)per acre in addition to normal pesticide application to +N treatments
3/4pt. Clarity+3/4pt. 2,4-D 9/24/2012 at Magnusson Plot location
Fertility Level- MagPlots- 60-30-30-7.5s on 10/16/2011 + 80-0-0 on 4/6/2012
Erickson-60-30-30 Oct.2011 + 60-0-0 April 2012.1Magnusson Location=AssureII; Erickson Location=Tecoma(Puma)2Lodging-1=Upright;9=flat3RCI(Relative Chlorophyll Index)-Higher number means more chlorophyll.
2,4-D amine 4 .75pt. 4#2,4-DA
Clarity .75pt. 4#dicamba
Assure II 10oz.+.25%NIS .88#quizalofop
Apogee 6oz.+.25%NIS+2.5% UAN 27.5%DFprohexadione
Quilt Excel 8oz. 1.02#propiconazole+1.18#azoxystrobin
MCPE 4 .75pt. 3.7#MCPA
Huskie Complete 13.7oz. .042#thiencarbazone+1.46# bromoxynil+.46#pyrosulfatole
Permit 1 oz.(dry)+.25%NIS halosulfuron-methyl 75%
Observations/Conclusions:
3 gallons 28%N added to the growth regulator and fungicide produced the highest seed yield at both locations.
Huskie Complete- was injurious to perennial ryegrass(presumably the thiencarbazone component of the product).
Seed Yield-% of Mean Seed Yield-#/acre
Erickson Magnusson Plots

Table 12.
Liquid Nitrogen added to Fungicides Applications-Perennial Ryegrass-2012
Magnusson Research Farm and Helmstetter Farm-Lake of the Woods area
2 Location
3 gal. Seed Yield
Trt.# Fungicide treatment Rate 28%N % of mean MagPlot Helm MagPlot Helm Mean MagPlot Helm Mean
1 No treatment NO 96.2 1184 1345 270 201 235 2.3 3.8 3.0
2 Quilt Excel 2.2se 10.5 oz. NO 102.5 1271 1423 289 215 252 3.0 5.8 4.4
3 Priaxor 6 oz. NO 108.5 1269 1583 287 208 248 2.5 6.3 4.4
4 5.4oz.+5.4oz. NO 103.4 1204 1514 303 213 258 2.5 5.8 4.1
5 Quilt Excel 2.2se 10.5 oz. YES 104.3 1244 1496 332 227 279 2.3 6.0 4.1
6 Folicur 3.6# 5.4oz. YES 93.4 1142 1311 299 202 251 2.5 4.5 3.5
7 5.4oz.+5.4oz. YES 100.2 1180 1454 315 200 257 2.5 5.5 4.0
8 No treatment YES 91.6 1131 1278 284 195 240 2.5 3.0 2.8
LSD @ 5% level 11.8 NS 119 53 27 27 NS 1.9 1.2
Experimental design: RCB with 4 reps
Magnusson location - variety= Arctic Green
Helmstetter location - variety= Provocative
.25%NIS applied with all treatments1RCI-Relative Chlorophyll Index- higher number =more chlorophyll2Lodging-1=upright;9=flat
Trade name common name #AI/Gal.
Quilt Excel 2.2se propiconazole+azoxystrobin 1.02+1.18
Priaxor fluxapyroxad + pyraclostrobin 1.39+2.78
1.05+3.15
Folicur tebuconazole 3.6
Quilt propiconazole+azoxystrobin 1.04+.62
Observations/Conclusions:
Fungicides tended to increase seed yields over untreated checks
The addition of liquid nitrogen to fungicide mixes did not effect seed yield
The addition of liquid nitrogen to fungicide mixes tended to increase chlorophyll at the Magnusson location
Stratego YLD+Folicur prothioconazole+trifloxystrobin+tebuconazole
RCI1
Lodging2
Seed Yield (#/ac.)
Stratego YLD+Folicur
Stratego YLD+Folicur

Table 13.
Rates and Split Applications of Apogee to 'Arctic Green' Perennial Ryegrass
Magnusson Research Farm
Seed
Apogee Application Yield
Trt.# Rate Date (#/ac.) Ht. (in.) Lodging**
1 No Treatment 1112 25 6.8
2 4oz. 6/1 1123 22 2.5
3 6oz. 6/1 1094 22 1.5
4 8oz. 6/1 1120 20 1.5
5 10oz. 6/1 1047 20 1
6 3+3=6 5/22+6/12 1152 20 1.3
7 4+4=8 5/22+6/12 996 19 1
8 5+5=10 5/22+6/12 949 17 1
9 6+2=8 5/22+6/12 993 20 1
10* 3+2+3* 1094 22 3.5
LSD @ 5% level 117 2 1.2
*Trt.#10 had Apogee split applications applied with pesticide applications
3oz.W/ 2,4-D+Clarity-2oz. W/Assure II,3oz.W/Quilt
** Lodging- 1=upright;9=flat
Pesticide Treatments:
5/16--2,4-D+Clarity applied to all plots. Dry soil-wind N 5mph . GS= vegetative tillering/ 1node
5/22/12--10oz. Assure II +.25%NIS+2.5% -28%N applied to all plots. Split Apogee trts. Applied to trts. 6-10.
6/1/12 Apogee applied to trts.2-5.
6/12/12 Apogee applied to trts.6-9.
6/26/12 Quilt Excel applied to all plots.
Fertility=60-30-30 fall + 70-0-0 spring.
All Apogee treatments include .25% NIS+ 2.5% - 28%NPAK
2- 1ft.2 samples for dry wt. taken from untreated checks
Dry Matter 6/4/2012 = 1.15 tons/ac.G.Stage- Boot 8"-10"
Dry Matter 6/13/2012= 1.68 tons/ac.G. Stage11"-15" ht.--30% heading
Observations/Conclusions:
Some split applications treatments of Apogee reduced seed yield.
No single application rate of Apogee significantly affected seed yield.
Apogee applications reduced plant height and lodging.
5/16+5/22+6/26
Harvest-7/19/12

Table 14.
2012 Apogee Rates Applied to 'Arctic Green' Per. Ryegrass
Magnusson Research Farm
Apogee Seed Yield Dry matter Harvest
Trt# Rates (#/ac.) Lodging1Ht.(In.) Test Wt.4
Tons/acre Index26/23 7/17
1 0 1550 7.5 25.5 28.5 2.74 27.8 323 157
2 5oz. 1501 2.0 22.5 28.5 2.40 31.1 363 173
3 8oz. 1463 1.0 21.0 28.4 2.19 34.7 375 212
LSD @5%Level NS 1.8 3.5 NS 0.35 NS NS 62
CV(%) 5.1 11.6 3.5 NA 3.4 12.5 9.4 8
Ryegrass seeded into wheat stubble 9/3/2011.
Swath date- 7/18/2012 averaging 33.5% moisture.
Apogee applications 6/6/2012- Growth stage- early heading. Canopy height- 8" ht.
Dry soil conditions- sunny 65F wind 0-4 NNE.
Apogee applied with .25%NIS(Preference)+2.5%NPAK-281Lodging-1=Upright;9=flat2Harvest index= seed as % of total dry matter.3RCI(Relative Chlorophyll Index)-Higher number means more chlorophyll.4Test Wt.= Pounds per bushel corrected to 11% moisture.
Observations/Conclusions:
Apogee applications did not affect seed yield but reduced lodging and dry matter production.
XXXXXXXXXXXXXXXXXXXXXXXXXXXXXXXXXXXXXXXXXXXXXXXXXXXXXXXXXXXXXXXXXXXXXXXXXXXXX
Table 15.
2012 Late Weed Control Applied to 'Arctic Green' Per. Ryegrass
Magnusson Farms- West of Roseau,Mn
Rate/acre
Treatment Adjuvunt (#/Ac.) % of Check
1 MCPE 1pt 1433 107.8
2 2,4-Da 1pt 1439 108.3
3 2,4-DE 3/4pt 1299 97.7
4 2,4-Da+Clarity 1pt+1pt 1320 99.3
5 Stinger 6oz. 1296 97.5
6 Clarity 1pt. 1252 94.2
7 Aim 1oz.+.25%NIS 1350 101.6
8 Basagran 1.5pt+1%MSO 1302 98.0
9 No Treatment 1329 100.0
10 Avenge 3pt.+.25%NIS 1311 98.6
11 Assure II 10oz.+.25%NIS 1213 91.3
12 Fusilade 12oz+.5%HCCOC 1320 99.3
LSD @ 5% level 137 10.3
LSD @ 10% level 114 8.6
Herbicides applications made 6/21/2012 at 60% heading stage.
Wind WSW at 4-8mph
Harvested 7/21/2012
Observations/Conclusions:
Late applications of Assure II may have reduced seed yields(at 10%level).
MCPE and 2,4-D amine applications tended to yield higher than checks(at LSD 20%level).
Harvest RCI3
Seed Yield

Table 16.
Fall/Spring Applications of Assure II/Fusilade to Arctic Green Perennial Ryegrass
Magnusson Research Farm-2012
Fall Spring Grass Seed yield
Treatment Treatment Herbicide Rate #/ac Ht.(in.) Lodging*
Sept. 26 none AssureII 10oz. 1314 22 3.3
Sept. 26 none AssureII 20oz. 1406 22 3.3
Sept. 26 24-May AssureII 10+10 1293 21 2
Sept. 26 24-May AssureII 20+10 1234 22 3
None 24-May AssureII 10oz. 1151 22 1.7
Sept. 26 24-May Fusilade 12+12 1377 22 3
None None None 0 1308 22 2.3
LSD @ 5% Level 222 NS 1.4
Harvest date- 7/19/2012
*Lodging- 1=Upright; 9=flat
Assure II treatments= .25%NIS
Fusilade treatments= 1.0%COC
2pt. Curtail+1pt. Clarity applied 9/19/11
3/4pt. 2,4-D + 3/4pt. Clarity 5/10/12
Observations/Conclusions:
Spring applications of Assure II tended to reduce seed yields while Fusilade did not.
Fall applications of either grass herbicide did not reduce yields.
Harvest

Table 17.
Date of Swath 'Arctic Green' Perennial Ryegrass
Magnusson Research Farm
Seed yield
Trt.# Cut Date1(#/acre)
1 7/17 1426
2 7/19 14503
3 7/21 1218
4 7/23 1118
5 7/17 and leave 1363
6 7/19 and leave 13907
7 7/21 and leave 1169
8 7/23 and leave 1067
LSD @5% Level 94
Experimental Design: RCB with 4 Reps.1 Cut Date- Treatments 1-4 yield samples were cut and bagged on the cut date.
Treatments 5-8 samples were cut on same date,left in field, and bagged 6 days later.
All samples taken to St.Paul for threshing and cleaning.
Swath/cut date 7/17- seed =35% moisture
Swath/cut date 7/19- seed =33% moisture
Last 2 cut dates no moisture samples taken but seed shattering had occurred prior to cutting
and shattered readily when swathed.
Observations/Conclusions:
Seed yields on first 2 cutting dates did not differ but yield dropped significantly on date 3 and 4.
50-60#/acre(about 4%) was lost when ryegrass was left in the field(typical swath/combine) than
harvested and bagged immediately. Seed loss may have been less with an earlier
harvest date?
Seed harvest was scheduled to be started at 45% moisture but sampling initiated too late.
Trial is scheduled to be repeated in 2013 with an earlier start to harvest dates.

Table 18.
2011 Seeding Year Weed Control in Spring Wheat with Underseeded Grasses
Magnusson Research farm
Ky.bluegrass tall fescue Ky.bluegrass tall fescue
Trt.# Treatment per.ryegrass per.ryegrass
1 Achieve L G G F 77 73 63
2 Affinity+2,4-D G F F 60 73 65
3 Assert F G G 70 63 53
4 Avenge3G G G NA NA NA
5 Axial G P P 77 55 0
6 Callisto-3 oz. G G G 80 70 70
7 Callisto -5 oz. G G G 70 75 55
8 Everest 70WG 3 G F F NA NA NA
9 Everest 2.03
G F F NA NA NA
10 Express+2,4-D G F G 65 67 60
11 Nortron G G G 40 70 60
12 Tecoma(Puma) P G G 10 70 43
13 Wolverine P G F 15 60 50
14 No treatment G G G 70 75 601Tolerance based on stand 10/21/2011;G=good ,F=fair ,P=poor tolerance.2Stand 6/21/2012- 0= worst stand; 90= best stands.3Treatments added to these treatments in 2012 so stand notes not available.
Experimental design- Split-plot with 4 reps
All treatments applied 6/24/11 9:00AM 70F west wind 0-3mph
Application growth stages- 6/24:
spring wheat- 6-8" tall 3 leaf tillering
perennial ryegrass 1.5"-2" 2-3 leaf
tall fescue 2" 2-3 leaf
ky.bluegrass 1" 1-2 leaf
1pt. Buctril applied to all 6/24/11 5:00pm wind west 0-5mph
Spring wheat-Samson
Kentucky bluegrass - Park
Tall fescue- Durana
Perennial ryegrass-Arctic Green
Trt.# Treatment Rate/Adjuvunct active ingredient/ac.
1 Achieve Liquid .5pt+.25%NIS+2.5% -28%N .208# tralkoxydim
2 Affinity+2,4-D .6oz.+1/2pt.LV6+.25%NIS .0094#thifensulfuron+.0094#tribenuron+.375#2,4-DE
3 Assert 1.2pt+.25%NIS .375# imazamethabenz
4 Avenge 3pt.+.25%NIS 2# difenoquat
5 Axial 1pt. .42# pinoxedin
6 Callisto
7 Callisto 5oz.+COC +2.5% - 28%N
8 Everest 70WG .6oz.+.25%NIS .026# flucarbazone
9 Everest 2.0 .9oz.+.25%NIS .025# flucarbazone+safener
10 Express+2,4-D .3oz.+1/2pt. 2,4-D LV6+.25%NIS .0094# tribenuron+.375# 2,4-DE
11 Nortron 2 pt 1# ethofumesate
12 10oz. .078# fenoxaprop
13 Wolverine 1.7pt. +2.5%-28%N .08# fenoxaprop+.036# pryrasulfotole+.087# bromoxynil
14 No treatment
Observations/Conclusions:
Axial gave better control of ryegrass seedlings than Everest formulations
Tecoma
Stand2 6/21/2012Herbicide tolerance1
3oz.+1%COC+2.5%- 28%N .094# mesotrione
.157# mesotrione

Table 19.
2011-2 Tall fescue Establishment/Management Trial
Magnusson Research Farm-Roseau
Planting Seed Yield
Variety Date Cover Fungicide1#/ac.
KY-31 7/20/2011 None Quilt 980
KY-31 7/20/2011 None no Quilt 925
KY-31 7/20/2011 Wheat Quilt 329
KY-31 7/20/2011 Wheat no Quilt 300
KY-31 7/20/2011 wheat-chop off Quilt 685
KY-31 7/20/2011 wheat-chop off no Quilt mice damage-lost
Durant 7/20/2011 None Quilt 1424
Durant 7/20/2011 None no Quilt 1610
Durant 7/20/2011 Wheat Quilt 846
Durant 7/20/2011 Wheat no Quilt 694
Durant 7/20/2011 wheat-chop off Quilt 1424
Durant 7/20/2011 wheat-chop off no Quilt 1593
Durant 8/12/2012 Wheat Quilt 596
Durant 8/12/2012 Wheat no Quilt 645
Fertilizer application
120+60+60+15s -- 10/16/11
Observations/Conclusions:
Insufficient replication(2) to analyze results.
Seeding on preventive plant ground is a viable option.
Planting probably needs to be done before Aug.1.
If wheat cover has headed, flail chopping/removal may be beneficial.

Table 20.
Prairie Junegrass(Koeleria macrantha) planted at 2 Location in 2010
Seeding Date X Density
Roseau3
Becker3
Seed yield
Planting % stand Planting #/acre4
% stand
Date Density2
2011 2012 5/26/2011 Date Density2
2012 5/17/2011
6/8/2010 6"-3# 263 307 65 6/3/2010 6"-3# 14 50
6/8/2010 6"-1.5# 156 403 86 6/3/2010 6"-1.5# 23 58
6/8/2010 12"-1.5# 205 274 65 6/3/2010 12"-1.5# 11 45
Mean 6/8 planting 208 328 72 Ave. 6/8 planting 16 51
7/20/2010 6"-3# NH1314 60 7/15/2010 6"-3# 28 30
7/20/2010 6"-1.5# NH 276 73 7/15/2010 6"-1.5# 31 40
7/20/2010 12"-1.5# NH 301 80 7/15/2010 12"-1.5# 22 30
Mean 7/20 planting 0 297 71 Ave. 7/20 planting 27 33
8/28/2010 6"-3# NH 258 43 9/1/2010 6"-3# 151 83
8/28/2010 6"-1.5# NH 283 55 9/1/2010 6"-1.5# 147 90
8/28/2010 12"-1.5# NH 236 53 9/1/2010 12"-1.5# 134 88
Mean 8/28 planting 0 259 50 Ave. 8/28 planting 144 87
LSD @ 5% level 126 24 LSD @ 5% level 57 23
Variety-'KC' germplasm--Colorado collection1NH- not sufficient seed to harvest
2-Density- row spacing and #/ac. Seeding rate3-Location-Roseau= Magnusson Research farm, Becker= Sand Plain Research farm-Becker, Mn.4-Seed Yield- No seed to harvest at Becker in 2011
Management-
60+30+30 applied 10/2011
3/4pt. 2,4-D+3/4pt. Clarity applied Sept.2011
2x weekly irrigation at Becker when needed
Observations/Conclusions:
Early planting at Roseau established adequately for year 1(2011) seed production.
Late planting at Becker established adequately but earlier plantings did not.
Density(seeding rate/row spacings) did not differ significantly.
Seed Yield #/acre

Table 21.
Prairie Junegrass(Koeleria macrantha) planted at 2 Location in 2010
Variety x Growth Regulator x Fertility Trials
Roseau1 2012 Becker1 2012
Variety2 Growth5 Seed yield Harvest Variety2 Growth5 Seed yield Harvest
regulator Fertilizer4#/acre Ht.(In.) regulator Fertilizer4
#/acre Ht.(In.)
KC 0 F1 336 18 KC 0 F1 107 20
KC 0 F2 470 19 KC 0 F2 96 21
KC 0 F3 307 19 KC 0 F3 167 20
KC Mean 0 growth reg. 371 19 KC Mean 0 growth reg. 123 20
KC 1 F1 390 18 KC 1 F1 96 19
KC 1 F2 NH3 18 KC 1 F2 98 19
KC 1 F3 390 17 KC 1 F3 94 18
KC Mean 4oz. Apogee 390 18 KC Mean 4oz. Apogee 96 19
KC 2 F1 343 16 KC 2 F1 91 18
KC 2 F2 386 16 KC 2 F2 136 18
KC 2 F3 334 16 KC 2 F3 140 18
KC Mean 8oz. Apogee 354 16 KC Mean 8oz. Apogee 122 18
LSD @ 5% level 74 1 LSD @ 5% level 75 2
KN 0 F1 365 19 KN 0 F1 136 22
KN 0 F2 354 20 KN 0 F2 82 22
KN 0 F3 198 19 KN 0 F3 111 22
KN Mean 0 growth reg. 306 19 KN Mean 0 growth reg. 110 22
KN 1 F1 312 18 KN 1 F1 116 21
KN 1 F2 339 18 KN 1 F2 100 21
KN 1 F3 319 18 KN 1 F3 145 21
KN Mean 4oz. Apogee 323 18 KN Mean 4oz. Apogee 120 21
KN 2 F1 310 16 KN 2 F1 149 21
KN 2 F2 361 16 KN 2 F2 154 20
KN 2 F3 274 17 KN 2 F3 125 20
KN Mean 8oz. Apogee 315 16 KN Mean 8oz. Apogee 143 20
LSD @ 5% level 74 1 LSD @ 5% level 75 2
WD 0 F1 265 22 WD 0 F1 136 25
WD 0 F2 278 23 WD 0 F2 187 26
WD 0 F3 218 23 WD 0 F3 200 25
WD Mean 0 growth reg. 254 23 WD Mean 0 growth reg. 174 25
WD 1 F1 265 21 WD 1 F1 123 24
WD 1 F2 225 22 WD 1 F2 178 24
WD 1 F3 265 22 WD 1 F3 227 24
WD Mean 4oz. Apogee 252 22 WD Mean 4oz. Apogee 176 24
WD 2 F1 292 22 WD 2 F1 131 22
WD 2 F2 290 21 WD 2 F2 223 24
WD 2 F3 290 22 WD 2 F3 254 23
WD Mean 8oz. Apogee 291 22 WD Mean 8oz. Apogee 203 23
LSD @ 5% level 74 1 75 2
1Location-Roseau= Magnusson Research farm, Becker= Sand Plain Research farm-Becker, Mn.2
Variety- WD- Weaver Dunes- SE Minnesota
KC- Colorado
KN- Nebraska3NH- Not harvested -drowned out
4 Fertilizer- October 2011 and April 2012
F1) 30+30+30 fall
F2)30+30+30 fall+30-0-0 spring
F3)60+30+30 fall5Growth regulator=
0)No growth regulator
1)Apogee 4 oz.+.25%NIS+2.5%-28%N
2)Apogee 8 oz.+.25%NIS+2.5%-28%N
Roseau Apogee treatments applied 5/16/2012 1pm 70F 20%RH wind wsw5
growth stage - jointed- no heads showing Harvested 7/6/2012
Becker Apogee treatments applied 5/14/2012 gs= WD 15% headed, ND & KC 30% headed- harvested 7/1/2012
Observations/Conclusions:
KC and KN populations produced highest seed yields at Roseau.
WD population was highest yielding line at Becker.
Growth regulator applications reduced crop height.
No significant seed yield differences among growth regulator or fertility treatments.

Table 22.
3 Year Summary of In Furrow Fertilizer Applications to Spring Wheat With Underseeded Ryegrass.
Magnusson Research farm- Roseau,Mn.
Spring Wheat Data Summary
Surface1 In Furrow2
Applied Applied
Treatment Fertilizer Fertilizer 2010-1232012 2011 2010 2012 2011 2010 2012 2011 2010
Check- No P or K 110-0-0 0 86.3 69.9 94.0 95.0 44.3 81.8 68.9 16.8 13.5 11.6
MES10 100-0-0 9-30-30-7s 104.2 109.6 99.7 103.4 69.4 86.7 75.0 14.9 13.6 11.8
MES10 (2x)+K20(2x) 90-0-0 18-60-60-14s 106.3 119.7 102.5 96.7 75.8 89.2 70.1 14.9 13.7 11.8
MES10 (2x) 105.1 76.2
MAP 100-0-0 9-30-30 104.9 109.9 101.8 103.0 69.6 88.6 74.7 15.5 13.8 11.1
MES10 Surface apply 110-30-30-7s 0 98.5 103.4 99.0 93.0 65.5 86.1 67.4 15.6 13.6 11.3
85-0-0 25-30-30-7s 113.0 71.6 15.2
70-0-0 40-30-30-7s 101.8 100.7 102.9 63.8 89.5 15.8 13.9
55-0-0 55-30-30-7s 99.1 62.8 15.8
MES10+60#ESN 40-0-0 70-30-30-7s 96.7 90.8 102.6 57.5 89.3 16.1 13.9
80-0-0 30-0-0 87.3 77.5 97.1 49.1 84.5 16.8 13.9
MES10+30# foliarN470-0-0 9-30-30-7s 101.9 106.6 97.1 67.5 84.5 17.1 14.0
MES15 100-0-0 9-30-30-14s 102.6 101.3 103.9 88.1 75.3 13.4 11.6
MESZ 100-0-0 9-30-30-7s-1z 101.3 102.3 100.3 89.0 72.7 13.3 11.2
LSD @5% Level 5.3 6.3 5.2 8.7 4.0 4.5 6.3 0.4 0.4 0.5
CV(%) 4.0 5.3 5.4 6.0 5.3 5.4 6.0 2.2 2.4 3
Mean yield-Bu./acre 63.35 87 72.5
Plot Design= RCB with 4 Replications
Perennial ryegrass underseeded with spring wheat1 Fertiilzer applied before final tillage/seed bed prep.2Fertilizer applied in furrow with seed at planting.3 Minimum 2 years data.4 30# Foliar N applied as 28%N at anthesis
Wheat variety-Samson ; perennial ryegrass variety- Arctic Green
Observations/Conclusions:
P and K in furrow applications are more effective than broadcast treatments.
Higher(2x) P and K levels may increase yields if soil tests low.
ESN applied in furrow up to 30# may have benefit; higher rates could be determental.
Foliar N(28%N) at anthesis may increase protein.
30# ESN only- no P or K
MES10+45#ESN
Yield as % of mean Yield Bu./Acre % Protein
MES10+15#ESN
MES10+30#ESN
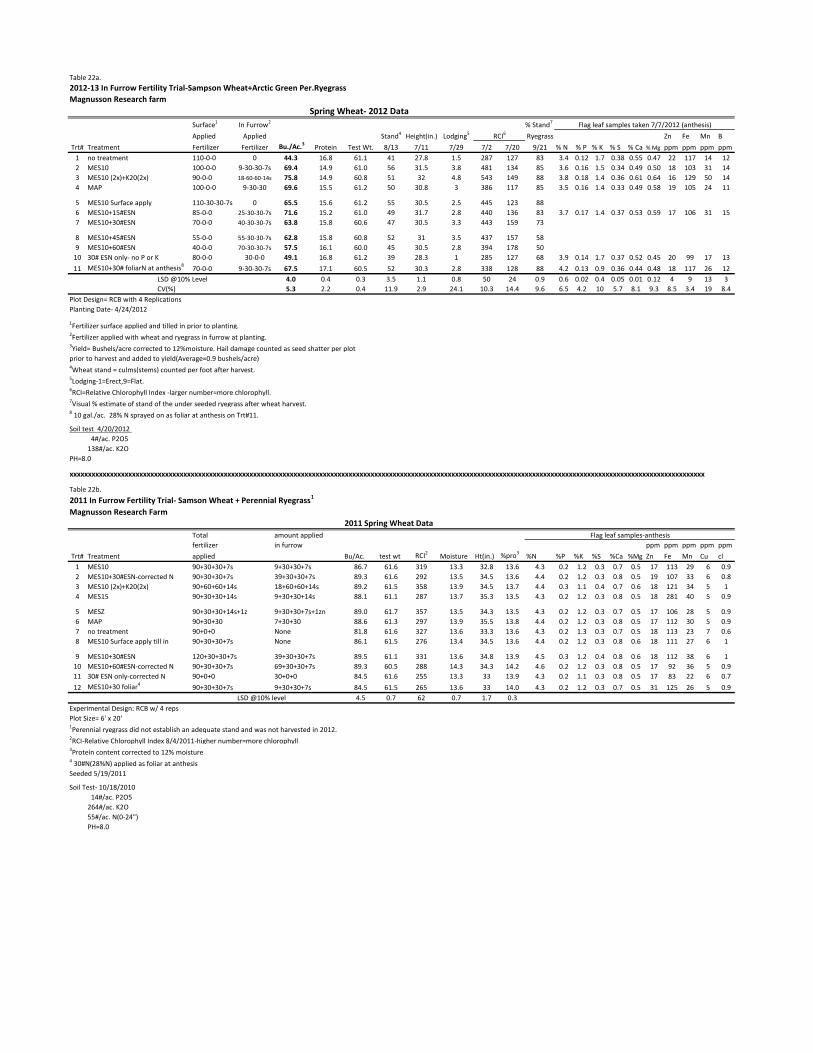
Table 22a.
2012-13 In Furrow Fertility Trial-Sampson Wheat+Arctic Green Per.Ryegrass
Magnusson Research farm
Spring Wheat- 2012 Data
Surface1 In Furrow2 % Stand7
Applied Applied Stand4Height(in.) Lodging5 Ryegrass Zn Fe Mn B
Trt# Treatment Fertilizer Fertilizer Bu./Ac.3Protein Test Wt. 8/13 7/11 7/29 7/2 7/20 9/21 % N % P % K % S % Ca % Mg ppm ppm ppm ppm
1 no treatment 110-0-0 0 44.3 16.8 61.1 41 27.8 1.5 287 127 83 3.4 0.12 1.7 0.38 0.55 0.47 22 117 14 12
2 MES10 100-0-0 9-30-30-7s 69.4 14.9 61.0 56 31.5 3.8 481 134 85 3.6 0.16 1.5 0.34 0.49 0.50 18 103 31 14
3 MES10 (2x)+K20(2x) 90-0-0 18-60-60-14s 75.8 14.9 60.8 51 32 4.8 543 149 88 3.8 0.18 1.4 0.36 0.61 0.64 16 129 50 14
4 MAP 100-0-0 9-30-30 69.6 15.5 61.2 50 30.8 3 386 117 85 3.5 0.16 1.4 0.33 0.49 0.58 19 105 24 11
5 MES10 Surface apply 110-30-30-7s 0 65.5 15.6 61.2 55 30.5 2.5 445 123 88
6 85-0-0 25-30-30-7s 71.6 15.2 61.0 49 31.7 2.8 440 136 83 3.7 0.17 1.4 0.37 0.53 0.59 17 106 31 15
7 70-0-0 40-30-30-7s 63.8 15.8 60.6 47 30.5 3.3 443 159 73
8 55-0-0 55-30-30-7s 62.8 15.8 60.8 52 31 3.5 437 157 58
9 MES10+60#ESN 40-0-0 70-30-30-7s 57.5 16.1 60.0 45 30.5 2.8 394 178 50
10 30# ESN only- no P or K 80-0-0 30-0-0 49.1 16.8 61.2 39 28.3 1 285 127 68 3.9 0.14 1.7 0.37 0.52 0.45 20 99 17 13
11 MES10+30# foliarN at anthesis870-0-0 9-30-30-7s 67.5 17.1 60.5 52 30.3 2.8 338 128 88 4.2 0.13 0.9 0.36 0.44 0.48 18 117 26 12
LSD @10% Level 4.0 0.4 0.3 3.5 1.1 0.8 50 24 0.9 0.6 0.02 0.4 0.05 0.01 0.12 4 9 13 3
CV(%) 5.3 2.2 0.4 11.9 2.9 24.1 10.3 14.4 9.6 6.5 4.2 10 5.7 8.1 9.3 8.5 3.4 19 8.4
Plot Design= RCB with 4 Replications
Planting Date- 4/24/2012
1Fertilizer surface applied and tilled in prior to planting.2Fertilizer applied with wheat and ryegrass in furrow at planting.3Yield= Bushels/acre corrected to 12%moisture. Hail damage counted as seed shatter per plot
prior to harvest and added to yield(Average=0.9 bushels/acre)4Wheat stand = culms(stems) counted per foot after harvest.5Lodging-1=Erect,9=Flat.6RCI=Relative Chlorophyll Index -larger number=more chlorophyll.7Visual % estimate of stand of the under seeded ryegrass after wheat harvest.8 10 gal./ac. 28% N sprayed on as foliar at anthesis on Trt#11.
Soil test 4/20/2012
4#/ac. P2O5
138#/ac. K2O
PH=8.0
xxxxxxxxxxxxxxxxxxxxxxxxxxxxxxxxxxxxxxxxxxxxxxxxxxxxxxxxxxxxxxxxxxxxxxxxxxxxxxxxxxxxxxxxxxxxxxxxxxxxxxxxxxxxxxxxxxxxxxxxxxxxxxxxxxxxxxxxxxxxxxxxxxxxxxxxxxxxxxxxxxxxxxxxxxxxx
Table 22b.
2011 In Furrow Fertility Trial- Samson Wheat + Perennial Ryegrass1
Magnusson Research Farm
2011 Spring Wheat Data
Total amount applied
fertilizer in furrow ppm ppm ppm ppm ppm
Trt# Treatment applied Bu/Ac. test wt RCI2Moisture Ht(in.) %pro3
%N %P %K %S %Ca %Mg Zn Fe Mn Cu cl
1 MES10 90+30+30+7s 9+30+30+7s 86.7 61.6 319 13.3 32.8 13.6 4.3 0.2 1.2 0.3 0.7 0.5 17 113 29 6 0.9
2 MES10+30#ESN-corrected N 90+30+30+7s 39+30+30+7s 89.3 61.6 292 13.5 34.5 13.6 4.4 0.2 1.2 0.3 0.8 0.5 19 107 33 6 0.8
3 MES10 (2x)+K20(2x) 90+60+60+14s 18+60+60+14s 89.2 61.5 358 13.9 34.5 13.7 4.4 0.3 1.1 0.4 0.7 0.6 18 121 34 5 1
4 MES15 90+30+30+14s 9+30+30+14s 88.1 61.1 287 13.7 35.3 13.5 4.3 0.2 1.2 0.3 0.8 0.5 18 281 40 5 0.9
5 MESZ 90+30+30+14s+1z 9+30+30+7s+1zn 89.0 61.7 357 13.5 34.3 13.5 4.3 0.2 1.2 0.3 0.7 0.5 17 106 28 5 0.9
6 MAP 90+30+30 7+30+30 88.6 61.3 297 13.9 35.5 13.8 4.4 0.2 1.2 0.3 0.8 0.5 17 112 30 5 0.9
7 no treatment 90+0+0 None 81.8 61.6 327 13.6 33.3 13.6 4.3 0.2 1.3 0.3 0.7 0.5 18 113 23 7 0.6
8 MES10 Surface apply till in 90+30+30+7s None 86.1 61.5 276 13.4 34.5 13.6 4.4 0.2 1.2 0.3 0.8 0.6 18 111 27 6 1
9 MES10+30#ESN 120+30+30+7s 39+30+30+7s 89.5 61.1 331 13.6 34.8 13.9 4.5 0.3 1.2 0.4 0.8 0.6 18 112 38 6 1
10 MES10+60#ESN-corrected N 90+30+30+7s 69+30+30+7s 89.3 60.5 288 14.3 34.3 14.2 4.6 0.2 1.2 0.3 0.8 0.5 17 92 36 5 0.9
11 30# ESN only-corrected N 90+0+0 30+0+0 84.5 61.6 255 13.3 33 13.9 4.3 0.2 1.1 0.3 0.8 0.5 17 83 22 6 0.7
12 MES10+30 foliar490+30+30+7s 9+30+30+7s 84.5 61.5 265 13.6 33 14.0 4.3 0.2 1.2 0.3 0.7 0.5 31 125 26 5 0.9
LSD @10% level 4.5 0.7 62 0.7 1.7 0.3
Experimental Design: RCB w/ 4 reps
Plot Size= 6' x 20'1Perennial ryegrass did not establish an adequate stand and was not harvested in 2012.2RCI-Relative Chlorophyll Index 8/4/2011-higher number=more chlorophyll3Protein content corrected to 12% moisture4 30#N(28%N) applied as foliar at anthesis
Seeded 5/19/2011
Soil Test- 10/18/2010
14#/ac. P2O5
264#/ac. K2O
55#/ac. N(0-24")
PH=8.0
Flag leaf samples taken 7/7/2012 (anthesis)
Flag leaf samples-anthesis
RCI6
MES10+15#ESN
MES10+30#ESN
MES10+45#ESN

Table 23.
2012-3 100% Urea vs. a 50/50 Blend of ESN/Urea Applied Preplant to Spring Wheat
Under Seeded with Perennial Ryegrass at 2 Northern Minnesota Locations.
2012 Spring Wheat Summary
RCI4
Treatment Loc11 Loc22 Loc11 Loc22 Loc11 Loc227/24
1- 50%ESN/50%Urea 67.3 70.7 14.1 13.6 61.5 61.9 118
2-100% Urea 67.5 70.2 13.7 13.6 61.7 62.1 102
LSD @10% level NS NS 0.2 NS NS NS NS
CV 2.2 1.5 0.7 0.7 0.4 0.2 13.8
Experimental Design= RCB with 3 Replications1Loc1= Amundson Bros. Farm north of Wannaska,Mn.-Roseau cty.
120# N applied preplant incorporate(PPI) to spring wheat underseeded with perennial ryegrass.
2Loc2=Helmstetter farm-North of Roosevelt,Mn.-Lake of the Woods cty.
140# N applied with Amity drill at planting 4-24-20123 Yields corrected to 12% Moisture4RCI- Relative chlorophyll index- Higher number = more chlorophyll in measured plant material location 2.
7/24--Hard dough stage.
All planting,harvesting and plot treatments were performed by the grower.
Observations/Conclusions:
No yield differences observed between nitrogen treatments. Slightly higher protein at 1 location with ESN.
xxxxxxxxxxxxxxxxxxxxxxxxxxxxxxxxxxxxxxxxxxxxxxxxxxxxxxxxxxxxxxxxxxxxxxxxxxxxxxxxxxxxxxxxxxxxxxx
Table 24.
2012-13 Nitrogen Management on Spring Wheat with Water Logged Soil in
Spring Wheat with Underseeded Ryegrass-Magnusson Farm
Test Lodging2
Treatment Bu./ac1%Protein Weight 7/31/2012 7/2/2012 7/20/2012
1-100%Urea 66.8 12.6 61.0 4.0 752 185
2-75%Urea+25%ESN 69.0 12.9 61.0 3.8 761 215
3-50%Urea+50%ESN 68.5 12.2 60.8 4.0 748 139
4-25%Urea+75%ESN 71.1 12.7 60.9 4.5 802 173
5-100%ESN 71.9 12.5 61.0 4.3 786 168
LSD at 10 % Level 2.7 0.5 NS 0.9 NS 41
CV(%) 3.1 3.2 0.5 18.2 8.4 18.9
Planting Date- 4/24/2012.
Plot Design= RCB with 4 Replications.1Yields adjusted to 12% moisture. Hail damage measured on per plot
basis by seed count on ground prior to harvest-(Ave.= 0.9 bushels/plot)
and yields adjusted.2Lodging-1= Erect; 9=Flat.3RCI=Relative Chlorophyll Index -larger number=more chlorophyll.
Irrigation applied at .75" rate 2x weekly after emergence
Past crop=soybeans-2010&2011
apply 9-30-30-7s(MES10+MOP) to entire area
Apply each treatment(MES10,MOP,urea,ESN) to each plot prior to final tillage before planting.
Arctic Green ryegrass seeding rate=6.5gm/plot(7#/ac)
Samson wheat seeding rate=90#/ac(1.5bu)
Observations/Conclusions:
ESN may increase yields with excess rainfall(irrigation).
Bushels/ac3 %Protein test weight
RCI 3

Table 25.
2012 Spring Wheat On Farm Fertility Trial
Magnusson Farms NW of Roseau,Mn.
In Furrow
Trt# Treatment1treatment Bu./ac2
%Protein Test Wt.
1* MAP+30#Liquid UAN @ Heading 7-30-30 66.1 16.4 61.9
2* MES10+30#Liquid UAN @ Heading 9-30-30-8 s 71.3 16.6 61.9
3 MES10+30#ESN in furrow 39-30-30-8s 68.5 16.5 61.7
LSD @ 20% level 5.1 NS NS
CV(%) 6.3 1.7 0.5
Experimental Design= RCB with 3 Replications
Plot size=85' x 500'
* 30# -28%N applied to these plots 6/15/20121 N,P and K rates essentially the same on all 3 treatments.2 corrected to 12% Moisture.
Spring wheat variety= YB Soren.
120#N urea applied to field prior to planting.
All planting,harvesting and treatments were performed by the grower.
University of Minnesota personel assisted in plot layout,recording notes
and harvest information and processing samples.
Soil Test Results Prior to Planting-
P2O5- 12#/acre
K20-126#/acre
PH=7.9
Observations/Conclusions:
Higher yield with MES10 vs. MAP treatment.