graphs
DESCRIPTION
Graphs. Today I want you to help me make a graph . . I want to make a graph that shows the change in temperature throughout the day yesterday. What kind of graphs could we make to show this?. Bar Graph vs Line Graph. What is the difference between a bar graph and a line graph?. Line Graph. - PowerPoint PPT PresentationTRANSCRIPT

04/22/23 1
Graphs

04/22/23 2
Today I want you to help me make a graph.
I want to make a graph that shows the change in temperature throughout the day yesterday.What kind of graphs could we make to show this?

04/22/23 3
Bar Graph vs Line Graph
What is the difference between a bar graph
and a line graph?

04/22/23 4
Line Graph A line graph is a graph used to show change over time!!
What can time be measured in???Seconds - Minutes - Hours – Days - Weeks - Months – Years - Decades -
Centuries - etc.

04/22/23 5
When to use a line graph? Would we use a line graph
in the following situations:•To show how many people like pizza in this class? NO
•To show how many people live in East Meadow? NO
•To show how much it rained each month this year? YES- because months and years deal with time.

04/22/23 6
Birthdays?
Our birthday does deal with time doesn’t it? (months/years)
But, our birthday is constant, meaning it never changes.
A line graph shows change in time, so we would not use it for this type of graph.
Would we use a line graph to show when our birthdays are?

04/22/23 7
How do we make a line graph?
A line graph ALWAYS has a title!
A line graph has two different axis’s
An axis is either the horizontal line (called x) or the vertical line (called y) that form the base lines of a graph.
Y
X

04/22/23 8
YOU TELL ME….
What color is the y-axis?
What color is the x-axis?
Y
X

04/22/23 9
X-axis and Y-axis When you are making a line graph, the
x-axis is always horizontal, and the y-axis is always vertical.
The x and y-axis usually starts with zero on a line graph
It is important to make sure that the intervals on our y-axis are always equal.
What do I mean by this?

04/22/23 10
Intervals When we are setting up a line graph, we
need to decide what intervals we want to use.
If we are graphing the temperature for a year, do we want to put 365 days on the graph, and 100 different temperatures?
When we see a horizontal flat line, that means that there was no change during a specific time period.

04/22/23 11
Plotting a Line graph When we are plotting a line graph, it is
important to read what information is on each axis.
There must be a label on each axis that describes the information.
Much like a bar graph, we look at the x-axis first in order to plot our points.
Time in minutes

04/22/23 12
Is this an acceptable graph?
Time
Car Trip

04/22/23 13
What information do you need to interpret a graph?
•The graph we just looked at does not have any numbers on the x-axis or the y-axis.
•Can we still draw conclusions and answer questions about that graph?
•How many times did the driver stop driving during the trip?Time
Car Trip

04/22/23 14
Practice With Graphs
•Please study the graphs that you have and answer the questions. •Then we will discuss the your answers.

04/22/23 15
Money spent this week
$0.00
$5.00
$10.00
$15.00
$20.00
$25.00
Mon. Tues. Wed. Thurs. Fri.
Day
Am
outn
of $

04/22/23 16
Q & A Which day did this person spend the most money? How do you know?
This person spent the most money on Wednesday. I know this because the graph is the highest on Wednesday.
About how much money in total did this person spend on Monday and
Thursday? How do you know?This person spent about $9.00 on
Monday and Thursday. I know this because I looked at where the line was for Monday and Thursday and added
the two amounts.

04/22/23 17
Miles traveled during the week
010203040506070
Mon. Tues. Wed. Thurs. Fri. Sat. Sun.
Days
Mile
s Tr
avel
ed

04/22/23 18
Q & AHow many days did this person travel less than 30 miles?
Which day did the driver travel the least amount of miles?
Why might someone want to keep track of their miles for the week?
5 days
Sunday
To figure out how much gas they need a week.

04/22/23 19
U.S. Corn in Acres
55
60
65
70
75
80
85
Years
Acre
s of
cor
n (in
mill
ions
)

04/22/23 20
Q & A About how much corn did the U.S. have in 1991?
What does the y-axis represent in the graph?
Can you think of another title for this graph?
About 77 million acres
The rise and fall of corn in the U.S.
Acres of corn in millions.

04/22/23 21
Calories burned while running
020406080
100120140160180200220240
Hours
Cal
orie
s

04/22/23 22
Make your own….. •Now that you have had time to interpret graphs, I would like you to make your own graphs.
•Remember to read the information carefully and label everything!

04/22/23 23
Amount of Rain From Yesterday's Storm
0
2
4
6
8
10
12
14
1PM 2PM 3PM 4PM 5PM 6PM 7PM
Time in Hours
Amou
nt in
Mill
ilete
rs

04/22/23 24
Calories burned while running
020406080
100120140160180200220240
Hours
Calo
ries

04/22/23 25
Value of TY beanie baby "Slowpoke Sloth"
0
5
10
15
20
25
30
1996 1997 1998 1999 2000 2001
Year
Valu
e in
Dol
lars
04/22/23 26
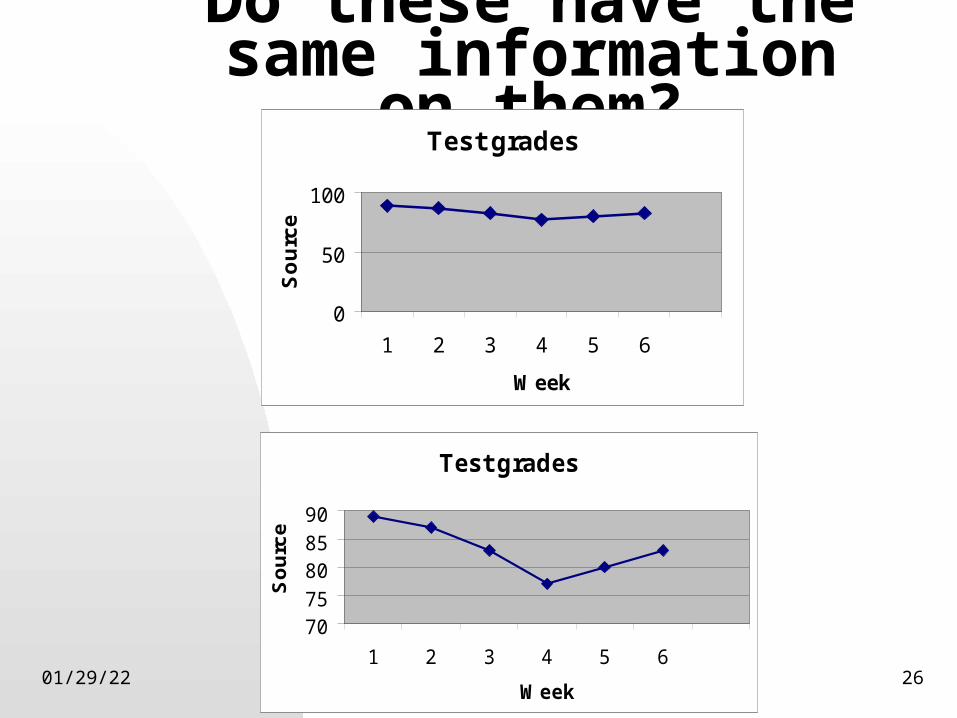
Do these have the same information on them?
Test grades
0
50
100
1 2 3 4 5 6
Week
Sour
ce
Test grades
7075808590
1 2 3 4 5 6
Week
Sou
rce

04/22/23 27
Great Job!