graph spectra in computer science - ala 2010ala2010.pmf.uns.ac.rs/presentations/3w0945dc.pdfgraph...
TRANSCRIPT

GRAPH SPECTRA IN COMPUTER SCIENCE
Dragos Cvetkovic
Faculty of Electrical Engineering, University of Belgrade,
and
Mathematical Institute SANU, Belgrade,
11000 Belgrade, Serbia
e-mail: [email protected]
A paper with the same title is being prepared jointly with S.Simic and D. Stevanovic

I am not giving a survey
on applications of matrices in computer science, or
on applications of graphs in computer science
the subject of the talk :
Applications of the theory of graph spectra (or of spectral graph
theory) in computer science
Spectral graph theory is a mathematical theory where linear
algebra and graph theory meet together

A spectral graph theory is a theory in which graphs are studied
by means of eigenvalues of a matrix M which is in a prescribed
way defined for any graph.
This theory is called M–theory.
Frequently used graph matrices:
A adjacency matrix
D diagonal matrix of vertex degrees
L = D − A Laplacian
Q = D + A signless Laplacian
The spectral graph theory is the union of all these particular
theories + interactions

For example, the adjacency matrix of the graph shown in Fig. 1
b b b bx1 x2 x3 x4
Fig.1
is given by A =
0 1 0 0
1 0 1 0 .0 1 0 1
0 0 1 0For the graph G on Fig.1 we have
PG(λ) =
∣∣∣∣∣∣∣∣∣∣∣∣∣∣
λ −1 0 0
−1 λ −1 0
0 −1 λ −1
0 0 −1 λ
∣∣∣∣∣∣∣∣∣∣∣∣∣∣
= λ4 − 3λ2 + 1 .
Eigenvalues of G are 1.6180, 0.6180, − 0.6180, − 1.6180 or
1 +√
5
2,−1 +
√5
2,
1−√5
2,−1−√5
2
Adjacency matrix - characteristic features
A walk of length k in a graph (or digraph) is a sequence of (not
necessarily different) vertices x1, x2, . . . , xk, xk+1 such that for each
i = 1, 2, . . . , k there is an edge (or arc) from xi to xi+1. The walk
is closed if xk+1 = x1.
Counting walks in a graph (or digraph) is related to graph spec-
tra by the following well-known result.
Theorem. If A is the adjacency matrix of a graph, then the
(i, j)-entry a(k)ij of the matrix Ak is equal to the number of walks
of length k that originate at vertex i and terminate at vertex j.
Thus, for example, the number of closed walks of length k is
equal to the k-th spectral moment, since∑n
i=1 a(k)ii = tr(Ak) =
∑ni=1 λk
i .
Laplacian matrix - characteristic features
Let G be a connected graph on n vertices. Eigenvalues in non-
decreasing order and corresponding orthonormal eigenvectors of
the Laplacian L = D − A of G are denoted by ν1 = 0, ν2, . . . , νn
and u1, u2, . . . , un, respectively.
Note that if xT = (x1, x2, . . . , xn), then
xTLx =∑
i∼j, i<j(xi − xj)
2.
We also have
ν =∑
i∼j, i<j(xi − xj)
2
if x is a normalized eigenvector belonging to eigenvalue ν of L.

Biggs N.L., Algebraic Graph Theory, Cambridge University
Press, Cambridge, 1993.
Chung F., Spectral Graph Theory, American Mathematical So-
ciety, Providence, Rhode Island, 1997.
Cvetkovic D., Doob M., Sachs H., Spectra of Graphs, Theory
and Application, 3rd edition, Johann Ambrosius Barth Verlag,
Heidelberg–Leipzig, 1995.
Cvetkovic D., Rowlinson P., Simic S. K., An Introduction to
the Theory of Graph Spectra, Cambridge University Press, Cam-
bridge, 2009.

Typical research subjects in mathematical theory:
– characterizations of graphs by their spectra,
– inequalities for eigenvalues,
– extremal problems with eigenvalues,
– graph energy (the sum of the absolute values of eigenvalues).

1 A survey of applications
1.1 Expanders and combinatorial optimization
1.2 Complex networks
1.3 Data mining
1.4 Computer vision and pattern recognition
1.5 Internet search
1.6 Load balancing and multiprocessor interconnection networks
1.7 Anti-virus protection versus spread of knowledge
1.8 Statistical databases and social networks
1.9 Quantum computing

Expanders and combinatorial optimization
One of the oldest applications (from 1970’s) of graph eigenvalues
in Computer Science is related to graphs called expanders.
A graph has good expanding properties if each subset of the
vertex set of small cardinality has a set of neighbors of large car-
dinality.
Expanders and some related graphs (called enlargers, magni-
fiers, concentrators and superconcentrators) appear in treatment
of several problems in Computer Science (for example, communi-
cation networks, error-correcting codes, optimizing memory space,
computing functions, sorting algorithms, etc.).
Expanders can be constructed from graphs with a small second
largest eigenvalue in modulus. Such class of graphs includes the so
called Ramanujan graphs.
Expanders are related to some problems of combinatorial op-
timization. More generally, several algorithms of combinatorial
optimization are considered as part of computer science.
Numerous relations between eigenvalues of graphs and combi-
natorial optimization have been known for last twenty years. The
section titles of an excellent expository article
Mohar B., Poljak S., Eigenvalues in combinatorial optimiza-
tion, in: Combinatorial and Graph-Theoretical Problems in
Linear Algebra, (ed. R. Brualdi, S. Friedland, V. Klee), Springer-
Verlag, New York, 1993, 107–151.
show that many problems in combinatorial optimization can be
treated using eigenvalues:

1. Introduction, 1.1. Matrices and eigenvalues of graphs;
2. Partition problems; 2.1 Graph bisection, 2.2. Connectivity
and separation, 2.3. Isoperimetric numbers, 2.4. The maximum
cut problem, 2.5. Clustering, 2.6. Graph partition;
3. Ordering, 3.1. Bandwidth and min-p-sum problems, 3.2.
Cut-width, 3.3 Ranking, 3.4. Scaling, 3.5. The quadratic assign-
ment problem;
4. Stable sets and coloring, 4.1. Chromatic number, 4.2. Lower
bounds on stable sets, 4.3. Upper bounds on stable sets, 4.4. k-
colorable subgraphs;
5. Routing problems, 5.1. Diameter and the mean distance, 5.2.
Routing, 5.3. Random walks;
6. Embedding problems;
Note that one of early heuristics for graph bisection uses the
Fiedler vector, ie. the eigenvector belonging to the second small-
est eigenvalue of the graph Laplacian. This eigenvalue is called
algebraic connectivity of the graph and was introduced by M.
Fiedler in the paper
Algebraic connectivity of graphs, Czech. J. Math., 23(98)(1973),
298-305.

The algebraic connectivity has been used in
D. Cvetkovic, M. Cangalovic and V. Kovacevic-Vujcic, Semidef-
inite programming methods for the symmetric traveling salesman
problem, Integer Programming and Combinatorial Optimiza-
tion, Proc. 7th Internat. IPCO Conf., Graz, Austria, June
1999, Lecture Notes Comp. Sci. 1610, Springer, Berlin, 1999,
126-136.
to formulate the following discrete semidefinite programming
model of the symmetric travelling salesman problem (STSP):

STSP:
minimize F (X) =∑n
i=1∑n
j=1
(−1
2dij
)xij + α
2
∑ni=1
∑nj=1 dij
subject to
xii = 2 + α− β (i = 1, . . . , n),∑n
j=1 xij = nα− β, (i = 1, . . . , n),
xij ∈ {α− 1, α} (j = 1, . . . , n : i < j), X ≥ 0
Here X ≥ 0 means that the matrix X is symmetric and positivesemidefinite, while α and β are chosen so that α > hn/n and 0 <β ≤ hn with hn = 2−2 cos(2π/n) being the algebraic connectivityof the cycle Cn.

Complex networks
Complex networks is a common name for various real networks
which are presented by graphs with an enormously great number
of vertices. Here belong Internet graphs, phone graphs, e-mail
graphs, social networks and many other. In spite of their diversity
such networks show some common properties.
Several models of random graphs have been used to describe
complex networks including the classical Erdos-Renyi model where
we have a constant probability for the existence of each edge. There
are models where given degree distribution is realized.

Main characteristic of complex networks is the degree and eigen-
value distribution. Both distributions obey a power low of the form
x−β for a positive β.
In particular, if nk denotes the number of vertices of degree k,
then asymptotically nk = ak−β for some constant a.

It was conjectured in
Faloutsos M., Faloutsos P., Faloutsos C., On power-low rela-
tionships of the Internet topology, Proc. ACM SIGCOMM ’99,
ACM Press, New York, 1999, 251-262.
that in networks with degree power law the largest eigenvalues of
the adjacency matrix have also a power law distribution. That was
proved under some conditions in
Mihail M. Papadimitrou C.H., On the eigenvalue power-low,
RANDOM 2002, LNCS 2483, Springer, Berlin, 2002, 254-262.
The power law for eigenvalues can be formulated in the following
way. Let λ1, λ2, . . . be non-increasing sequence of eigenvalues of
the adjacency matrix, then asymptotically λi = ai−γ for some
constant a and positive γ.

The following book is devoted to complex networks.
Chung F., Lu L., Complex Graphs and Networks, American
Mathematical Society, Providence, Rhode Island, 2006.
There are two chapters which describe spectral properties of such
networks.
Note that most of the papers on complex networks appear in
scientific journals in the area of Physics.
Empirical studies of the Internet topology have been conducted
in many papers using the normalized Laplacian matrix
L = D−12(D − A)D−1
2 = D−12LD−1
2 .
This matrix has 1’s on the diagonal, and at an off-diagonal po-
sition (i, j) the entry is equal to 0 for non-adjacent and − 1√didj
for
adjacent vertices i, j of degrees di, dj. The spectrum of L belongs
to the interval [0, 2] independently of the number of vertices. The
book
Chung F., Spectral Graph Theory, American Mathematical So-
ciety, Providence, Rhode Island, 1997.
is devoted to the normalized Laplacian.

The eigenvalues γi; i = 1, 2, . . . , n of L in non-decreasing order
can be represented by points ( i−1n−1, γi) in the region [0, 1] × [0, 2]
and can be approximated by a continuous curve. It was noticed in
Vukadinovic D., Huang P., Erlebach T., A spectral analysis of
the Internet topology, 2001
that this curve is practically the same during the time for several
networks in spite of the increasing number of vertices and edges of
the corresponding graph. Therefore the authors consider the spec-
trum of L as a fingerprint of the corresponding network topology.

Data mining
Data mining discovers interesting and unknown relationships
and patterns in huge data sets. Such hidden information could
contribute very much to many domains such as image processing,
web searching, computer security and many others including those
outside computer science.
Among many tools used in data mining, spectral techniques play
an important role
Sawilla R., A survey of data mining of graphs using spectral
graph theory, Defence R&D Canada ’ Ottawa, Technical Memo-
randum TM 2008-317, Ottawa, 2008.

Here belong, in particular, clustering and ranking the vertices of
a graph. While ranking will be treated later, here we consider the
clustering.
A description of spectral clustering methods is given in the
tutorial
Luxburg U. von, A tutorial on spectral clustering, Stat. Com-
put. 17(2007), 395-416.
We shall present an algorithm for graph clustering which is based
on the Laplacian matrix of a graph.
Let G be a connected graph on n vertices. Eigenvalues in non-
decreasing order and corresponding orthonormal eigenvectors of
the Laplacian L = D − A of G are denoted by ν1 = 0, ν2, . . . , νn
and u1, u2, . . . , un, respectively.
In order to construct k clusters in a graph we form an n × k
matrix U containing the vectors u1, u2, . . . , uk as columns. We
have a geometric representation G of G in the k-dimensional space
Rk: we just take rows of U as point coordinates representing the
vertices of G. Edges are straight line segments between the cor-
responding points. Now classical clustering methods (say k-means
algorithm) should be applied to this new graph presentation.
The following well-known inequality for the Rayleigh quotient
ν1 ≤ xTLx
xTx≤ νn
holds for any non-zero vector x of the corresponding dimension.
Equality holds for relevant eigenvectors.
More generally, the eigenvalue νi is the minimal value of the
Rayleigh quotient of L over the orthogonal complement of the sub-
space generated by eigenvectors u1, u2, . . . , ui−1.
Note that if xT = (x1, x2, . . . , xn), then
xTLx =∑
i∼j, i<j(xi − xj)
2.
We also have
ν =∑
i∼j, i<j(xi − xj)
2
if x is a normalized eigenvector belonging to eigenvalue ν of L.
The sum of squares of lengths of all edges in the representation
G of G is equal to ν1 + ν2 + . . . + νk. This is the minimal value
over all representations obtained via matrix U with orthonormal
columns.
Such an extremal graph representation must have remarkable
properties. It enhances the cluster-properties of the original data
and clusters can now be easily detected.

In regular graphs we can use the adjacency matrix A instead
of the Laplacian L. We have L = rI − A for a regular graph of
degree r and λi = r − νi for i = 1, 2, . . . , n.
Eigenvectors of L are also eigenvectors of A for the correspond-
ing eigenvalues.
Instead of first k smallest eigenvalues we have to consider now
k largest eigenvalues.

Example. Consider the adjacency matrix A of a cycle of Cn
length n. It is well known that the eigenvalues λj of the matrix A
are given by λj = 2 cos(2πj/n) (j = 1, . . . , n).
For j = 1 and j = n − 1 we get the second largest eigenvalue
2 cos(2π/n) which corresponds to the second smallest eigenvalue
2− 2 cos(2π/n) of the Laplacian.
Two independent eigenvectors x, y are given by coordinates
xl = cos(2πl/n) (l = 1, . . . , n), yl = sin(2πl/n) (l = 1, . . . , n).
If we represent vertices by points (xi, yi), the picture of the graph
is a regular n-gon.

Graph representation obtained by the Laplacian matrix has been
used in graph drawings:
Koren Y., Drawing graphs by eigenvectors: theory and prac-
tice, Comput. Math. appl., 49(2005), 1867-1888.
Tutte W.T., How to draw a graph, Proc. London Math. Soc.,
13(1963),743-768.

Example. In our context interesting are also fullerene graphs
corresponding to carbon compounds called fullerenes. Fullerene
graphs are planar regular graphs of degree 3 having as faces only
pentagons and hexagons. The Euler theorem for planar graphs
yields that the number of pentagons is exactly 12. Although be-
ing planar, fullerene graphs are represented (and this really corre-
sponds to actual positions of carbon atoms in a fullerene) in 3-space
with its vertices embedded in a quasi-spherical surface.

A typical fullerene is C60. It can be described also as a truncated
icosahedron and has the shape of a football.
Figure 1: a) Planar and b) 3D visualization of the icosahedral fullerene C60
Fullerene graphs have a nice 3D-representation in which the co-
ordinates of the positions of vertices can be calculated from three
eigenvectors of the adjacency matrix (the so called topological co-
ordinates which were also used in producing the atlas
P. W. Fowler and D. E. Manolopoulos, An Atlas of Fullerenes,
Clarendon Press, Oxford, 1995.).

Together with the Laplacian L and the normalized Laplacian
L also the matrix D−1L has been used in clustering algorithms.
According to
Luxburg U. von, A tutorial on spectral clustering, Stat. Com-
put. 17(2007), 395-416.
the last matrix performs best.
Computer vision and pattern recognition
Spectral graph theory has been widely applied in computer vi-
sion and pattern recognition. Examples include image segmen-
tation, routing, image classification, etc. These methods use the
spectrum, i.e. eigenvalues and eigenvectors, of the adjacency or
Laplacian matrix of a graph.
The basic idea is to represent an image by a weighted graph with
a vertex for each pixel and the edges between the neighbouring
pixels with weight depending on how similar the pixels are.
A more sophisticated idea is to represent an image’s content by
a graph with specially selected points as vertices. The interesting
points are points in an image which have a well-defined position
and can be robustly detected.
Several other graphs are used.

Shi J., Malik J., Normalized cuts and image segmentation, Proc.
IEEE Conf. Computer Vision and Pattern Recognition, 1997, 731-
737; IEEE Trans. Pattern Analysis Machine Intell., 28(2000), 888-
905.
It is shown how the Fiedler vector (i.e. the eigenvector associated
to the second smallest eigenvalue of the Laplacian matrix) can be
used to separate the foreground from the background structure in
images. The original procedure has been improved by using the
normalized Laplacian matrix (so as to maximize the normalized
graph cut).

More generally, image segmentation is an important procedure
in computer vision and pattern recognition. The problem is to
divide the image into regions according to some criteria. Very
frequently the image segmentation is obtained using eigenvectors
of some graph matrices.

Internet search
Web search engines are based on eigenvectors of the adjacency
and some related graph matrices:
PageRank (used in Google)
Brin S., Page L., The Anatomy of Large-Scale Hypertextual
Web Search Engine, Proc. 7th International WWW Conference,
1998.
and Hyperlinked Induced Topics Search (HITS)
Kleinberg J., Authoratitive sources in a hyperlinked environ-
ment, J. ACM, 48 (1999), 604-632.
Internet is represented by a digraph G, web pages – vertices,
links – arcs.
HITS exploits eigenvectors belonging to the largest eigenvalues
of the matrices AAT and ATA where A is the adjacency matrix
of a subgraph of G induced by the set of web pages obtained from
search key words by some heuristics. Eigenvectors define ordering
of selected web pages.

PageRank uses random walks. Adjacency matrix of G is normal-
ized so that the sum of entries in each row is equal to 1. This matrix
P is the transition matrix of a Markov chain and the normalized
eigenvector of the largest eigenvalue of P T defines the equilibrium
state of the chain. Pages are ranked by the coordinates of this
eigenvector.
Expository paper
Langville A.N., Meyer C.D., A survey of eigenvector methods
for Web information retrieval, SIAM Rev., 47(2005), No. 1,
135-161.
contains a survey of both techniques.

From the mathematical point of view, the subject of ranking
individuals or objects by eigenvectors of suitably chosen graph ma-
trices is very old. One of the basic references is the thesis
Wei T.H., The algebraic foundations of ranking theory, Thesis,
Cambridge, 1952.
In particular, the ranking of the participants of a round-robin
tournament can be carried out in that way (see, for example, Spec-
tra of Graphs, Theory and Application, , p. 226).
These methods have been used in the sociology for a long time
as well; see, for example,
Bonacich P. Power and centrality: A family of measures, Amer.
J. Soc., 92(1987), 1170-1182.
We reproduce here a relevant result. The following theorem of
T.H. Wei (1952) is noted in Eigenspaces of Graphs, p. 26:
Theorem. Let Nk(i) be the number of walks of length k start-
ing at vertex i of a non-bipartite connected graph G with ver-
tices 1, 2, . . . , n. Let
sk(i) =Nk(i)
∑nj=1 Nk(j)
.
Then, for k →∞, the vector (sk(1), sk(2), . . . , sk(n))T tends
towards the eigenvector corresponding to the index of G.

Load balancing and multiprocessor interconnection
networks
The job which has to be executed by a multiprocessor system
is divided into parts (elementary jobs or items) that are given to
particular processors. Elementary jobs distribution among pro-
cessors can be represented by a vector x whose coordinates are
non-negative integers associated to graph vertices and indicate how
many elementary jobs are given to corresponding processors.
The load balancing problem requires creation of algorithms for
moving elementary jobs among processors in order to achieve the
uniform distribution, i.e., that the vector x is an integer multiple
of the vector j whose all coordinates are equal to 1.
Let G be a connected graph on n vertices. Eigenvalues and cor-
responding orthonormal eigenvectors of the Laplacian L = D−A
of G are denoted by ν1, ν2, . . ., νn = 0 and u1, u2, . . . , un, re-
spectively. Any vector x from Rn can be represented as a linear
combination of the form x = α1u1 + α2u2 + · · · + αnun.
Suppose now that G has distinct Laplacian eigenvalues µ1, µ2, . . . , µm =
0 with multiplicities k1, k2, . . . , km = 1, respectively. Vector x can
now be represented in the form x = y1 + y2 + · · · + ym where yi
belongs to the eigenspace of µi for i = 1, 2, . . . , m. We also have
ym = βj for some β.

Since Lx = L(y1+y2+· · ·+ym) = µ1y1+µ2y2+· · ·+µmym, we
have x(1) = x− 1µ1
Lx = (I− 1µ1
L)x = (1− µ2µ1
)y2+ · · ·+βj. We see
that the component of x in the eigenspace of µ1 has been cancelled
by the transformation by the matrix I− 1µ1
L while the component
in the eigenspace of µm remains unchanged. The transformation
I − 1µ2
L will cause that the component of x(2) = (I − 1µ2
L)x(1) in
the eigenspace of µ2 disappears. Continuing in this way
x(k) = (I − 1
µkL)x(k−1), k = 1, 2, . . . , m− 1 (1)
we shall obtain x(m−1) = βj.

We have seen how a vector x can be transformed to a multiple
of j using the iteration process (1) which involves the Laplacian
matrix of the multiprocessor graph G.
Let vector x(k) have coordinates x(k)1 , x
(k)2 , . . . , x(k)
n . Relations
(1) can be rewritten in the form
x(k)i = x
(k−1)i − 1
µk
∑
i∗j(dix
(k−1)i − x
(k−1)j ) (2)
where di is the degree of vertex i. This means that the current
load at vertex i is changed in such a way that vertex (processor) i
sends 1µk
-th part of its load to each of its di neighbors and, because
this holds for every vertex, also receives 1µk
-th part of the load from
each of its di neighbors.

We have a load flow on the edge set of G. If x(k−1)i is negative,
then vertex i, in fact, receives the corresponding amount. For each
edge ij we have two parts of the flow: the part which is sent (or
received) by i and the part which is sent (or received) by j. Adding
algebraically we get final value of the flow through edge ij. This
flow at the end has a non-negative value which is sent either from
i to j or vice versa.

The number of iterations in (1) is equal to the number m of
non-zero distinct Laplacian eigenvalues of the underlying graph.
The maximum vertex degree ∆ of G also affects computation of
the balancing flow. The complexity of the balancing flow calcula-
tions essentially depends on the product m∆ and that is why this
quantity was proposed in
R. Elsasser, R. Kralovic, B. Monien, Sparse topologies with
small spectrum size, Theor. Comput. Sci. 307:549–565, 2003.
as a parameter relevant for the choice and the design of multipro-
cessor interconnection networks.
The following definitions of four kinds of graph tightness have
been introduced and used in Cvetkovic D., Davidovic D., 2008,
2009.
First type mixed tightness t1(G) of a graph G is defined as the
product of the number of distinct eigenvalues m and the maximum
vertex degree ∆ of G, i.e., t1(G) = m∆.
Structural tightness stt(G) is the product (D + 1)∆ where D
is diameter and ∆ is the maximum vertex degree of a graph G.
Spectral tightness spt(G) is the product of the number of dis-
tinct eigenvalues m and the largest eigenvalue λ1 of a graph G.
Second type mixed tightness t2(G) is defined as a function of
the diameter D of G and the largest eigenvalue λ1, i.e., t2(G) =
(D + 1)λ1.
Several arguments were given which support the claim that
graphs with small tightness t2 are well suited for multiprocessor
interconnection networks.
It was proved that the number of connected graphs with a
bounded tightness is finite and graphs with tightness values not
exceeding 9 are determined explicitly. There are 69 such graphs
and they contain up to 10 vertices. In addition, graphs with mini-
mal tightness values when the number of vertices is n = 2, . . . , 10
are identified.

Anti-virus protection versus spread of knowledge
The largest eigenvalue λ1 plays an important role in modelling
virus propagation in computer networks. The smaller the largest
eigenvalue, the larger the robustness of a network against the
spread of viruses. In fact, it was shown in
Wang Y., Chakrabarti D., Wang C., Faloutsos C., Epidemic
spreading in real networks: An eigenvalue viewpoint, 22nd Symp.
Reliable Distributed Computing, Florence, Italy, Oct. 6–8, 2003.
that the epidemic threshold in spreading viruses is proportional to
1/λ1. Another model of virus propagation in computer networks
has been developed in
Van Mieghem P., Omic J., Kooij R., Virus spread in networks,
with the same conclusion concerning 1/λ1.

Research and development networks (R&D networks) are stud-
ied using the largest eigenvalue of the adjacency matrix in
Konig, M. D., Battiston S., Napoletano M., Schweityer F., The
efficiency and evolution of R&D networks, Working Paper 08/95,
Economics Working Paper Series, Eidgenossische Technische Hochschule
Zurich, Zrich, 2008.
Konig, M. D., Battiston S., Napoletano M., Schweityer F., On
algebraic graph theory and the dynamics of innovation net-
works, Networks and Heterogenous Media, 3 (2008), No. 2, 201–
219.
In such networks it is desirable that the knowledge is spread
through network as much as possible. Therefore the tendency is
to achieve high values of the largest eigenvalue, just opposite to
considerations of virus propagation.

An intuitive explanation of both phenomena, advantage to have
minimal index for virus protection and maximal index for knowl-
edge spread, can be obtained by the fact that the number of walks
of length k in a connected graph behaves asymptotically as cλk1
for a constant c > 0. The greater the number of walks the more
intensive is the spread of the mowing substance, does not matter
whether this is the virus or the knowledge.

The virus propagation model of Wang Y. et al. is a discrete time
model. It uses the vector Pt = (p1,t, p2,t, . . . , pn,t)T where pi,t is
the probability that the vertex i is infected at time t. The basic
relation is
pi,t = (1− δ)pi,t−1 + β∑
i∼jpj,t−1,
where β is the virus birth rate on an edge connected to an infected
vertex and δ the virus curing rate on an infected vertex. The
corresponding matrix relation is
Pt = ((1− δ)I + βA)Pt−1,
where A is the adjacency matrix of the graph representing the
network.

Further we have Pt = StP0 for t = 0, 1, 2, . . . where S =
(1− δ)I + βA. We see that the the vector Pt will tend to a zero-
vector for t →∞ if and only if all eigenvalues of the matrix S are
smaller than 1 in modulus. This would mean that virus epidemic
has died and will happen if 1− δ + βλ1 < 1, i.e.
β
δ<
1
λ1.
Given β and δ, we see that the network is as safer as the smaller
is λ1. We can denote the quantity τ = 1λ1
as the epidemic threshold
in spreading viruses. Hence if βδ < τ the network is safe and in the
opposite case the network will be conquered by viruses.

There are numerous mathematical investigations in both direc-
tions: to find graphs in particular classes of graphs which have
minimal or maximal largest eigenvalue. We mention a few results
and references.
We need the following definition.
Definition. A graph G with the edge set EG is called a nested
split graph if its vertices can be ordered so that jq ∈ EG implies
ip ∈ EG whenever i ≤ j and p ≤ q.
This definition is used in
Cvetkovic D., Rowlinson P., Simic S. K., Eigenspaces of Graphs,
Cambridge University Press, Cambridge, 1997,
where the graphs in question were called graphs with a stepwise
adjacency matrix. Some other definitions and terms are used in
the literature, e.g. degree maximal graphs, threshold graphs. Note
that graphs with a stepwise adjacency matrix are exactly the nested
split graphs. We also have
Proposition. A graph is a nested split graph if and only if
it does not contain as an induced subgraph any of the graphs
P4, 2K2, C4.
It is well-known that in connected graphs with the given numbers
of vertices and edges the graph with maximal largest eigenvalue is
a nested split graph.
There are less results concerning minimal values of the largest
eigenvalue. The paper
Simic S., On the largest eigenvalue of bicyclic graphs, Publ. Inst.
Math.(Beograd), 46(60)(1989), 1-6.
solves the problem for bicyclic graphs.
Motivated by this fact, the authors of
van Dam E. R., Kooij R. E., The minimal spectral radius of
graphs with a given diameter, Linear Alg. Appl. 423 (2007),
408–419.
determine graphs with minimal λ1 among graphs with given num-
bers of vertices and edges, and having a given diameter.

Statistical databases and social networks
Statistical databases allow only statistical access to their records.
Individual values are confidential and are not to be disclosed, either
directly or indirectly. Thus, users of a statistical database are
restricted to statistical types of queries, such as looking for the sum
of values, minimum or maximum value of some parameters, etc.
Moreover, no sequence of answered queries should enable a user
to obtain any of the confidential individual values. However, if a
user is able to reveal a confidential individual value, the database
is said to be compromised. Statistical databases that cannot be
compromised are called secure.

One can consider a restricted case where the query collection
can be described as a graph. Surprisingly, the results from
Brankovic L., Usability of secure statistical data bases, PhD
Thesis, Newcastle, Australia, 1998.
Brankovic L., Miller M., Siran J., Graphs, (0,1)-matrices and
usability of statistical data bases, Congressus Numerantium, 120
(1996), 186–192.
show an amazing connection between compromise-free query col-
lections and graphs with least eigenvalue -2. This connection was
recognized in the paper
Brankovic Lj., Cvetkovic D., The eigenspace of the eigenvalue
-2 in generalized line graphs and a problem in security of sta-
tistical data bases, Univ. Beograd, Publ. Elektrotehn. Fak., Ser.
Mat., 14 (2003), 37–48.

The problem of protecting the privacy appears also in social
networks at the Internet (for example, FaceBook). To protect the
privacy of personal data the network is randomized by deleting
some actual edges and by adding some false edges in such a way
that global characteristics of the network are unchanged. This is
achieved using eigenvalues of the adjacency matrix (in particular,
the largest one) and of the Laplacian (algebraic connectivity) as
described in the paper
Ying X., Wu X., Randomizing social networks: a spectrum pre-
serving approach, Proc. SIAM Internat. Conf. Data Mining,
SDM2008, April 24–26, 2008, Atlanta, Georgia, USA, SIAM, 2008,
739–750.
Quantum computing
Quantum computation is a model of computation based on the
principles of quantum mechanics although the corresponding com-
puters have not yet been realized. In spite of the non-existence of
actual machines, the theory of quantum computing is very much
developed.
For a general overview on Quantum Information Technology see,
for example, special issue of the journal
NEC Research & Developments, 44(2003), No. 3.

A graph is called integral if its spectrum consists entirely of
integers.
It has been discovered recently in
Christandl M., Datta N., Ekert A., Landahl A.J., Perfect state
transfer in quantum spin networks, Phys. Rev. Lett., 92(2004),187902.
that integral graphs can play a role in the so called perfect state
transfer in quantum spin networks.
According to definition in Physics, there is perfect state transfer
between two vertices of a graph if a single excitation can travel
with fidelity one between the corresponding sites of a spin system
modelled by the graph.

Mathematically, let G be a graph with adjacency matrix A and
consider the matrix H(t) = eiAt where t is a real variable and
i2 = −1. According to
Godsil C., Periodic graphs, arXiv:0806.2704 [math.CO].
perfect state transfer occurs between vertices u and v of G if there
is a value of t such that |H(t)u,v| = 1.
This can happen in integral graphs but not always.

There are exactly 13 connected, cubic, integral graphs
Bussemaker F. C., Cvetkovic D., There are exactly 13 con-
nected, cubic, integral graphs, Univ. Beograd, Publ. Elektrotehn.
Fak., Ser. Mat. Fiz., No. 544 - No. 576(1976), 43-48.
Among them are, for example, the 3-cube and the Petersen
graph.
The 3-cube is the only connected cubic integral graph with per-
fect state transfer
Severini, S., The 3-dimensional cube is the only connected cubic
graph with perfect state transfer, to appear.
Comments and suggestions
After completing our survey of applications of graph spectra to
several branches in computer science, we have some observations
and comments including some new results.
Our general suggestion is that mathematicians should re-
act on the explosion of the number of papers in computer sci-
ence which use graph spectra by selecting for their own research
some subjects from or inspired by such applications.
We have a number of detailed comments.

Computer networks resistent to the spread of viruses.
We have some results on graphs with a minimal value of the
largest eigenvalue. As we know, such graphs are models of com-
puter networks resistent to the spread of viruses.
Graphs with a minimal value of the largest eigenvalue in a set
of graphs will be called minimal graphs.
Let deg(v) be the degree of the vertex v. An internal path in
some graph is a path v0, v1, . . . , vk+1 for which deg(v0), deg(vk+1) ≥3 and deg(v1) = · · · = deg(vk) = 2 (here k ≥ 0, or k ≥ 2 whenever
vk+1 = v0).
Consider connected graphs with fixed numbers of vertices and
edges.

A minimal graph cannot contain vertices of degree 1 because
deleting a vertex of degree 1 and a simultaneous insertion of a
vertex of degree 2 in the middle of an edge on an internal path
would diminish the largest eigenvalue λ1 (by a result from
Hoffman A.J., Smith J.H., On the spectral radii of topologi-
cally equivalent graphs, Recent Advances in Graph Theory, ed.
M. Fiedler, Academia Praha, 1975, 273-281.)
As a consequence, all edges belong to internal paths. Subdivid-
ing edges in such graphs we can further diminish λ1. However, we
have λ1 ≥ ∆/√
∆− 1, where ∆ is the maximum vertex degree
(as follows form a result from the same paper). Therefore it is
reasonable to choose ∆ as small as possible. Obviously we should
accept ∆ = 3 since graphs with ∆ < 3 are not of much interest in
this context.
Let H be a connected graph with q edges and with vertex degrees
at least 3. For each i = 1, 2, . . . , q we want to subdivide edge i by
inserting li vertices of degree 2. Suppose that Σqi=1li = e is fixed.
In this way we obtain a graph G. An explicit relation between the
largest eigenvalue of G and quantities l1, l2, . . . , lq can be found.
A standard procedure with Lagrange’s multipliers for finding the
minimum of an implicit function leads to the conclusion that under
some reasonable additional assumptions the quantities li should be
almost equal (equal if possible). Such a subdivision of a graph is
called balanced subdivision.
Details will appear in the paper
Belardo F., Li Marzi E.M., Simic S.K., Connected graphs of
fixed order and size with minimal index, to appear.

Indeed many of the examples of minimal graphs found by com-
puter have this property.
Earlier results on the subject are special cases of this result. It
started with a conjecture that a balanced subdivision minimizes
the largest eigenvalue in a cycle with an additional edge. The
problem was solved in a generalized form. There are results for
broken wheels and for trees.
The above presented procedure enables explicit construction of
minimal tricyclic graphs. Previous result for bicyclic graphs has
been proved in a shorter way.
Our conclusion is that balanced subdivisions of cubic graphs
should be considered as good models of virus resistent computer
networks.

Signless Laplacian could be useful
We suggest to try to create models for virus propagation and
the spread of knowledge in which the adjacency matrix would be
replaced by the signless Laplacian. In such models desirable graphs
for anti-virus protection would be those with small q1 and for R&D
networks those with large q1.
We believe that there are situations in which viruses or knowl-
edge move along lazy random walks rather than along standard
random walks. This can be expected in situations when the ver-
tices when receiving something from their neighbours are likely to
respond back with some action.
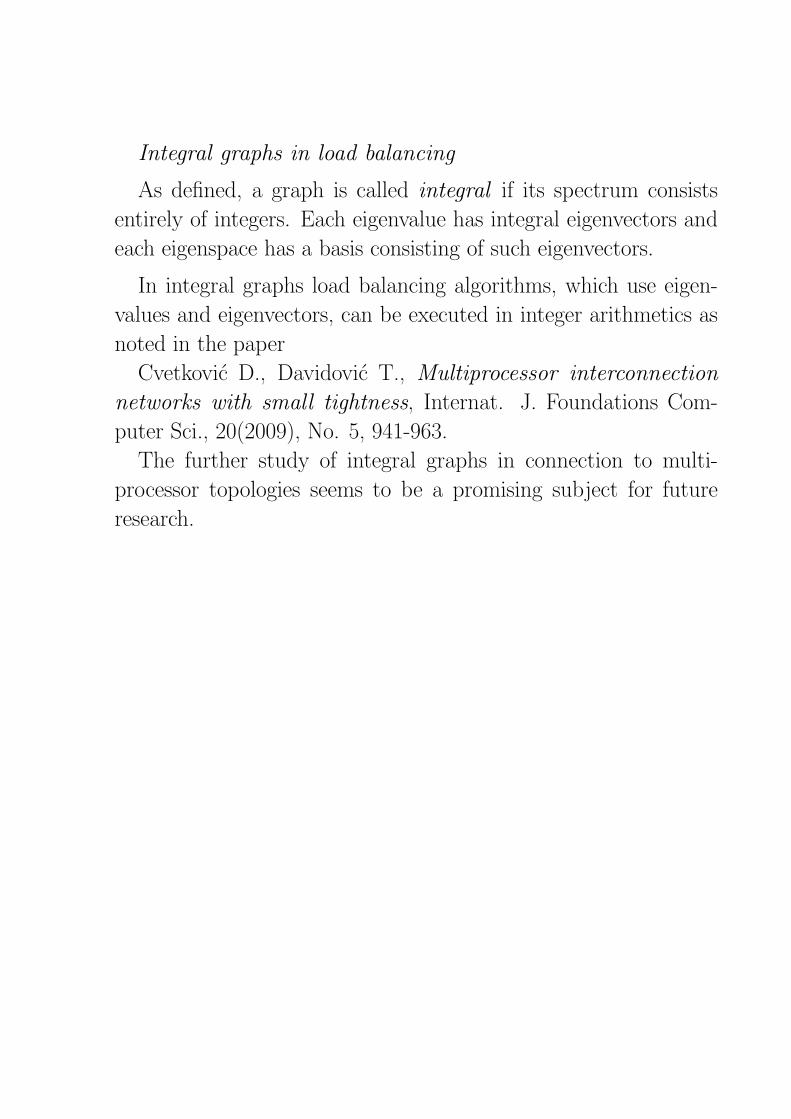
Integral graphs in load balancing
As defined, a graph is called integral if its spectrum consists
entirely of integers. Each eigenvalue has integral eigenvectors and
each eigenspace has a basis consisting of such eigenvectors.
In integral graphs load balancing algorithms, which use eigen-
values and eigenvectors, can be executed in integer arithmetics as
noted in the paper
Cvetkovic D., Davidovic T., Multiprocessor interconnection
networks with small tightness, Internat. J. Foundations Com-
puter Sci., 20(2009), No. 5, 941-963.
The further study of integral graphs in connection to multi-
processor topologies seems to be a promising subject for future
research.
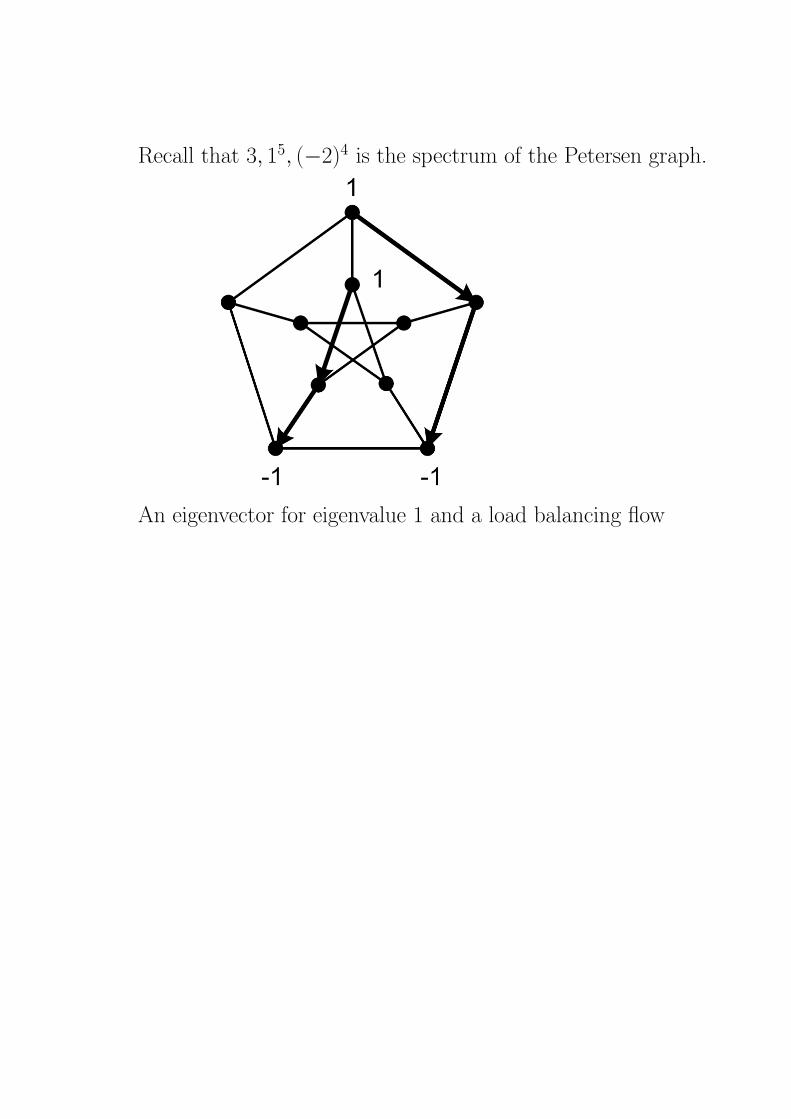
Recall that 3, 15, (−2)4 is the spectrum of the Petersen graph.
An eigenvector for eigenvalue 1 and a load balancing flow

Thank you for your attention