grape juice fall 2014 by: phillip wallace professor: bob stassen class: mktg 4443
TRANSCRIPT

Grape Juice Fall 2014
By: Phillip WallaceProfessor: Bob Stassen
Class: MKTG 4443

Table of Contents
I. Product SnapshotII. Category Role
I. Product Snapshot AnalysisII. Aisle of Grape Juice
III. Store DemographicsIV. Category Assessment V. Category Strategy VI. Category TacticsVII.Category Review
I. A Look Back Into The Past

Why Grape Juice?
• Did you know that grape juice is one of the top 5 most popular fruit juice flavor in the world?
• Grapes contain flavonoids that give it is color (gathers interest) • Drinking too much grape juice can cause a laxative effect (why
seniors buy)• Rich in vitamin C and K and are good for your heart and
indigestion• Enough facts….Lets turn to the product snapshot!

Product Snapshot: TOTAL GRAPE JUICE (JC,DRK-CAN,BTL) OZ. Total Dollars BehaviorScape Framework
Lifestyle
Behavior Stage Cosmopolitan CentersAffluent Suburban
SpreadsComfortable Country Struggling Urban Cores Modest Working Towns Plain Rural Living Total
Start-Up FamiliesHHs with Young Children Only < 6 153 173 193 200 271 188 198
Small Scale FamiliesSmall HHs with Older Children 6+ 83 109 135 99 87 76 99
Younger Bustling FamiliesLarge HHs with Children (6+), HOH <40 131 132 129 137 178 139 143
Older Bustling FamiliesLarge HHs with Children (6+), HOH 40+ 135 129 121 168 125 111 130
Young TransitionalsAny size HHs, No Children, < 35 36 59 58 103 83 48 67
Independent Singles1 person HHs, No Children, 35-64 68 45 44 42 58 65 55
Senior Singles1 person HHs, No Children, 65+ 56 45 52 128 61 58 64
Established Couples2+ person HHs, No Children, 35-54 58 95 95 85 74 82 82
Empty Nest Couples2+ person HHs, No Children, 55-64 119 104 93 104 77 96 97
Senior Couples2+ person HHs, No Children, 65+ 136 126 105 83 116 107 113
Total 89 105 100 110 104 93 100
Source: Spectra BehaviorScape: Total Dollars/Spectra 2014 Nov (Spectra)/Homescan Product Library
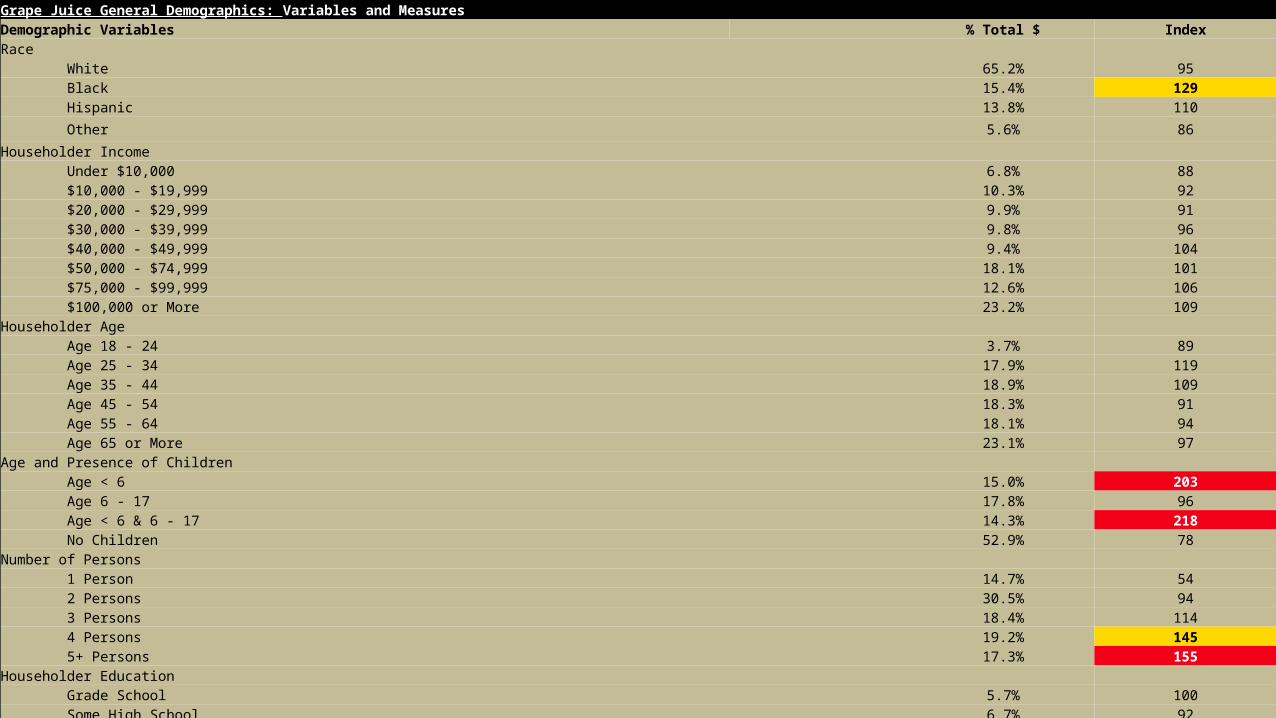
Grape Juice General Demographics: Variables and MeasuresDemographic Variables % Total $ IndexRace White 65.2% 95 Black 15.4% 129 Hispanic 13.8% 110
Other 5.6% 86
Householder Income Under $10,000 6.8% 88 $10,000 - $19,999 10.3% 92 $20,000 - $29,999 9.9% 91 $30,000 - $39,999 9.8% 96 $40,000 - $49,999 9.4% 104 $50,000 - $74,999 18.1% 101 $75,000 - $99,999 12.6% 106 $100,000 or More 23.2% 109Householder Age Age 18 - 24 3.7% 89 Age 25 - 34 17.9% 119 Age 35 - 44 18.9% 109 Age 45 - 54 18.3% 91 Age 55 - 64 18.1% 94 Age 65 or More 23.1% 97Age and Presence of Children Age < 6 15.0% 203 Age 6 - 17 17.8% 96 Age < 6 & 6 - 17 14.3% 218 No Children 52.9% 78Number of Persons 1 Person 14.7% 54 2 Persons 30.5% 94 3 Persons 18.4% 114 4 Persons 19.2% 145 5+ Persons 17.3% 155Householder Education Grade School 5.7% 100 Some High School 6.7% 92 High School Graduate 23.9% 94 Some College 29.6% 103 College Graduate 34.0% 104

Demographic Variables % Total $ Index % Total $ Index % Total $ Index % Total $ Index
Race of Head of Household
White 65.3% 95 58.9% 85 68.9% 100 65.7% 95
Black 13.7% 115 15.8% 132 16.4% 137 16.2% 136
Hispanic 15.2% 121 20.3% 161 9.0% 72 12.6% 100
Asian 3.5% 82 2.1% 49 3.6% 83 2.9% 68
Other 2.3% 103 2.9% 130 2.1% 95 2.6% 115
Number of Persons
1 Person 15.3% 56 5.3% 19 26.8% 99 15.1% 56
2 Persons 32.7% 101 18.0% 56 28.9% 89 32.4% 100
3 Persons 16.8% 104 24.1% 149 13.5% 83 18.3% 113
4 Persons 17.8% 135 23.1% 176 18.0% 136 19.5% 148
5+ Persons 17.5% 157 29.4% 265 12.9% 116 14.8% 133
Household Income
Under $10,000 6.3% 83 4.7% 61 7.3% 95 7.0% 92
$10,000 - $19,999 10.0% 90 9.8% 88 6.3% 56 9.5% 85
$20,000 - $29,999 10.2% 94 11.1% 102 10.4% 96 10.1% 93
$30,000 - $39,999 10.6% 105 12.1% 119 4.5% 45 9.4% 92
$40,000 - $49,999 9.1% 102 8.9% 99 4.8% 53 9.8% 109
$50,000 - $74,999 17.0% 95 21.2% 118 14.7% 82 18.9% 105
$75,000 - $99,999 14.4% 121 12.8% 108 12.0% 101 12.0% 101
$100,000 - $149,999 15.6% 127 10.9% 88 25.0% 203 13.1% 106
$150,000 or More 6.6% 74 8.5% 94 15.0% 167 10.3% 114
Private Label Nestle R.W. Knudsen Welch's*Product Snapshot

Product Snapshot Analysis – United States
• Grape Juice more prominent among African American and Caucasian families.
• Large households purchase pattern– 5+ or larger– Start-up and Young-Bustling families
• Low to high income purchasers– Low income = purchase private label and Welch’s– High income = R.W. and Nestle Products
• Age popularity: 35+ purchasing more• Aisle space limited

Grape Juice Category Role

Grape Juice Under Fire
• Gross Margins were relatively medium to low– Moderate number of facings average: 2-3 facings – Buying patterns scarce – Little to no deal – promotions scarce since price was already low– More national brands purchased
• Medium sales dollar volume– Sales average $100-200 million USD
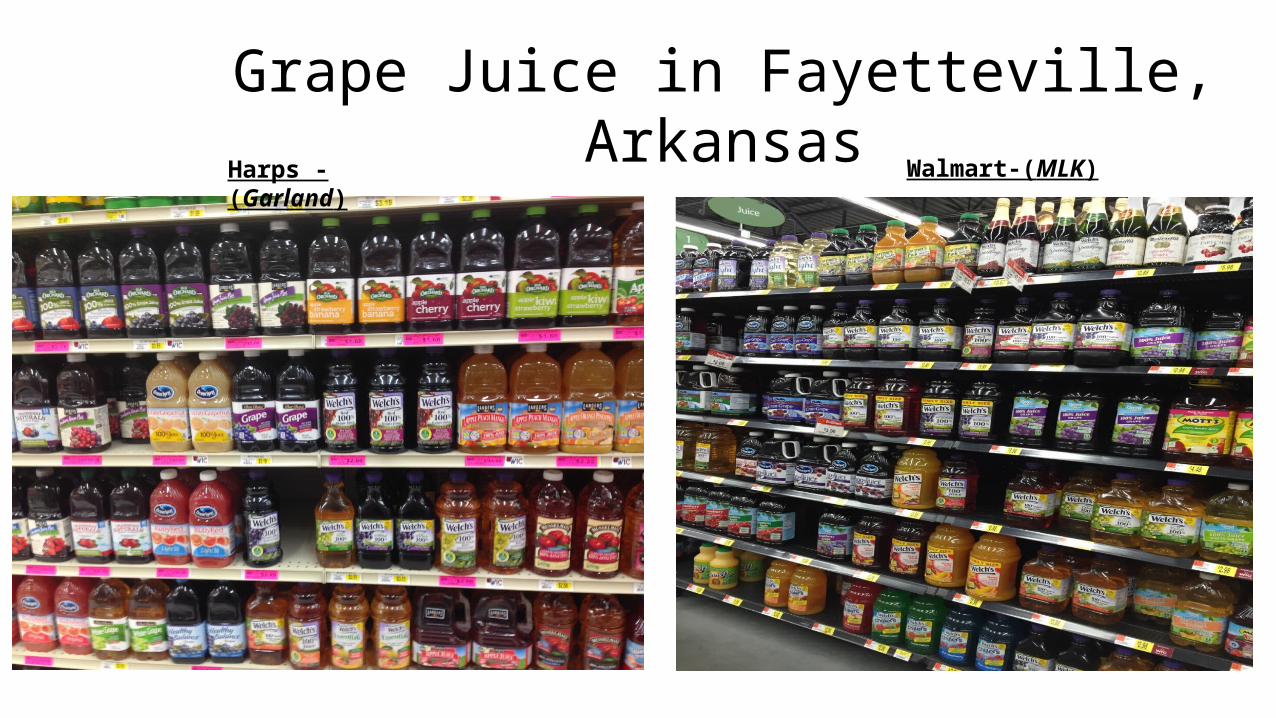
Grape Juice in Fayetteville, ArkansasWalmart-(MLK)Harps -(Garland)

Category Role Table
ITEM $ (000) DOLLAR SHARE ITEM BUYERS (000)
ITEM PENETRATION
ITEM $ PER ITEM BUYER
ITEM TRIPS PER ITEM BUYER
ITEM $ PER ITEM TRIP
% ITEM $ ON DEAL
% DOLLARS WITH MANUFACTURER
COUPON
FRUIT JUICE - GRAPE - SHELF STBL TOTAL U.S. 340,435.1 100.0 28,452.1 24.5 12.0 3.1 3.9 19.4 2.6WEST SOUTH CENTRAL 29,533.3 100.0 2,901.5 22.3 10.2 3.1 3.3 10.6 3.3
APPLE & EVE - FRUIT JUICE - GRAPE - SHELF STBL
TOTAL U.S. 3,088.3 0.9 385.2 0.3 8.0 1.9 4.2 33.2 2.3WEST SOUTH CENTRAL NA NA NA NA NA NA NA NA NA
CTL BR - FRUIT JUICE - GRAPE - SHELF STBL
TOTAL U.S. 105,262.1 30.9 11,621.4 10.0 9.1 2.6 3.6 13.4 0.1WEST SOUTH CENTRAL 10,333.9 35.0 1,329.5 10.2 7.8 2.6 3.0 5.8 0.0
DOLE - FRUIT JUICE - GRAPE - SHELF STBL
TOTAL U.S. 533.1 0.2 180.9 0.2 3.0 1.8 1.7 3.7 0.0WEST SOUTH CENTRAL NA NA NA NA NA NA NA NA NA
JUICY JUICE - FRUIT JUICE - GRAPE - SHELF STBL
TOTAL U.S. NA NA NA NA NA NA NA NA NAWEST SOUTH CENTRAL NA NA NA NA NA NA NA NA NA
KEDEM - FRUIT JUICE - GRAPE - SHELF STBL
TOTAL U.S. 13,496.0 4.0 1,075.4 0.9 12.6 2.3 5.6 41.5 0.1WEST SOUTH CENTRAL NA NA NA NA NA NA NA NA NA
LANGERS - FRUIT JUICE - GRAPE - SHELF STBL
TOTAL U.S. 6,755.3 2.0 825.9 0.7 8.2 1.6 5.0 25.9 2.2WEST SOUTH CENTRAL NA NA NA NA NA NA NA NA NA
MANISCHEWITZ - FRUIT JUICE - GRAPE - SHELF STBL
TOTAL U.S. NA NA NA NA NA NA NA NA NAWEST SOUTH CENTRAL NA NA NA NA NA NA NA NA NA
MINUTE MAID - FRUIT JUICE - GRAPE - SHELF STBL
TOTAL U.S. 1,631.3 0.5 421.8 0.4 3.9 1.3 3.1 22.9 2.7WEST SOUTH CENTRAL
NA NA NA NA NA NA NA NA NA
NESTLE JUICY JUICE - FRUIT JUICE - GRAPE - SHELF STBL
TOTAL U.S. 51,461.3 15.1 6,939.7 6.0 7.4 2.3 3.3 22.1 5.6WEST SOUTH CENTRAL 3,474.0 11.8 668.6 5.1 5.2 2.0 2.6 24.4 15.7
OLD ORCHARD - FRUIT JUICE - GRAPE - SHELF STBL
TOTAL U.S. 8,570.8 2.5 1,522.0 1.3 5.6 1.9 3.0 35.0 3.3WEST SOUTH CENTRAL 1,002.2 3.4 209.5 1.6 4.8 1.8 2.6 13.6 3.8
R W KNUDSEN FAMILY - FRUIT JUICE - GRAPE - SHELF STBL
TOTAL U.S. 1,572.2 0.5 235.2 0.2 6.7 1.4 4.7 28.2 3.9WEST SOUTH CENTRAL
NA NA NA NA NA NA NA NA NA
RUBY KIST - FRUIT JUICE - GRAPE - SHELF STBL
TOTAL U.S. NA NA NA NA NA NA NA NA NAWEST SOUTH CENTRAL NA NA NA NA NA NA NA NA NA
TROPICANA - FRUIT JUICE - GRAPE - SHELF STBL
TOTAL U.S. NA NA NA NA NA NA NA NA NAWEST SOUTH CENTRAL NA NA NA NA NA NA NA NA NA
VERYFINE - FRUIT JUICE - GRAPE - SHELF STBL
TOTAL U.S. NA NA NA NA NA NA NA NA NAWEST SOUTH CENTRAL NA NA NA NA NA NA NA NA NA
WELCH'S - FRUIT JUICE - GRAPE - SHELF STBL
TOTAL U.S. 139,836.5 41.1 13,453.8 11.6 10.4 2.4 4.4 18.5 3.8WEST SOUTH CENTRAL 13,920.0 47.1 1,425.8 11.0 9.8 2.4 4.0 10.6 2.8

Grape Juice Importance• Grape Juice contributes to 16.53% market share of all juices
– Total Consumption: 40,000,000 consumers USA– Avg Price: $3.15– $3.15 x 40,000,000 = $126,000,000!
• Retailers loosing more money on private label rather than national brands– National brands competing in price and promotion– Brand recognition and brand loyalty
• However, there are more private labels present at store

Walmart (MLK)
Walmart (Wedington)
Harps (Garland)
Ozark Natural Foods (College)
Circular Trade Areas - Fayetteville

Circular Trade Area
• Walmart (MLK)– Majority white purchasers– 1 person households (majority) – 47.7%
• (College Students)
– Under $20,000 income– Average Age: 18-34 – No Children – 84.9%– Large category management
• Walmart (Wedington)– Larger white presence– College students – low income and young age
• Harps (Garland)– Greater minority presence– More 1 to 2 people households– Income increasing ($20,000-$30,000)– Young household (18-34)– No children
• Ozark Natural Foods (College)– Largest white presence (84.8%)– 1-3 number of persons– Higher income– Older: 25-45 years– Children: Ages 6-17 prominent – Smallest category management but was precise

See the difference?
Category Assessment
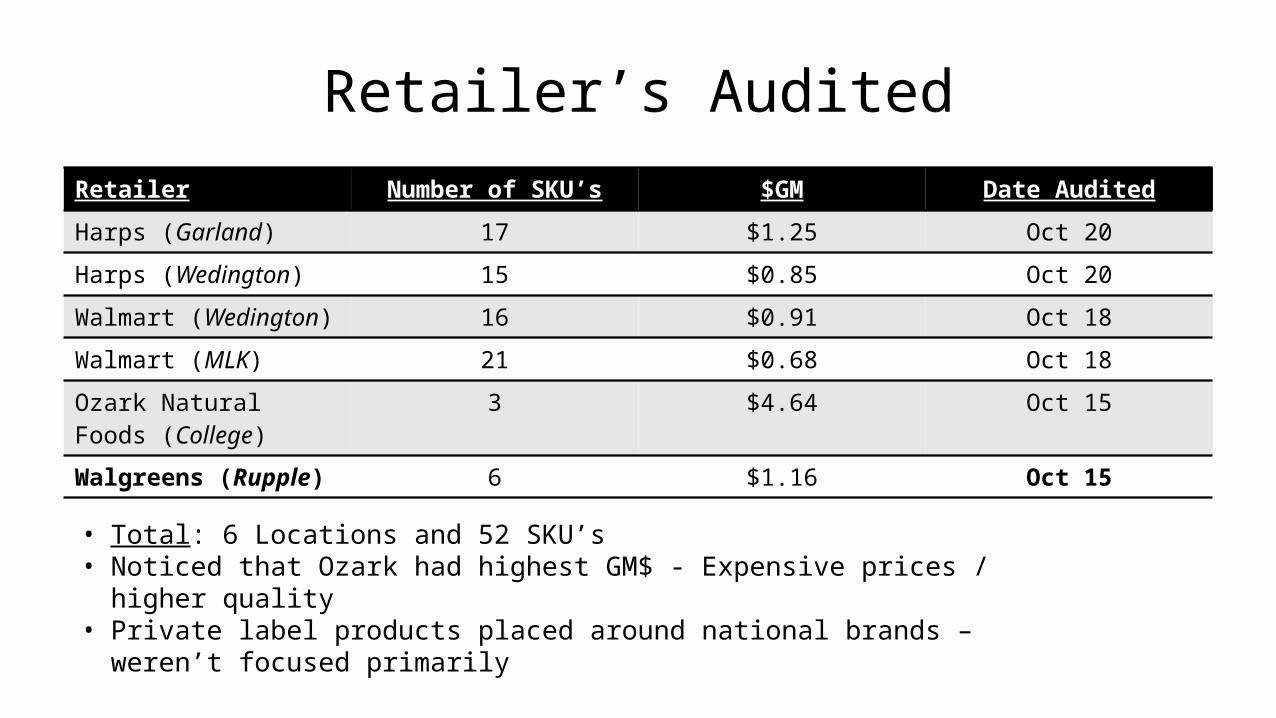
Retailer’s AuditedRetailer Number of SKU’s $GM Date Audited
Harps (Garland) 17 $1.25 Oct 20
Harps (Wedington) 15 $0.85 Oct 20
Walmart (Wedington) 16 $0.91 Oct 18
Walmart (MLK) 21 $0.68 Oct 18
Ozark Natural Foods (College)
3 $4.64 Oct 15
Walgreens (Rupple) 6 $1.16 Oct 15
• Total: 6 Locations and 52 SKU’s• Noticed that Ozark had highest GM$ - Expensive prices / higher quality • Private label products placed around national brands – weren’t focused primarily

Interesting Grape Juice BrandsMFR Brand Name and
SizePrice $GM %GM
Private Label Great Value – 64oz $3.68 $1.12 30.4%
Natl. Grape Assoc. Welch’s – 64oz $3.53 $1.13 32.0%
Nestle Juicy Juice – 60oz $3.49 $1.57 45.0%
Dr. Pepper/Snapple HI-C Grape – 60oz $2.98 $1.54 51.7%
• Type C Brands – high gross margin and cost • Being sold frequently (Saw more natl. brands being purchased over private label)• Natl. Brands gathered more brand awareness and loyalty – Past Purchasing

Lower Gross Margin BrandsMFR Brand Name and
SizePrice $GM %GM
Private Label Great Value – 64oz
$2.08 ($0.48) -23.1%
Private Label Great Value – 54oz
$2.28 ($0.28) -12.3%
Natl. Grape Assoc. Welch’s – 46oz $2.00 ($0.30) -15.0%
Sunny Delight Corp.
Sunny D Grape – 56oz
$1.59 ($0.65) -40.9%
• Private Label brands struggling (Foil brands “dust” haven’t been sold) - Switched• Customers used to shopping for natl. brands in Fayetteville area (College Students)• Surprising to see some major brands suffering negative GM – Not selling/inventory


Category Strategy
• Harps (Garland and Wedington)– Natl. Grape Assoc. (Welch’s – 34.8%) and
Private Label (37.0%) more prominent – 6 facings each– Had most facings in store (bulk of Grape Juice
section)– Focused more on Natl. Label brands (College
students buy via past purchase patterns) some buy via price
• Walmart (Wedington and MLK)– Focused more on their private label (Great Value –
48.7% and 34.4%)– However, Natl. Brands had large presence (41.0%
and 33.3%) – Private label brands more centered
• Ozark and Walgreens (Wedington and College)– Larger presence on private label brands (100% and
40%)

Category

Category Tactics for $GM
• Harps (Garland and Wedington)– Greater focus on Natl. Brands “Best
Margins”• Natl. Grape = 34.4% and $1.22
mean GM• Florid Family = 34.0% and $7.23
mean GM– Private labels suffered “Worst
Margins”• Private Label = 9.1% and $0.3217
mean GM
• Walmart (Wedington and MLK)– Greater focus on private label brand
• Great Value and others = 31.3% and 44.3% with mean GM of $0.5675 and $0.7938
– Natl. Brands close behind• PepsiCo = 51.8% at $2.50• Natl. Grape = 19.1% at $0.3425
• Small Locations (Walgreens - Wedington and Ozark - College) focus more on private label
• Private Label = 100% at $4.64 and 24.1% at $0.84


Category Tactics %GM
• Follows in suit of $GM– Harps – Focused on Natl. Brands over Private Label
• Witnessed higher GM due to past purchase patterns and brand recognition– Walmart – Introduced more private label (Best Choice and Great Value) but
consumers purchasing natl. brands over private label (larger aisle space)• Private label still making an impact for those who desire lower price and don’t
care much about brand • Found more deal on natl. brands over private label
– Walgreens and Ozark Natural Foods• Smaller stores and fewer SKU’s • Focused on private label brands

Does Private Label Have A Place for Grape Juice?
• Yes and No– Why Yes?
• Yes for stores focusing on private label (Walmart with Great Value and Walgreens with De-Lish)
• Provide lower price to consumers• More SKU’s • Still provide gross margins to retailers
– Why No?• Natl. Brands have stronger purchasers than private label in Fayetteville• Harder to sell to those who are “Brand Loyal”• More deal on Natl. Brands.• Natl. Brands making more gross margins to retailers

2012 Data
Look at the Private Label Compared to Natl. Brands

2014 Data
Greater Focus on Natl. Brands
Less focus but still moderate on PL

A Look Back Into The Past
• 2012 Audit File– Saw greater focus in private label brands– Average 6.5 facings – Customers purchasing more on low price/deal – National Brands important but weren’t selling as much– Category had more SKU’s and brands to select– Majority size was 64oz and avg. price was $3.23
• 2014 Audit File– Focus switched to national brands– Private labels decreased to 5 facings– New customers buying natl. brands based on past purchasing from family – Grape juice aisle decreased in size and SKU’s– Display more centered on natl. brands with little new products – Category overall decreasing – Store depicts which to concentrate on either natl. brands or PL (Walmart vs. Harps) – Witnessed foil brands driving consumers to natl. brands– New Sizes: 64oz still popular but 24oz, 32oz, 11.5oz made appearances (Children Size – Adapt to family)
• Avg. Price: $2.98