grant public health potpourri · grant public health potpourri ... slide courtesy of rachel gorwitz...
TRANSCRIPT
Grant Public Health Potpourri
Grant Adams Medical Societ MeetingGrant-Adams Medical Society MeetingMonday, April 14th, 2008
Alexander L Brzezny MD MPH FAAFPAlexander L. Brzezny, MD, MPH, FAAFPHealth Officer
Grant County Health District
CONFLICTS OF INTEREST: nothing to disclose
OBJECTIVESOBJECTIVES• Through numbers and comparisons, reaffirm
that Grant (and Adams) County is indeed a “whole another country.” (didn’t we know?)
• Outline why public health challenges are healthcare challenges. g
• Discuss the “superbug” and its continued rise to fame also in our backyardrise to fame also in our backyard.
• Honorably mention the pandemic flu.

CASE #1: deli sandwich anyone?CASE #1: deli sandwich anyone?
• February 2007: a case of Salmonella reportedFebruary 2007: a case of Salmonella reported to health district (serovar Senftenberg).
• April 2007: a case of Salmonella reported to p phealth district (serovar non-typhi, ID pending).
• Search: whole state of California: 47 cases of Salmonella serovar Senftenberg in 2004.
• In 2007, England and Wales had an outbreak ith at total of 30 caseswith at total of 30 cases…
• May 2007: two cases of Salmonella (serovar Senftenberg) reported to health districtSenftenberg) reported to health district.

CASE #1 (Quiz)CASE #1 (Quiz)
• What (where) is Senftenberg?What (where) is Senftenberg?• Do we have an outbreak?
Wh t ld d t?• What would you do next?Commence an investigation?Call the state department of health?Call the CDC?Stop eating food?All of the above?

Senftenberg Brandenburg D EUSenftenberg, Brandenburg, D, EU

2007 GC S. Senftenberg outbreakSalmonella Senftenberg 2007Salmonella Senftenberg 2007
4
3
Collection of Outliers/Asymptomatic
# of cases
2
# of
cas
es
1
01 3 5 7 9 11 13 15 17 19 21 23 25 27 29 31 33 35
Week of 2007
•Epi investigation: highest probability of the source a restaurant in ML (June)F d i ti t d t b t t li lt f S S
Weeks of 2007
•Food prep process investigated step by step: meat slicer cultures + for S.S.•So far: 19 cases of Salmonella Senftenberg Dec 2006-Mar 2008•Cost to date: ~$30,000

GC PERTUSSIS (2005-2008)( )
YEAR Cases Contacts ProphylaxedYEAR Cases Contacts Prophylaxed Contacts
2005 4 20 20 (100.0%)2006 1 8 7 (87.5%)2007 4 240 222 (92.5%)2008 2 82 75 (91.2%)
TOTAL 11 350 324 (92.6%)• Approximately 30 contacts per case• Approximately $10,000 per case• Cost of DTaP (or Tdap) 10-pack: $12.65-$13.75 ($30-75-$31.75); CDC $$Cost of DTaP (or Tdap) 10 pack: $12.65 $13.75 ($30 75 $31.75); CDC $$• Tdap recommended once in a lifetime 11-12y.o. & once 19-65y.o. (ACIP)

N MENINGITIDIS (2005-2008)N. MENINGITIDIS (2005 2008)YEAR Cases Contacts Prophylaxed p y
Contacts
2005 1 8 8 (100.0%)2006 0 0 02007 1 148 148 (100.0%)2008 2 67 65 (97.0%)TOTAL 4 223 221 (99.1%)
• Approximately 35 contacts per case• Approximately $14,000 per case• Tetravalent MENACTRA® to 11-18 y.o. ($75.35 for 5-pack) with Tdapy ($ p ) p
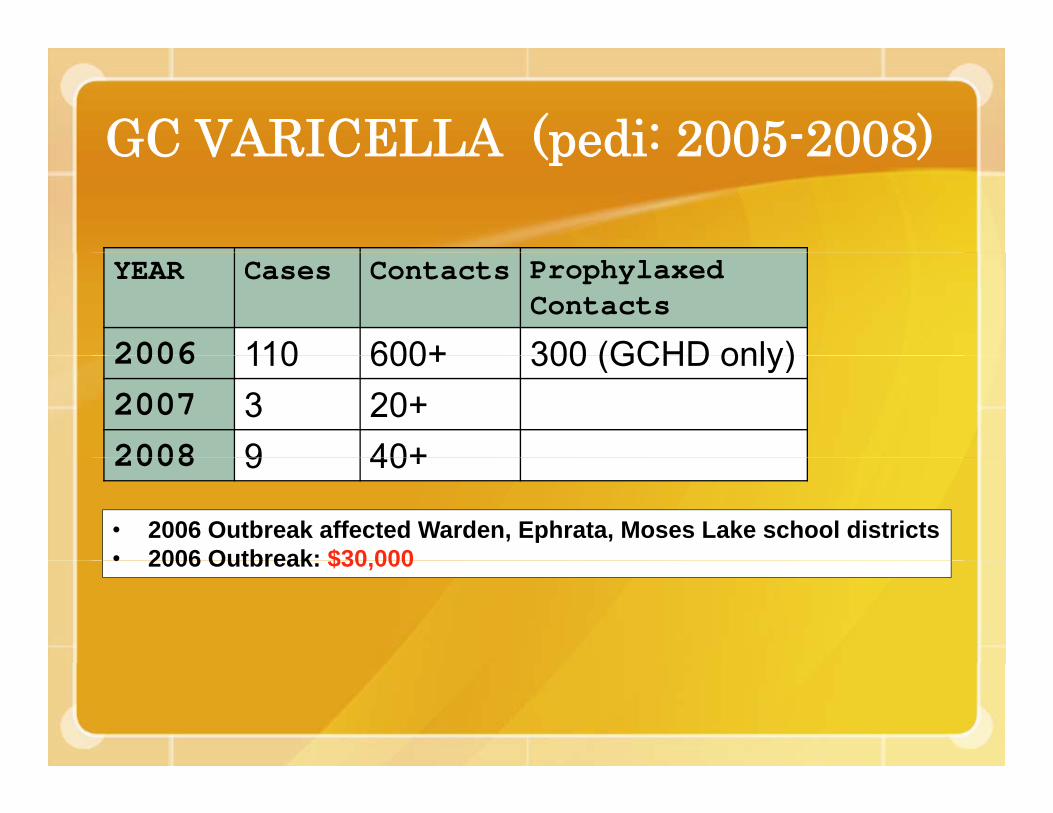
GC VARICELLA (pedi: 2005-2008)GC VARICELLA (pedi 2005 2008)
YEAR Cases Contacts Prophylaxed Contacts
2006 110 600+ 300 (GCHD only)2006 110 600+ 300 (GCHD only)2007 3 20+2008 9 40+2008 9 40+
• 2006 Outbreak affected Warden, Ephrata, Moses Lake school districts• 2006 Outbreak: $30 000• 2006 Outbreak: $30,000
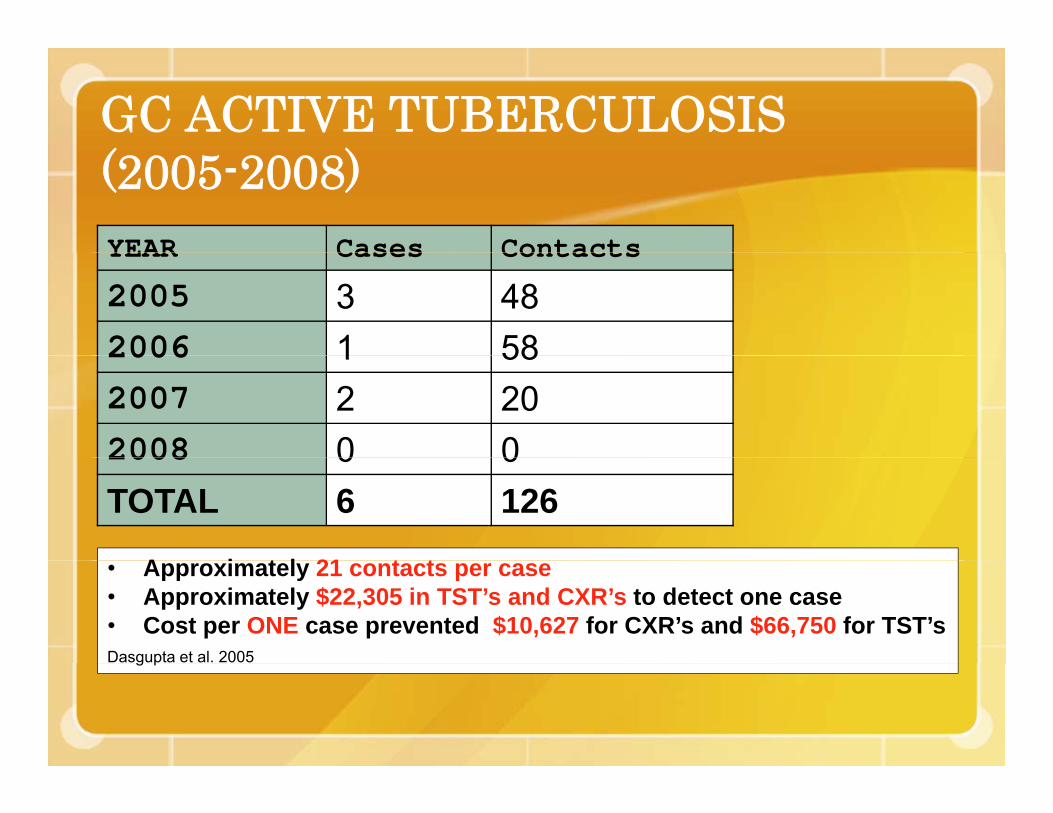
GC ACTIVE TUBERCULOSIS ( )(2005-2008)YEAR Cases ContactsYEAR Cases Contacts
2005 3 482006 1 582006 1 582007 2 202008 0 02008 0 0TOTAL 6 126
A i t l 21 t t• Approximately 21 contacts per case• Approximately $22,305 in TST’s and CXR’s to detect one case• Cost per ONE case prevented $10,627 for CXR’s and $66,750 for TST’sDasgupta et al. 2005g p
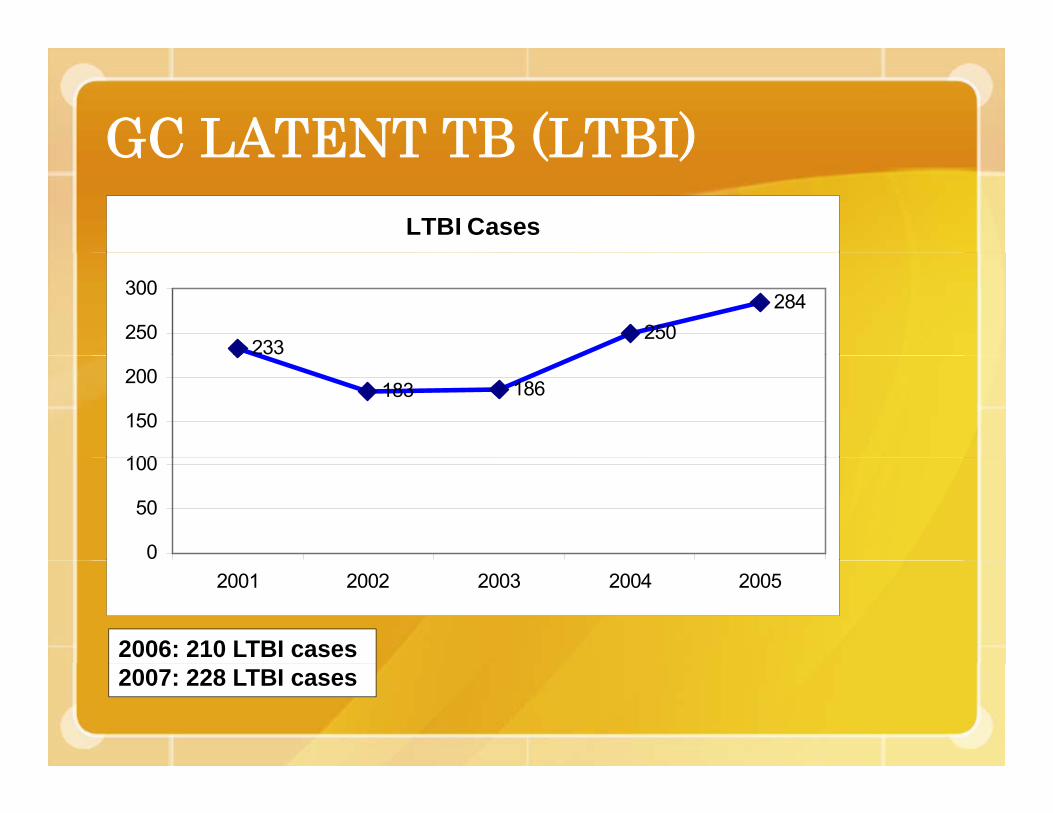
GC LATENT TB (LTBI)GC LATENT TB (LTBI)LTBI Cases
233250
284250
300
183 186
100
150
200
0
50
100
2001 2002 2003 2004 2005
2006: 210 LTBI cases 2007: 228 LTBI cases
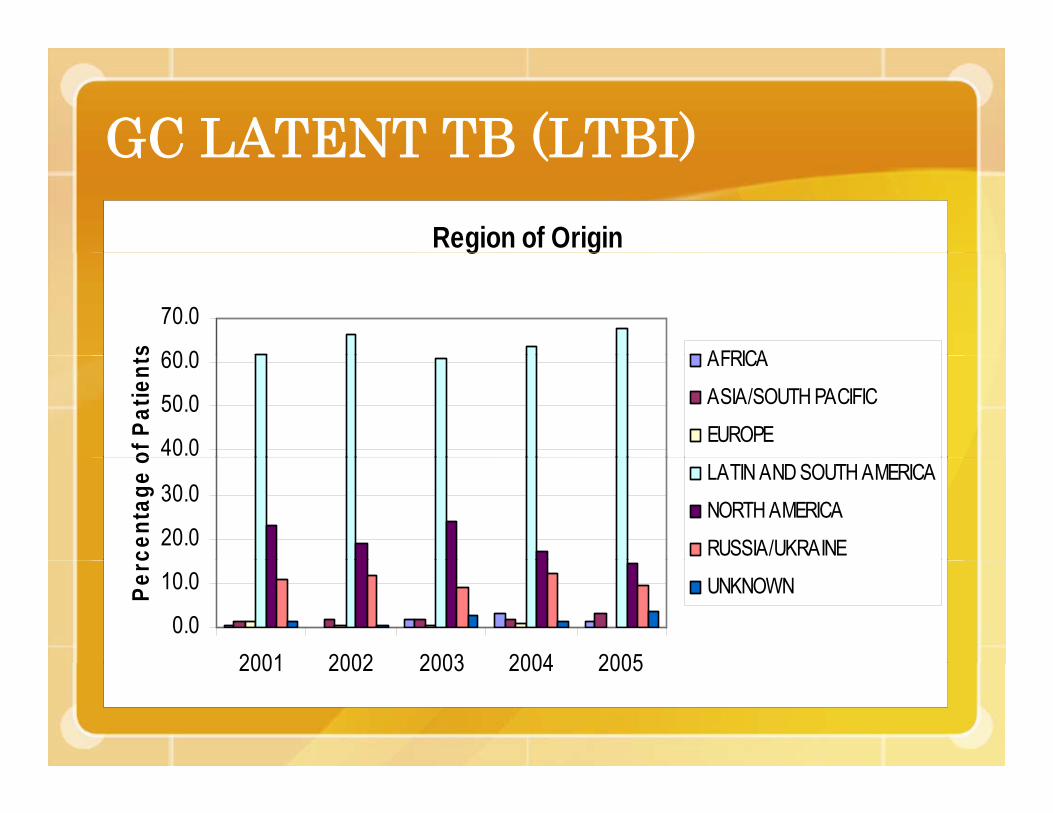
GC LATENT TB (LTBI)Region of Origin
GC LATENT TB (LTBI)g g
60 0
70.0
s AFRICA
40.0
50.0
60.0
of P
atie
nts AFRICA
ASIA/SOUTH PACIFIC
EUROPE
20.0
30.0
cent
age
o
LATIN AND SOUTH AMERICA
NORTH AMERICA
RUSSIA/UKRAINE
0.0
10.0
2001 2002 2003 2004 2005
Perc
UNKNOWN
2001 2002 2003 2004 2005
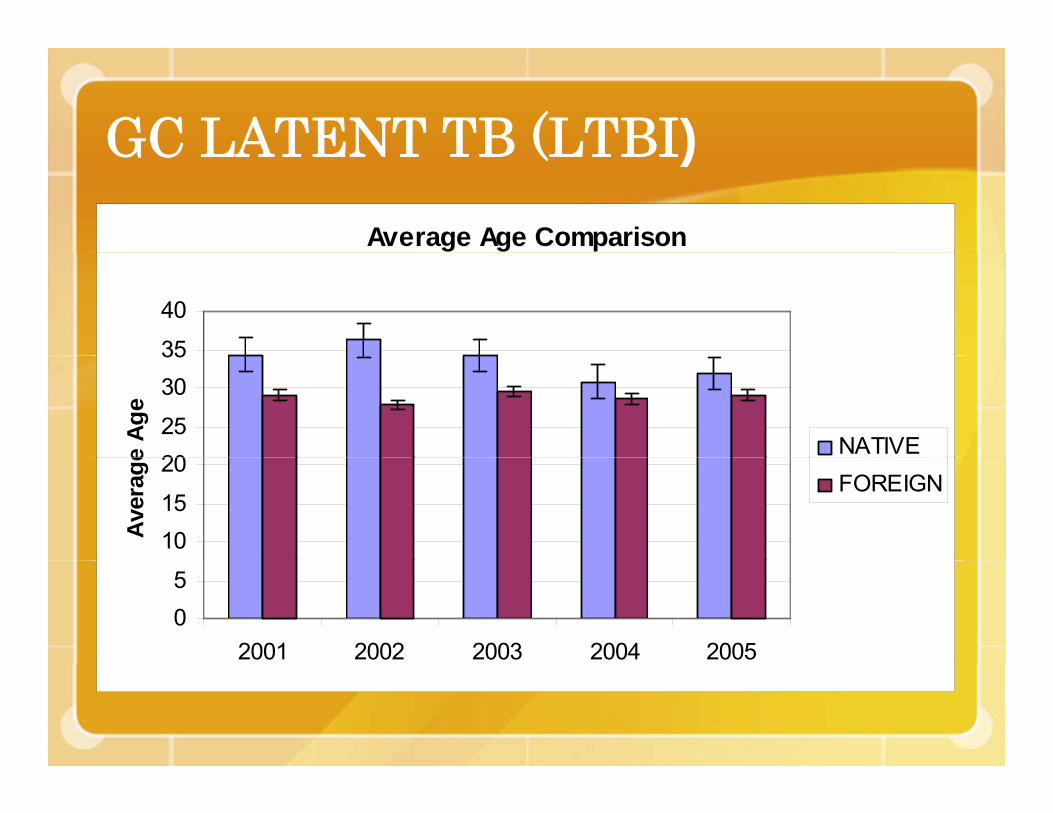
GC LATENT TB (LTBI)Average Age Comparison
GC LATENT TB (LTBI)
35
40
2025
3035
e Ag
e
NATIVE
1015
20
Ave
rage
FOREIGN
05
2001 2002 2003 2004 2005
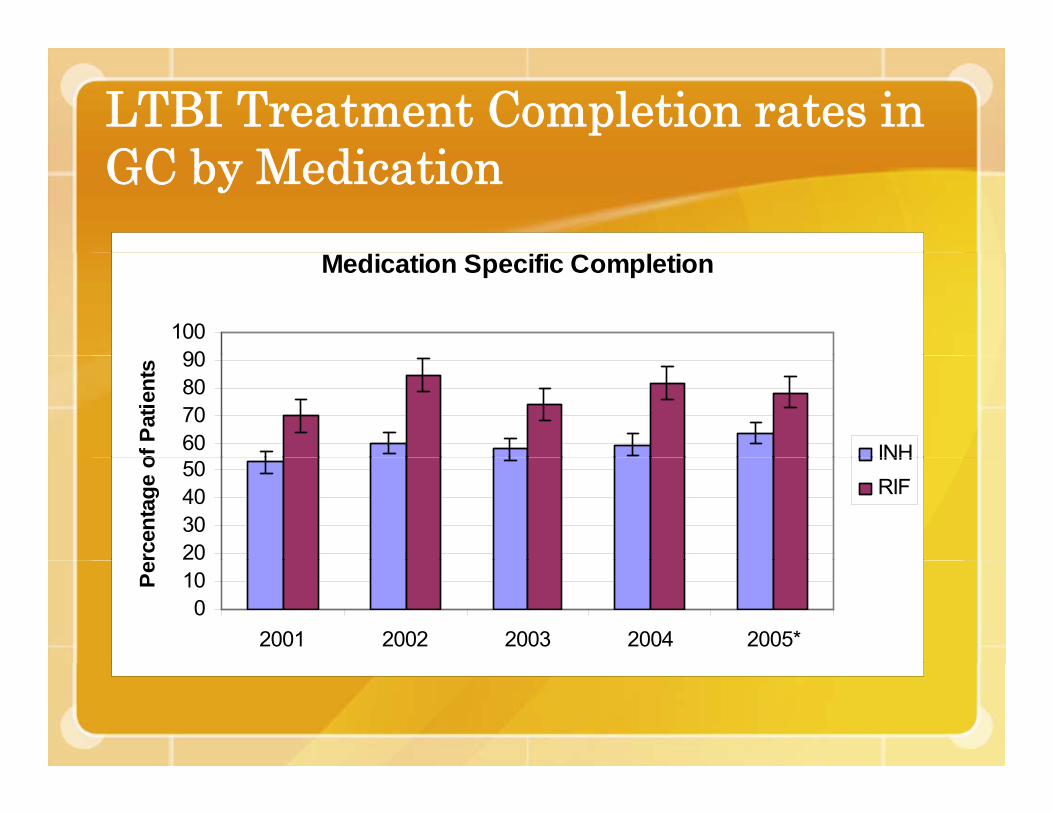
LTBI Treatment Completion rates in GC b M di iGC by Medication
Medication Specific Completion
90100
60708090
of P
atie
nts
INH
20304050
rcen
tage
o
INHRIF
010
2001 2002 2003 2004 2005*
Pe

Completion Rates for LTBI in GC by p yCountry of Origin
Foreign Born vs. Native Born Recommendation Completion
65 0
55.0
60.0
65.0
ge
45.0
50.0
Perc
enta
g
FOREIGN BORN
NATIVE BORN
35.0
40.0
2001 2002 2003 2004 2005*

ANIMAL BITES /VECTOR CTRLANIMAL BITES /VECTOR CTRL.YEAR Cases PEP Animals tested
(bites) recommended (bats, cats, skunks, dogs, etc.)
2006 145 1 82006 145 1 82007 116 8 8 TOTAL 261 9 16TOTAL 261 9 16
• There are no known rabies cases in humans or animals in Grant Co.• There was a cat rabies case in Walla Walla in 2002.• Any bat exposures = PEP if not available for testing.• Any raccoon or other wild terrestrial carnivore = PEP if not available.• Therefore, DON’T MESS WITH BATS, RACOONS, etc. (and Texas).

Healthcare Professionals’ RoleHealthcare Professionals Role• TIMELY REPORTING
immediate VS. within 3 days VS. later (consult the list of notifiable conditions: htt // d h /N tifhttp://www.doh.wa.gov/Notify
• PROPER TEST SELECTION CDC l b t d fi iti it iCDC laboratory definition criteria: IgM for hep A, etc.
• PROPER TREATMENT• PROPER TREATMENT Health Officer DirectiveCDC /ACIP AAP Red BookCDC /ACIP, AAP Red Book

NEED YOUR HELPNEED YOUR HELP

2008-2010 CHALLENGES2008 2010 CHALLENGES• Department of Health submitted three
f t th l i l tperformance measures to the legislature:• #1 INCREASE USE OF UNDERUTILIZED
VACCINES (i DT P Td di FLU VZV)VACCINES (i.e DTaP, Tdap, pedi FLU, VZV)plus INCREASE PARTICIPATION AND USE OF CHILD PROFILE®CHILD PROFILE®
• #2 IMPROVE TIMELY AND COMPLETE REPORTING, INVESTIGATION OFREPORTING, INVESTIGATION OF NOTIFIABLE CONDITIONS
• #3 COMMUNITY OBESITY INTERVENTIONS#3 COMMUNITY OBESITY INTERVENTIONS

• Chlamydia—Chlamydiareported disease (15-24; per 100K)
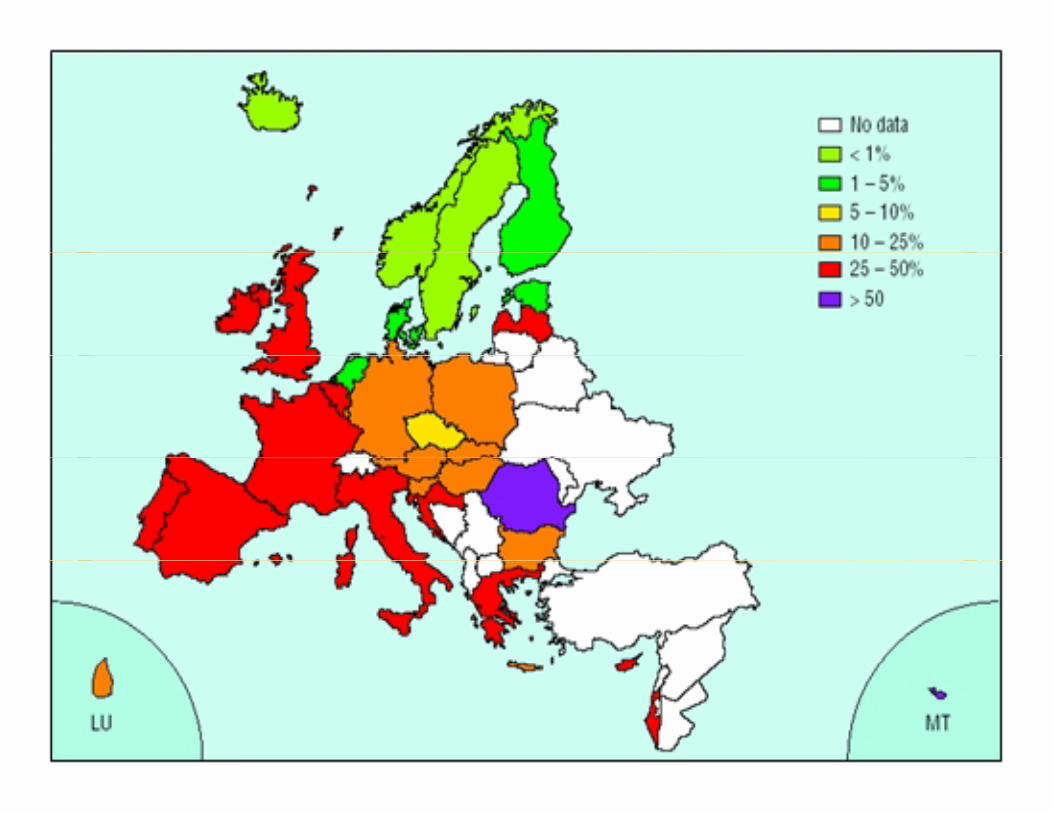
Grant: 2,083Adams: 1,994Yakima: 3,435Lincoln: 824SE Asia: 4,289 EU: ~522

• Chlamydia-Chlamydiatreated (15-24)
Grant: 92%Adams: 77%SKi 96%SKing: 96%

I fl• Influenza Vaccine (>65)
Grant: 63%Adams 65%Jefferson: 78%Germany: 60%
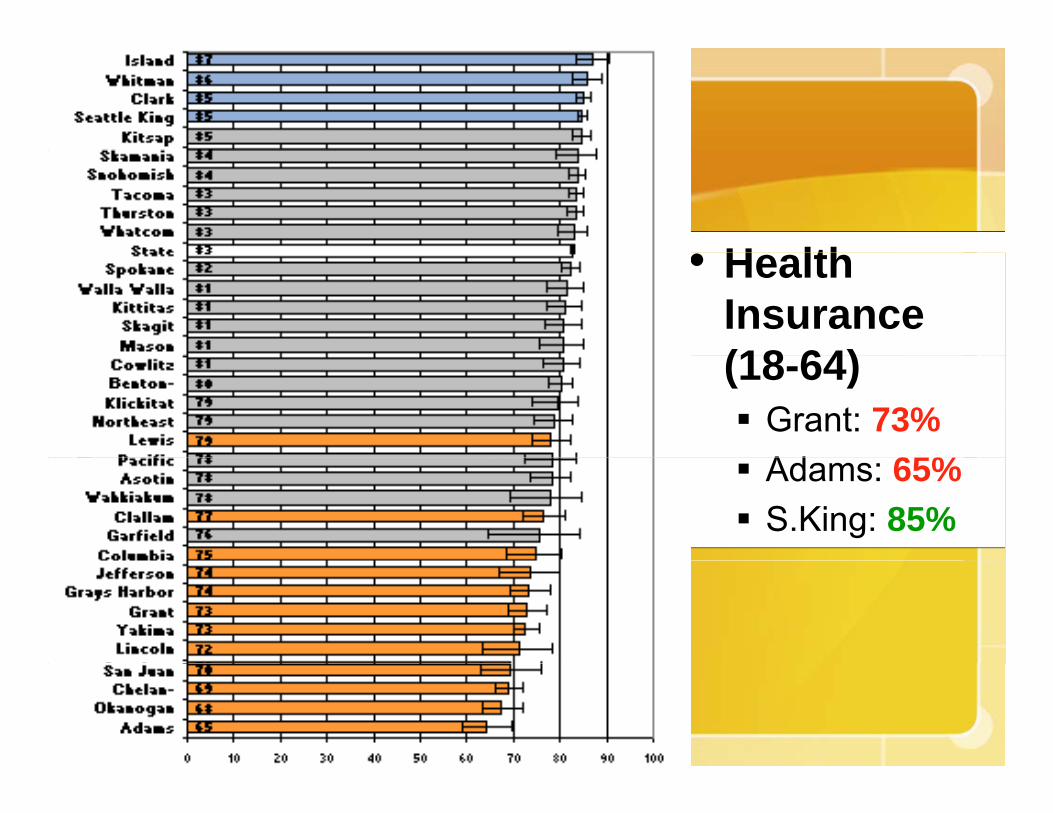
H lth• Health Insurance (18 64)(18-64)
Grant: 73%Ad 65%Adams: 65%S.King: 85%

• Adult• Adult Overweight /Obese/Obese
Grant: 67%Adams: 71%San Juan: 51%Ireland: 57%

Ph i l• Physical Exercise(>18)(>18)
Grant: 61%Adams: 64%Adams: 64%S. Juan: 75%

• Di b t (>18)• Diabetes (>18)Grant: 9%Adams: 10%SKing: 6%S. Juan: 3%India: 6%
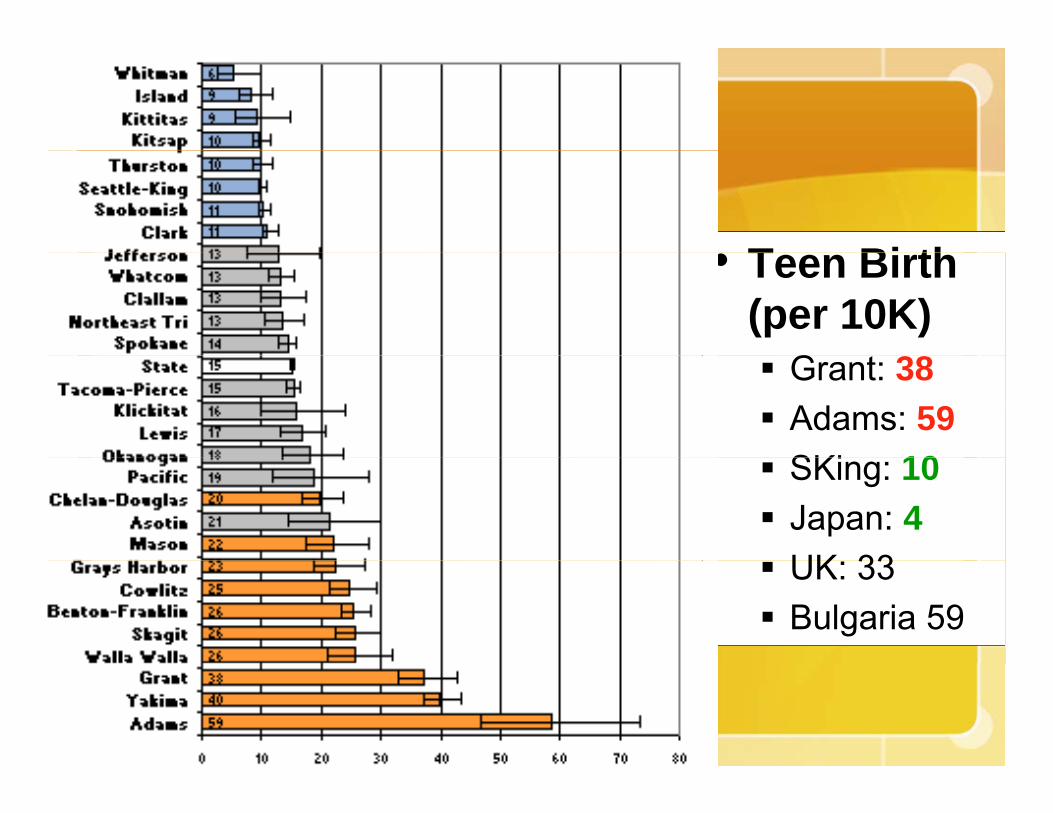
T Bi th• Teen Birth (per 10K)
G 38Grant: 38Adams: 59SKi 10SKing: 10Japan: 4UK 33UK: 33Bulgaria 59

• PEDI Un-intentionalintentional Injury (per 100K)(per 100K)
Grant: 290Adams: 260Adams: 260Island: 155C-Doug: 160gS.Korea: 256UK: 61

C l t l CA• Colorectal CA screen (>50; FOB d )FOB or endo)
Grant: 53%Adams: 53%Whitman: 67%
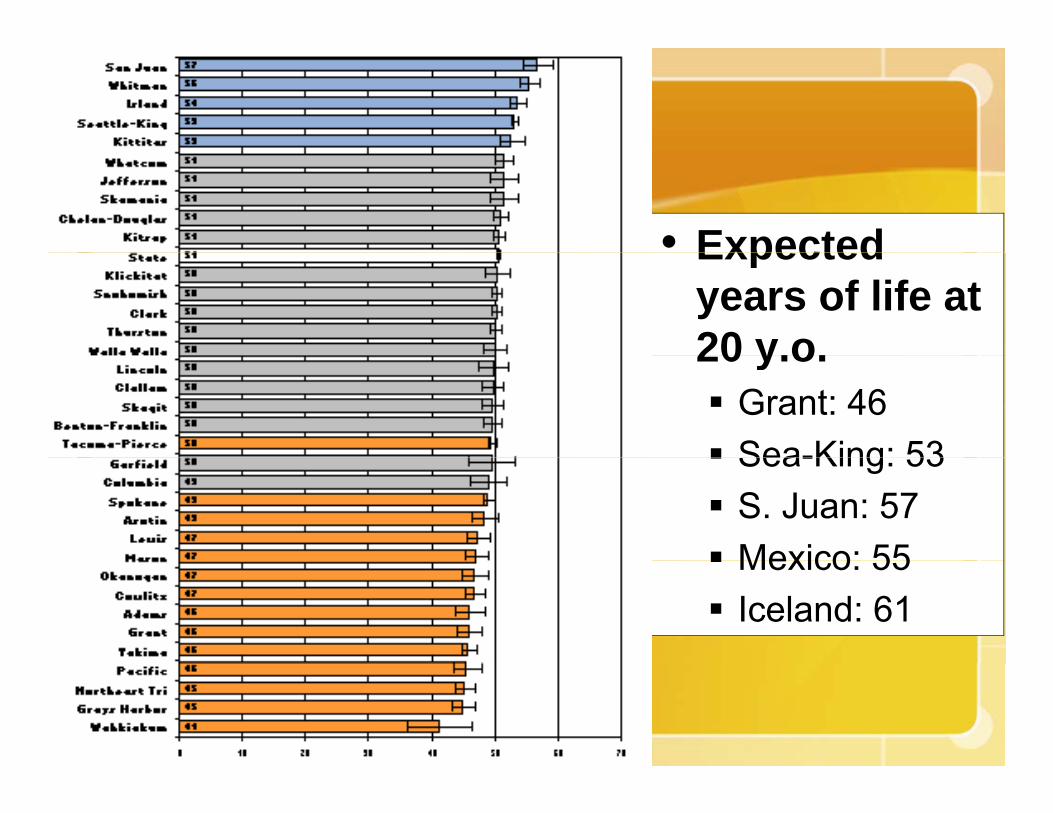
• ExpectedExpected years of life at 20 y o20 y.o.
Grant: 46Sea-King: 53Sea-King: 53S. Juan: 57Mexico: 55Mexico: 55Iceland: 61
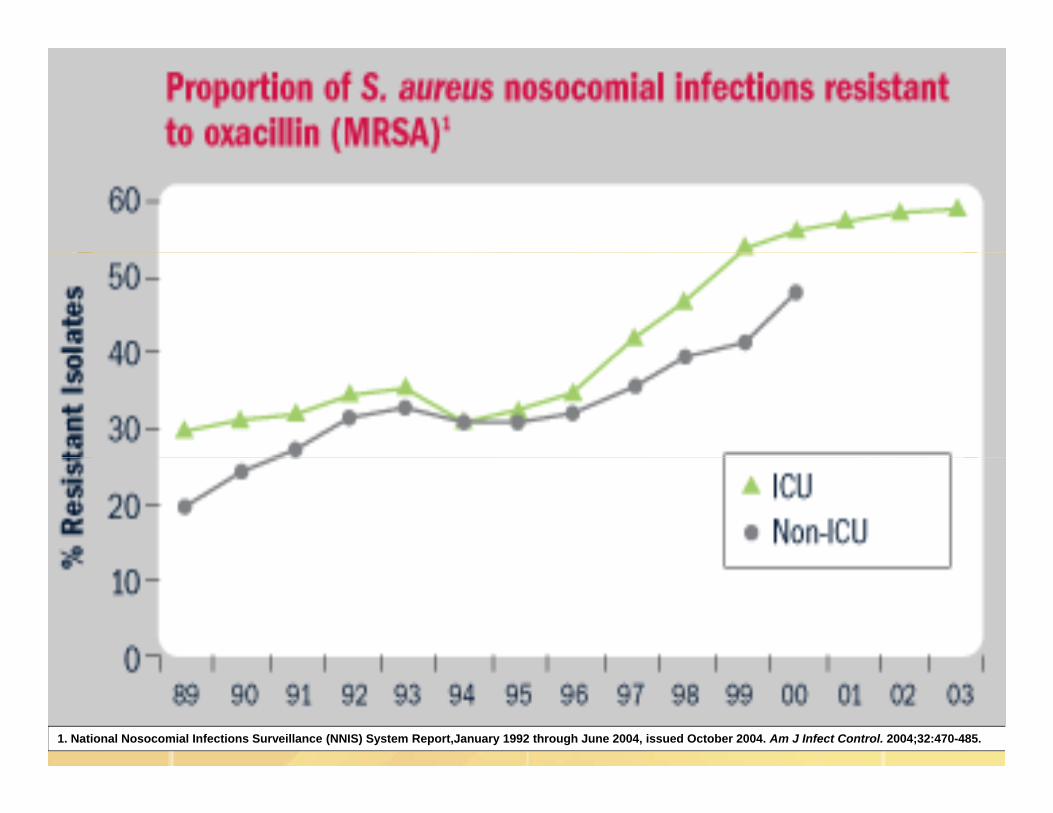
1. National Nosocomial Infections Surveillance (NNIS) System Report,January 1992 through June 2004, issued October 2004. Am J Infect Control. 2004;32:470-485.

Community MRSA (CA-MRSA)y ( )• Distinct and genetically different S. aureus.
I L A CA MRSA th t• In L.A., CA-MRSA was the most common cause of skin infections coming seen in emergency rooms.rooms.
• A Houston study demonstrated that CA-MRSA accounted for 56% in 2000-2001, 57% in 2002 and 78% in 2003 of in hospitalized children.
• 2007 random sample of HEALTHY individuals (Chicago): 4% MRSA colonization (carriers)(Chicago): 4% MRSA colonization (carriers).
• Estimated overall U.S. MRSA carriers: 2.6%; healthcare: 4.6%healthcare: 4.6%
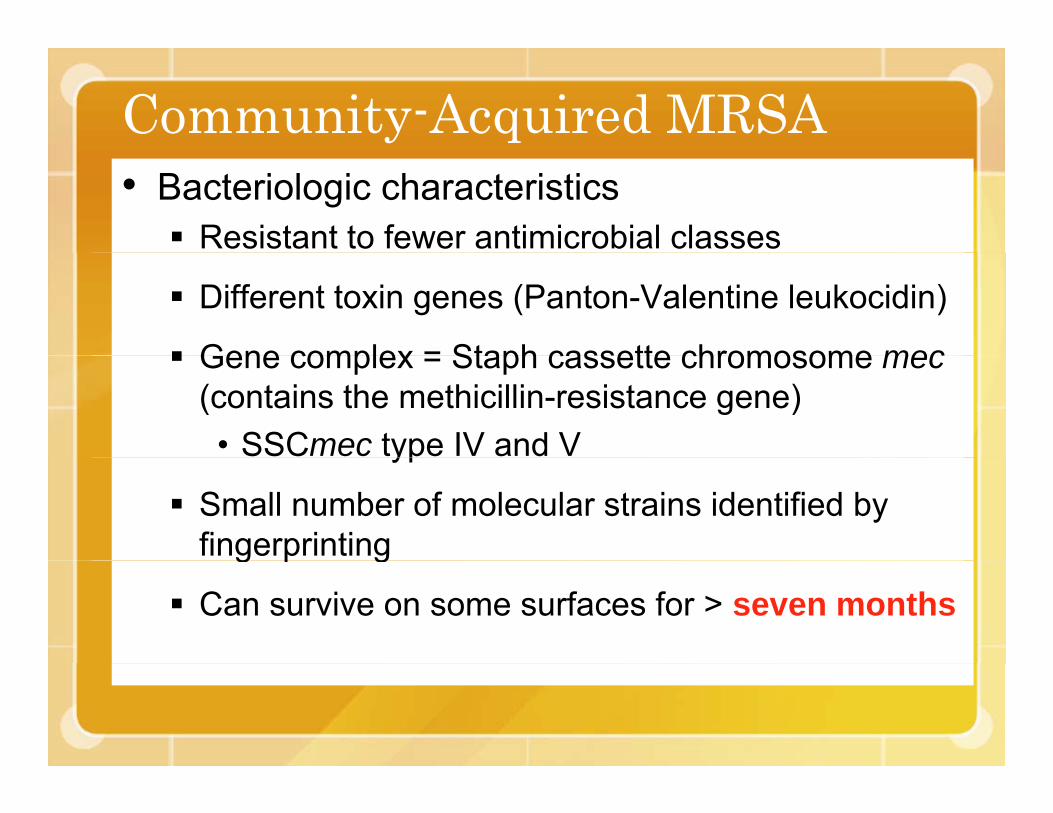
Community-Acquired MRSA• Bacteriologic characteristics
Resistant to fewer antimicrobial classes
Different toxin genes (Panton-Valentine leukocidin)
Gene complex = Staph cassette chromosome mecGene complex = Staph cassette chromosome mec(contains the methicillin-resistance gene)• SSCmec type IV and Vyp
Small number of molecular strains identified by fingerprintingg p g
Can survive on some surfaces for > seven months
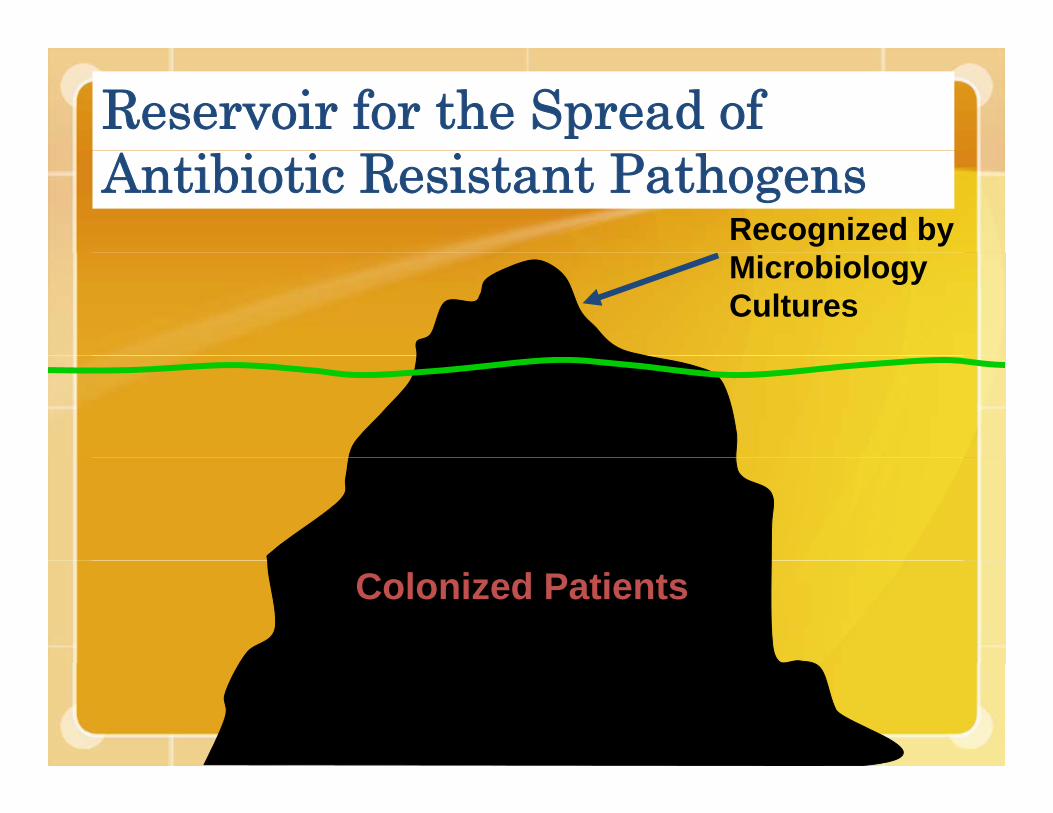
Reservoir for the Spread of Antibiotic Resistant Pathogens
Recognized by Microbiology Cultures
Colonized Patients

Prevalence of MRSA as cause of SSTI in Adult ED Patients – EMERGEncy ID Net, Moran GJ, et al, SAEM 2005
54% 39%15%15%
55%
51% 60% 60%
74%68%
60%
67%
72%
Slide courtesy of Rachel Gorwitz and Greg Moran

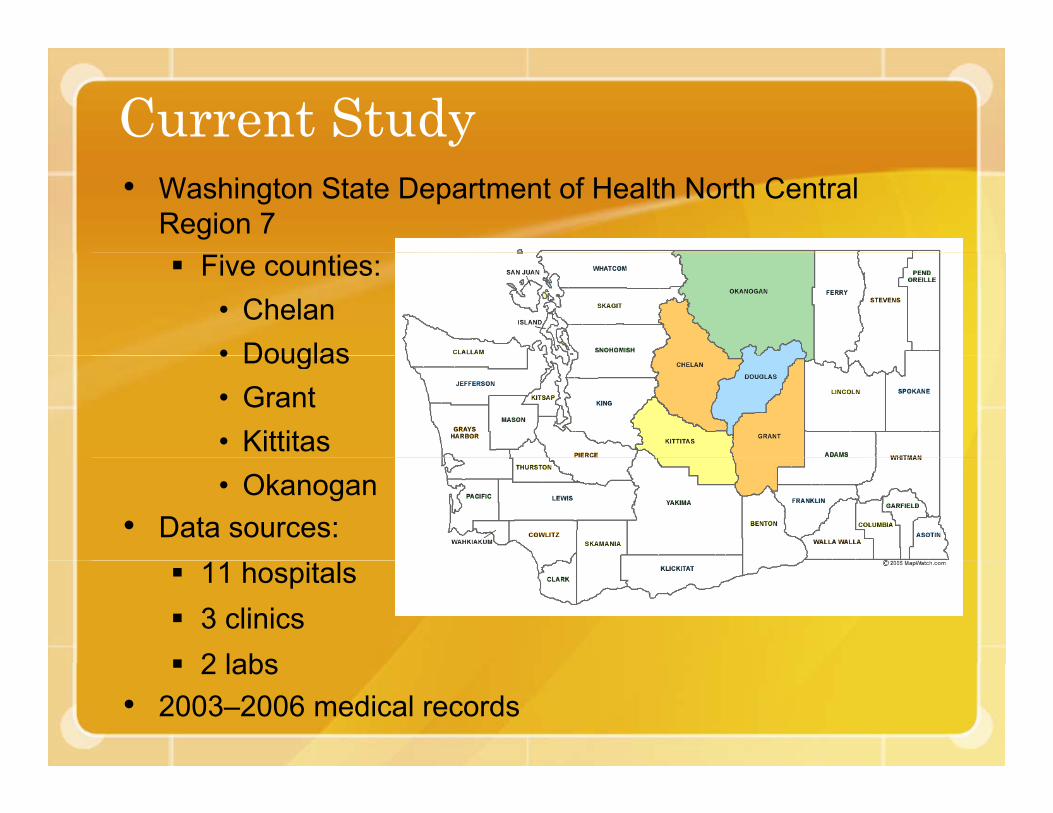
Current Study• Washington State Department of Health North Central
Region 7Five counties:
• Chelan• Douglas• Douglas• Grant• Kittitas• Okanogan
• Data sources:11 hospitals3 clinics2 labs2 labs
• 2003–2006 medical records
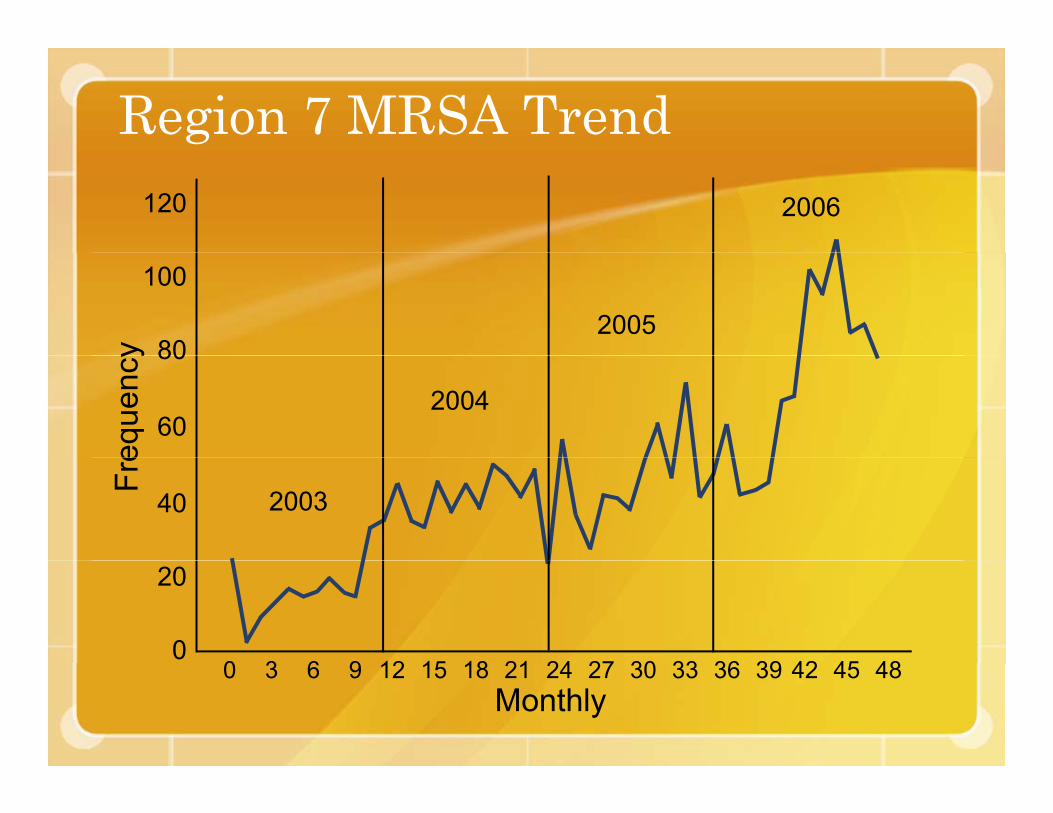
Region 7 MRSA Trend120 2006
100
80y
200580
60
eque
ncy
2004
40
Fre
2003
20
00 3 6 9 12 15 18 21 24 27 30 33 36 39 42 45 48
Monthly0 3 6 9 12 15 18 21 24 27 30 33 36 39 42 45 48
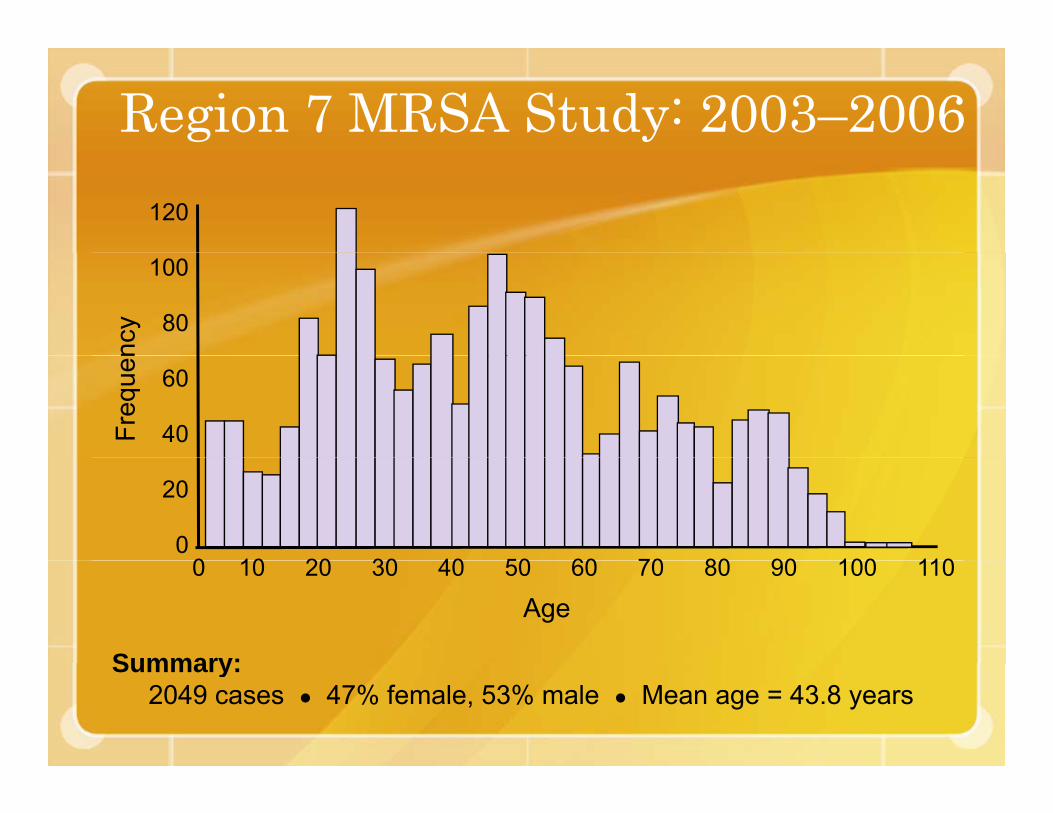
Region 7 MRSA Study: 2003–2006120
ncy
100
80
Freq
uen
60
40
20
00 10 20 30 40 50 60 70 80 90 100 110
Summary:
0 10 20 30 40 50 60 70 80 90 100 110
Age
Summary:2049 cases ● 47% female, 53% male ● Mean age = 43.8 years
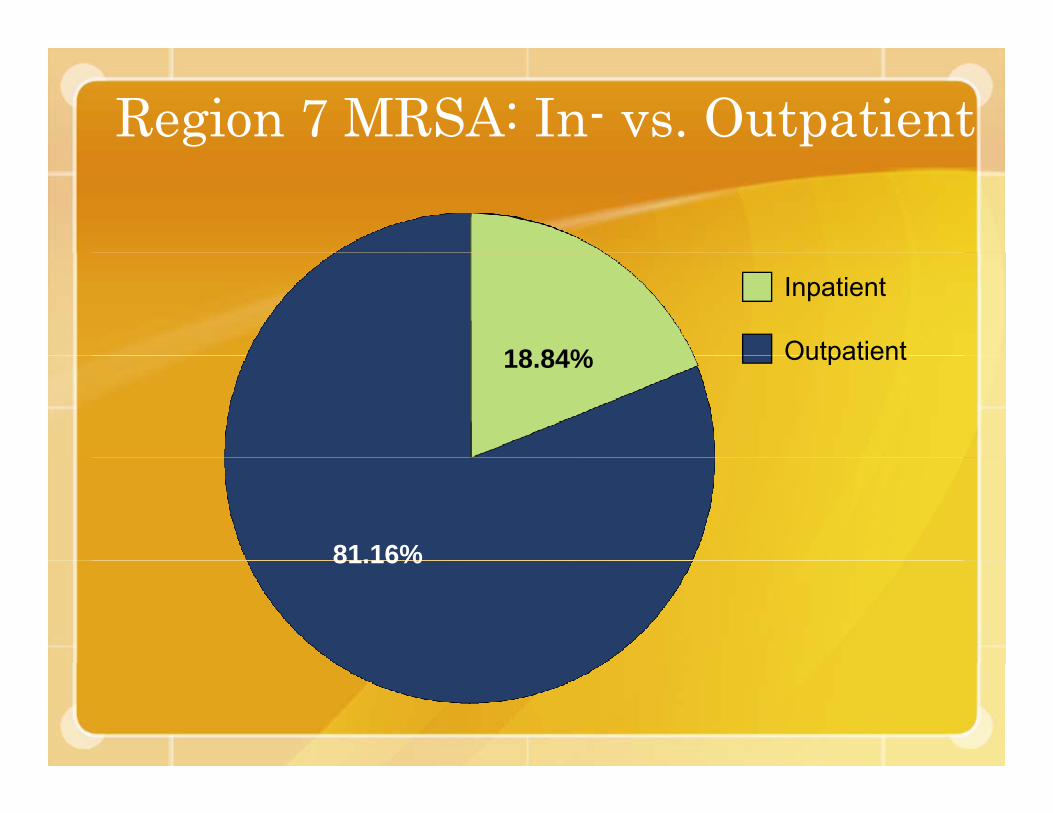
Region 7 MRSA: In- vs. Outpatient
18 84%
Inpatient
Outpatient18.84% Outpatient
81.16%81.16%

Region 7 MRSA: In- vs. Outpatient b Aby Age
150
G
100es
Age Groups
Children (0–10)
100
er o
f Cas
e
Adolescents (11–20)
Young adults
50Num
be
g(21–40)
Mid adults (41–60)
0
( )
Older adults (60+)
0Inpatient Outpatient
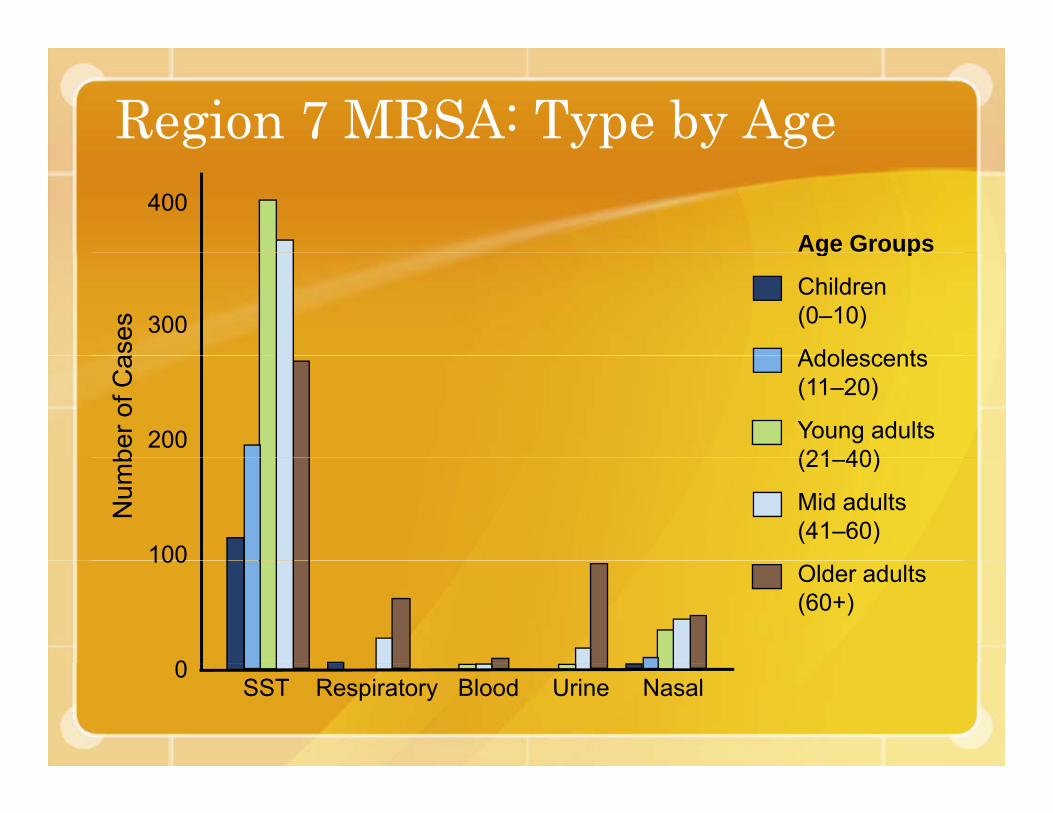
Region 7 MRSA: Type by Age400
Age Groups
ases 300
g p
Children(0–10)
Adolescents
ber o
f Ca
200
Adolescents (11–20)
Young adults (21 40)
Num
b
100
(21–40)
Mid adults (41–60)
100
0
Older adults (60+)
SST Respiratory Blood Urine Nasal0
Antibiotic Resistance
“Awareness of local resistance patterns more important than categorizing community vs. hospital-acquired MRSA.”
CDC publication: Strategies for Clinical Management of MRSA in the Community
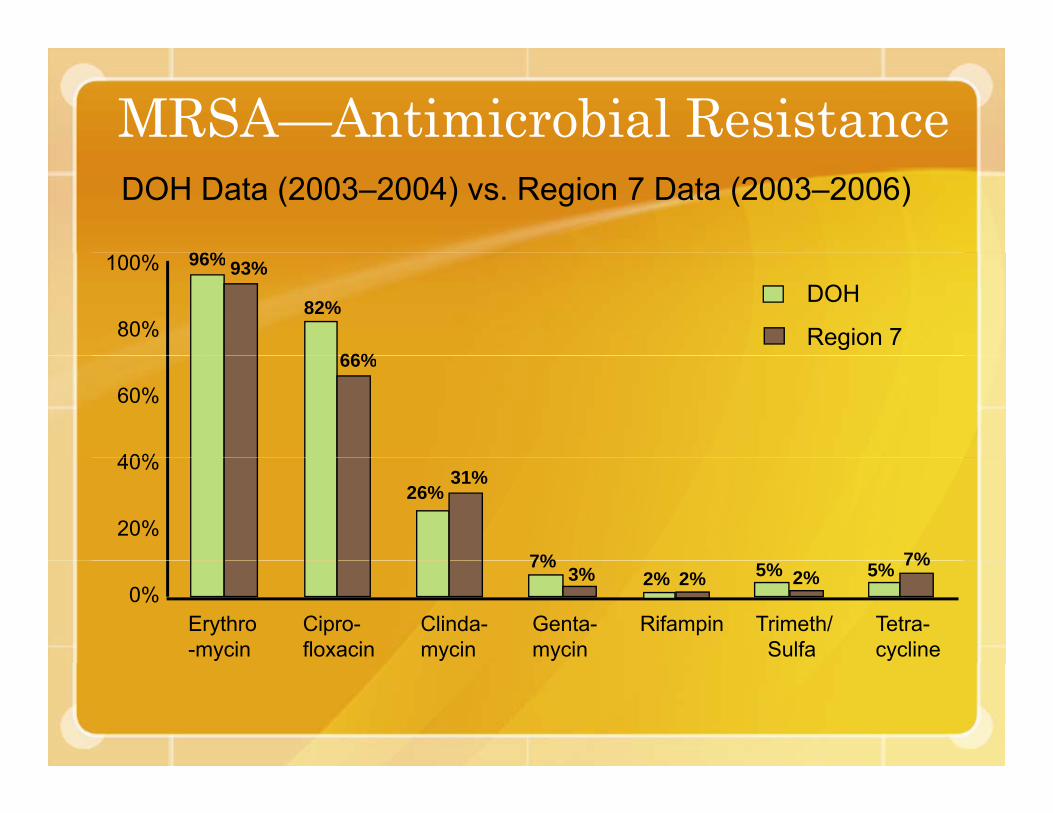
MRSA—Antimicrobial ResistanceDOH Data (2003–2004) vs. Region 7 Data (2003–2006)
96%
DOH
Region 7
100%
80%
96% 93%
82%
66%
60%
40%
66%
40%
20%
26%31%
7% 7%
Tetra-cycline
Trimeth/Sulfa
0%7%
3% 2% 2% 2%5% 5% 7%
Erythro-mycin
Cipro-floxacin
Clinda-mycin
Genta-mycin
Rifampin

Region 7: Multiple MRSA Infections
200Multiple Infections
171200
160
120
80Cas
es
34
7 3 240
002 3 4 5 >5
Number of Infections
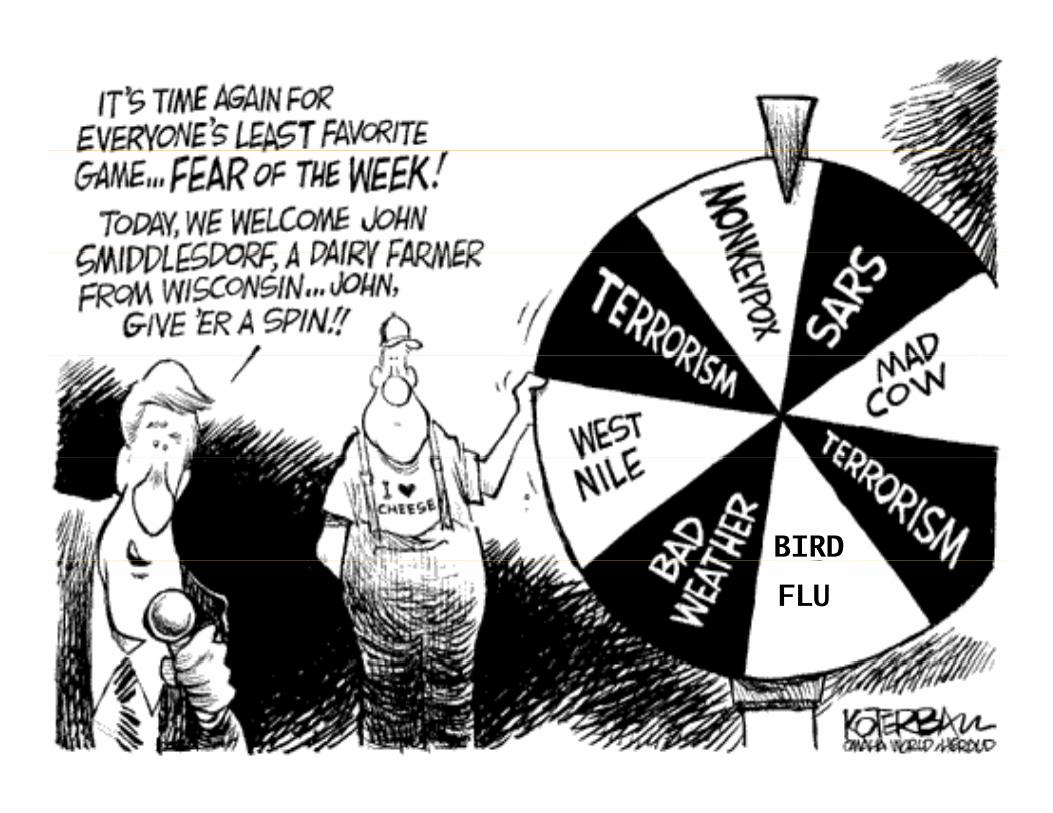
BIRD
FLU

PANDEMIC ANDPANDEMIC AND ALL-HAZARDS
PREPAREDNESS
World’sBestBest Places
*DHHS, 2006
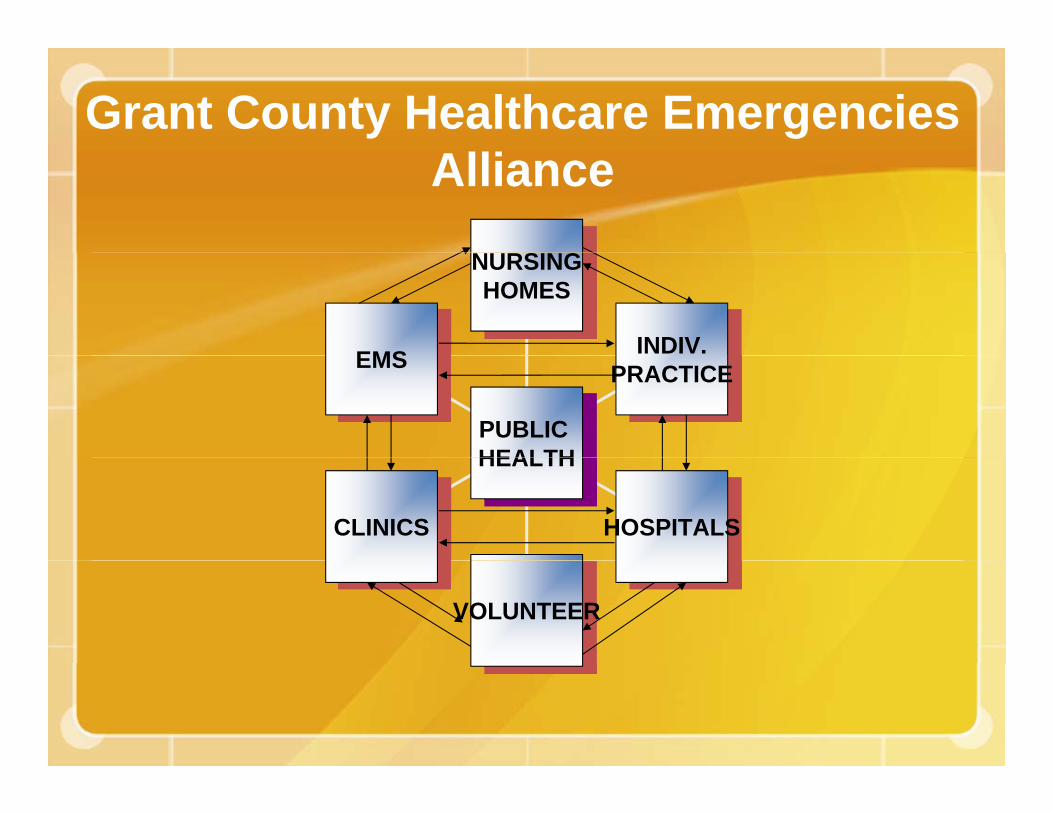
Grant County Healthcare Emergencies Alliance
NURSINGNURSINGHOMES
INDIV.EMS PRACTICEEMS
PUBLIC HEALTH
HOSPITALSCLINICS
HEALTH
VOLUNTEER
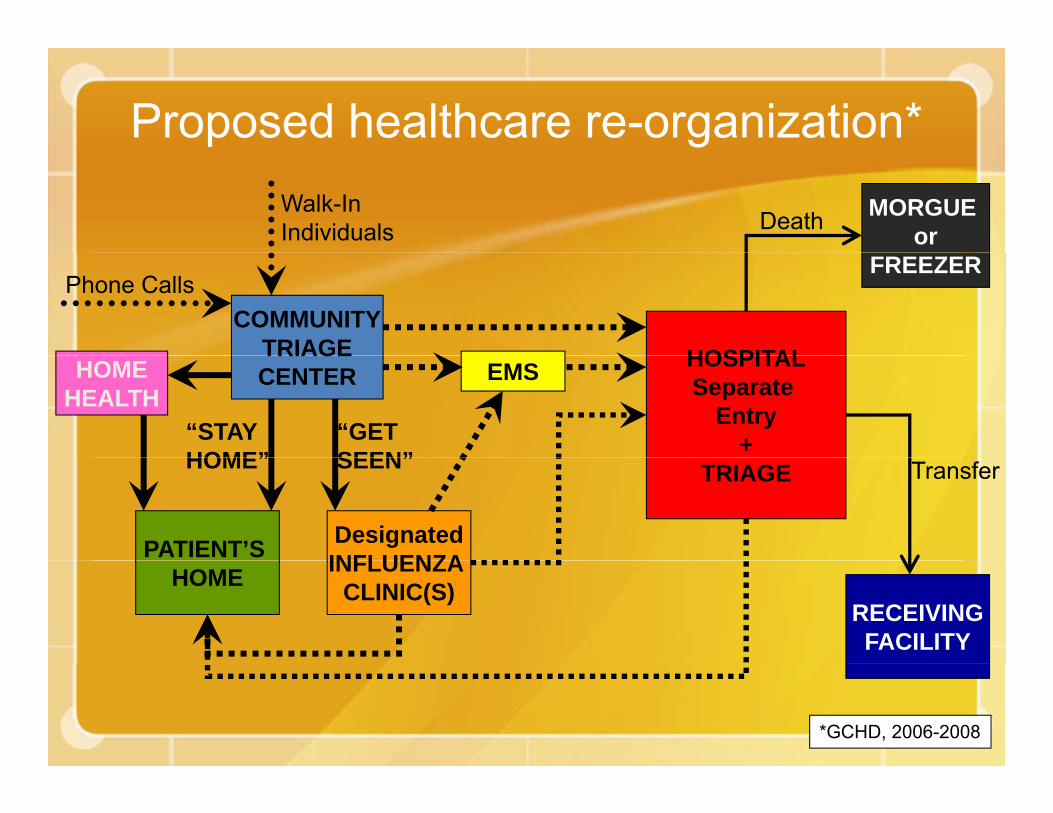
Proposed healthcare re-organization* Walk-In Individuals
MORGUE orDeath
COMMUNITYTRIAGE
Phone Calls
HOSPITAL
FREEZER
TRIAGECENTER
“STAY HOME”
“GET SEEN”
HOSPITALSeparate
Entry+
EMSHOMEHEALTH
PATIENT’S
HOME”
DesignatedINFLUENZA
SEEN” TRIAGE Transfer
HOME INFLUENZA CLINIC(S)
RECEIVINGFACILITY
*GCHD, 2006-2008

NORTH COUNTY TRIAGE (GRAND COULEE)
GRAND COULEE 1.7KELECTRIC CITY 1KHARTLINE 0.25KFORDAIRPOP. 3,000+
EPHRATA 10KCOULEE CITY 1.2KGRANT ORCHARDS LAKEVIEW PARK¼ ROYAL CITY 1K )
EPHRATA
,SOAP LAKE 4KSTRATFORD 0.05KWILSON CREEK 0.3KPOP. 16,550 GRANT COUNTY PROPOSED
TRIAGE SUBDIVISIONSEPHRATA AREATRIAGE(EPHRATA)
CRESCENT BARGEORGE 0.7KQUINCY 12KTRINIDADVANTAGE
TRIAGE SUBDIVISIONS
MOSES LAKE AREA TRIAGE(MOSES L.)QUINCY
AREA
MARLIN/RUFF/KRUPP 0.35KMcDONALDMOSES LAKE 32.5K1/3 ROYAL CITY 1.34kSTRATFORD 0.051KSAND DUNES
WINCHESTERPOP. 12,700+ EPHRATA
TRIAGE(QUINCY)
SAND DUNESWILSON CREEK 0.3KWARDEN 4KWHEELERPOP. 38,541+
SOUTH COUNTY TRIAGE
BEVERLY 0.6KCRAB RIVERDESERT AIRE
TRIAGE (MATTAWA)
MATTAWA 10K (EST.)¼ ROYAL CITY 1KSCHAWANASMYRNAEST. POP. 11,600+
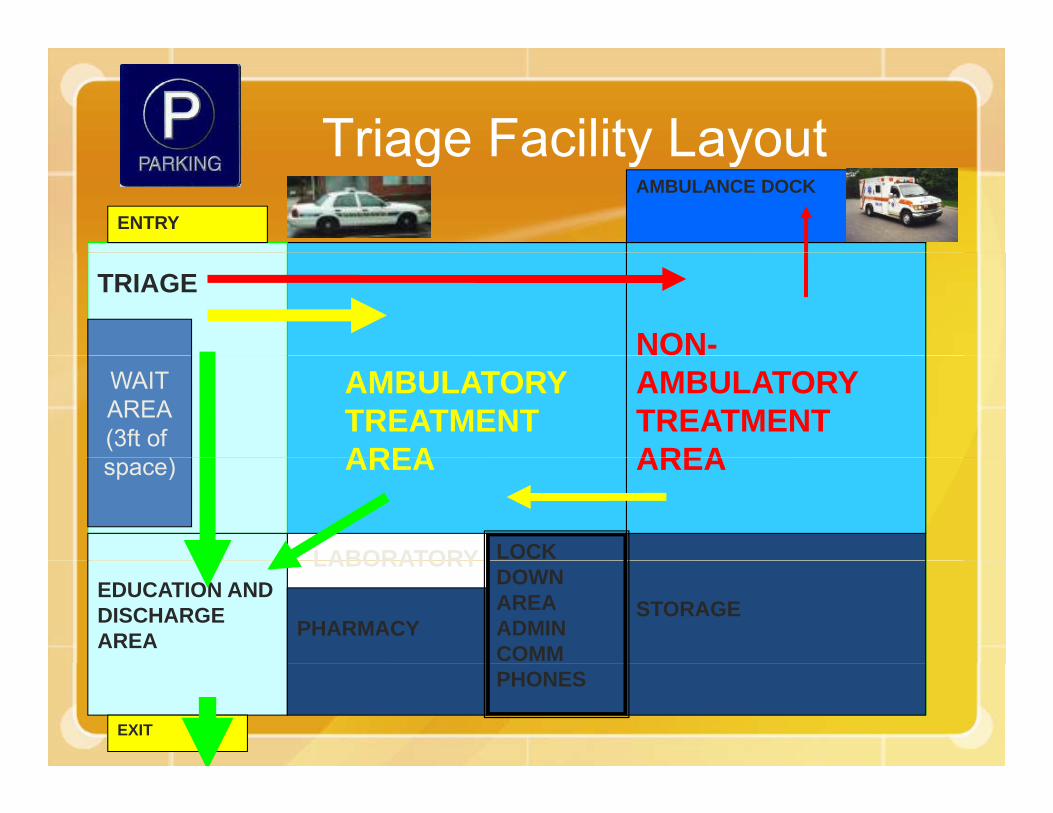
Triage Facility LayoutTriage Facility LayoutAMBULANCE DOCK
ENTRY
TRIAGE
NON-AMBULATORYTREATMENT AREA
AMBULATORY TREATMENTAREA
WAITAREA(3ft of
) AREA AREA
LOCK
space)
LABORATORY
STORAGEEDUCATION AND DISCHARGE AREA PHARMACY
DOWNAREAADMINCOMM
LABORATORY
PHONES
EXIT

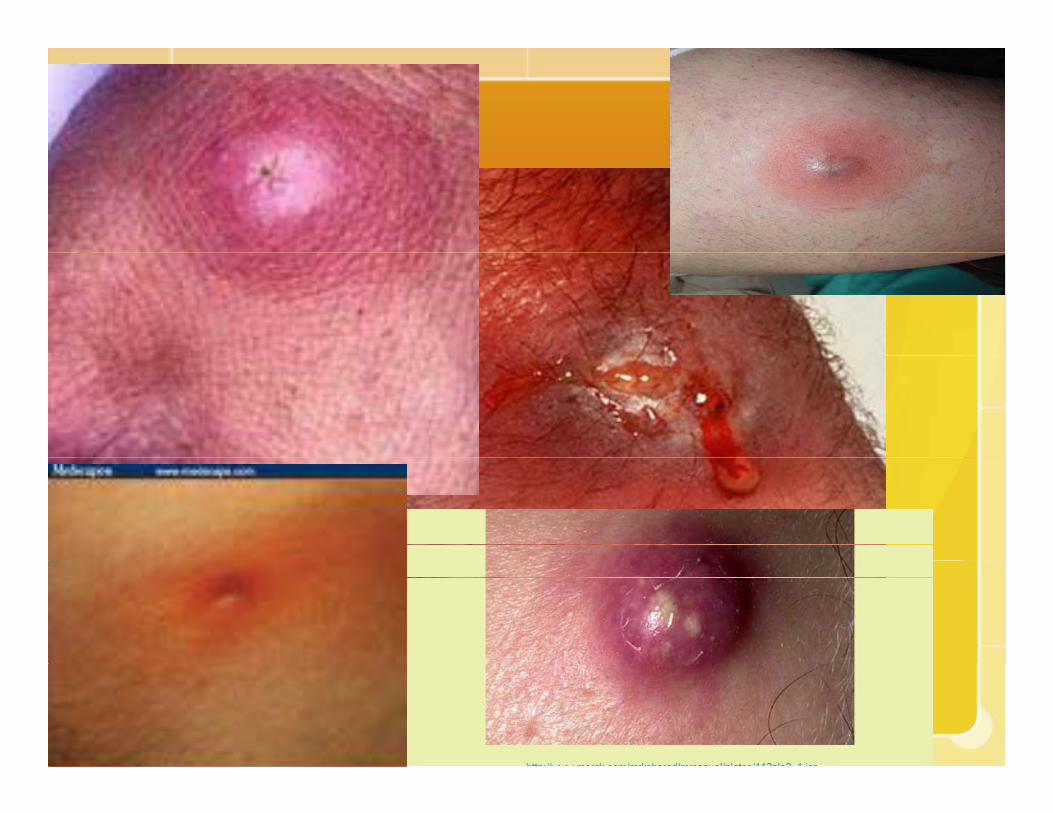
Spectrum of Disease• Fever• >80% skin and soft tissue
infection (SSTI)AbscessesFurunclesFurunclesCarbunclesCellulitisCellulitis
• Local swelling, redness, heatP i f l l i i l ith• Painful lesion or pimple with or without drainage
• Misdiagnosed as spider bites• Misdiagnosed as spider bites
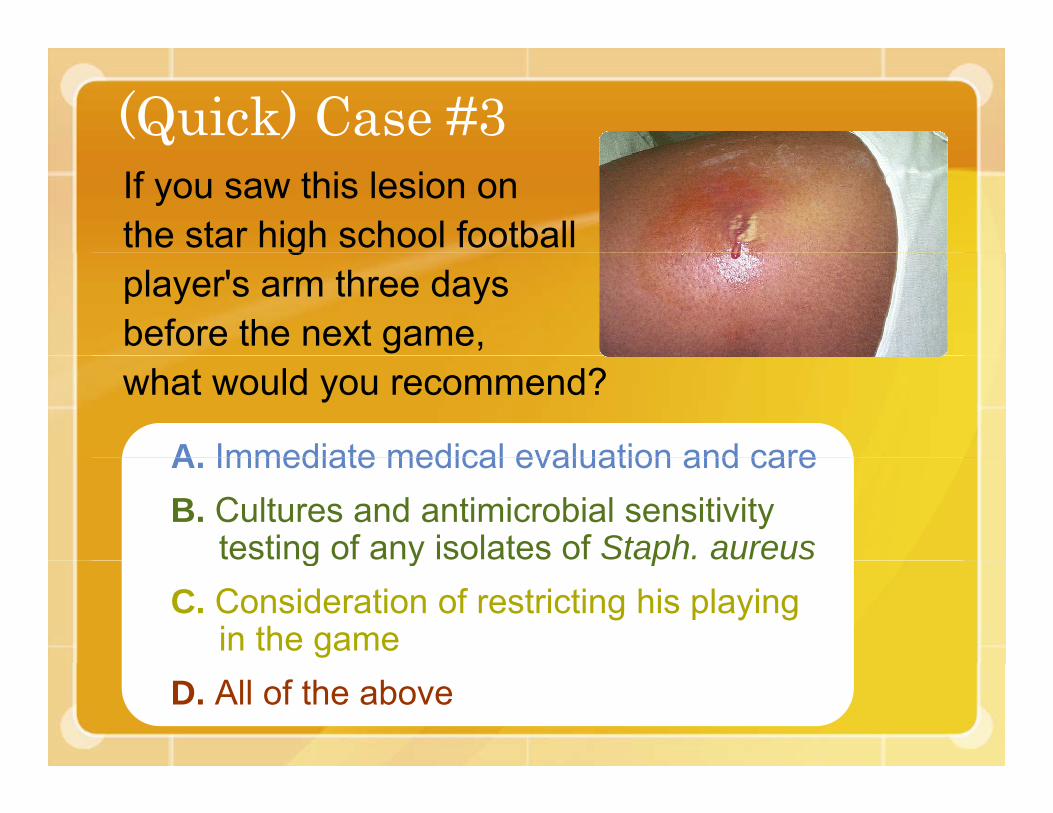
(Quick) Case #3If you saw this lesion on the star high school football gplayer's arm three days before the next game, what would you recommend?
A Immediate medical evaluation and careA. Immediate medical evaluation and careB. Cultures and antimicrobial sensitivity
testing of any isolates of Staph. aureusg y pC. Consideration of restricting his playing
in the gameD. All of the above
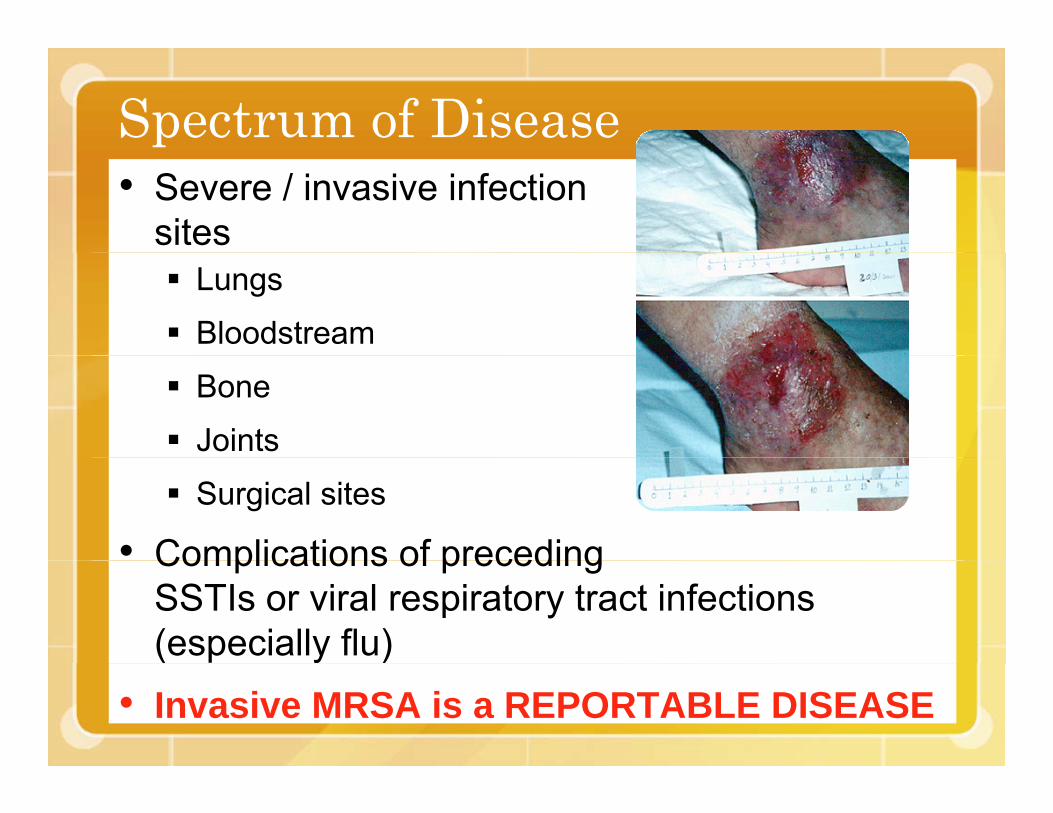
Spectrum of Disease• Severe / invasive infection
sitesLungs
Bloodstream
Bone
Joints
Surgical sites
• Complications of precedingComplications of preceding SSTIs or viral respiratory tract infections (especially flu)( y )
• Invasive MRSA is a REPORTABLE DISEASE
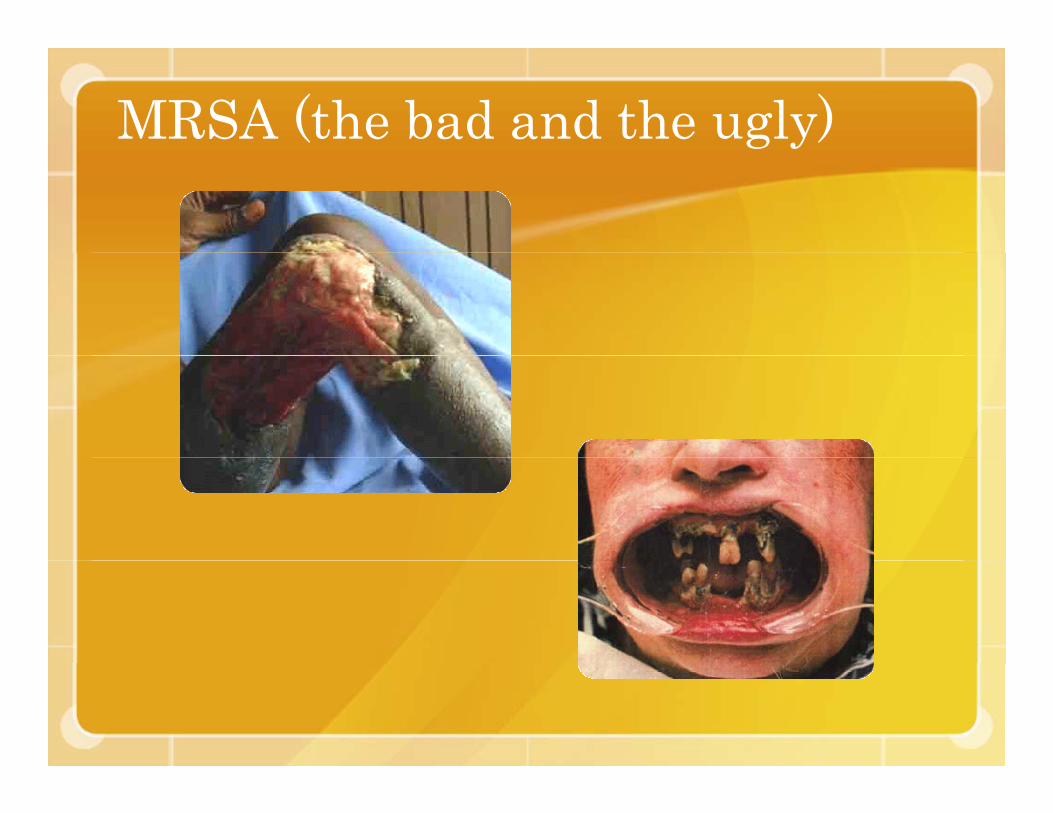
MRSA (the bad and the ugly)
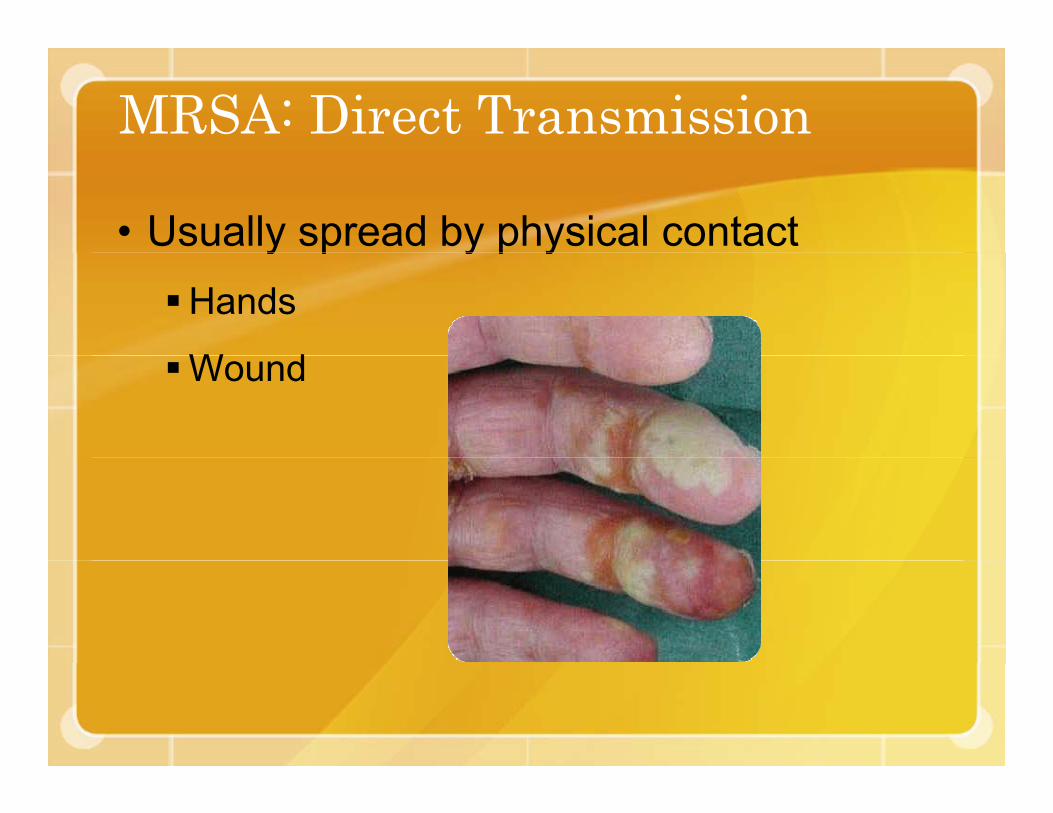
MRSA: Direct Transmission
• Usually spread by physical contact y p y p yHands
W dWound

MRSA: Indirect TransmissionTouching of contaminated objects
• SheetsSheets
• Towels
• Clothes
• EquipmentEquipment
• Dressings
• Bar soap
• Personal items (ex: razor)( )

Community-Acquired MRSA• Rapid emergence of CA-MRSA
• Patients presenting to emergency departments• Patients presenting to emergency departmentsor clinics in increasing numbers
• Epidemiological definition• Epidemiological definitionOnset in the community
• No recent hospitalization• No recent hospitalization• No out-patient surgery• No residence in long-term care facilityNo residence in long term care facility• No dialysis• No invasive medical devices

Colonization• Nasal colonization = 0.8% (non-institutionalized
individuals)
• Few data on the association between MRSA colonization and infection in the community
• MRSA colonization occurs:NosePhPharynxAxillaRectumRectumPerineum
• Nasal colonization not always present in individualsNasal colonization not always present in individuals with active MRSA infection
Colonization (cont.)• Few data on the effectiveness of decolonization
to prevent infection in the community or in p yfamilies.
• Healthcare: intranasal mupirocin can be effectiveHealthcare: intranasal mupirocin can be effective at eliminating colonization in the short term.
• Recolonization is common• Recolonization is common.
• Compliance is poor in community ttisetting.
• Resistance develops to topical and systemic agents.
Protect Yourself: Personal Hygiene• Wash hands thoroughly with soap and water.• Use alcohol-based hand gel (>62%) if soapUse alcohol based hand gel ( 62%) if soap
and water are not available.• Take regular baths or showers.g
• Do not share personal hygiene itemshygiene items.

If You Have MRSA: No Pools!
• Avoid whirlpools, hydrotherapy pools, cold tubs, swimming pools if you have an open wound
• Wash your hands!Wash your hands!

MRSA and Your Pet

Prevention Is Most Important
The single most important thing you can do to prevent the spread of disease:
WASH
YOURYOUR
HANDS!HANDS!
CA-MRSA in your communityC y y• 4.38 cases per 1000 (E-ta, ML) or about p ( )
1.5 to 2.8 cases per 1000 per year• Total cases under-reported plus otherTotal cases under reported plus other
labs not fully traceable = estimate 1/500 to 1/200 to cases (0 2%-0 5%) per yearto 1/200 to cases (0.2% 0.5%) per year
• 35.2% Staph in Grant County is MRSA (2008 year to date)(2008, year-to-date)
• CA-MRSA is HERE TO STAY

GOWNS PREVENT HCWs FROM CONTAMINATING THEIR CLOTHES /HANDSCONTAMINATING THEIR CLOTHES /HANDS
14 (40%) of 35 HCWs’ gowns were culture (+) for MRSA and ARE on exiting room (2-200 g (colonies recovered). Clothing underneath was culture (-). 11 (69%) of 16 HCWs wearing f hl l d d hit t h d d t t blfreshly laundered white coats had detectable contamination. 3 of 11 developed (+) hand cultures after touching the white coatcultures after touching the white coat.
Boyce, et al. SHEA 1998, Abstract S74.