grand inga to power africa: hydropower development … · grand inga to power africa: hydropower...
TRANSCRIPT
Grand Inga to power Africa: hydropower development scenarios to 2035 Constantinos Taliotisa*, Morgan Baziliana,b, Manuel Welscha, Dolf Gielenc, Mark Howellsa
aRoyal Institute of Technology – division of Energy Systems Analysis (KTH-dESA) Brinellvagen 68, 100 44 Stockholm, Sweden
bColumbia University 535 W 116th St, New York, NY 10027, United States
cInternational Renewable Energy Agency (IRENA)
Robert Schuman Platz 3, 53111, Bonn, Germany
Abstract The vision of harnessing the Congo River’s immense flow to generate power for the African continent has existed in the agenda of energy planners and politicians for nearly a century. However after the installations of Inga I in 1972 and Inga II in 1982, progress came to a standstill. Recently though the larger aspirations of Grand Inga seem to be moving forward again. Construction of Inga III Low-Head is set to commence in 2015 with a projected capacity of 4755 MW, of which 2500 MW are contracted for the South African market. Upon completion, the total capacity of Grand Inga could reach 42 GW. In this paper, we present scenario-driven results of a Sub-Saharan African-focused partial-equilibrium energy model related to the further development of the project. The analysis is presented to show the broad range of possible energy futures related to this project, without taking into deep consideration the admittedly important issues related to governance, environmental impacts or social tensions. Scenarios are developed to assess the energy outlook of the Central African power pool, in which Grand Inga is located, and the exchange of electricity between regions when the project is completed. The project has the potential to cover the increasing needs for power in this power pool and provide electricity exports to other regions; primarily Southern and Western Africa in a high demand scenario and Southern and Northern Africa in a low demand scenario. Keywords: Grand Inga; African power pools; Electricity trade.
1 - Introduction A secure supply of reliable energy services at affordable prices is essential to promote economic development. The correlation and search for causality between energy consumption and economic growth has been the research topic of numerous studies as examined in Odhiambo [1]. Access to electricity enhances the level of educational and health services offered [2]. It is one of the key concerns of businesses in Sub-Saharan Africa [3], where power outages are so frequent that value losses as high as 22.7% and 25.1% compared to sales are experienced in the Democratic Republic of Congo and Central African Republic respectively [4]. Sub-Saharan Africa is home to 13% of the world’s population, of which 37% live in urban communities and yet just 32.5% have access to electricity [4]. Even within this region there is a great disparity between countries. For instance, access rates are as low as 3% in Chad and Somalia, while in South Africa this reaches 66%, which is the highest in the region [5]. The African continent suffers from severe power shortages, which are often worsened by conflicts, droughts, oil price hikes and lack of capital for investments [6]. However, while the Gross Domestic Product (GDP) of Africa is expected to increase by 3.8% annually from 2010 to 2035, the electricity demand for the continent is projected to double during the same period [7]. At the same time, if the cost of energy, and inherently the energy intensity, is kept at low levels, benefits will extend to other sectors of the economy. Africa has a rich deposit of natural resources, including an enormous renewable energy potential, which could be harnessed in the future for this purpose [8]. In this paper we focus on the hydroelectric power potential of the Congo River. The unexploited hydroelectric potential in Africa is estimated at 937 TWh/year [9], compared to the 105 TWh produced in 2010, and a total electricity demand of 569 TWh for the same year [7]. This immense potential stems from the fact that some of the world’s longest river courses are found in Africa, namely the Nile, with an estimated hydropower potential of 30 GW in Ethiopia alone [10], the Niger, the Zambezi and the Congo; the latter also has the second largest flow of water in the world after the Amazon. The idea of using the Congo River to produce huge volumes of electricity is not novel. The Grand Inga project, situated in the Democratic Republic of Congo (DRC), was first recognized in 1921 by the U.S. Geological Survey and was endorsed by the Belgian colonial authorities in the 1950s [11]. Based on the period’s prevalent mindset of exploiting Africa’s natural resources to supply goods to the European market, the project was envisaged to provide the electricity needed by copper processing facilities in Katanga’s copper belt, the growing aluminum industry and steel producers, who would relocate from Europe to conserve European power [12]. However, due to the long distances and limitations in transmission line technologies, the project was aborted. Since then, the first two phases of the Inga hydroelectric scheme, Inga I with installed capacity of 351 MW and Inga II with installed capacity of 1424 MW, were commissioned in 1972 and 1982 respectively [12]. Still the project is far from its hypothesized potential of roughly 40 GW. With the formation of the Southern African Power Pool in 1995, the project returned to the agenda of African energy policy. By this time, the development of High Voltage Long-Distance (HVLD) transmission technology had removed immediate technical limitations from a proposed Pan-African grid [13]. A recent official press release suggests that the next phase of Inga III Low-Head is moving forward and will have a projected capacity of 4755 MW, of which 2500 MW are contracted for the South African market [14]. Further commitment for the project is indicated by the signing of the Grand Inga Treaty, during President Zuma’s visit to DRC [15]. Upon full completion, Grand Inga would be the biggest hydropower project in the world and could generate enough power to supply one-third of the current electricity demand in Africa. Its final installed capacity is comparable to the current capacity in Sub-Saharan Africa (excluding South Africa), which is approximately 42 GW [16]. Nonetheless, project development has been hurdled so
far by economic, environmental, social and political obstacles. Any such mega project would require strong governance, significant capital inputs and a skilled workforce, all of which suffer gaps in Sub-Saharan Africa to varying degrees [3]. The issue of building significant transmission and distribution grids is likely a large challenge, in addition to the generation asset itself. Some have posited that a Pan-African grid would allow the continent to optimize its resource use and could bring savings of up to 2 billion US$ annually [17]. An enhanced and more efficient integration between and within power pools would be required to achieve this. Although such a grid is among the priorities of African energy policy, a certain degree of opposition exists; the main argument is that low cost electricity from large projects, such as Grand Inga, will primarily be intended for energy intensive industries in South Africa [18]. Such grand planning gestures are also not always optimal in practice. Countries in Sub-Saharan Africa will likely also want to consider the parallel development of mini-grid and off-grid assets in addition to more centralized systems. In addition, the governance and market issues of a Pan-African grid have not been fully vetted. Nonetheless, there is widespread consensus on the need for expansion of the power generation capacity of the continent. Taking into account the rising electricity demand, goals for increase in electricity access and the expected decommissioning of old, inefficient power plants, these would necessitate capacity additions that could reach 261 GW by 2035, according to IEA’s New Policies Scenario [7]. Based on these projections, installed capacity in Sub-Saharan Africa (excluding South Africa) could reach up to 80 GW in 2030 [19]. In view of the current installed capacity of the region and the considerably low electrification rates in most of the countries [5], it can be concluded that these capacity additions will not be sufficient to reach the target for universal access to electricity. Other modeling exercises project that capacity additions of 282 GW will be needed up to 2030 to achieve this goal [10]. As such, great effort is needed to cover this gap. Investment in projects of Grand Inga’s scale [19], or even smaller such as the ongoing 6 GW Grand Ethiopian Renaissance Dam [20], can provide the momentum required to move in this direction. It is worth mentioning that in South Africa, where majority of power generation occurs in Sub-Saharan Africa, 8.7 GW of new coal are planned in the years 2013-2014, while an additional 3.5 GW based on renewable energy sources will be added in the period 2013-2016 [21]. Nonetheless, capacity additions are not the only issue. Even though regional power pools have been formed to promote power trade between countries and regions, minimal electricity trading occurs in Sub-Saharan Africa, while South Africa and Mozambique are currently the biggest importers and exporters of power [9]. A greater grid integration to facilitate trade can serve to unlock considerable volumes of cost-competitive power from renewable energy sources [10]. Whether Grand Inga’s power will principally supply energy intensive industry or increase access to the wider economies of Sub-Saharan Africa, there is no doubt as to the significance of the project for the region. The primary aim of this paper is to provide an overview of the effects the implementation of Grand Inga project will have on the generation mix of Central Africa and the “trickle down” effects on the energy outlook for the rest of the continent – with focus on Sub-Saharan countries. Additionally, the financial viability of the project under unfavorable circumstances, such as congestion in power trade, delays in project delivery, lower electricity demand or increased production costs are examined. An indication of the potential for electricity trade between regions upon completion of the different phases of the Grand Inga project is provided. In section 2 of the paper, the methodology used, including model construction and scenario formulation are presented. In section 3, results are reported for the period 2008 to 2035. The paper concludes with short summary and final remarks in section 4.

2 - Method A model developed in MESSAGE - a linear cost optimization energy systems tool [22] - is used to conduct the quantitative analysis presented in this paper1. The African continent is disaggregated into five power pools: Southern, Western, Central, Eastern and Northern Africa. Each power pool is modeled with separate electricity demand profile, which is further broken down into industrial and joint commercial-residential demands; a portion for rural demand is estimated for the latter. In the scenarios modeled, it is assumed that in Southern, Western, Eastern and Central Africa during the studied period the off-grid supply of electricity will rise to about 12% of the expected residential-commercial demand in 2030, based on the estimations of IRENA. Furthermore, the share of rural demand is assumed to be 2% and will slowly grow to 5% of the total demand by 2030. Demands for final electricity consumption for the reference scenario were taken from a High GDP scenario developed with IRENA [23]. Over twenty generic generating technology (or configurations of specific technology) options are considered in each region, using technology parameters used in existing IRENA work [21], [24]. These include fossil, nuclear and renewable energy technologies. Renewable options are classified by varying characteristics, such as solar irradiation potentials, cost projections and storage options. The technologies that can provide off-grid electricity are assumed to be small hydro, rooftop PV and small diesel generators, while small hydro is allowed to cover only the needs of the rural share. The analysis utilizes net present value costs, while the electricity generation data used in the model are based on existing efforts [16]. A discount rate of 10% is used in the model, while a conservative CO2 tax on power generation is introduced gradually in the model from 2015 onwards in Northern and Southern Africa; in South Africa there are indications that such a policy is quite plausible in the future [25]. Additionally, trade links between regions are allowed to gradually increase over time reaching a peak of 10 GW in 2025 for each connection between regions. These linkages are characterized by different transmission losses, due to variations in distances between the regional major points of energy source to points of demand. Specifically, the link between Central and North Africa has a 25% loss, while the corresponding values for the linkages West-North and West-Central are set at 20% and 5% respectively. A 15% loss is used for the linkages between South-East, South-Central, East-Central and East-North2. It should be clarified that even though emphasis is given on the Grand Inga project, other future renewable energy projects are taken into consideration in the analysis; albeit in an aggregate manner. In cases where projects are committed, these are forced into the solution, while the optimization process of the model decides whether to invest in uncommitted planned projects. Similarly, none of the phases of Grand Inga are forced into the solution. Instead, the model allows the project to be installed only if it is deemed economically efficient (according to the constraints of the model dispatch). For the purposes of this work, the Democratic Republic of Congo, and hence the Grand Inga project, is placed in the Central African Power Pool. 2.1 - Scenario Formulation In order to examine impacts of the project on regional generation mix and export potential of Central Africa, a range of scenarios has been formulated. These are based on existing information regarding project specifications and expected delivery, as well as possible fluctuating trade conditions that may be of future interest. Undeniably the Grand Inga project is one of immense importance and can assist in meeting the increase in electricity demand in Sub-Saharan Africa.
1 A simplified representation of the model structure is given in Appendix A, while an extensive breakdown of key data used
as input is provided in Appendices B-C. 2 These losses are supplementary to any power losses occurring within the region for transmission and distribution.
Capacity of this project is expected to reach 42 GW, which is enormous, taking into consideration that installed electrical capacity in Sub-Saharan Africa is 89 GW, of which 47 GW are in South Africa alone [16]. To facilitate the achievement of the paper’s objectives, scenarios are divided into four categories: project development scenarios, which examine different development pathways of the project, trade scenarios, which investigate the viability of the project under specific power purchasing agreements, an alternative demand scenario, where a Low GDP assumption leads to lower demand for electricity consumption, and scenarios for cost sensitivity analysis, which assess the competitiveness of the project in cases of increased investment or operating costs. 2.1.1 - Project Development Scenarios Reference Scenario - (SC1): This scenario sets the basis for result comparison with the remaining scenarios. In this case, the first phase of the larger project (Inga III) is installed in 2020, while the completion of each subsequent phase takes five years, reaching an estimated total of 42 GW in 2050 [26]. Upon completion of Inga III Low-Head (Table 1), 2500 MW of electricity are to be exported from DRC to South Africa, as agreed upon by the two governments [14]. The following phases are installed at the maximum set capacities [20] in the respective assumed years: Inga III Low-Head (2020) - 4755 MW Inga III High-Head (2025) - 3037 MW Inga IV (2030) - 7182 MW Inga V (2035) - 6970 MW Inga VI (2040) - 6684 MW Inga VII (2045) - 6706 MW Inga VIII (2050) - 6747 MW No Grand Inga Scenario - (SC2): As indicated by the figures provided in the introduction, Grand Inga is an immense project, which has the potential to transform the energy outlook of Sub-Saharan Africa. Therefore, a scenario in which the project is never realized was developed to allow comparisons in capacity and generation mix between the scenarios. Delayed Grand Inga Scenario - (SC3): All phases are delayed by five years in comparison to the Reference Scenario. As in the case of SC2, electricity demand in Central Africa will have to be met primarily with other technologies. Due to the considerable delays in the project’s progress in the past, this scenario gains particular relevance. 2.1.2 - Trade Scenarios Limited Trade Scenario - (SC4): Transmission line capacities to and from Central Africa have a maximum capacity of 1 GW for each direction (e.g. trade of 1GW to Southern Africa and an additional 1GW from Southern Africa is allowed). However, since it has been agreed that 2.5 GW will be sold to South Africa, this is still represented in the model. As opposed to the Reference scenario, in this case inter-regional trade is constrained, in order to investigate the financial viability of the project if conditions, such as lack of power purchase agreements or transmission lines congestion, only allow low volumes of electricity to be traded beyond Central Africa. Electricity traded only with Southern Africa - (SC5): Since Southern Africa is the biggest consumer of electricity and Eskom the largest utility in Sub-Saharan Africa, it is very likely that power purchase agreements will be drafted to sell electricity from Grand Inga to this region. In this scenario, trade will exclusively be diverted to Southern Africa. No fixed electricity trade with South Africa - (SC6): Despite the power purchase agreement between the two parties, this scenario sheds light as to how interregional trade is affected in case this agreement is nullified.
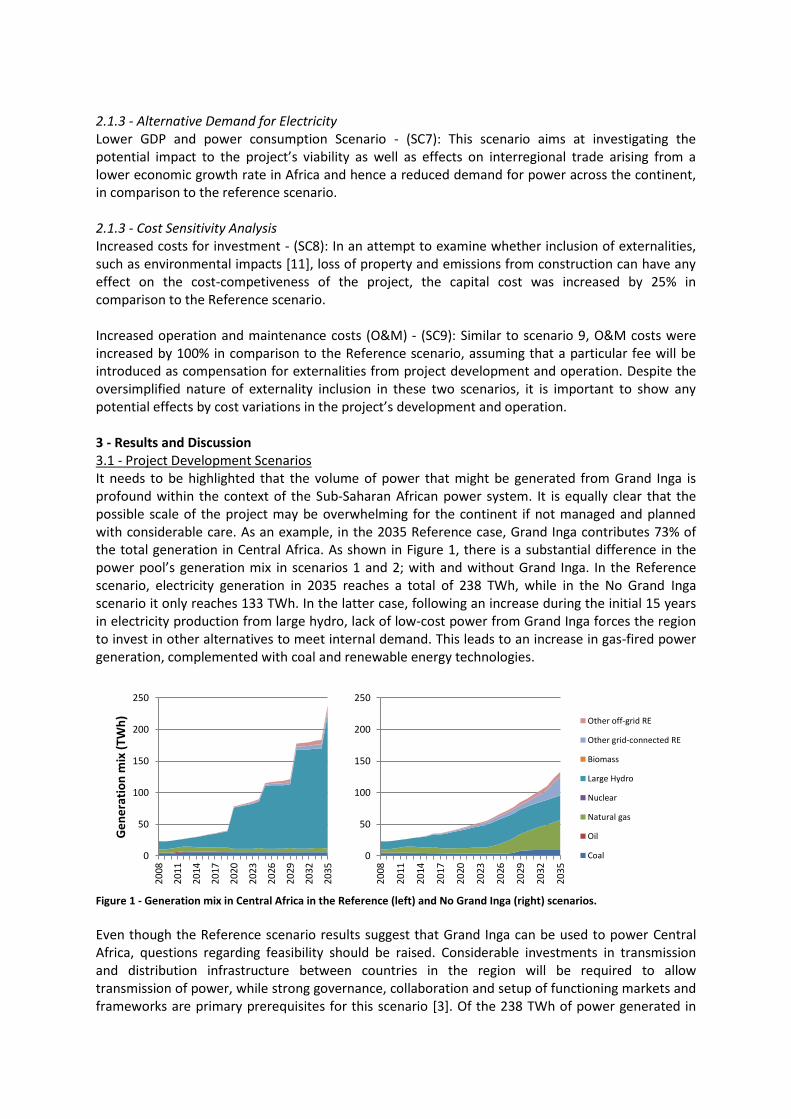
2.1.3 - Alternative Demand for Electricity Lower GDP and power consumption Scenario - (SC7): This scenario aims at investigating the potential impact to the project’s viability as well as effects on interregional trade arising from a lower economic growth rate in Africa and hence a reduced demand for power across the continent, in comparison to the reference scenario. 2.1.3 - Cost Sensitivity Analysis Increased costs for investment - (SC8): In an attempt to examine whether inclusion of externalities, such as environmental impacts [11], loss of property and emissions from construction can have any effect on the cost-competiveness of the project, the capital cost was increased by 25% in comparison to the Reference scenario. Increased operation and maintenance costs (O&M) - (SC9): Similar to scenario 9, O&M costs were increased by 100% in comparison to the Reference scenario, assuming that a particular fee will be introduced as compensation for externalities from project development and operation. Despite the oversimplified nature of externality inclusion in these two scenarios, it is important to show any potential effects by cost variations in the project’s development and operation. 3 - Results and Discussion 3.1 - Project Development Scenarios It needs to be highlighted that the volume of power that might be generated from Grand Inga is profound within the context of the Sub-Saharan African power system. It is equally clear that the possible scale of the project may be overwhelming for the continent if not managed and planned with considerable care. As an example, in the 2035 Reference case, Grand Inga contributes 73% of the total generation in Central Africa. As shown in Figure 1, there is a substantial difference in the power pool’s generation mix in scenarios 1 and 2; with and without Grand Inga. In the Reference scenario, electricity generation in 2035 reaches a total of 238 TWh, while in the No Grand Inga scenario it only reaches 133 TWh. In the latter case, following an increase during the initial 15 years in electricity production from large hydro, lack of low-cost power from Grand Inga forces the region to invest in other alternatives to meet internal demand. This leads to an increase in gas-fired power generation, complemented with coal and renewable energy technologies.
Figure 1 - Generation mix in Central Africa in the Reference (left) and No Grand Inga (right) scenarios.
Even though the Reference scenario results suggest that Grand Inga can be used to power Central Africa, questions regarding feasibility should be raised. Considerable investments in transmission and distribution infrastructure between countries in the region will be required to allow transmission of power, while strong governance, collaboration and setup of functioning markets and frameworks are primary prerequisites for this scenario [3]. Of the 238 TWh of power generated in
0
50
100
150
200
250
20
08
20
11
20
14
20
17
20
20
20
23
20
26
20
29
20
32
20
35
Ge
ne
rati
on
mix
(TW
h)
0
50
100
150
200
250
20
08
20
11
20
14
20
17
20
20
20
23
20
26
20
29
20
32
20
35
Other off-grid RE
Other grid-connected RE
Biomass
Large Hydro
Nuclear
Natural gas
Oil
Coal

Central Africa in the Reference scenario, 118 TWh originate from the Grand Inga project. The majority of this is exported from DRC to other countries in Central Africa and neighbouring power pools. Hence, this associated energy security issue should not be neglected, since any country importing majority of its electricity demand from another country will be vulnerable to disruptions in supply; risk is considerably higher in a case where power originates from a single project. Again, any political considerations are beyond the scope of this study. Power from Grand Inga seems to be cost-competitive across regional boundaries, despite requirements in transmission line investments and losses incorporated in the analysis. As depicted in Figure 2, in the Reference scenario approximately one third of the electricity generated in Central Africa in 2030 is exported; this makes the region the largest net exporter of electricity on the continent. On the contrary, if the project is not developed, the export potential of the region will be minute. Likewise, this implies that lower volumes of cheap power will be available for import by the surrounding regions, primarily affecting the Southern and Western power pools (Figure 2). Such a development will create bi-directional negative consequences. On one hand, DRC will not be able to meet its electricity demand with inexpensive power to assist economic growth, while the potential for revenues from sales of power will gradually diminish. On the other hand, potential importers will be forced to invest in other costlier alternatives to meet growing demand for industrial, commercial and residential activities, thus keeping the price of services and goods at elevated levels.
Figure 2 - Electricity mix of each power pool in the Reference (left) and No Grand Inga (right) scenarios.
The power purchase agreement between the Republic of South Africa and the Democratic Republic of Congo signifies the project’s significance for the two parties [14]. Capital and skilled workforce necessary for successful expansion of installed capacity and transmission grids [3] will have to be mobilized to achieve completion of the project. Figure 3 indicates that throughout the projected period the majority of the electricity is exported to Southern and Western power pools; minute volumes of electricity are exported to Northern Africa during the whole model period. This can be explained by the fact that the Republic of South Africa has already ensured continuous supply of 2.5 GW upon completion of Inga III LH. Additionally, transmission to Southern and Western is preferable compared to exports to Northern Africa, as the assumed losses are much higher for the latter. Insignificant volumes of power are traded between Central and Eastern Africa, due to the sizeable hydropower and wind potential being harnessed in this region.
-40%
-20%
0%
20%
40%
60%
80%
100%
20
08
20
30
20
08
20
30
20
08
20
30
20
08
20
30
20
08
20
30
Central East North South West -20%
0%
20%
40%
60%
80%
100%
20
08
20
30
20
08
20
30
20
08
20
30
20
08
20
30
20
08
20
30
Central East North South West
Net Import
Other off-grid RE
Other grid-connected RE
Biomass
Large Hydro
Nuclear
Natural gas
Oil
Coal
Share of the region
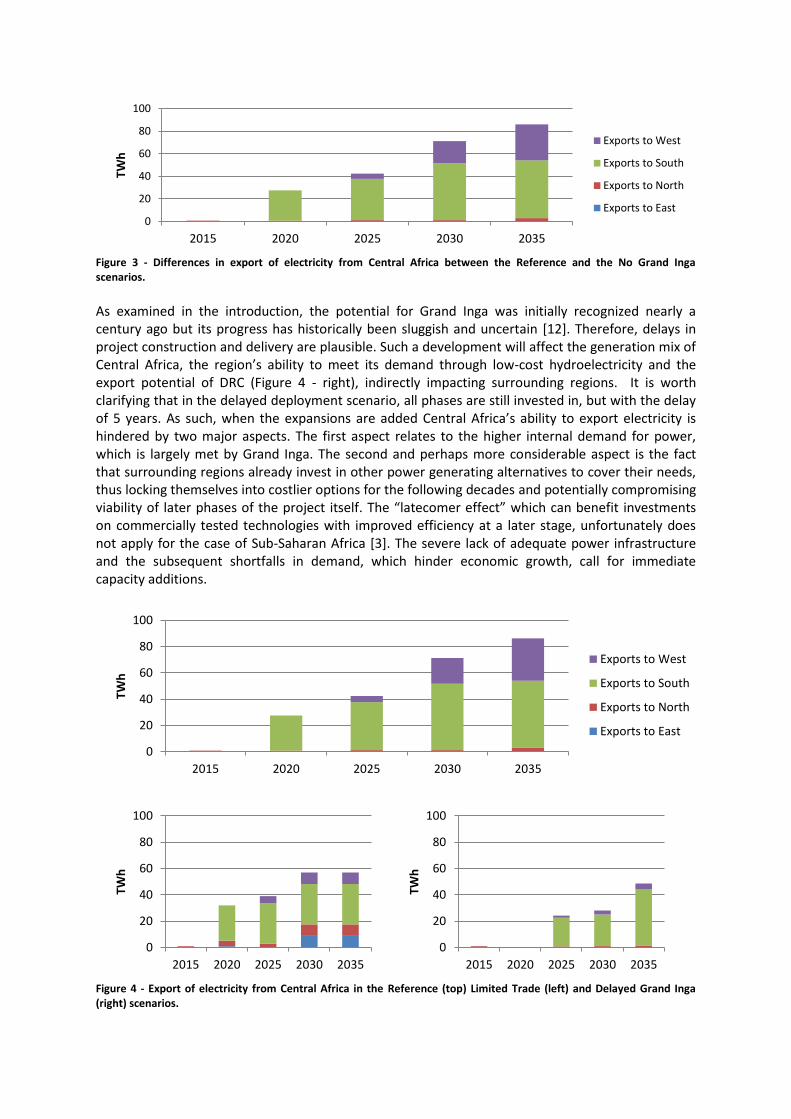
Figure 3 - Differences in export of electricity from Central Africa between the Reference and the No Grand Inga scenarios.
As examined in the introduction, the potential for Grand Inga was initially recognized nearly a century ago but its progress has historically been sluggish and uncertain [12]. Therefore, delays in project construction and delivery are plausible. Such a development will affect the generation mix of Central Africa, the region’s ability to meet its demand through low-cost hydroelectricity and the export potential of DRC (Figure 4 - right), indirectly impacting surrounding regions. It is worth clarifying that in the delayed deployment scenario, all phases are still invested in, but with the delay of 5 years. As such, when the expansions are added Central Africa’s ability to export electricity is hindered by two major aspects. The first aspect relates to the higher internal demand for power, which is largely met by Grand Inga. The second and perhaps more considerable aspect is the fact that surrounding regions already invest in other power generating alternatives to cover their needs, thus locking themselves into costlier options for the following decades and potentially compromising viability of later phases of the project itself. The “latecomer effect” which can benefit investments on commercially tested technologies with improved efficiency at a later stage, unfortunately does not apply for the case of Sub-Saharan Africa [3]. The severe lack of adequate power infrastructure and the subsequent shortfalls in demand, which hinder economic growth, call for immediate capacity additions.
Figure 4 - Export of electricity from Central Africa in the Reference (top) Limited Trade (left) and Delayed Grand Inga (right) scenarios.
0
20
40
60
80
100
2015 2020 2025 2030 2035
TWh
Exports to West
Exports to South
Exports to North
Exports to East
0
20
40
60
80
100
2015 2020 2025 2030 2035
TWh
Exports to West
Exports to South
Exports to North
Exports to East
0
20
40
60
80
100
2015 2020 2025 2030 2035
TWh
0
20
40
60
80
100
2015 2020 2025 2030 2035
TWh
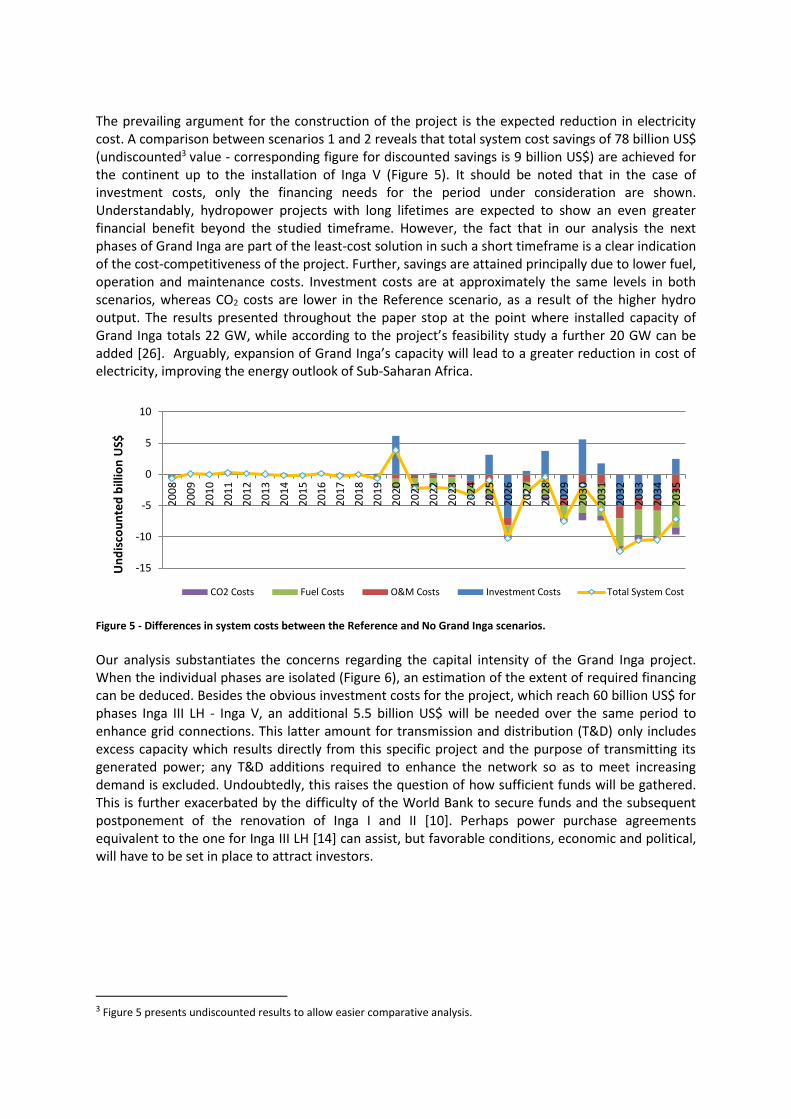
The prevailing argument for the construction of the project is the expected reduction in electricity cost. A comparison between scenarios 1 and 2 reveals that total system cost savings of 78 billion US$ (undiscounted3 value - corresponding figure for discounted savings is 9 billion US$) are achieved for the continent up to the installation of Inga V (Figure 5). It should be noted that in the case of investment costs, only the financing needs for the period under consideration are shown. Understandably, hydropower projects with long lifetimes are expected to show an even greater financial benefit beyond the studied timeframe. However, the fact that in our analysis the next phases of Grand Inga are part of the least-cost solution in such a short timeframe is a clear indication of the cost-competitiveness of the project. Further, savings are attained principally due to lower fuel, operation and maintenance costs. Investment costs are at approximately the same levels in both scenarios, whereas CO2 costs are lower in the Reference scenario, as a result of the higher hydro output. The results presented throughout the paper stop at the point where installed capacity of Grand Inga totals 22 GW, while according to the project’s feasibility study a further 20 GW can be added [26]. Arguably, expansion of Grand Inga’s capacity will lead to a greater reduction in cost of electricity, improving the energy outlook of Sub-Saharan Africa.
Figure 5 - Differences in system costs between the Reference and No Grand Inga scenarios.
Our analysis substantiates the concerns regarding the capital intensity of the Grand Inga project. When the individual phases are isolated (Figure 6), an estimation of the extent of required financing can be deduced. Besides the obvious investment costs for the project, which reach 60 billion US$ for phases Inga III LH - Inga V, an additional 5.5 billion US$ will be needed over the same period to enhance grid connections. This latter amount for transmission and distribution (T&D) only includes excess capacity which results directly from this specific project and the purpose of transmitting its generated power; any T&D additions required to enhance the network so as to meet increasing demand is excluded. Undoubtedly, this raises the question of how sufficient funds will be gathered. This is further exacerbated by the difficulty of the World Bank to secure funds and the subsequent postponement of the renovation of Inga I and II [10]. Perhaps power purchase agreements equivalent to the one for Inga III LH [14] can assist, but favorable conditions, economic and political, will have to be set in place to attract investors.
3 Figure 5 presents undiscounted results to allow easier comparative analysis.
-15
-10
-5
0
5
10
20
08
20
09
20
10
20
11
20
12
20
13
20
14
20
15
20
16
20
17
20
18
20
19
20
20
20
21
20
22
20
23
20
24
20
25
20
26
20
27
20
28
20
29
20
30
20
31
20
32
20
33
20
34
20
35
Un
dis
cou
nte
d b
illio
n U
S$
CO2 Costs Fuel Costs O&M Costs Investment Costs Total System Cost
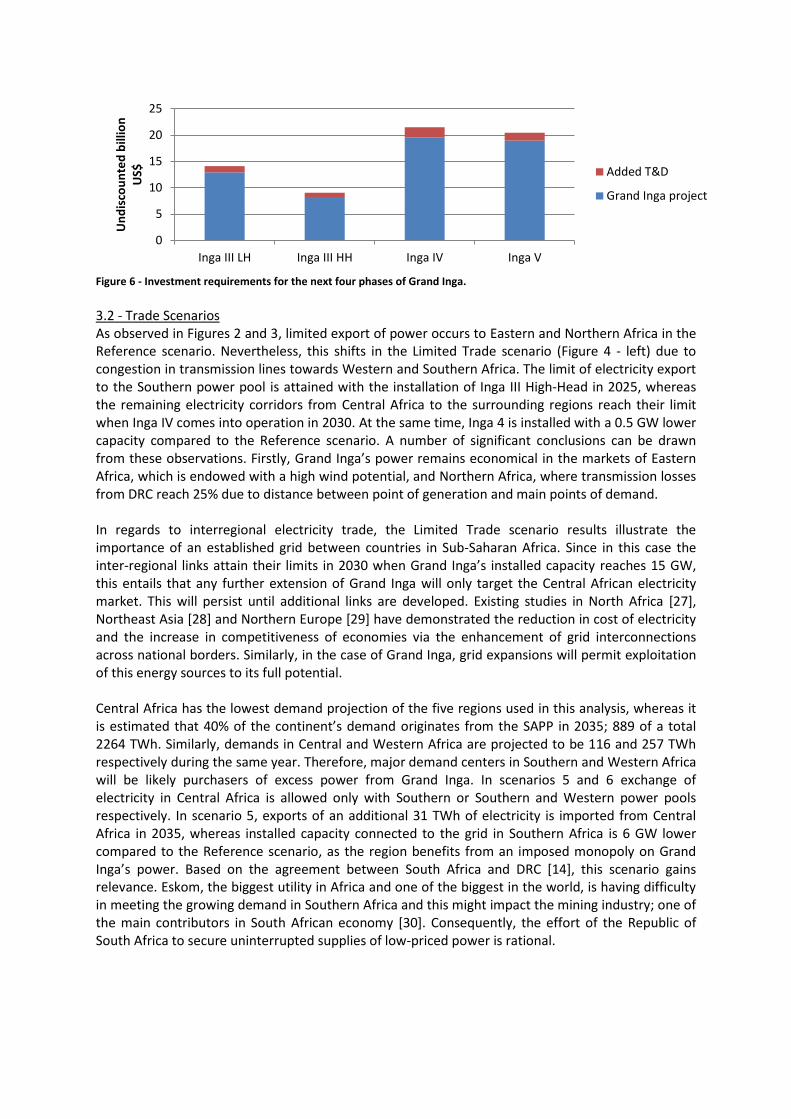
Figure 6 - Investment requirements for the next four phases of Grand Inga.
3.2 - Trade Scenarios As observed in Figures 2 and 3, limited export of power occurs to Eastern and Northern Africa in the Reference scenario. Nevertheless, this shifts in the Limited Trade scenario (Figure 4 - left) due to congestion in transmission lines towards Western and Southern Africa. The limit of electricity export to the Southern power pool is attained with the installation of Inga III High-Head in 2025, whereas the remaining electricity corridors from Central Africa to the surrounding regions reach their limit when Inga IV comes into operation in 2030. At the same time, Inga 4 is installed with a 0.5 GW lower capacity compared to the Reference scenario. A number of significant conclusions can be drawn from these observations. Firstly, Grand Inga’s power remains economical in the markets of Eastern Africa, which is endowed with a high wind potential, and Northern Africa, where transmission losses from DRC reach 25% due to distance between point of generation and main points of demand. In regards to interregional electricity trade, the Limited Trade scenario results illustrate the importance of an established grid between countries in Sub-Saharan Africa. Since in this case the inter-regional links attain their limits in 2030 when Grand Inga’s installed capacity reaches 15 GW, this entails that any further extension of Grand Inga will only target the Central African electricity market. This will persist until additional links are developed. Existing studies in North Africa [27], Northeast Asia [28] and Northern Europe [29] have demonstrated the reduction in cost of electricity and the increase in competitiveness of economies via the enhancement of grid interconnections across national borders. Similarly, in the case of Grand Inga, grid expansions will permit exploitation of this energy sources to its full potential. Central Africa has the lowest demand projection of the five regions used in this analysis, whereas it is estimated that 40% of the continent’s demand originates from the SAPP in 2035; 889 of a total 2264 TWh. Similarly, demands in Central and Western Africa are projected to be 116 and 257 TWh respectively during the same year. Therefore, major demand centers in Southern and Western Africa will be likely purchasers of excess power from Grand Inga. In scenarios 5 and 6 exchange of electricity in Central Africa is allowed only with Southern or Southern and Western power pools respectively. In scenario 5, exports of an additional 31 TWh of electricity is imported from Central Africa in 2035, whereas installed capacity connected to the grid in Southern Africa is 6 GW lower compared to the Reference scenario, as the region benefits from an imposed monopoly on Grand Inga’s power. Based on the agreement between South Africa and DRC [14], this scenario gains relevance. Eskom, the biggest utility in Africa and one of the biggest in the world, is having difficulty in meeting the growing demand in Southern Africa and this might impact the mining industry; one of the main contributors in South African economy [30]. Consequently, the effort of the Republic of South Africa to secure uninterrupted supplies of low-priced power is rational.
0
5
10
15
20
25
Inga III LH Inga III HH Inga IV Inga V
Un
dis
cou
nte
d b
illio
n
US$ Added T&D
Grand Inga project

Figure 7 - Differences in interregional trade between the Reference and No Fixed Trade to South Africa (SC7) scenarios.
In scenario 6, the power purchase agreement between DRC and South Africa was nullified and the model was allowed to choose whether it is cost optimum to trade power with the Southern power pool. As seen in Figure 7 this has an immediate effect on the volume of electricity exported to Southern Africa, which drastically reduces. At the same time, electricity is diverted to Western Africa, which has the third highest demand on the continent after Southern and Northern Africa. This occurs as a result of two main reasons. Firstly, a lower transmission loss occurs for the linkage Central-Western Africa than Central-Southern Africa. As a result, every unit of energy exported to Western Africa has a slightly lower cost than a unit exported to Southern Africa. The second reason is associated to the generation mix of the two regions. Despite the conservative CO2 tax implemented in Southern Africa, at the end of the model period the region still relies to a great extent on coal-fired power plants, which are more cost-competitive than other alternatives. As such, the levelized cost of electricity in Southern Africa seems to be lower than in Western Africa, which means low-cost power from Grand Inga has a greater economic impact on the whole system if it is consumed in Western Africa. Lastly, it is interesting to note that despite the freed-up volume of electricity in this scenario, no trade occurs with Eastern Africa, which can be attributed to the same reasons as explained in the Reference scenario above. 3.3 - Lower Demand Scenario When a lower power consumption projection is employed, a significant change in the energy outlook of the continent is observed. In this scenario, a considerably higher volume of electricity is transmitted across regional borders (Figure 8 - bottom). This is due to a lower intraregional demand in Central, Western and Eastern power pools, which in turn means cost-competitive power from hydro, in the case of all three regions, and wind projects, in the case of Eastern Africa, becomes available for consumption by the two largest consumers of the continent; Northern and Southern Africa (Figure 8 - top). Similarly, whereas Western Africa has one of the main importers of power from Grand Inga, in this scenario this volume of power is diverted to the North and South, as the Western power pool becomes a net exporter of electricity. It is characteristic to observe that in this scenario over 35% of the generated electricity in Central Africa is exported, in comparison to approximately 30% in the reference case. As such, an overall lower demand growth seems to benefit Northern and Southern power pools, since they gain access to cheaper electricity from other regions. Of course, such a scenario would imply that electrification rates in many Sub-Saharan Africa countries will remain at low levels.
-20
-15
-10
-5
0
5
10
15
20
2015 2020 2025 2030 2035
TWh
Exports to West
Exports to South
Exports to North
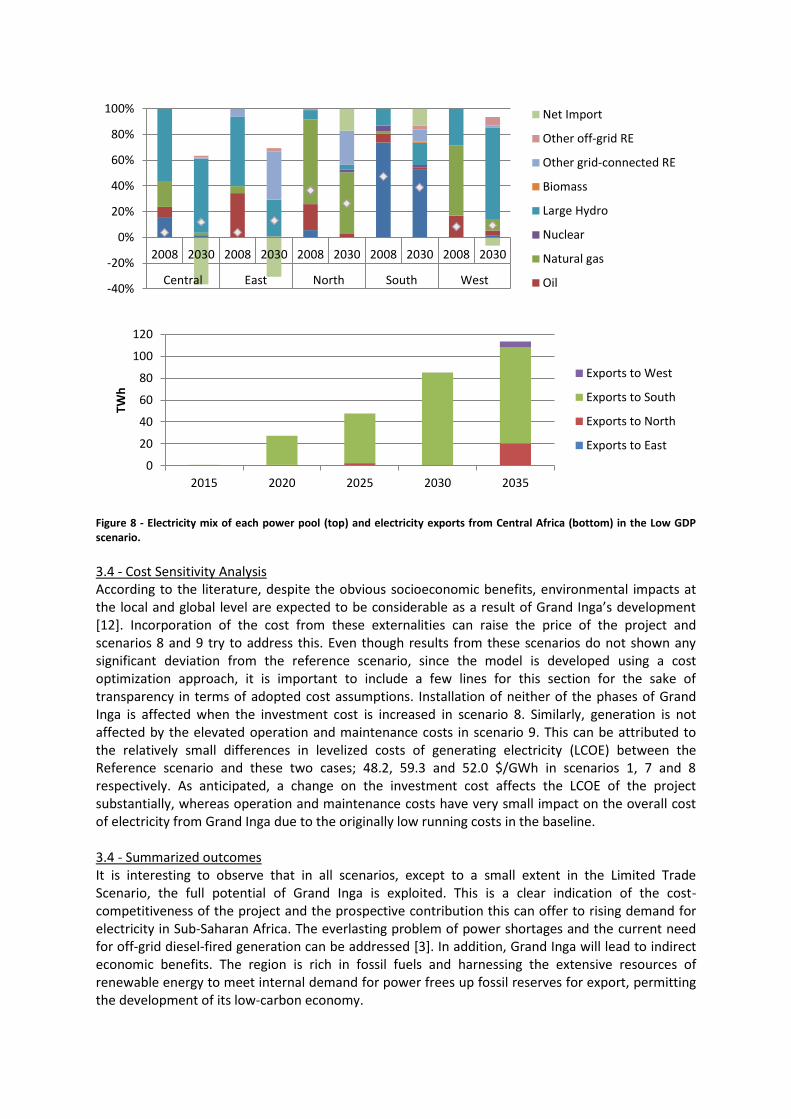
Figure 8 - Electricity mix of each power pool (top) and electricity exports from Central Africa (bottom) in the Low GDP scenario.
3.4 - Cost Sensitivity Analysis According to the literature, despite the obvious socioeconomic benefits, environmental impacts at the local and global level are expected to be considerable as a result of Grand Inga’s development [12]. Incorporation of the cost from these externalities can raise the price of the project and scenarios 8 and 9 try to address this. Even though results from these scenarios do not shown any significant deviation from the reference scenario, since the model is developed using a cost optimization approach, it is important to include a few lines for this section for the sake of transparency in terms of adopted cost assumptions. Installation of neither of the phases of Grand Inga is affected when the investment cost is increased in scenario 8. Similarly, generation is not affected by the elevated operation and maintenance costs in scenario 9. This can be attributed to the relatively small differences in levelized costs of generating electricity (LCOE) between the Reference scenario and these two cases; 48.2, 59.3 and 52.0 $/GWh in scenarios 1, 7 and 8 respectively. As anticipated, a change on the investment cost affects the LCOE of the project substantially, whereas operation and maintenance costs have very small impact on the overall cost of electricity from Grand Inga due to the originally low running costs in the baseline. 3.4 - Summarized outcomes It is interesting to observe that in all scenarios, except to a small extent in the Limited Trade Scenario, the full potential of Grand Inga is exploited. This is a clear indication of the cost-competitiveness of the project and the prospective contribution this can offer to rising demand for electricity in Sub-Saharan Africa. The everlasting problem of power shortages and the current need for off-grid diesel-fired generation can be addressed [3]. In addition, Grand Inga will lead to indirect economic benefits. The region is rich in fossil fuels and harnessing the extensive resources of renewable energy to meet internal demand for power frees up fossil reserves for export, permitting the development of its low-carbon economy.
-40%
-20%
0%
20%
40%
60%
80%
100%
2008 2030 2008 2030 2008 2030 2008 2030 2008 2030
Central East North South West
Net Import
Other off-grid RE
Other grid-connected RE
Biomass
Large Hydro
Nuclear
Natural gas
Oil
0
20
40
60
80
100
120
2015 2020 2025 2030 2035
TWh
Exports to West
Exports to South
Exports to North
Exports to East
Moreover, the approach adopted in our analysis can be regarded as rather conservative, seeing that the final capacity of Grand Inga is only reached in 2050. It could be argued that once the upcoming phases have been completed and brought into operation, mobilization of funds for further capacity installations and transmission interconnections will be a less challenging task. The regional power pools will have gained experience and skill, while required policies, markets and frameworks will already be in place. As such, along with the Sub-Saharan Africa’s strife for increased generation capacity, these factors could compel progress of the project at a faster pace and allow project finalization earlier than predicted. 4 - Conclusions Currently, high power generation costs due to the aging inefficient plants and the constant need for off-grid diesel generators to counter frequent power outages are hampering growth of Sub-Saharan Africa’s economy. Demand for electricity in the region is expected to increase drastically in the next two decades and, as a result, extensive capacity additions along with more efficient operation and management of the power system are needed. The analysis conducted in this paper validates the expectations for cost-competitive electricity from Grand Inga (noting that we did not consider externalities). With the installation of Inga V in 2035 in the Reference scenario, 105 TWh can be generated from Central Africa for the purpose of export beyond the region; this figure corresponds to 80% of the power pool’s internal needs in that year. Interregional trade of electricity can assist in meeting the growing power demand, supplying industry with energy at a considerably low cost and increasing the electrification rate of the region. In order to realize even a fraction of the potential of the full Grand Inga project, cooperation between power pools and improved grid integration are needed. These could unlock the vast untapped energy resources available throughout the African continent. At an assumed capital cost of $2,700/kW, approximately 60 billion US$ would be needed for phases Inga III LH - Inga V. Still, there remain considerable disparities in capital, human and institutional capacity, and infrastructure. Release of funds for the construction of Grand Inga, and of supporting electricity corridors for transmission of electricity across the continent, are needed to allow full exploitation of the project’s potential. Power purchase agreements such as the one between South Africa and DRC for Inga III LH can cover to a certain degree capital costs - these also need to be balanced by requirements in the broader economy. At this point it is worth highlighting that power generated from Grand Inga has never been intended for supplying electricity to domestic users or increasing electricity access in rural areas. Rather, power harnessed from this mega project will likely either cover the needs of large points of demand, such as cities and industrial areas, or be exported via “electricity highways” [13]. Therefore, it remains up to policy makers to decide on how to take advantage of this precious energy source. Besides, increasing access to electricity does not directly lead to economic growth, as other ancillary services are called for to improve living conditions and promote income generating activities [31]. Educational programs and capacity building activities can inform residents who gain access to electricity of the opportunities they have to develop their local economies, ensuring constructive and efficient use of power.
References [1] N. M. Odhiambo, “Energy consumption, prices and economic growth in three SSA countries: A
comparative study,” Energy Policy, vol. 38, no. 5, pp. 2463–2469, May 2010. [2] F. S. Javadi, B. Rismanchi, M. Sarraf, O. Afshar, R. Saidur, H. W. Ping, and N. A. Rahim, “Global
policy of rural electrification,” Renew. Sustain. Energy Rev., vol. 19, pp. 402–416, Mar. 2013. [3] P. Collier and A. J. Venables, “Greening Africa? Technologies, endowments and the latecomer
effect,” Energy Econ., vol. 34, Supplement 1, pp. S75–S84, Nov. 2012. [4] The World Bank, “Data : Sub-Saharan Africa (developing only),” 2013. [Online]. Available:
http://data.worldbank.org/region/SSA. [Accessed: 18-Jul-2013]. [5] A. Brew-Hammond, “Energy access in Africa: Challenges ahead,” Energy Policy, vol. 38, no. 5,
pp. 2291–2301, May 2010. [6] A. Eberhard, V. Foster, C. Briceño-Garmendia, F. Ouedraogo, D. Camos, and M. Shkaratan,
“Underpowered: The State of the Power Sector in Sub-Saharan Africa,” The World Bank, World Bank Other Operational Studies 7833, May 2008.
[7] IEA, World Energy Outlook 2012. Paris: Organisation for Economic Co-operation and Development, 2012.
[8] E. Kebede, J. Kagochi, and C. M. Jolly, “Energy consumption and economic development in Sub-Sahara Africa,” Energy Econ., vol. 32, no. 3, pp. 532–537, May 2010.
[9] A. Eberhard, O. Rosnes, M. Shkaratan, and H. Vennemo, Africa’s Power Infrastructure: Investment, Integration, Efficiency. World Bank Publications, 2011.
[10] IRENA, “Prospects for the African Power Sector: Scenarios and Strategies for Africa Project,” IRENA, Abu Dhabi, 2012.
[11] Daily Telegraph, “Congo Scheme for Cheapest Electricity,” 22-Aug-1957. [12] K. B. Showers, “Congo River’s Grand Inga hydroelectricity scheme: linking environmental
history, policy and impact,” Water Hist., vol. 1, no. 1, pp. 31–58, Jul. 2009. [13] K. B. Showers, “Beyond Mega on a Mega Continent: Grand Inga on Central Africa’s Congo
River,” in Engineering Earth, S. D. Brunn, Ed. Springer Netherlands, 2011, pp. 1651–1679. [14] Democratic Republic of the Congo, “The Democratic Republic of the Congo fixes October 2015
as the date for the launch of the first phase of the largest hydroelectric plant in the world,” Paris, p. 3, 18-May-2013.
[15] Department of International Relations and Cooperation, “President Zuma returns from a State Visit to the DRC,” 30-Oct-2013. [Online]. Available: http://www.dfa.gov.za/docs/2013/drc1031.html. [Accessed: 16-Dec-2013].
[16] Platts, “World Electric Power Plants Database,” 2012. [Online]. Available: http://www.platts.com/Products/worldelectricpowerplantsdatabase.
[17] V. Foster and C. Briceño-Garmendia, Africa’s Infrastructure: A Time for Transformation. Washington, DC: The World Bank, 2010.
[18] A. B. Sebitosi and R. Okou, “Re-thinking the power transmission model for sub-Saharan Africa,” Energy Policy, vol. 38, no. 3, pp. 1448–1454, Mar. 2010.
[19] M. Bazilian, P. Nussbaumer, H.-H. Rogner, A. Brew-Hammond, V. Foster, S. Pachauri, E. Williams, M. Howells, P. Niyongabo, L. Musaba, B. Ó. Gallachóir, M. Radka, and D. M. Kammen, “Energy access scenarios to 2030 for the power sector in sub-Saharan Africa,” Util. Policy, vol. 20, no. 1, pp. 1–16, Mar. 2012.
[20] Ethiopian Electric Power Corporation, “About Grand Ethiopian Renaissance Dam,” 2013. [Online]. Available: http://www.eepco.gov.et/abouttheproject.php?pid=1&pcatid=2. [Accessed: 28-Dec-2013].
[21] A. Miketa and B. Merven, “Southern African Power Pool: Planning and Prospects for Renewable Energy,” IRENA, Abu Dhabi, 2013.
[22] IIASA, “Energy Modeling Framework: Model for Energy Supply Strategy Alternatives and their General Environmental Impact (MESSAGE),” 2012. [Online]. Available: http://webarchive.iiasa.ac.at/Research/ENE/model/message.html. [Accessed: 16-Dec-2013].

[23] IRENA (personal communication), “Africa scenario analysis,” Nov-2012. [24] A. Miketa and B. Merven, “West African Power Pool: Planning and Prospects for Renewable
Energy,” IRENA, Abu Dhabi, 2013. [25] National Treasury Department, “2013 Budget Review.” Republic of South Africa, 2013. [26] S. St-Pierre, “Grand Inga Feasibility Study,” presented at the The Democratic Republic of the
Congo fixes October 2015 as the date for the launch of the first phase of the largest hydroelectric plant in the world, Paris, 18-May-2013.
[27] B. Brand, “Transmission topologies for the integration of renewable power into the electricity systems of North Africa,” Energy Policy, vol. 60, pp. 155–166, Sep. 2013.
[28] W.-C. Yun and Z. X. Zhang, “Electric power grid interconnection in Northeast Asia,” Energy Policy, vol. 34, no. 15, pp. 2298–2309, Oct. 2006.
[29] J. Teusch, A. Behrens, and C. Egenhofer, “The Benefits of Investing in Electricity Transmission: Lessons from Northern Europe,” Social Science Research Network, Rochester, NY, SSRN Scholarly Paper ID 2028866, Jan. 2012.
[30] J. Visser, “Biggest Crisis Since 2008 Looms for South African Mines: Energy,” Bloomberg, 22-Mar-2013. [Online]. Available: http://www.bloomberg.com/news/2013-03-22/biggest-crisis-since-2008-looms-for-south-african-mines-energy.html. [Accessed: 23-Jul-2013].
[31] P. Cook, “Infrastructure, rural electrification and development,” Energy Sustain. Dev., vol. 15, no. 3, pp. 304–313, Sep. 2011.
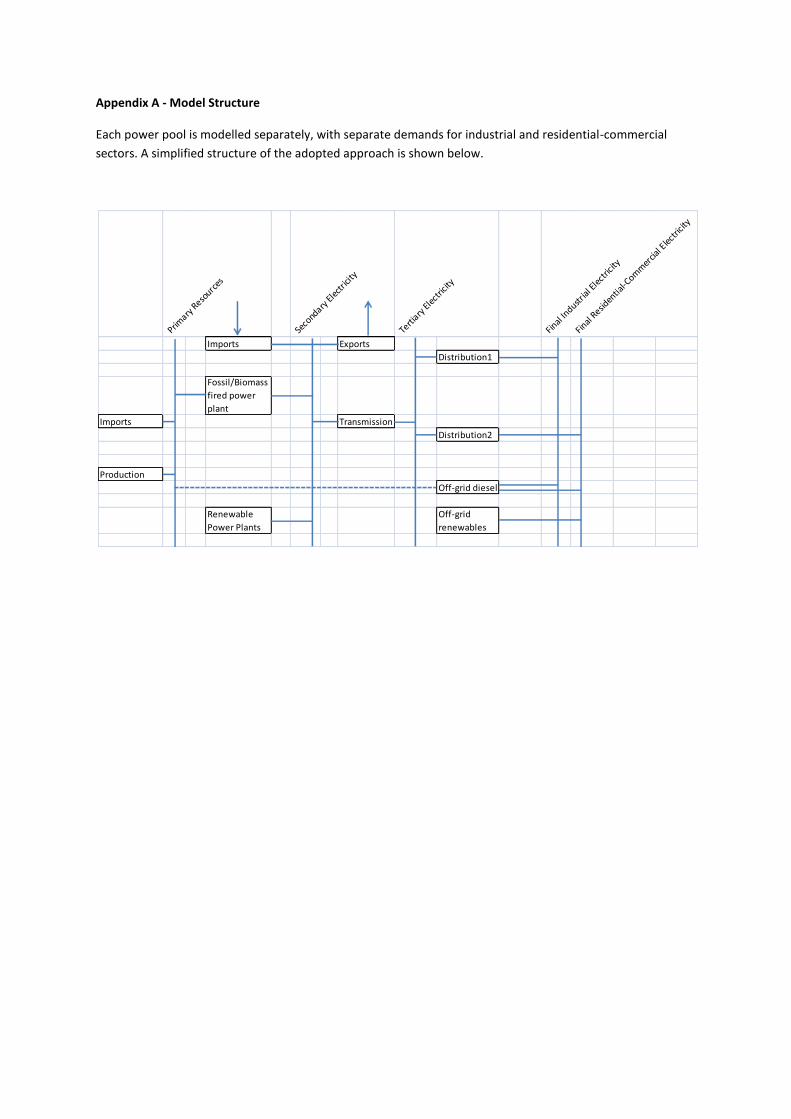
Appendix A - Model Structure
Each power pool is modelled separately, with separate demands for industrial and residential-commercial
sectors. A simplified structure of the adopted approach is shown below.
Primary
Reso
urces
Seco
ndary
Elec
trici
ty
Terti
ary El
ectri
city
Final
Industr
ial El
ectri
city
Final
Resid
entia
l-Com
mer
cial E
lectri
city
Imports Exports
Distribution1
Fossil/Biomass
fired power
plant
Imports Transmission
Distribution2
Production
Off-grid diesel
Renewable
Power Plants
Off-grid
renewables
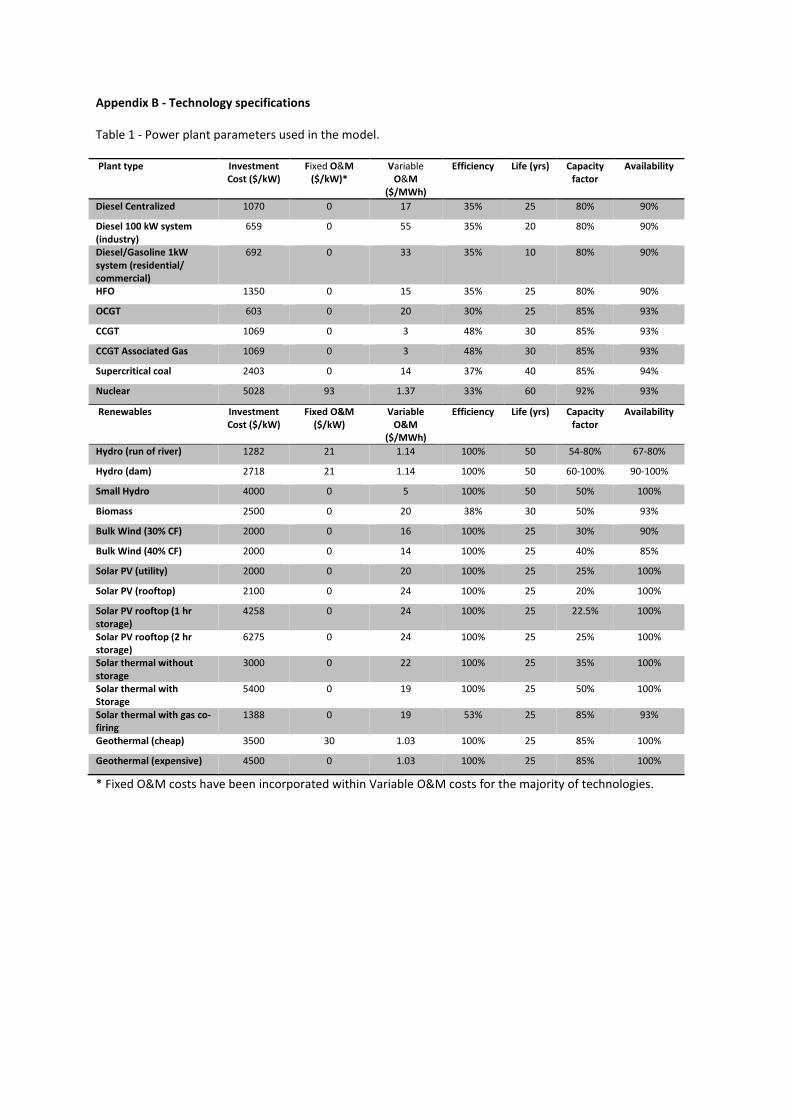
Appendix B - Technology specifications
Table 1 - Power plant parameters used in the model.
Plant type Investment Cost ($/kW)
Fixed O&M ($/kW)*
Variable O&M
($/MWh)
Efficiency Life (yrs) Capacity factor
Availability
Diesel Centralized 1070 0 17 35% 25 80% 90%
Diesel 100 kW system (industry)
659 0 55 35% 20 80% 90%
Diesel/Gasoline 1kW system (residential/ commercial)
692 0 33 35% 10 80% 90%
HFO 1350 0 15 35% 25 80% 90%
OCGT 603 0 20 30% 25 85% 93%
CCGT 1069 0 3 48% 30 85% 93%
CCGT Associated Gas 1069 0 3 48% 30 85% 93%
Supercritical coal 2403 0 14 37% 40 85% 94%
Nuclear 5028 93 1.37 33% 60 92% 93%
Renewables Investment Cost ($/kW)
Fixed O&M ($/kW)
Variable O&M
($/MWh)
Efficiency Life (yrs) Capacity factor
Availability
Hydro (run of river) 1282 21 1.14 100% 50 54-80% 67-80%
Hydro (dam) 2718 21 1.14 100% 50 60-100% 90-100%
Small Hydro 4000 0 5 100% 50 50% 100%
Biomass 2500 0 20 38% 30 50% 93%
Bulk Wind (30% CF) 2000 0 16 100% 25 30% 90%
Bulk Wind (40% CF) 2000 0 14 100% 25 40% 85%
Solar PV (utility) 2000 0 20 100% 25 25% 100%
Solar PV (rooftop) 2100 0 24 100% 25 20% 100%
Solar PV rooftop (1 hr storage)
4258 0 24 100% 25 22.5% 100%
Solar PV rooftop (2 hr storage)
6275 0 24 100% 25 25% 100%
Solar thermal without storage
3000 0 22 100% 25 35% 100%
Solar thermal with Storage
5400 0 19 100% 25 50% 100%
Solar thermal with gas co-firing
1388 0 19 53% 25 85% 93%
Geothermal (cheap) 3500 30 1.03 100% 25 85% 100%
Geothermal (expensive) 4500 0 1.03 100% 25 85% 100%
* Fixed O&M costs have been incorporated within Variable O&M costs for the majority of technologies.
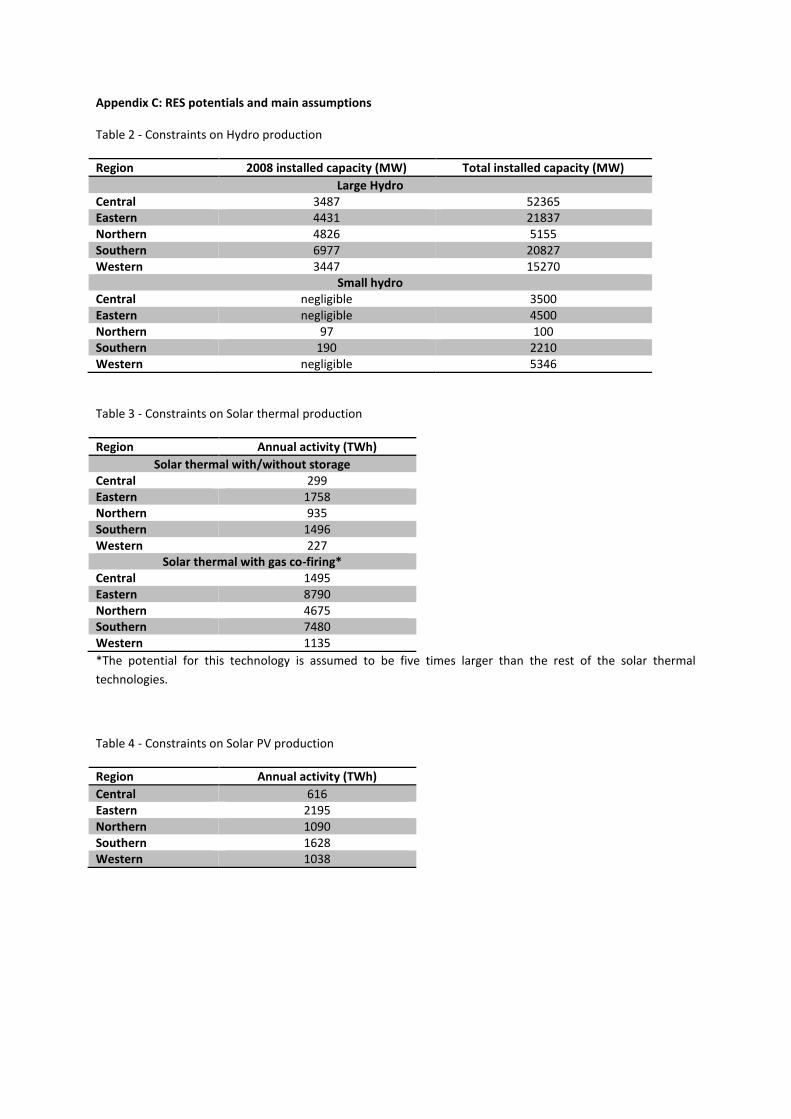
Appendix C: RES potentials and main assumptions
Table 2 - Constraints on Hydro production
Region 2008 installed capacity (MW) Total installed capacity (MW)
Large Hydro Central 3487 52365 Eastern 4431 21837 Northern 4826 5155 Southern 6977 20827 Western 3447 15270
Small hydro Central negligible 3500 Eastern negligible 4500 Northern 97 100 Southern 190 2210 Western negligible 5346
Table 3 - Constraints on Solar thermal production
Region Annual activity (TWh)
Solar thermal with/without storage Central 299 Eastern 1758 Northern 935 Southern 1496 Western 227
Solar thermal with gas co-firing* Central 1495 Eastern 8790 Northern 4675 Southern 7480 Western 1135
*The potential for this technology is assumed to be five times larger than the rest of the solar thermal
technologies.
Table 4 - Constraints on Solar PV production
Region Annual activity (TWh)
Central 616 Eastern 2195 Northern 1090 Southern 1628 Western 1038
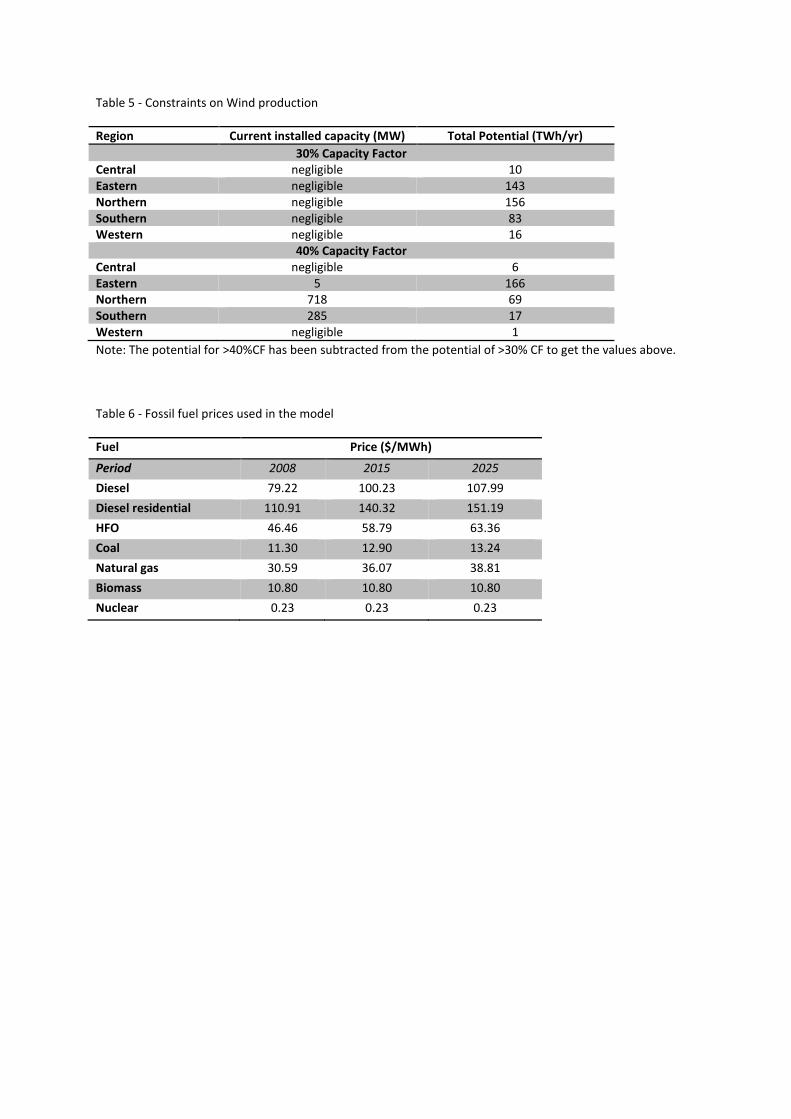
Table 5 - Constraints on Wind production
Region Current installed capacity (MW) Total Potential (TWh/yr)
30% Capacity Factor Central negligible 10 Eastern negligible 143 Northern negligible 156 Southern negligible 83 Western negligible 16
40% Capacity Factor Central negligible 6 Eastern 5 166 Northern 718 69 Southern 285 17 Western negligible 1
Note: The potential for >40%CF has been subtracted from the potential of >30% CF to get the values above.
Table 6 - Fossil fuel prices used in the model
Fuel Price ($/MWh)
Period 2008 2015 2025
Diesel 79.22 100.23 107.99
Diesel residential 110.91 140.32 151.19
HFO 46.46 58.79 63.36
Coal 11.30 12.90 13.24
Natural gas 30.59 36.07 38.81
Biomass 10.80 10.80 10.80
Nuclear 0.23 0.23 0.23