grand city properties s.a. · risk rating medium buy low ... increasing rents and occupancy rates...
TRANSCRIPT
21 January 2013 GRAND CITY Properties S.A.
FIRST BERLIN Equity Research
Analyst: Jens Hasselmeier, Tel. +49 (0)30 - 80 93 96 83
21
GRAND CITY Properties S.A. GR
Luxembourg / Financial Services Frankfurt
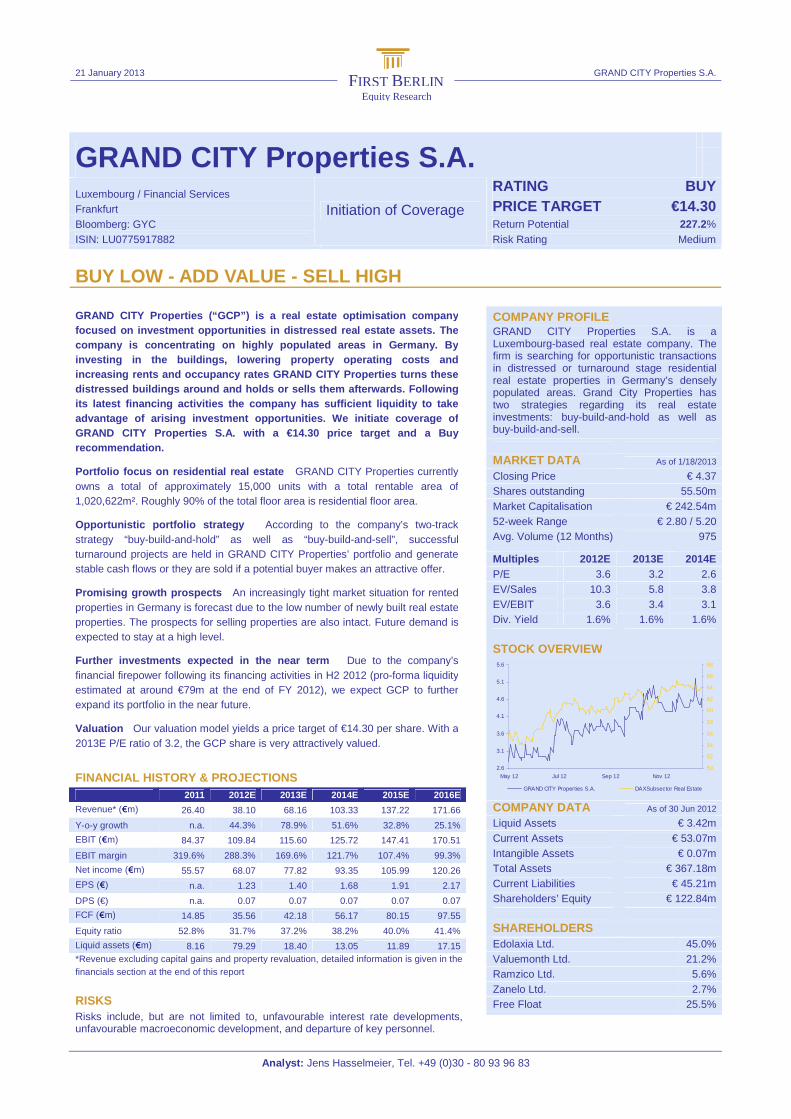
RATING BUY PRICE TARGET €14.30
Bloomberg: GYC Return Potential 227.2% ISIN: LU0775917882
Initiation of Coverage
Risk Rating Medium
BUY LOW - ADD VALUE - SELL HIGH Jens Hasselmeier, Tel. +49 (0)30 - 80 93 96 83
FINANCIAL HISTORY & PROJECTIONS 2011 2012E 2013E 2014E 2015E 2016E
Revenue* (€m) 26.40 38.10 68.16 103.33 137.22 171.66
Y-o-y growth n.a. 44.3% 78.9% 51.6% 32.8% 25.1%
EBIT (€m) 84.37 109.84 115.60 125.72 147.41 170.51
EBIT margin 319.6% 288.3% 169.6% 121.7% 107.4% 99.3%
Net income (€m) 55.57 68.07 77.82 93.35 105.99 120.26
EPS (€) n.a. 1.23 1.40 1.68 1.91 2.17
DPS (€) n.a. 0.07 0.07 0.07 0.07 0.07
FCF (€m) 14.85 35.56 42.18 56.17 80.15 97.55
Equity ratio 52.8% 31.7% 37.2% 38.2% 40.0% 41.4%
Liquid assets (€m) 8.16 79.29 18.40 13.05 11.89 17.15 *Revenue excluding capital gains and property revaluation, detailed information is given in the financials section at the end of this report
RISKS Risks include, but are not limited to, unfavourable interest rate developments, unfavourable macroeconomic development, and departure of key personnel.
COMPANY PROFILE GRAND CITY Properties S.A. is a Luxembourg-based real estate company. The firm is searching for opportunistic transactions in distressed or turnaround stage residential real estate properties in Germany’s densely populated areas. Grand City Properties has two strategies regarding its real estate investments: buy-build-and-hold as well as buy-build-and-sell.
MARKET DATA As of 1/18/2013
Closing Price € 4.37 Shares outstanding 55.50m Market Capitalisation € 242.54m 52-week Range € 2.80 / 5.20 Avg. Volume (12 Months) 975 Multiples 2012E 2013E 2014E P/E 3.6 3.2 2.6 EV/Sales 10.3 5.8 3.8 EV/EBIT 3.6 3.4 3.1 Div. Yield 1.6% 1.6% 1.6% STOCK OVERVIEW
2.6
3.1
3.6
4.1
4.6
5.1
5.6
May 12 Jul 12 Sep 12 Nov 12
50
52
54
56
58
60
62
64
66
68
GRAND CITY Properties S.A. DAXSubsector Real Estate COMPANY DATA As of 30 Jun 2012
Liquid Assets € 3.42m Current Assets € 53.07m Intangible Assets € 0.07m Total Assets € 367.18m Current Liabilities € 45.21m Shareholders’ Equity € 122.84m SHAREHOLDERS Edolaxia Ltd. 45.0% Valuemonth Ltd. 21.2% Ramzico Ltd. 5.6% Zanelo Ltd. 2.7% Free Float 25.5%
GRAND CITY Properties (“GCP”) is a real estate optimisation company focused on investment opportunities in distressed r eal estate assets. The company is concentrating on highly populated areas in Germany. By investing in the buildings, lowering property operating costs and increasing rents and occupancy rates GRAND CITY Pro perties turns these distressed buildings around and holds or sells them afterwards. Following its latest financing activities the company has suf ficient liquidity to take advantage of arising investment opportunities. We i nitiate cov erage of GRAND CITY Properties S.A. with a €14.30 price targ et and a Buy recommendation.
Portfolio focus on residential real estate GRAND CITY Properties currently owns a total of approximately 15,000 units with a total rentable area of 1,020,622m². Roughly 90% of the total floor area is residential floor area.
Opportunistic portfolio strategy According to the company’s two-track strategy “buy-build-and-hold” as well as “buy-build-and-sell”, successful turnaround projects are held in GRAND CITY Properties’ portfolio and generate stable cash flows or they are sold if a potential buyer makes an attractive offer.
Promising growth prospects An increasingly tight market situation for rented properties in Germany is forecast due to the low number of newly built real estate properties. The prospects for selling properties are also intact. Future demand is expected to stay at a high level.
Further investments expected in the near term Due to the company’s financial firepower following its financing activities in H2 2012 (pro-forma liquidity estimated at around €79m at the end of FY 2012), we expect GCP to further expand its portfolio in the near future.
Valuation Our valuation model yields a price target of €14.30 per share. With a 2013E P/E ratio of 3.2, the GCP share is very attractively valued.

21 January 2013
B GRAND CITY Properties S.A.
Page 2/24
CONTENTS PAGE
GRAND CITY Properties S.A. – Executive Summary ................................................................................... 1 Investment Case ........................................................................................................................................... 3 SWOT Analysis............................................................................................................................................. 4 Valuation....................................................................................................................................................... 6
Net Present Value Analysis..................................................................................................................... 6 Business Model............................................................................................................................................. 8 Real Estate Portfolio ..................................................................................................................................... 9 Recent Developments & Financing Activities.............................................................................................. 12
H1 2012 Income Statement................................................................................................................... 12 Balance Sheet as of 30 June 2012........................................................................................................ 12 H1 2012 Cash Flow Statement.............................................................................................................. 13 July 2012 Capital Increase .................................................................................................................... 13 October 2012 Bond Issuance................................................................................................................ 13 January 2013 Portfolio Update.............................................................................................................. 13
Estimates 2012E & Subsequent Years ....................................................................................................... 14 German Residential Real Estate Market..................................................................................................... 15
Residential Market................................................................................................................................. 15 Residential Investment Market .............................................................................................................. 16
Management Team..................................................................................................................................... 19 Shareholders, Stock & Bond Information .................................................................................................... 20 Income Statement Analysis......................................................................................................................... 21 Balance Sheet Analysis .............................................................................................................................. 22 Cash Flow Analysis..................................................................................................................................... 23
21 January 2013
B GRAND CITY Properties S.A.
Page 3/24
INVESTMENT CASE
OPPORTUNISTIC REAL ESTATE OPTIMISER Based on strict investment criteria GRAND CITY Properties (“GCP”) acquires distressed or turnaround stage residential real estate properties in highly-populated areas in Germany with a significant discount to the properties’ fair value. Afterwards, the company begins to optimise and redevelop the real estate properties by investing in the buildings and lowering property operating costs. When negotiating costs with external providers, GRAND CITY Properties has a high bargaining power due to its skilled and experienced management team. According to its two-track strategy, “buy-build-and-hold” as well as “buy-build-and-sell”, successful turnaround projects with high occupancy rates and increased rental prices are held in the company’s portfolio and generate optimised cash flows - or will be sold, but only if a potential buyer makes an attractive offer. INTACT GROWTH PROSPECTS FOR THE GERMAN RESIDENTIAL MARKET In the coming years, an increasingly tight market situation for rented apartments and houses especially in Germany’s highly populated areas (where GCP is focusing on) is forecast due to the low number of newly built real estate properties. This should help GRAND CITY Properties to increase the rents in its real estate properties with a lower tenant churn rate. We expect lower tenant churn rates to accelerate the decrease in vacancy rates in the company’s turnaround projects. GCP will thus be able to sell its stabilised projects earlier. With regard to potential buyers of stabilised projects, prospects are also promising. Based on the dynamic market activity especially in the small-sized segment and a growing interest of foreign investors to invest in stable, safe German residential properties, sustained high demand is forecast for the next years. HIGH CASH POSITION ALLOWS FURTHER INVESTMENTS GRAND CITY Properties’ cash position (end of FY 2012) amounts to roughly €80m due to the company’s latest financing activities such as a capital increase (gross proceeds of €15m) and the issuance of convertible bonds (gross proceeds of €100m). The firm is thus able to quickly take advantage of investment opportunities. GCP is currently taking a closer look at different portfolios in the market and following discussions with the management we believe that there is a remarkable pipeline of possible deals due to the company’s extensive network and its relationships with different market players.

21 January 2013
B GRAND CITY Properties S.A.
Page 4/24
SWOT ANALYSIS
STRENGTHS
● Solid financials Even though GRAND CITY Properties raised additional €100m in financial debt in October 2012 (see chapter “Recent Developments & Financing Activities”), the firm’s balance sheet is still solid. The company’s estimated pro-forma equity ratio is around 30% and the maturity of the company’s debt ranges between six and nine years. GCP’s loan-to-value ratio at the end of June was 48%.
● High cash position After the issuance of the convertible bond and the latest capital increase (see also chapter “Recent Developments & Financing Activities”), GRAND CITY Properties has sufficient cash to take advantage of arising investment opportunities. On a pro-forma basis, the cash position of the company is estimated to be around €80m (end of FY 2012).
● Ability to decrease property operating costs When negotiating property operating costs with external (service) providers such as utilities, GRAND CITY Properties has a high bargaining power due to its skilled and experienced management team.
WEAKNESSES
● Recent corporate history GRAND CITY Properties has proven its ability to successfully turnaround distressed properties and sell them afterwards at a higher price (most recently, the company sold its Cologne project). However, with a corporate history of six years, the company still needs to build up a more consistent track record - even though GCP’s management team has a track record of nine years.
● Non-cash items boost income development As a real estate optimiser, a significant part of GRAND CITY Properties’ operating income is a result of fair value gains on investment properties. There is thus a remarkable difference between the company’s income development shown in the P&L and the development of GCP’s operating cash flow.

21 January 2013
B GRAND CITY Properties S.A.
Page 5/24
OPPORTUNITIES
● Higher rents due to tight market conditions The currently low number of newly built real estate properties is forecast to lead to a tight market situation for rented apartments and houses - especially in highly populated areas in Germany where GRAND CITY Properties is focusing on (see chapter “German Residential Real Estate Market”). This should allow GCP to increase the rents in its properties with a lower tenant churn rate and thus accelerate the decrease in vacancy rates in turnaround projects.
● Germany is forecast to stay attractive investment m arket Based on the dynamic market activity especially in the small-sized segment and a growing interest of foreign investors to invest in stable, safe German residential properties, sustained high demand is forecast for the next years (see also chapter “German Residential Real Estate Market”). Moreover, it is not unlikely that the Germans fear of a recession will lead to increased investment activity and thus also affect development of real estate prices in a positive way.
● Diversified sourcing opportunities GRAND CITY Properties has an extensive network and privileged relationships with different market players such as other real estate companies or financial services companies. It is likely that especially GCP’s good relationship with banks could make further opportunistic investments possible - due to deleveraging and liquidity needs of banks that own distressed assets.
● Uncertain economic situation may increase deal pipe line Given the uncertain economic situation in Europe, owners of distressed properties may tend to divest their real estate holdings, thus creating additional deal opportunities for GRAND CITY Properties.
THREATS
● Unfavourable interest rate development Debt financing, which is currently offered to GCP at favourable conditions, could become more expensive in case of an unfavourable development of interest rates and bank margins, thus burdening the company’s profitability. Even though GRAND CITY Properties is minimising this risk by using hedging instruments.
● Development risk Complications may arise during the re-development and optimisation process. These complications could for example result in project delays or lead to higher than anticipated project costs, thus slowing down the pace of further improvements in rental yields.
● Dependency on creditors Although GCP’s current debt structure is comfortable (lending terms of 5 to 10 years), restrictions in borrowing by banks may have a negative effect on the financing of future projects or the re-financing of existing financial liabilities.

21 January 2013
B GRAND CITY Properties S.A.
Page 6/24
VALUATION
We set a price target of €14.30 for shares of GRAND CITY Properties. We derive this fair value estimate from our valuation model based on detailed forecasts until FY 2016E. Our price target represents an upside of 227%. We consequently rate the GCP stock “Buy”. Weighted Average Cost of Capital In order to determine GRAND CITY Properties’ Weighted Average Cost of Capital (WACC), we use our proprietary multi-factor risk model, which takes company-specific risk factors into account. These risk factors include management strength, balance sheet and financial risk, competitive position and company size. We assign a medium risk rating to the company. Our WACC calculation of 7.4% is based on a risk-free rate of 3.0% and a market risk premium of 4.0%.
Figure 1: Weighted Average Cost of Capital
WACC 7.4%
Cost of equity 12.2%
Pre-tax cost of debt 4.1%
Tax rate 15.9%
After-tax cost of debt 3.5%
Share of equity capital 45.0%
Share of debt capital 55.0% Source: First Berlin Equity Research
NET PRESENT VALUE ANALYSIS
Since the company is optimising real estate projects, forecasts beyond a five year horizon are subject to increasing uncertainty in our view. In our analysis of GRAND CITY Properties, we thus base our valuation of GCP on our forecasts out to FY 2016E. Our assumptions regarding future developments are based on the firm’s portfolio transaction forecasts. Our net present value (NPV) analysis of GCP is derived in a three-step process:
I. In order to properly account for the re-development and optimisation character of GRAND CITY Properties’ business model, we derive the present value of the company’s future real estate portfolio based on our estimates for GCP’s portfolio in 2016E.
Figure 2: Portfolio development
Present value of the real estate portfolio (in €'000) 2012E 2013E 2014E 2015E 2016E
Market value of properties (including properties available for sale) 415,037 592,403 814,344 1,031,960 1,269,720
Investments in subsidiaries 14,238 18,095 18,095 18,095 18,095
Combined 429,275 610,498 832,439 1,050,055 1,287,815
Present value 971,912 Source: First Berlin Equity Research

21 January 2013
B GRAND CITY Properties S.A.
Page 7/24
II. We have also included the present value of expected dividend payments until 2016E in our valuation. We have discounted these at the company’s WACC of 7.4%.
Figure 3: Dividend development
Present value of dividends (in €'000) 2012E 2013E 2014E 2015E 2016E
Dividend 3,996 3,996 3,996 3,996 3,996
Dividend (discounted) 3,996 3,735 3,478 3,239 3,016
Present value (accumulated) 17,465
Source: First Berlin Equity Research
III. Taking into account the firm’s financing activities in FY 2012E, we subtract GRAND
CITY Properties’ net financial liabilities at end 2012E from the combined portfolio/dividend present value arrived at in the two previous steps.
Figure 4: Valuation summary
Net present value calculation (in €'000)
Value of real estate portfolio* end of 2016E 1,287,815
Present value of real estate portfolio 2016E 971,912
+ Present value of dividends 2012E-2016E 17,465
= Sum PVs 989,377
- Net interest bearing liabilities end of 2012E including convertible bond 191,785
= NPV 797,592
/ Outstanding shares 55,500
= NPV per share (in €) 14.37
*including investments in subsidiaries
Sensitivity analysis: NPV and NPV per share development
WACC 6.9% 7.4% 7.9% 8.4% 8.9% 9.4%
NPV 816,160 797,592 780,157 762,764 745,764 729,144
per share 14.71 14.37 14.06 13.74 13.44 13.14
Source: First Berlin Equity Research
Our NPV analysis based on GRAND CITY Properties’ balance sheet suggests a market value of €798m for GCP or - based on 55.5m outstanding shares - €14.30 per share. However, any significant delays in implementing the company’s strategy will likely have a significant downside to our estimates. Note: Since we take into account the present value of dividend payments until FY 2016E, our “per share” valuation of GCP is based on the number of currently outstanding shares. Under the terms of the €100m convertible bonds, the company is restricted regarding the total amount of dividends (maximum payout of €4m per year). This will change after the expected complete conversion of the bonds in 2017E (25m new shares – no debt repayment). A diluted “per share” valuation would have a misleading character with regard to our valuation given the payout restriction under the bond without considering the dividend upside potential after the bond is redeemed. Theoretically, yearly interest payments associated with the bonds amounting to €8m are - beginning in FY 2017E - also available for dividend distribution to shareholders (taking the current level of dividend payments into account, future dividend payments will thus theoretically amount to at least €12m).

21 January 2013
B GRAND CITY Properties S.A.
Page 8/24
BUSINESS MODEL
GRAND CITY Properties (“GCP”) is searching for opportunistic transactions in distressed or turnaround stage residential real estate properties in highly-populated areas in Germany. The company has a two-track strategy regarding its real estate investments: buy-build-and-hold as well as buy-build-and-sell. At the beginning, GCP is acquiring its new properties at distressed prices - i.e. a significant discount to the fair value - based on strict investment criteria such as macro and micro location. The newly acquired under-managed assets show high vacancy levels and/or rental prices below the corresponding market rent. In a next step, the company begins to invest in the real estate properties in order to re-develop and optimise the buildings and lowers the property operating expenditures. When negotiating costs with external providers, GRAND CITY Properties has a high degree of bargaining power due to its skilled and experienced management team. Based on an improved tenant satisfaction, GCP gradually increases the occupancy rates and the rental prices until they reach market rent levels afterwards. According to its two-track strategy mentioned above, successful turnaround projects are held in the company’s portfolio and generate stable cash flows - or will be sold if a potential buyer makes an attractive offer. GCP’s portfolio can be divided into three different turnaround stages (see chapter “Real Estate Portfolio”): early turnaround, advanced turnaround and stabilised.
Figure 5: Business model and property life cycle
Established deal sourcing network
Due diligence &Negotiation of deal terms
Acquisition &Financing
Turnaround & CAPEXIncrease rent and occupancy
Lower operating/non-recovable costsImprove tenant satisfaction
Increase inyield & value
Long-term holdor
Sale at high capital gain
Acquisition
Source: First Berlin Equity Research, GRAND CITY Properties S.A.

21 January 2013
B GRAND CITY Properties S.A.
Page 9/24
REAL ESTATE PORTFOLIO
GRAND CITY Properties is focusing on opportunistic transactions in distressed or turnaround stage residential real estate properties. Several investment criteria need to be met unless the company will invest in new properties:
• Use: residential real estate.
• Location: densely populated areas, preferably in Western Germany. • Property: properties in distressed or turnaround stage, with comparably low
occupancy rates and rental prices below the corresponding market rent.
Figure 6: Portfolio data
Number of owned residential units 14,005
Number of owned commercial units 854
Total number of owned units 14,859
Residential floor area (in m²) 921,974
Commercial floor area (in m²) 98,648
Total floor area (in m²) 1,020,622
early turnaround stage 4.52
advanced turnaround stage 4.57
stabilised projects 5.71
Average rent 4.82
early turnaround stage 22.8%
advanced turnaround stage 15.0%
stabilised projects 3.6%
Velbert 5.2%
Duisburg/Essen 8.5%
Wuppertal 8.0%
Mönchengladbach 5.7%
Düsseldorf/Dortmund 28.1%
Erkrath 5.1%
Hürth/Köln/Bonn 5.8%
Braunschweig/Bielefeld 5.4%
Solingen 4.5%
Hamm/ Lünen 2.7%
Berlin 8.3%
Nürnberg 5.2%
Other 7.5%
Residential vacancy rate at the end of FY 2012
Geographical allocation by m² at the end of FY 2012
Key figures current portfolio (January 2013)
In-place average rent (in € per m²) at the end of F Y 2012
Source: GRAND CITY Properties S.A.
21 January 2013
B GRAND CITY Properties S.A.
Page 10/24
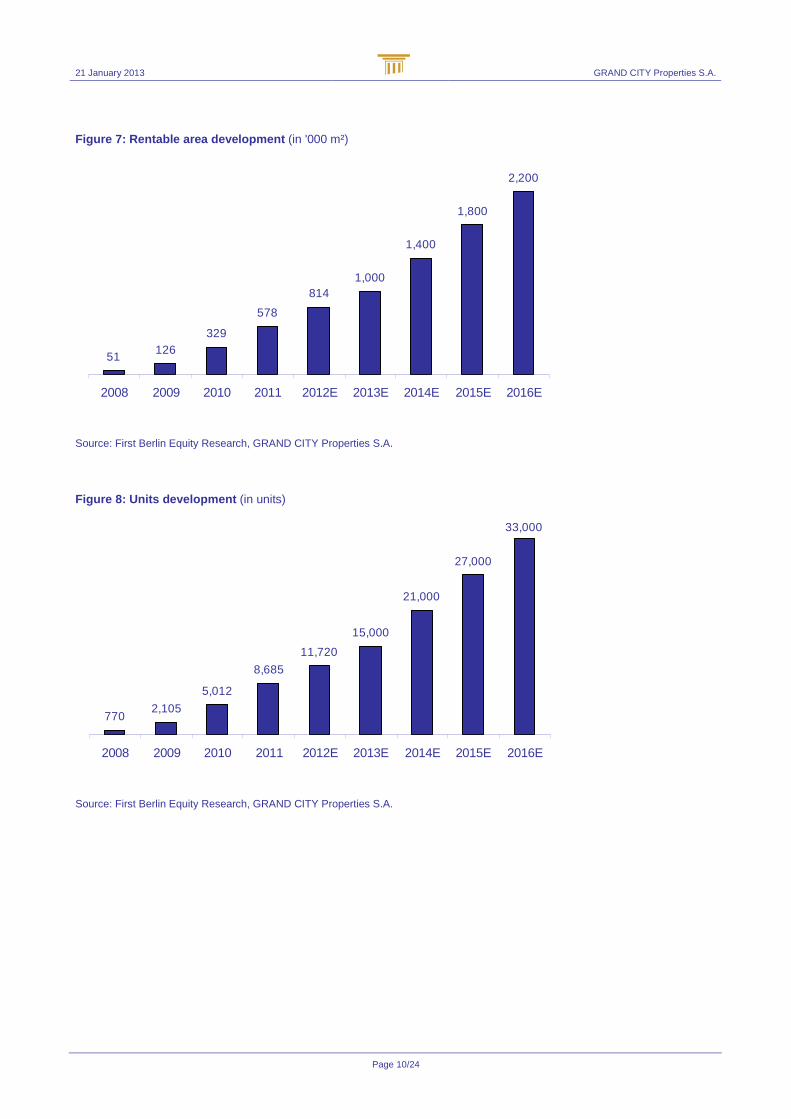
Figure 7: Rentable area development (in '000 m²)
51126
329
578
8141,000
1,400
1,800
2,200
2008 2009 2010 2011 2012E 2013E 2014E 2015E 2016E
Source: First Berlin Equity Research, GRAND CITY Properties S.A.
Figure 8: Units development (in units)
7702,105
5,012
8,685
11,720
15,000
21,000
27,000
33,000
2008 2009 2010 2011 2012E 2013E 2014E 2015E 2016E
Source: First Berlin Equity Research, GRAND CITY Properties S.A.

21 January 2013
B GRAND CITY Properties S.A.
Page 11/24
Figure 9: Gross annual rent development (in €'000)
1,589 3,03410,404
26,402
50,000
85,000
120,000
150,000
190,000
2008 2009 2010 2011 2012E 2013E 2014E 2015E 2016E
(including gross annual rents from equity-accounted subsidiaries)
Source: First Berlin Equity Research, GRAND CITY Properties S.A.
According to company information, GRAND CITY Properties owned a total of 11,720 units with a total rentable area of 814,000m² at the end of FY 2012. As of the mid of January 2013, GCP’s portfolio grew to approximately 15,000 units with a total rentable area of 1,020,622m². Roughly 90% of the current total floor area is residential floor area. The remaining ca. 10% are commercial floor area. Since the company is “re-developing” the real estate properties it acquires, there are three different development stages that are used to classify the properties:
• Early turnaround projects. • Advanced turnaround projects.
• Stabilised projects.
Figure 10: Turnaround stages
0
2,000
4,000
6,000
8,000
10,000
Early turnaround Advanced turnaround Stabilised projects
0%
10%
20%
30%
Number of units Vacancy rate
Source: GRAND CITY Properties S.A.

21 January 2013
B GRAND CITY Properties S.A.
Page 12/24
RECENT DEVELOPMENTS & FINANCING ACTIVITIES
H1 2012 INCOME STATEMENT
H1 2012 revenues (includes net rent and property operating income) increased by 40.5% y/y to €18.29m (H1/11: €13.01m). Operating profit decreased y/y to €54.43m (H1/11: €70.11m) - due mainly to lower capital gains and property revaluation results (-29.1% y/y to €45.71m) as well as higher operating expenditures such as property operating expenses (+43.2% y/y to €8.00m). GRAND CITY Properties’ net financial result was mainly burdened by an extraordinary loss from derivative financial instruments amounting to €3.05m and thus came in below prior year’s level at €-10.37m (H1/11: €-2.67m). At the net level, the company reported income of €36.51m (H1/11: €56.46m).
Figure 11: Income development
30.06.2012 31.12.2011 31.12.2010 31.12.2009 31.12.2008
EBITDA 54,425 84,369 23,529 4,818 5,238
EBT 44,058 70,496 21,369 4,285 4,479
Net profit 36,511 58,637 20,228 4,081 4,083
Financial key figures (in €'000)*
* Since the company acquired 94.8% of Adminond Trading & Investments Ltd. at the begining of 2012, the results for the period 2008-2010 are the results of the financial statements of Adminond Trading & Investments Ltd. and reflect holdings of 100%
Source: First Berlin Equity Research, GRAND CITY Properties S.A.
BALANCE SHEET AS OF 30 JUNE 2012
GRAND CITY Properties’ investment properties were valued at €299.16m (end of FY11: €258.12m) at the end of June 2012. Investments in equity-accounted participations increased to €10.44m (end of FY11: €2.40m). Assets held for sale amounted to €32.15m (end of FY11: €5.40m) at the end of H1 2012. Due to H1’s high level of investments (see next para.) liquid funds as of 30 June 2012 decreased to €3.42m (end of FY11: €8.16m). Due to the April 2012 capital increase (issuance of 45m new shares with a par value per share amounting to €0.10) and the positive H1 2012 result, GRAND CITY Properties’ equity position (attributable to the owners of the company) as of the end of June 2012 increased to €122.84m (end of FY11: €83.35m). Financial liabilities (short- and long-term) increased to €148.84m (end of FY11: €140.75m), net debt at the end of H1 2012 amounted to €145.41m (end of FY11: €132.59m). GRAND CITY Properties’ LTV ratio (loan-to-value: bank liabilities divided by total investments) as of the end of June came in at 48% (end of FY11: 53%). The company’s balance sheet NAV increased to €122.84m (end of FY11: €83.85m).

21 January 2013
B GRAND CITY Properties S.A.
Page 13/24
Figure 12: Balance sheet development
30.06.2012 31.12.2011 31.12.2010 31.12.2009 31.12.2008
Assets
Non-current 314,105 264,690 183,030 58,398 16,112
Current 53,073 25,361 16,484 4,871 1,135
Total assets 367,178 290,051 199,514 63,269 17,247
Equity** 130,130 89,231 43,397 23,139 4,277
Liabilities
Long-term 191,843 182,688 143,585 36,034 11,062
Short-term 45,205 18,132 12,532 4,096 1,908
Total equity and liabilites 367,178 290,051 199,514 63, 269 17,247
Equity ratio** 35.4% 30.8% 21.8% 36.6% 24.8%
LTV (loan-to-value)*** 48% 53% 61% 47% 58%
Balance sheet summary (in €'000)*
* Since the company acquired 94.8% of Adminond Trading & Investments Ltd. at the begining of 2012, the results for the period 2008-2010 are the results of the financial statements of Adminond Trading & Investments Ltd. and reflect holdings of 100%** Including minority interests*** Bank liabilities / total investments
Source: First Berlin Equity Research, GRAND CITY Properties S.A.
H1 2012 CASH FLOW STATEMENT
Even though net profit for the period was below prior year’s level, operating cash flow increased y/y to €10.77m (H1/11: €4.66m) due to the significantly lower adjustments associated with fair value gains on investment property. Due mainly to higher investments in investment property and equity-accounted participations, net cash flow came in at €-4.74m (H1/11: €-4.74m).
JULY 2012 CAPITAL INCREASE
GRAND CITY Properties increased its capital in July 2012. A total of 5.5m new shares were issued to institutional investors through a private placement at €2.75 per share. The company received gross proceeds of €15.13m which will mainly be used for the acquisition of additional real estate properties. Consequently, the number of outstanding shares increased to 55.5m.
OCTOBER 2012 BOND ISSUANCE
At the beginning of October, GRAND CITY Properties announced that it has successfully placed convertible bonds in an aggregate principal amount of €100m to European institutional investors through a private placement. The bonds have a maturity of five years and carry a coupon of 8% per annum. The conversion price of the bonds will be €4.00. GRAND CITY Properties intends to use proceeds form the bonds issuance for the acquisition of real estate portfolios.
JANUARY 2013 PORTFOLIO UPDATE
According to GRAND CITY Properties, the company’s real estate portfolio grew to approximately 15,000 units as of the mid of January 2013. With a floor area of roughly 920,000 m², residential floor area accounted for 90% of GCP’s total portfolio.

21 January 2013
B GRAND CITY Properties S.A.
Page 14/24
ESTIMATES 2012E & SUBSEQUENT YEARS
Fiscal year 2012 We expect revenues (including property operating income) to increase to €38.10m due mainly to the higher number of residential units in GCP’s portfolio. The transactions during the current fiscal year (see GCP forecast on page 10) such as the acquisition of 3,461 residential units in North Rhine-Westphalia will also lead to high fair value gains on investment property, which we forecast to come in at €92.58m (including capital gains). At the operating level, income development is mainly influenced by the increase in property operating expenses to €17.14m. We expect EBIT to come in at €109.84m. Net income after minority interests is forecast to increase to €68.07m or €1.23 per share. Due to the capital increase and the expected positive net income development, GRAND CITY Properties’ equity position will improve to €166.59m at the end of December. Financial debt (short- and long-term) will increase to €271.07m due mainly to the convertible bond issuance. Based on GCP’s debt and equity financing activities during 2012, the company’s cash position is forecast to increase to €79.29m at the end of the year (net cash flow 2012E: €71.13m). The firm’s net debt position at the end of FY 2012 will thus amount to €191.79m. Subsequent years until 2016E Our top-line forecasts for the period 2013E to 2016E are based on an increase in rents (existing portfolio), an increase in occupancy rates (existing portfolio) as well as inorganic growth through further transactions. Property operating income and expenditures are forecast to increase in line with the growth of the portfolio. Since GRAND CITY Properties acquires distressed assets we use a transaction multiple of 9.0x net rent for future acquisitions. With regard to the fair value estimation of the properties (as well as for divestments) we use a net rent multiple of 13.0x. Regarding the duration of the optimisation phase, we assume that it takes GCP on average three years to successfully turn a project around.
Figure 13: Development of revenue and income 2012E t o 2016E
in €'000 2012E 2013E 2014E 2015E 2016E
Revenue (incl. property operating income) 38,098 68,157 103,327 137,218 171,660
Growth rate 44.3% 78.9% 51.6% 32.8% 25.1%
Total revenue (incl. revaluation gains) 130,676 146,879 180,305 218,863 260,064
Growth rate 31.7% 12.4% 22.8% 21.4% 18.8%
Operating income (EBIT) 109,837 115,595 125,718 147,413 170,509
Margin on total revenue 84.1% 78.7% 69.7% 67.4% 65.6%
Net income / loss after minority interests 68,074 77,823 93,349 105,991 120,261
Margin on total revenue 52.1% 53.0% 51.8% 48.4% 46.2%
EPS (in €) 1.23 1.40 1.68 1.91 2.17 Source: First Berlin Equity Research
Detailed information about our forecasts is shown in the financials section at the end of this report (beginning with chapter “Income Statement Analysis”). Any significant delays in implementing the company’s strategy will likely have a significant downside to our estimates as already mentioned in the valuation section.

21 January 2013
B GRAND CITY Properties S.A.
Page 15/24
GERMAN RESIDENTIAL REAL ESTATE MARKET
RESIDENTIAL MARKET
According to Germany’s Federal Institute for Research on Building, Urban Affairs and Spatial Development (“BBSR”), an increasing number of German regions will see decreasing demand in the local housing markets in the future. However, based on the findings of BBSR’s residential market outlook until 2025, building of new residential properties will continue to be important in the next years.
Figure 14: New buildings demand in Germany 2010 to 2025E (in units p.a.)
Western Germany 2010 to 2025 2010 to 2015 2016 to 2020 2021 to 2025
Flats in one- or two-family houses 98,000 103,000 97,000 93,000
Flats in apartment buildings 55,000 56,000 58,000 52,000
Total 154,000 159,000 155,000 145,000
Eastern Germany 2010 to 2025 2010 to 2015 2016 to 2020 2021 to 2025
Flats in one- or two-family houses 17,000 19,000 18,000 14,000
Flats in apartment buildings 12,000 15,000 12,000 10,000
Total 29,000 33,000 30,000 24,000
2010 to 2025 2010 to 2015 2016 to 2020 2021 to 2025
Total 183,000 192,000 185,000 169,000
Source: First Berlin Equity Research, Federal Institute for Research on Building, Urban Affairs and Spatial Development
The currently low number of newly built units per year is expected to lead to a tight market situation for rented apartments and houses - especially in highly populated areas in Germany. In order to supply in particular low-income households with affordable residential property, BBSR expects construction of new properties to increase again in the future.
Figure 15: Key indicators for the German residentia l market (1 of 2)
Indicator Unit GermanyWesternGermany
EasternGermany
Newly built apartments
Residential and non-residential buildings in units 159,832 136,698 23,134
thereof: newly built residential buildings in units 140,096 121,062 19,034
One- or two-family houses in units 85,367 72,263 13,104
Apartment buildings in units 53,014 47,111 5,903
thereof: owner-occupied in units 27,364 25,196 2,168
Residential homes in units 1,715 1,688 27
Source: First Berlin Equity Research, Federal Institute for Research on Building, Urban Affairs and Spatial Development ("KOMPAKT 01/12")

21 January 2013
B GRAND CITY Properties S.A.
Page 16/24
Figure 16: Key indicators for the German residentia l market (2 of 2)
Indicator Unit GermanyWesternGermany
EasternGermany
Housing stock
Total in mn units 39.52 30.81 8.71
One- or two-family houses in mn units 18.63 15.63 3.00
Apartment buildings in mn units 20.89 15.19 5.71
Share of one- or two-family houses in % 47.1% 50.7% 34.4%
Indicator Unit GermanyWesternGermany
EasternGermany
Rent and real estate prices
Rent in new and existing properties (utilities not included) in €/m² 6.20 6.54 5.32
Rent in existing properties (utilities included) in €/m² 7.43 - -
Burden caused by utilities in % 22% 23% 19%
Indicator Unit GermanyWesternGermany
EasternGermany
Vacancy in % 3.7% 2.9% 5.8%
Owner-occupancy in % 43.2% 45.7% 32.5% Source: First Berlin Equity Research, Federal Institute for Research on Building, Urban Affairs and Spatial Development ("KOMPAKT 01/12")
RESIDENTIAL INVESTMENT MARKET
According to BNP Paribas Real Estate, investments in residential portfolios amounted to €8.7bn in 9M 2012. Transaction volume thus more than doubled in y/y comparison (+108%). Volume growth was partly driven by large portfolio transactions such as the Deutsche Wohnen-BauBeCon deal (ca. 23,500 units) for more than €1.2bn or the sale of roughly 21,000 LBBW residential units for more than €1.4bn.
Figure 17: Investments according to asset class in 9M 2012
77.1%
12.2%
8.7%1.6% 1.4%
Existing portfolios
Older properties*
Projects
Modern properties*
Miscellaneous
*Block sales at one location
Source: First Berlin Equity Research, BNP Paribas Real Estate
21 January 2013
B GRAND CITY Properties S.A.
Page 17/24
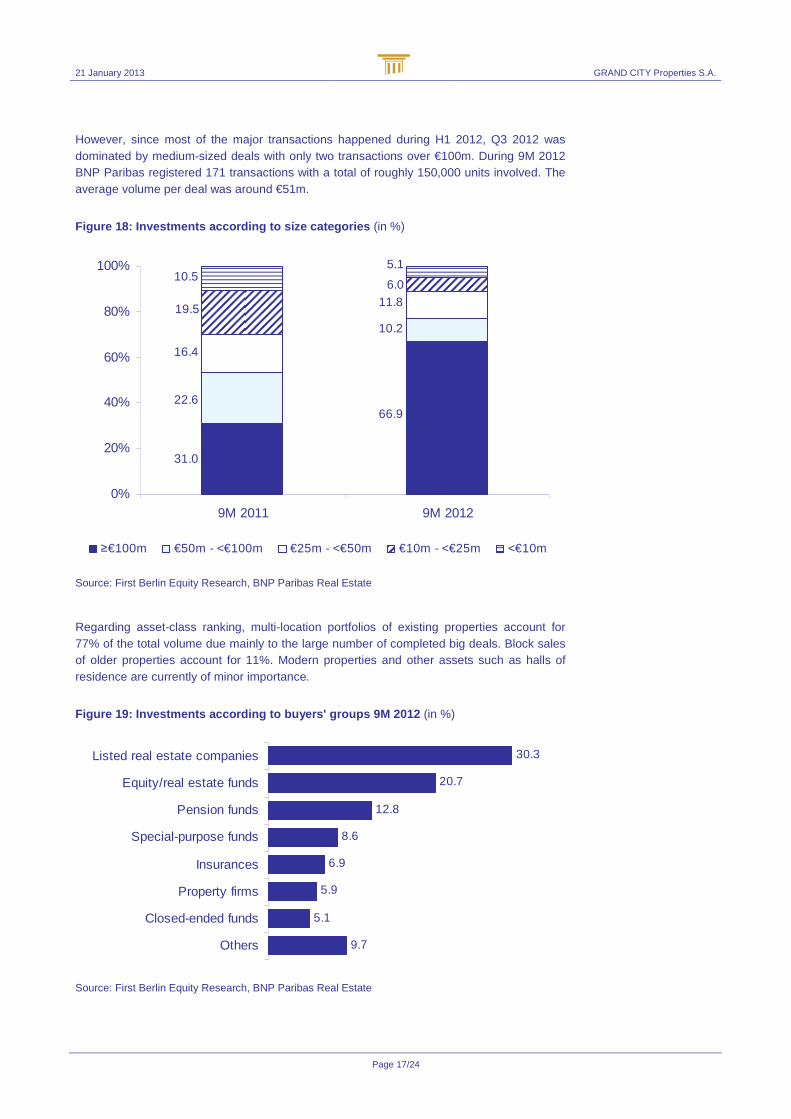
However, since most of the major transactions happened during H1 2012, Q3 2012 was dominated by medium-sized deals with only two transactions over €100m. During 9M 2012 BNP Paribas registered 171 transactions with a total of roughly 150,000 units involved. The average volume per deal was around €51m.
Figure 18: Investments according to size categories (in %)
31.0
66.922.6
10.2
16.4
11.819.5
6.010.5
5.1
0%
20%
40%
60%
80%
100%
9M 2011 9M 2012
≥€100m €50m - <€100m €25m - <€50m €10m - <€25m <€10m
Source: First Berlin Equity Research, BNP Paribas Real Estate
Regarding asset-class ranking, multi-location portfolios of existing properties account for 77% of the total volume due mainly to the large number of completed big deals. Block sales of older properties account for 11%. Modern properties and other assets such as halls of residence are currently of minor importance.
Figure 19: Investments according to buyers' groups 9M 2012 (in %)
30.3
20.7
12.8
8.6
6.9
5.9
5.1
9.7
Listed real estate companies
Equity/real estate funds
Pension funds
Special-purpose funds
Insurances
Property firms
Closed-ended funds
Others
Source: First Berlin Equity Research, BNP Paribas Real Estate

21 January 2013
B GRAND CITY Properties S.A.
Page 18/24
With a 9M 2012 market share of almost 67% of total volume, deals over €100m still dominate the German residential real estate market. Small transactions with a volume of less than €10m account for slightly more than 5% of total turnover. Around half of all 9M 2012 transactions had a volume of under €10m. In 9M 2102, more than half of all residential property investments were made by listed real estate companies (share of more than 30%) and equity/real estate funds (roughly 21%). Pension funds accounted for nearly 13% of the investment volume. German investors are the biggest buyer group in the German residential real estate market (share of 72% in 9M 2012 transaction volume), followed by European investors (slightly more than 14%) and North American investors (14%).
Figure 20: Investments according to origin of capit al in 9M 2012 (in %)
71.7
14.0
14.2
0.1
Germany
North America
Europe
Middle East
Source: First Berlin Equity Research, BNP Paribas Real Estate
Purchase prices remained stable in Q3 2012. In the most important market segment - portfolios of existing properties - prices generally ranged between €700 and €850 per m². The highest per m² selling prices were recorded in the project development segment at major German investment locations. Project developments were traded between €3,300 to €3,500 per m² with significantly higher selling prices for top properties in Germany’s top locations (“A” locations such as Munich or Hamburg). According to BNP Paribas’ forecast for Germany’s residential real estate market in fiscal year 2012, it is likely that the €10bn threshold will be crossed. Based on foreseeable major deals, dynamic market activity especially in the small-sized segment and a growing interest of foreign investors to invest in stable, safe German residential properties, sustained high transaction volumes are also forecast for the medium-term.

21 January 2013
B GRAND CITY Properties S.A.
Page 19/24
MANAGEMENT TEAM
Yakir Gabay, Founder & Managing Partner Yakir Gabay is founder and managing partner of GRAND CITY Group since 2004. Before, Mr Gabay was chairman & managing partner of an investment company traded on the Tel Aviv stock exchange, which managed more than $30bn of assets. Prior to that, he was CEO of Israeli Bank Leumi’s investment banking. Yakir holds a BA in Accounting and Economics, an MBA and is also Certified Public Accountant (CPA). Rafael Zamir, CFO Rafael joined the company in 2012. Prior to that, he worked as manager for Ernst & Young in the real-estate and financial institutions sectors. Mr Zamir holds an MBA and is also a CPA. Shmuel Mayo, COO Mr Mayo has been with GRAND CITY Group since 2006. Prior to that, Shmuel has held the position of the CEO of Dankner Group, a leading Israeli international investment conglomerate with more than $8bn of assets under management. Shmuel holds a BA in economy and accounting, a BA in law and CPA from Bar Ilan University. Ran Laufer, Head of Marketing Ran joined GRAND CITY Properties in 2010. His prior experience includes working as a senior consultant at the Reuven Schilo Financial Consultancy, as marketing & sales manager at the U. Dori Group as well as deputy and marketing manager at Industrial Buildings Corporation, a leading Israeli real estate company. Michael Schill, Head of Operations Mr Schill joined GRAND CITY Properties in 2010. Michael is experienced in asset and property management. Before joining GRAND CITY Properties, Michael worked for the Habarent Group, where he managed a residential and commercial real estate portfolio with a rental area of 350,000m². David Netzer, Head of Accounting Mr Netzer joined GRAND CITY Properties in 2011. Before, David worked for KPMG in the real-estate and financial institutions sectors. He holds an MBA and is also CPA. Or Zohar, Head of Business Development Prior to working for GRAND CITY Properties, Mr Zohar held positions as head of business development at Mark Hotels GmbH and as Managing Director in Bluebay Gmbh. He holds a BSc and a MA in real estate and finance.

21 January 2013
B GRAND CITY Properties S.A.
Page 20/24
SHAREHOLDERS, STOCK & BOND INFORMATION
Stock Information
ISIN LU0775917882
WKN A1JXCV
Bloomberg ticker GYC
No. of issued shares 55,500,000
Transparency standard Entry Standard
Country Luxembourg
Sector Financial Services
Subsector Real Estate
Source: Börse Frankfurt, GRAND CITY Properties S.A.
Bond Information
ISIN XS0839410221
WKN A1HBF8
Bloomberg ticker GYCA
No. of issued bonds 1,000 à €100,000
Coupon 8.00%
Maturity 5 years
Redemption 15 October 2017
Transparency standard Open Market
Source: Börse Frankfurt, GRAND CITY Properties S.A.
Shareholder Structure
Edolaxia Ltd. 45.0%
Valuemonth Ltd. 21.2%
Ramzico Ltd. 5.6%
Zanelo Ltd. 2.7%
Free Float 25.5%
Source: GRAND CITY Properties S.A.

21 January 2013
B GRAND CITY Properties S.A.
Page 21/24
INCOME STATEMENT ANALYSIS
All figures in EUR '000 2012E 2013E 2014E 2015E 2016E
Revenue including property operating income 38,098 68 ,157 103,327 137,218 171,660
Capital gains and property revaluation 92,578 78,722 76,978 81,645 88,405
Total revenues 130,676 146,879 180,305 218,863 260,064
Property operating expenses 17,144 25,900 40,814 53,515 66,947
Personnel expenses 1,219 1,295 1,374 1,468 1,579
Other operating income (expense) -2,476 -4,089 -12,399 -16,466 -21,028
Operating income (EBIT) 109,837 115,595 125,718 147,413 170,509
Net financial result * -17,282 -10,073 -12,361 -19,017 -25,179
Pre-tax income (EBT) 92,555 105,522 113,357 128,396 145,331
Deferred and current tax expenses -14,670 -16,725 -17,967 -20,351 -23,035
Income / loss for the year 77,885 88,797 95,390 108,046 122,296
Minority interests -9,811 -10,974 -2,040 -2,054 -2,035
Net income / loss after minority interets 68,074 77,8 23 93,349 105,991 120,261
EPS (in €) 1.23 1.40 1.68 1.91 2.17
* 2012E includes extraordinary item associated with hedging expenses
Ratios
EBIT margin 84.1% 78.7% 69.7% 67.4% 65.6%
Net margin 52.1% 53.0% 51.8% 48.4% 46.2%
Tax rate 15.9% 15.9% 15.9% 15.9% 15.9%
Expenses as % of revenues
Personnel expenses 3.2% 1.9% 1.3% 1.1% 0.9%
Y-Y Growth
Total revenues 31.7% 12.4% 22.8% 21.4% 18.8%
Operating income 30.2% 5.2% 8.8% 17.3% 15.7%
Net income/ loss after minority interests 22.5% 14.3% 20.0% 13.5% 13.5%

21 January 2013
B GRAND CITY Properties S.A.
Page 22/24
BALANCE SHEET ANALYSIS
All figures in EUR '000 2012E 2013E 2014E 2015E 2016E
Assets
Current assets, total 94,423 33,714 28,624 27,677 33,145
Cash and cash equivalents 79,288 18,402 13,054 11,888 17,155
Other current assets 15,135 15,312 15,570 15,789 15,990
Non-current assets, total 431,630 612,853 834,794 1,052 ,410 1,290,170
Investment property (incl. PP&E) 415,130 592,496 814,437 1,032,053 1,269,813
Goodwill & other intangibles 67 67 67 67 67
Investments in subsidiaries 14,238 18,095 18,095 18,095 18,095
Other assets 2,195 2,195 2,195 2,195 2,195
Total assets 526,053 646,568 863,417 1,080,087 1,323,315
Shareholders' equity & debt
Current liabilities, total 21,979 22,110 22,111 22,281 122,553
Short-term debt 0 0 0 0 100,000
Accounts payable 18,318 18,449 18,450 18,620 18,892
Current provisions 3,661 3,661 3,661 3,661 3,661
Long-term liabilities, total 317,886 353,469 478,923 59 1,373 616,030
Long-term debt 271,073 298,149 426,149 544,649 568,649
Other liabilities 46,813 55,320 52,774 46,724 47,381
Minority interests 19,599 30,573 32,614 34,668 36,703
Shareholders' equity 166,589 240,415 329,770 431,765 548,029
Total consolidated equity and debt 526,053 646,568 863 ,417 1,080,087 1,323,315
Ratios
Current ratio 4.30 1.52 1.29 1.24 0.27
Quick ratio 4.30 1.52 1.29 1.24 0.27
Financial leverage 3.16 2.69 2.62 2.50 2.41
Book value per share 3.00 4.33 5.94 7.78 9.87
Net debt 191,785 279,747 413,095 532,761 651,494
Return on equity (ROE) 40.9% 32.4% 28.3% 24.5% 21.9%

21 January 2013
B GRAND CITY Properties S.A.
Page 23/24
CASH FLOW ANALYSIS
All figures in EUR '000 2012E 2013E 2014E 2015E 2016E
EBIT 109,837 115,595 125,718 147,413 170,509
Depreciation and amortisation 0 0 0 0 0
EBITDA 109,837 115,595 125,718 147,413 170,509
Changes in working capital 1,400 -46 -257 -50 71
Other adjustments -73,165 -71,123 -65,776 -63,370 -68,220
Operating cash flow 38,071 44,426 59,685 83,993 102,360
(Maintenance) CAPEX -2,514 -2,249 -3,513 -3,842 -4,806
Free cash flow 35,557 42,177 56,172 80,151 97,554
Debt financing, net 113,401 44,000 128,000 118,500 124,000
Equity financing, net 15,125 0 0 0 0
Other changes in cash -92,953 -147,062 -189,520 -199,817 -216,287
thereof: acquisitions & disposals, net -68,977 -127,821 -166,232 -173,245 -186,763
Net cash flows 71,130 -60,886 -5,348 -1,166 5,267
Cash, start of the year 8,158 79,288 18,402 13,054 11,888
Cash, end of the year 79,288 18,402 13,054 11,888 17,155
Y-Y Growth
Operating cash flow 155.0% 16.7% 34.3% 40.7% 21.9%
Free cash flow 139.5% 18.6% 33.2% 42.7% 21.7%

21 January 2013 GRAND CITY Properties S.A.
FIRST BERLIN Equity Research
Page 24/24
FIRST BERLIN RECOMMENDATION & PRICE TARGET HISTORY Report
No.: Date of
publication Previous day closing price Recommendation Price
target
Initial Report 21 January 2013 €4.37 Buy €14.30
Jens Hasselmeier First Berlin Equity Research GmbH Mohrenstraße 34 10117 Berlin Tel. +49 (0)30 - 80 93 96 83 Fax +49 (0)30 - 80 93 96 87 [email protected] www.firstberlin.com FIRST BERLIN POLICY In an effort to assure the independence of First Berlin research neither analysts nor the company itself trade or own securities in subject companies. In addition, analysts’ compensation is not directly linked to specific financial transactions, trading revenue or asset management fees. Analysts are compensated on a broad range of benchmarks. Furthermore, First Berlin receives no compensation from subject companies in relation to the costs of producing this report.
ANALYST CERTIFICATION I, Jens Hasselmeier, certify that the views expressed in this report accurately reflect my personal and professional views about the subject company; and I certify that my compensation is not directly linked to any specific financial transaction including trading revenue or asset management fees; neither is it directly or indirectly related to the specific recommendation or views contained in this research. In addition, I possess no shares in the subject company.
INVESTMENT RATING SYSTEM First Berlin’s investment rating system is five tiered and includes an investment recommendation and a risk rating. Our recommendations, which are a function of our expectation of total return (forecast price appreciation and dividend yield) in the year specified, are as follows:
STRONG BUY: Expected return greater than 50% and a high level of confidence in management’s financial guidance BUY: Expected return greater than 25% ADD: Expected return between 0% and 25% REDUCE: Expected negative return between 0% and -15% SELL: Expected negative return greater than -15%
Our risk ratings are Low, Medium, High and Speculative and are determined by ten factors: corporate governance, quality of earnings, management strength, balance sheet and financing risk, competitive position, standard of financial disclosure, regulatory and political uncertainty, company size, free float and other company specific risks. These risk factors are incorporated into our valuation models and are therefore reflected in our price targets. Our models are available upon request to First Berlin clients.
Up until 16 May 2008, First Berlin’s investment rating system was three tiered and was a function of our expectation of return (forecast price appreciation and dividend yield) over the specified year. Our investment ratings were as follows: BUY: expected return greater than 15%; HOLD: expected return between 0% and 15%; and SELL: expected negative return.
ADDITIONAL DISCLOSURES First Berlin’s research reports are for qualified institutional investors only.
This report is not constructed as an offer to sell or the solicitation of an offer to buy any security in any jurisdiction where such an offer would be illegal. We are not soliciting any action based upon this material. This material is for the general information of clients of First Berlin. It does not take into account the particular investment objectives, financial situation or needs of individual clients. Before acting on any advice or recommendation in this material, a client should consider whether it is suitable for their particular circumstances and, if necessary, seek professional advice. The material is based upon information that we consider reliable, but we do not represent that it is accurate or complete, and it should be relied upon as such. Opinions expressed are our current opinions as of the date appearing on this material only; such opinions are subject to change without notice.
Copyright © 2012 First Berlin Equity Research GmbH. All rights reserved. No part of this material may be copied, photocopied or duplicated in any form by any means or redistributed without First Berlin’s prior written consent. The research is not for distribution in the USA or Canada. When quoting please cite First Berlin as the source. Additional information is available upon request.