grain transportation report - agricultural marketing … 2, 2017 grain transportation report 2...
TRANSCRIPT

A weekly publication of the Agricultural Marketing Service
www.ams.usda.gov/GTR
November 2, 2017
Contents
Article/
Calendar
Grain
Transportation
Indicators
Rail
Barge
Truck
Exports
Ocean
Brazil
Mexico
Grain Truck/Ocean
Rate Advisory
Datasets
Specialists
Subscription
Information
--------------
The next
release is November 9, 2017
Preferred citation: U.S. Dept. of Agriculture, Agricultural Marketing Service. Grain Transportation Report. November 2, 2017.
Web: http://dx.doi.org/10.9752/TS056.11-02-2017
Grain Transportation Report
WEEKLY HIGHLIGHTS
Weekly Grain Inspections Up for Wheat
For the week ending October 26, total inspections of grain (corn, wheat, and soybeans) for export from all major U.S. export regions
reached 3.42 million metric tons (mmt), up 1 percent from the previous week, down 21 percent from the same time last year, and
unchanged from the 3-year average. Total inspections of wheat jumped 85 percent from the previous week as shipments to Asia and
Latin America increased. Soybeans inspections were unchanged from the past week, but inspections of corn decreased 19 percent
from the previous week due primarily to lower shipments of corn destined to Latin America. Although Pacific Northwest (PNW)
inspections increased 16 percent from the past week, inspections in the Mississippi Gulf decreased 20 percent for the same period.
Outstanding (unshipped) export sales continued to increase for wheat and corn, but were down for soybeans.
Corn Harvest Behind as End of Upper Mississippi River Navigation Season Approaches As of October 29, USDA’s Crop Progress report showed the corn crop was 54 percent harvested, 16 points higher than last week, but
18 percentage points less than the 5-year average pace of 72 percent. All of the top four corn producing States—Illinois, Iowa,
Nebraska, and Minnesota—are behind the average pace for this time of the year. Iowa’s corn crop is only 44 percent harvested
compared to the average of 70 percent, and corn in Illinois is 73 percent harvested compared to the average of 84 percent. The
Nebraska corn harvest is 45 percent complete compared to its average pace of 67 percent. Corn in Minnesota has the lowest harvest
pace of the top four States with 38 percent compared to a 73 percent average. Corn shippers using the Upper Mississippi River have a
narrowing time frame for barging grain as the navigation season nears its winter closure (typically late November through late
February). In preparation of the closing of the Upper Mississippi River, barges in the St. Paul, MN, area will begin their final
departure for southern destinations starting mid-November.
Georgia Ports Authority Prepares for Rail Expansion and Port Deepening
The Georgia Port Authority (GPA) is preparing to start an extensive rail expansion project at the Port of Savannah, according to
Lloyd’s List. The project is slated to begin during the first quarter of 2018 and is expected to be completed at the end of 2020. The
GPA expansion is expected to increase the port’s cargo container volumes transported to inland markets. The additional tracks added
to the Savannah terminal are expected to accommodate 10,000-ft trains. In addition to the rail expansion, the Port of Savannah has
ordered 10 cranes to serve the larger post-Panamax size container ships, to be delivered from 2018 to 2020. The port is also preparing
to deepen and widen the outer harbor to 49 feet at low tide and 56 feet at high tide; and the inner harbor to 47 feet at low tide and 54
feet at high tide. An additional railyard at the Appalachian Regional Port in Chatsworth, GA, is also being scheduled for completion at
the end of 2018.
Snapshots by Sector
Export Sales
For the week ending October 19, unshipped balances of wheat, corn, and soybeans totaled 35.5 mmt, down 19 percent from the same
time last year. Net weekly wheat export sales were .361 mmt, down 43 percent from the previous week. Net corn export sales were
1.29 mmt, up 4 percent from the previous week, and net soybean export sales were 2.13 mmt for the same period, up 66 percent from
the previous week.
Rail
U.S. Class I railroads originated 24,018 grain carloads for the week ending October 21, up 10 percent from the previous week, down
9 percent from last year, and down 2 percent from the 3-year average.
Average November shuttle secondary railcar bids/offers per car were $116 below tariff for the week ending October 26, down $41
from last week, and $122 lower than last year. There were no non-shuttle bids/offers this week.
Barge For the week ending October 28, barge grain movements totaled 866,289 tons, 57 percent higher than the previous week, and down
32 percent from the same period last year.
For the week ending October 28, 546 grain barges moved down river, up 56 percent from last week. 875 grain barges were unloaded
in New Orleans, down 14 percent from the previous week.
Ocean
For the week ending October 26, 35 ocean-going grain vessels were loaded in the Gulf, 19 percent less than the same period last year.
Fifty vessels are expected to be loaded within the next 10 days, 35 percent less than the same period last year.
For the week ending October 26, the ocean freight rate for shipping bulk grain from the Gulf to Japan was $43.50 per metric ton, 1
percent less than the previous week. The cost of shipping from the PNW to Japan was $24.75 per metric ton, 3 percent less than the
previous week.
Fuel
During the week ending October 30, average diesel fuel prices increased 2 cents from the previous week to $2.82 per gallon, 34 cents
above the same week last year.
Contact Us

November 2, 2017
Grain Transportation Report 2
Feature Article/Calendar
Transportation of U.S. Grains: A Modal Share Analysis, 1978-2014 Update
On October 30, USDA’s Agricultural Marketing Service issued an update to its modal share report,
Transportation of U.S. Grains: A Modal Share Analysis, 1978-2014 Update. This report provides estimates of
the volumes of corn, wheat, soybeans, sorghum, and barley moved to either domestic markets or to U.S.
ports/border points for export between 1978 and 2014 via rail, barge, and truck. Such data can be used to
examine trends in the type and share of transportation used to move major grains and oilseeds over time. The
update provides new 2014 data and minor revisions to earlier years in a few instances. The purpose of this
article is to present key findings of the modal share report, with an emphasis on changes or trends related to
the 2014 data.
Data Methodology
Total movements are derived from USDA data on crop disappearance and amount used on-farm.
Transportation data for barge shipments come from the U.S. Army Corps of Engineers (Waterborne
Commerce Statistics) and for rail shipments, the U.S. Surface Transportation Board (Carload Waybill
Sample). Trucking data are
calculated as the residual
quantity from subtracting the
estimated rail and barge
volumes from total
movements. Detail of data
methodology is included in
the appendix of the report.
Modal Highlights
Trucks continued to be the
leading mode of grain
transportation, moving about
62 percent of total U.S. grain
in 2014, 2 percentage points
below 2013 (Figure 1).
Barges moved 14 percent of
the grain tonnage in 2014, an
increase of 2 percentage
points from the previous
year. Rail’s share was
unchanged from the previous
year, accounting for 24
percent of total grain
movements in 2014.
During 2011 to 2013, flood
and drought conditions
impacted the volumes of
grain shipments by rail and
barge. However, in 2014
with bigger crops and better
weather, the rail and barge
shipments recovered with a
14 percent increase. Figure 2
shows the decreases in
tonnages that occurred in
2011 to 2013 and the
Figure 1: U.S. grain shipments by mode
Source: Various sources, see Appendix A: Modal Share Methodology
Figure 2: U.S. grain shipments by commodity, 2004-2014
Source: Various sources, see Appendix A: Modal Share Methodology
0
100
200
300
400
500
600
2004
2005
2006
2007
2008
2009
2010
2011
2012
2013
2014
Mil
lio
n T
on
s
Corn Soybeans
Wheat Sorghum
Barley All Grains

November 2, 2017
Grain Transportation Report 3
rebound in 2014. In 2014, corn was the principal crop transported with 64 percent of total grain tonnages,
soybeans were second with 21 percent, and wheat was third with 12 percent.
Table 1 summarizes the modal share by export and domestic market for major crops. Barge and rail generally
supply export markets, while trucks mainly support grain movements to domestic markets. For example,
barge is the leading mode of transport for export-bound corn and soybeans while rail moves most of the
export-bound wheat. Truck, on the other hand, is the leading mode of domestic transportation for all major
grains (79 percent in 2014). The use of trucks to transport grain allows farmers the flexibility of delivering
their products to a variety of domestic markets to enhance their profits. However, a comparison between the
2014 and 5-year averages suggests rail has been losing some of its market share to barge and truck between
2009 and 2014.
Crop Highlights
Corn
In 2014, corn was the principal crop transported across all modes, representing 64 percent of total grain
tonnages, followed by soybeans (21 percent), and wheat (12 percent).
Barge is the principal mode of transportation for export-bound corn. Barge’s share of corn movements in
2014 (61 percent) was 4 percentage points higher than the 5 year average, suggesting an increasing share of
U.S. corn exports moved by barges between 2009 and 2014. Truck is the major mode of transportation for
domestic corn movements. The share of domestic corn movements by truck since 2006 (71 percent) has
generally been rising, with the highest share reached in 2013 and 2014 at 82 percent.
Wheat
Rail is the principal mode of transportation for both export and domestic movements of wheat, moving more
than 50 percent of total wheat movements in 2014. Truck’s share of domestic wheat movements was 46
percent in 2014, continuing a decade-long trend in increased domestic truck movements of wheat. Barge
contributed 33 percent of export wheat movements in 2014, but its share for domestic wheat movements
remained insignificant. This is because most of the Nation’s wheat is not produced near major inland
waterways.
Soybeans
Barge is the principal mode of transportation for export-bound soybeans (48 percent in 2014), an increase
from 2013 but still lower than the 5-year average. Truck remained the leading mode of transportation for
domestic soybean movements (85 percent). The percentage of soybeans moving by rail remained constant at
21 percent from 2013 to 2014, but by losing some of its domestic market share and adding export market
share.
The latest report and accompanying datasets can be viewed online at Transportation of U.S. Grains: A Modal
Share Analysis, 1978-2014 Update.
[email protected], [email protected], [email protected]
Table 1: Modal share by export and domestic market for major crops (in percentage), 2014 and 5-year average (2009-13)
Exports Domestic All Corn Exports Domestic All Wheat Exports Domestic All Soybeans Exports Domestic All Grains
2014 Rail 27 18 19 55 52 54 31 12 21 36 20 24
Barge 61 0 10 33 2 16 48 3 25 48 1 14
Truck 12 82 71 12 46 30 20 85 54 16 79 62
Total 100 100 100 100 100 100 99 100 100 100 100 100
5-yr Avg Rail 33 19 21 61 63 62 37 14 24 42 23 28
Barge 57 1 9 31 2 16 49 3 24 46 1 13
Truck 9 80 70 7 35 22 14 84 52 12 76 60
Total 99 100 100 99 100 100 100 101 100 100 100 101
Note: Totals may not add to 100 due to rounding
Corn Wheat Soybeans All GrainsMode

November 2, 2017
Grain Transportation Report 4
Grain Transportation Indicators
The grain bid summary illustrates the market relationships for commodities. Positive and negative adjustments in differential be-
tween terminal and futures markets, and the relationship to inland market points, are indicators of changes in fundamental market
supply and demand. The map may be used to monitor market and time differentials.
Table 1
Grain Transport Cost Indicators1
Truck Barge Ocean
For the week ending Unit Train Shuttle Gulf Pacific
11/01/17 189 265 209 246 195 1761% # D IV / 0 ! 11% - 1% - 3 %
10/25/17 188 267 211 222 197 181
1Indicator: Base year 2000 = 100; Weekly updates include truck = diesel ($/gallon); rail = near-month secondary rail market bid and monthly tariff rate
with fuel surcharge ($/car); barge = Illinois River barge rate (index = percent of tariff rate); and ocean = routes to Japan ($/metric ton)
Source: Transportation & Marketing Programs/AMS/USDA
Rail
Table 2
Market Update: U.S. Origins to Export Position Price Spreads ($/bushel)
Commodity Origin--Destination 10/27/2017 10/20/2017
Corn IL--Gulf -0.59 -0.65
Corn NE--Gulf -0.69 -0.73
Soybean IA--Gulf -1.05 -1.10
HRW KS--Gulf -2.73 -2.68
HRS ND--Portland -1.89 -1.84
Note: nq = no quote; n/a = not available
Source: Transportation & Marketing Programs/AMS/USDA
Figure 1
Grain Bid Summary
November 2, 2017
Grain Transportation Report 5
Rail Transportation
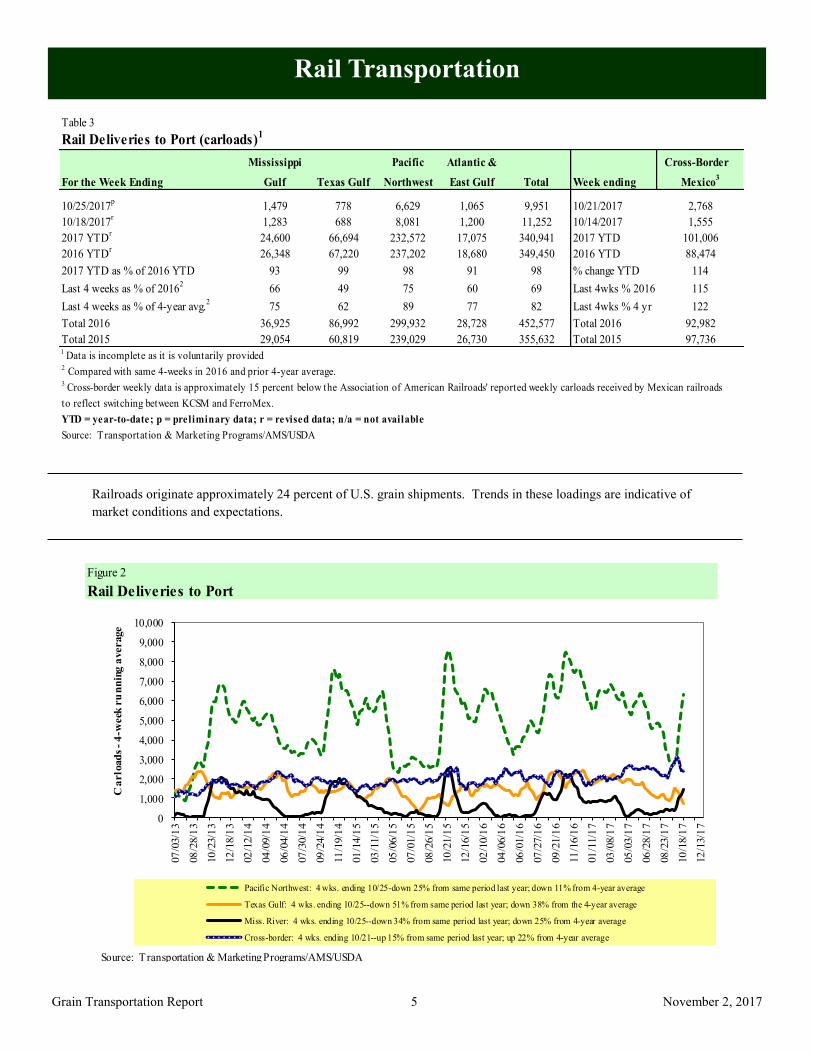
Railroads originate approximately 24 percent of U.S. grain shipments. Trends in these loadings are indicative of
market conditions and expectations.
Figure 2
Rail Deliveries to Port
0
1,000
2,000
3,000
4,000
5,000
6,000
7,000
8,000
9,000
10,000
07
/03/1
3
08
/28/1
3
10
/23/1
3
12
/18/1
3
02
/12/1
4
04
/09/1
4
06
/04/1
4
07
/30/1
4
09
/24/1
4
11
/19/1
4
01
/14/1
5
03
/11/1
5
05
/06/1
5
07
/01/1
5
08
/26/1
5
10
/21/1
5
12
/16/1
5
02
/10/1
6
04
/06/1
6
06
/01/1
6
07
/27/1
6
09
/21/1
6
11
/16/1
6
01
/11/1
7
03
/08/1
7
05
/03/1
7
06
/28/1
7
08
/23/1
7
10
/18/1
7
12
/13/1
7
Ca
rlo
ad
s -
4-w
eek
ru
nn
ing
average
Pacific Northwest: 4 wks. ending 10/25-down 25% from same period last year; down 11% from 4-year average
Texas Gulf: 4 wks. ending 10/25--down 51% from same period last year; down 38% from the 4-year average
Miss. River: 4 wks. ending 10/25--down 34% from same period last year; down 25% from 4-year average
Cross-border: 4 wks. ending 10/21--up 15% from same period last year; up 22% from 4-year average
Source: Transportation & Marketing Programs/AMS/USDA
Table 3
Rail Deliveries to Port (carloads)1
Mississippi Pacific Atlantic & Cross-Border
For the Week Ending Gulf Texas Gulf Northwest East Gulf Total Week ending Mexico3
10/25/2017p
1,479 778 6,629 1,065 9,951 10/21/2017 2,768
10/18/2017r
1,283 688 8,081 1,200 11,252 10/14/2017 1,555
2017 YTDr
24,600 66,694 232,572 17,075 340,941 2017 YTD 101,006
2016 YTDr
26,348 67,220 237,202 18,680 349,450 2016 YTD 88,474
2017 YTD as % of 2016 YTD 93 99 98 91 98 % change YTD 114
Last 4 weeks as % of 20162
66 49 75 60 69 Last 4wks % 2016 115
Last 4 weeks as % of 4-year avg.2
75 62 89 77 82 Last 4wks % 4 yr 122
Total 2016 36,925 86,992 299,932 28,728 452,577 Total 2016 92,982
Total 2015 29,054 60,819 239,029 26,730 355,632 Total 2015 97,7361 Data is incomplete as it is voluntarily provided2 Compared with same 4-weeks in 2016 and prior 4-year average.
3 Cross-border weekly data is approximately 15 percent below the Association of American Railroads' reported weekly carloads received by Mexican railroads
to reflect switching between KCSM and FerroMex.
YTD = year-to-date; p = preliminary data; r = revised data; n/a = not available
Source: Transportation & Marketing Programs/AMS/USDA

November 2, 2017
Grain Transportation Report 6
Table 4
Class I Rail Carrier Grain Car Bulletin (grain carloads originated)
For the week ending:
10/21/2017 CSXT NS BNSF KCS UP CN CP
This week 2,617 2,977 11,558 1,238 5,628 24,018 4,806 5,674
This week last year 2,999 4,038 11,186 1,055 7,162 26,440 5,877 4,416
2017 YTD 70,405 115,048 465,609 40,552 238,764 930,378 159,283 195,056
2016 YTD 74,078 117,674 470,529 36,613 239,052 937,946 149,635 185,149
2017 YTD as % of 2016 YTD 95 98 99 111 100 99 106 105
Last 4 weeks as % of 2016* 86 80 93 113 78 87 76 111
Last 4 weeks as % of 3-yr avg.** 89 91 103 113 92 97 85 115
Total 2016 95,179 151,020 590,779 45,246 300,836 1,183,060 193,788 234,738
*The past 4 weeks of this year as a percent of the same 4 weeks last year.
**The past 4 weeks as a percent of the same period from the prior 3-year average. YTD = year-to-date.
Source: Association of American Railroads (www.aar.org)
East WestU.S. total
Canada
Figure 3
Total Weekly U.S. Class I Railroad Grain Car Loadings
15,000
17,000
19,000
21,000
23,000
25,000
27,000
29,000
Car
load
s
Prior 3-year, 4-week average Current 4-week average
For the 4 weeks ending October 21, grain carloadings were up 5 percent from the previous week, down 13 percent from last year, and down 3 percent from the 3-year average.
Source: Association of American Railroads
Table 5
Railcar Auction Offerings1
($/car)2
Nov-17 Nov-16 Dec-17 Dec-16 Jan-18 Jan-17 Feb-18 Feb-17
CO T grain units no bids 0 no bids no bids no bids no bids no bids no bids
CO T grain single-car5 0 111 0 49 no bids 6 no bids 4
GCAS/Region 1 no bids no bids no bids no bids no bids no offer n/a n/a
GCAS/Region 2 no bids no bids no bids no bids no bids no offer n/a n/a
1Auctio n o fferings a re fo r s ingle-car and unit tra in s hipments o nly.2Average premium/dis co unt to ta riff, las t auc tio n
3BNSF - COT = Certifica te o f Trans po rta tio n; no rth gra in and s o uth gra in bids were co mbined effec tive the week ending 6/24/06.
4UP - GCAS = Grain Car Allo ca tio n Sys tem
Regio n 1 inc ludes : AR, IL, LA, MO, NM, OK, TX, WI, and Duluth, MN.
Regio n 2 inc ludes : CO, IA, KS, MN, NE, WY, and Kans as City and St. J o s eph, MO.
5Range is s ho wn becaus e average is no t ava ilable . No t ava ilable = n/a .
So urce : Trans po rta tio n & Marketing P ro grams /AMS/USDA.
UP4
Delivery period
BNSF3
For the week ending:
10/26/2017

November 2, 2017
Grain Transportation Report 7
The secondary rail market information reflects trade values for service that was originally purchased from the railroad carrier as
some form of guaranteed freight. The auction and secondary rail values are indicators of rail service quality and demand/
supply.
Figure 4
Bids/Offers for Railcars to be Delivered in November 2017, Secondary Market
-500
0
500
1000
1500
2000
3/3
0/2
017
4/1
3/2
017
4/2
7/2
017
5/1
1/2
017
5/2
5/2
017
6/8
/201
7
6/2
2/2
017
7/6
/201
7
7/2
0/2
017
8/3
/201
7
8/1
7/2
017
8/3
1/2
017
9/1
4/2
017
9/2
8/2
017
10/1
2/2
017
10/2
6/2
017
11
/9/2
017
Aver
age
pre
miu
m/d
isco
unt
to tar
iff
($/c
ar)
Shuttle Non-Shuttle
Shuttle prior 3-yr avg. (same week) Non-Shuttle prior 3-yr avg. (same week)10/26/2017
Non-shuttle bids include unit-train and single-car bids. n/a = not available.Source: Transportation & Marketing Programs/AMS/USDA
n/a
UPBNSF
-$156
n/a
-$75Shuttle
Non-Shuttle
There were no Non-Shuttle bids/offers this week.Average Shuttle bids/offers fell $41 this week and are $478 below the peak.
Figure 5
Bids/Offers for Railcars to be Delivered in December 2017, Secondary Market
-400
-200
0
200
400
600
800
1000
1200
1400
5/4
/201
7
5/1
8/2
017
6/1
/201
7
6/1
5/2
017
6/2
9/2
017
7/1
3/2
017
7/2
7/2
017
8/1
0/2
017
8/2
4/2
017
9/7
/201
7
9/2
1/2
017
10
/5/2
017
10/1
9/2
017
11
/2/2
017
11/1
6/2
017
11/3
0/2
017
12/1
4/2
017
Aver
age
pre
miu
m/d
isco
unt
to tar
iff
($/c
ar)
Shuttle Non-Shuttle
Shuttle prior 3-yr avg. (same week) Non-Shuttle prior 3-yr avg. (same week)10/26/2017
Non-shuttle bids include unit-train and single-car bids. n/a = not available.Source: Transportation & Marketing Programs/AMS/USDA
n/a
UPBNSF
-$150
n/a
-$206Shuttle
Non-Shuttle
There were no Non-Shuttle bids/offers this week.Average Shuttle bids/offers rose $22 this week and are $178 below the peak.

November 2, 2017
Grain Transportation Report 8
Figure 6
Bids/Offers for Railcars to be Delivered in January 2018, Secondary Market
-200
0
200
400
600
800
1000
1200
6/1
/201
7
6/1
5/2
017
6/2
9/2
017
7/1
3/2
017
7/2
7/2
017
8/1
0/2
017
8/2
4/2
017
9/7
/201
7
9/2
1/2
017
10
/5/2
017
10/1
9/2
017
11
/2/2
017
11/1
6/2
017
11/3
0/2
017
12/1
4/2
017
12/2
8/2
017
1/1
1/2
018
Aver
age
pre
miu
m/d
isco
unt
to tar
iff
($/c
ar)
Shuttle Non-Shuttle
Shuttle prior 3-yr avg. (same week) Non-Shuttle prior 3-yr avg. (same week)10/26/2017
Non-shuttle bids include unit-train and single-car bids. n/a = not available.Source: Transportation & Marketing Programs/AMS/USDA
n/a
UPBNSF
n/a
n/a
-$100Shuttle
Non-Shuttle
There were no Non-Shuttle bids/offers this week.There were no Shuttle bids/offers last week. Average Non-Shuttle bids/offers this week are at the peak.
Table 6
Weekly Secondary Railcar Market ($/car)1
Nov-17 Dec-17 Jan-18 Feb-18 Mar-18 Apr-18
BNSF-GF n/a n/a n/a n/a n/a n/a
Change from last week n/a n/a n/a n/a n/a n/a
Change from same week 2016 n/a n/a n/a n/a n/a n/a
UP-Pool n/a n/a n/a n/a n/a n/a
Change from last week n/a n/a n/a n/a n/a n/a
Change from same week 2016 n/a n/a n/a n/a n/a n/a
BNSF-GF (156) (150) n/a n/a n/a n/a
Change from last week (206) n/a n/a n/a n/a n/a
Change from same week 2016 (319) (283) n/a n/a n/a n/a
UP-Pool (75) (206) (100) n/a n/a n/a
Change from last week 125 (6) n/a n/a n/a n/a
Change from same week 2016 75 (81) (100) n/a n/a n/a
1Average premium/dis co unt to ta riff, $ /car-las t week
No te : Bids lis ted are market INDICATORS o nly & are NOT guaranteed prices ,
n/a = no t ava ilable ; GF = guaranteed fre ight; P o o l = guaranteed po o l
So urces : Trans po rta tio n and Marketing P ro grams /AMS/USDA
Data fro m J ames B. J o iner Co ., Tradewes t Bro kerage Co .
No
n-s
hu
ttle
For the week ending:
10/26/2017
Sh
utt
le
Delivery period

November 2, 2017
Grain Transportation Report 9
The tariff rail rate is the base price of freight rail service, and together with fuel surcharges and any auction and secondary rail
values constitute the full cost of shipping by rail. Typically, auction and secondary rail values are a small fraction of the full
cost of shipping by rail relative to the tariff rate. High auction and secondary rail values, during times of high rail demand or
short supply, can exceed the cost of the tariff rate plus fuel surcharge.
Table 7
Tariff Rail Rates for Unit and Shuttle Train Shipments1
Percent
Tariff change
November, 2017 Origin region3
Destination region3
rate/car metric ton bushel2
Y/Y4
Unit train
Wheat Wichita, KS St. Louis, MO $3,883 $71 $39.26 $1.07 -29
Grand Forks, ND Duluth-Superior, MN $4,143 $0 $41.14 $1.12 9
Wichita, KS Los Angeles, CA $7,050 $0 $70.01 $1.91 70
Wichita, KS New Orleans, LA $4,540 $125 $46.32 $1.26 -33
Sioux Falls, SD Galveston-Houston, TX $6,786 $0 $67.39 $1.83 52
Northwest KS Galveston-Houston, TX $4,816 $137 $49.18 $1.34 -24
Amarillo, TX Los Angeles, CA $5,021 $190 $51.75 $1.41 10
Corn Champaign-Urbana, IL New Orleans, LA $3,931 $141 $40.44 $1.03 -18
Toledo, OH Raleigh, NC $6,344 $0 $63.00 $1.60 70
Des Moines, IA Davenport, IA $2,258 $30 $22.72 $0.58 -62
Indianapolis, IN Atlanta, GA $5,446 $0 $54.08 $1.37 140
Indianapolis, IN Knoxville, TN $4,540 $0 $45.08 $1.15 -13
Des Moines, IA Little Rock, AR $3,609 $88 $36.71 $0.93 -14
Des Moines, IA Los Angeles, CA $5,327 $255 $55.43 $1.41 56
Soybeans Minneapolis, MN New Orleans, LA $3,632 $127 $37.33 $1.02 -29
Toledo, OH Huntsville, AL $5,287 $0 $52.50 $1.43 44
Indianapolis, IN Raleigh, NC $6,460 $0 $64.15 $1.75 28
Indianapolis, IN Huntsville, AL $4,764 $0 $47.31 $1.29 -23
Champaign-Urbana, IL New Orleans, LA $4,745 $141 $48.52 $1.32 8
Shuttle Train
Wheat Great Falls, MT Portland, OR $3,953 $0 $39.26 $1.07 -13
Wichita, KS Galveston-Houston, TX $4,171 $0 $41.42 $1.13 6
Chicago, IL Albany, NY $5,663 $0 $56.24 $1.53 46
Grand Forks, ND Portland, OR $5,611 $0 $55.72 $1.52 2
Grand Forks, ND Galveston-Houston, TX $5,931 $0 $58.90 $1.60 6
Northwest KS Portland, OR $5,812 $224 $59.94 $1.63 2
Corn Minneapolis, MN Portland, OR $5,000 $0 $49.65 $1.26 -13
Sioux Falls, SD Tacoma, WA $4,960 $0 $49.26 $1.25 -1
Champaign-Urbana, IL New Orleans, LA $3,731 $141 $38.45 $0.98 -22
Lincoln, NE Galveston-Houston, TX $3,700 $0 $36.74 $0.93 4
Des Moines, IA Amarillo, TX $3,970 $110 $40.52 $1.03 10
Minneapolis, MN Tacoma, WA $5,000 $0 $49.65 $1.26 27
Council Bluffs, IA Stockton, CA $4,820 $0 $47.86 $1.22 -4
Soybeans Sioux Falls, SD Tacoma, WA $5,600 $0 $55.61 $1.51 18
Minneapolis, MN Portland, OR $5,650 $0 $56.11 $1.53 1
Fargo, ND Tacoma, WA $5,500 $0 $54.62 $1.49 -3
Council Bluffs, IA New Orleans, LA $4,775 $162 $49.03 $1.33 -10
Grand Island, NE Portland, OR $5,710 $229 $58.98 $1.61 411A unit train refers to shipments of at least 25 cars. Shuttle train rates are generally available for qualified shipments of
75-120 cars that meet railroad efficiency requirements.
2Approximate load per car = 111 short tons (100.7 metric tons): corn 56 lbs./bu., wheat and soybeans 60 lbs./bu.
3Regional economic areas are defined by the Bureau of Economic Analysis (BEA)
4Percentage change year over year calculated using tariff rate plus fuel surcharge
Sources: www.bnsf.com, www.cn.ca, www.csx.com, www.up.com
Tariff plus surcharge per:Fuel
surcharge
per car

November 2, 2017
Grain Transportation Report 10
Table 8
Tariff Rail Rates for U.S. Bulk Grain Shipments to MexicoDate: Percent
Tariff change4
Commodity Destination region rate/car1
metric ton3 bushel
3Y/Y
Wheat MT Chihuahua, CI $7,459 $0 $76.21 $2.07 0
OK Cuautitlan, EM $6,631 $98 $68.75 $1.87 1
KS Guadalajara, JA $7,309 $273 $77.46 $2.11 5
TX Salinas Victoria, NL $4,292 $60 $44.46 $1.21 3
Corn IA Guadalajara, JA $8,313 $239 $87.38 $2.22 3
SD Celaya, GJ $7,700 $0 $78.68 $2.00 2
NE Queretaro, QA $8,013 $205 $83.97 $2.13 3
SD Salinas Victoria, NL $6,743 $0 $68.90 $1.75 2
MO Tlalnepantla, EM $7,379 $200 $77.44 $1.97 3
SD Torreon, CU $7,300 $0 $74.59 $1.89 2
Soybeans MO Bojay (Tula), HG $8,134 $223 $85.39 $2.32 -5
NE Guadalajara, JA $8,692 $242 $91.28 $2.48 -1
IA El Castillo, JA $8,960 $0 $91.55 $2.49 0
KS Torreon, CU $7,489 $175 $78.31 $2.13 1
Sorghum NE Celaya, GJ $7,345 $219 $77.29 $1.96 4
KS Queretaro, QA $7,819 $122 $81.14 $2.06 4
NE Salinas Victoria, NL $6,452 $98 $66.92 $1.70 5
NE Torreon, CU $6,790 $167 $71.08 $1.80 41Rates are based upon published tariff rates for high-capacity shuttle trains. Shuttle trains are available for qualified
shipments of 75--110 cars that meet railroad efficiency requirements.2Fuel surcharge adjusted to reflect the change in Ferrocarril Mexicano, S.A. de C.V railroad fuel surcharge policy as of 10/01/20093Approximate load per car = 97.87 metric tons: Corn & Sorghum 56 lbs/bu, Wheat & Soybeans 60 lbs/bu4Percentage change calculated using tariff rate plus fuel surchage
Sources: www.bnsf.com, www.uprr.com, www.kcsouthern.com
Fuel
surcharge
per car2
Tariff plus surcharge per:Origin
state
November, 2017
Figure 7
Railroad Fuel Surcharges, North American Weighted Average1
-$0.10
$0.00
$0.10
$0.20
$0.30
$0.40
$0.50
$0.60
$0.70
Doll
ars
per
rai
lcar
mil
e
3-Year Monthly Average
Fuel Surcharge* ($/mile/railcar)
November, 2017: $0.09, up 4 cents from last month's surcharge of $0.05/mile; up 8 cents from the November 2016
surcharge of $0.01/mile; and down 3 cents from the November prior 3-year average of $0.12/mile.
1 Weighted by each Class I railroad's proportion of grain traffic for the prior year. * Beginning January 2009, the Canadian Pacific fuel surcharge is computed by a monthly average of the bi -weekly fuel surcharge.**CSX strike price changed from $2.00/gal. to $3.75/gal. starting January 1, 2015.
Sources: www.bnsf.com, www.cn.ca, www.cpr.ca, www.csx.com, www.kcsi.com, www.nscorp.com, www.uprr.com

November 2, 2017
Grain Transportation Report 11
Barge Transportation
Figure 9
Benchmark tariff rates
Calculating barge rate per ton:
(Rate * 1976 tariff benchmark rate per ton)/100
Select applicable index from market quotes included in
tables on this page. The 1976 benchmark rates per ton
are provided in map.
Twin Cities 6.19
Mid-Mississippi 5.32
St. Louis 3.99
Cairo-Memphis 3.14
Illinois 4.64 Cincinnati 4.69
Lower Ohio 4.04
Figure 8
Illinois River Barge Freight Rate1,2
1Rate = percent of 1976 tariff benchmark index (1976 = 100 percent); 24-week moving average of the 3-year average.
Source: Transportation & Marketing Programs/AMS/USDA
0
200
400
600
800
1000
12001
1/0
1/1
6
11
/15
/16
11
/29
/16
12
/13
/16
12
/27
/16
01
/10
/17
01
/24
/17
02
/07
/17
02
/21
/17
03
/07
/17
03
/21
/17
04
/04
/17
04
/18
/17
05
/02
/17
05
/16
/17
05
/30
/17
06
/13
/17
06
/27
/17
07
/11
/17
07
/25
/17
08
/08
/17
08
/22
/17
09
/05
/17
09
/19
/17
10
/03
/17
10
/17
/17
10
/31
/17
Per
cen
t of
tar
iff Weekly rate
3-year avg. for
the week
For the week ending October 31: 11 percent higher than last week, 2 percentlower than last year, and 23 percent lower than the 3-year average.
Table 9
Weekly Barge Freight Rates: Southbound Only
Twin
Cities
Mid-
Mississippi
Lower
Illinois
River St. Louis Cincinnati
Lower
Ohio
Cairo-
Memphis
Rate1
10/31/2017 425 420 443 338 400 400 300
10/24/2017 458 425 400 320 563 563 300
$/ton 10/31/2017 26.31 22.34 20.56 13.49 18.76 16.16 9.42
10/24/2017 28.35 22.61 18.56 12.77 26.40 22.75 9.42
Current week % change from the same week:
Last year -25 -14 -2 -4 -11 -11 9
3-year avg. 2
-29 -30 -23 -30 -29 -29 -31-2 6 6
Rate1
November - 338 330 258 300 300 238
January - - 325 220 238 238 200
Source: Transportation & Marketing Programs/AMS/USDA
1Rate = percent of 1976 tariff benchmark index (1976 = 100 percent);
24-week moving average; ton = 2,000 pounds; "-" = closed
November 2, 2017
Grain Transportation Report 12
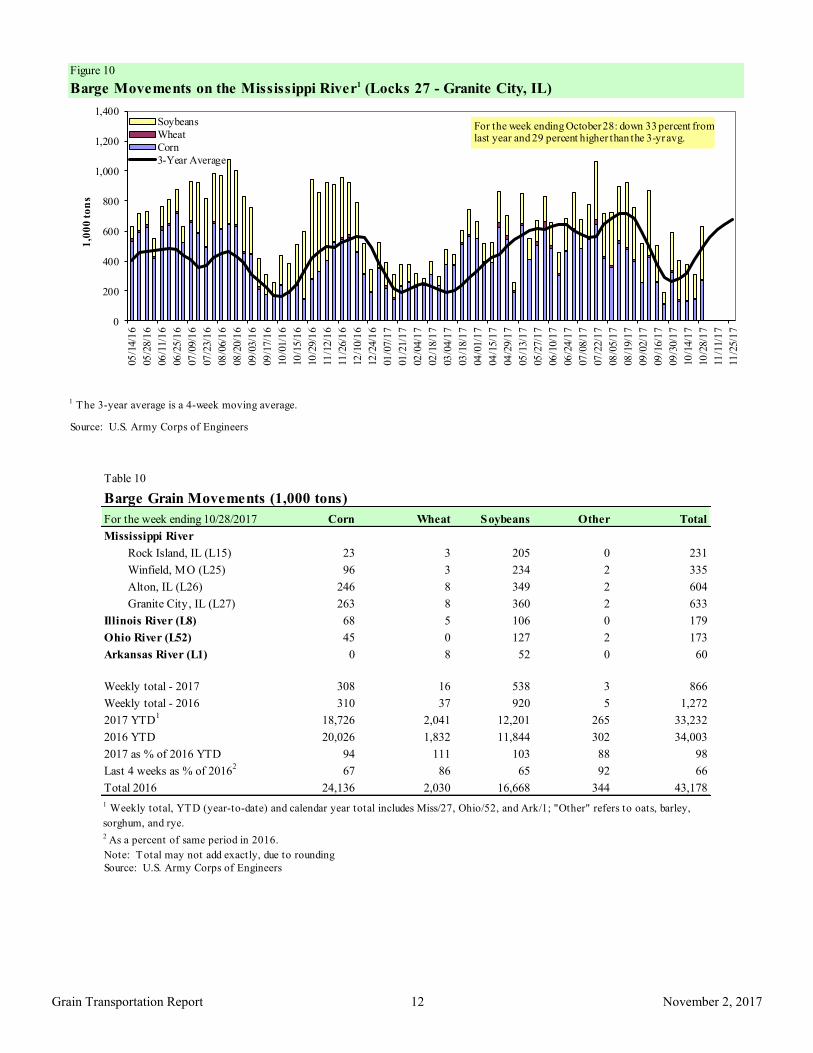
Figure 10
Barge Movements on the Mississippi River1 (Locks 27 - Granite City, IL)
1 The 3-year average is a 4-week moving average.
Source: U.S. Army Corps of Engineers
0
200
400
600
800
1,000
1,200
1,400
05
/14/1
6
05
/28/1
6
06
/11/1
6
06
/25/1
6
07
/09/1
6
07
/23/1
6
08
/06/1
6
08
/20/1
6
09
/03/1
6
09
/17/1
6
10
/01/1
6
10
/15/1
6
10
/29/1
6
11
/12/1
6
11
/26/1
6
12
/10/1
6
12
/24/1
6
01
/07/1
7
01
/21/1
7
02
/04/1
7
02
/18/1
7
03
/04/1
7
03
/18/1
7
04
/01/1
7
04
/15/1
7
04
/29/1
7
05
/13/1
7
05
/27/1
7
06
/10/1
7
06
/24/1
7
07
/08/1
7
07
/22/1
7
08
/05/1
7
08
/19/1
7
09
/02/1
7
09
/16/1
7
09
/30/1
7
10
/14/1
7
10
/28/1
7
11
/11/1
7
11
/25/1
7
1,0
00
to
ns
Soybeans
Wheat
Corn
3-Year Average
For the week ending October28: down 33 percent fromlast year and 29 percent higher than the 3-yravg.
Table 10
Barge Grain Movements (1,000 tons)
For the week ending 10/28/2017 Corn Wheat Soybeans Other Total
Mississippi River
Rock Island, IL (L15) 23 3 205 0 231
Winfield, MO (L25) 96 3 234 2 335
Alton, IL (L26) 246 8 349 2 604
Granite City, IL (L27) 263 8 360 2 633
Illinois River (L8) 68 5 106 0 179
Ohio River (L52) 45 0 127 2 173
Arkansas River (L1) 0 8 52 0 60
Weekly total - 2017 308 16 538 3 866
Weekly total - 2016 310 37 920 5 1,272
2017 YTD1
18,726 2,041 12,201 265 33,232
2016 YTD 20,026 1,832 11,844 302 34,003
2017 as % of 2016 YTD 94 111 103 88 98
Last 4 weeks as % of 20162
67 86 65 92 66
Total 2016 24,136 2,030 16,668 344 43,178
2 As a percent of same period in 2016.
Source: U.S. Army Corps of Engineers
Note: Total may not add exactly, due to rounding
1 Weekly total, YTD (year-to-date) and calendar year total includes Miss/27, Ohio/52, and Ark/1; "Other" refers to oats, barley,
sorghum, and rye.

November 2, 2017
Grain Transportation Report 13
Figure 11
Source: U.S. Army Corps of Engineers
Upbound Empty Barges Transiting Mississippi River Locks 27, Arkansas River
Lock and Dam 1, and Ohio River Locks and Dam 52
0
100
200
300
400
500
600
700
8001
2/2
4/1
6
12/
31/
16
1/7
/17
1/1
4/1
7
1/2
1/1
7
1/2
8/1
7
2/4
/17
2/1
1/1
7
2/1
8/1
7
2/2
5/1
7
3/4
/17
3/1
1/1
7
3/1
8/1
7
3/2
5/1
7
4/1
/17
4/8
/17
4/1
5/1
7
4/2
2/1
7
4/2
9/1
7
5/6
/17
5/1
3/1
7
5/2
0/1
7
5/2
7/1
7
6/3
/17
6/1
0/1
7
6/1
7/1
7
6/2
4/1
7
7/1
/17
7/8
/17
7/1
5/1
7
7/2
2/1
7
7/2
9/1
7
8/5
/17
8/1
2/1
7
8/1
9/1
7
8/2
6/1
7
9/2
/17
9/9
/17
9/1
6/1
7
9/2
3/1
7
9/3
0/1
7
10/
7/1
7
10/
14/
17
10/
21/
17
10/
28/
17
Nu
mb
er o
f B
arg
es
Miss. Locks 27 Ark Lock 1 Ohio Locks 52
For the week ending October 28: 522 barges transited the locks, 119 barges higher than the previous week, and 16
percent lower than the 3-year avg.
Figure 12
Grain Barges for Export in New Orleans Region
Source: U.S. Army Corps of Engineers and GIPSA
0
200
400
600
800
1000
1200
7/9
/16
7/2
3/1
6
8/6
/16
8/2
0/1
6
9/3
/16
9/1
7/1
6
10
/1/1
6
10
/15
/16
10
/29
/16
11
/12
/16
11
/26
/16
12
/10
/16
12
/24
/16
1/7
/17
1/2
1/1
7
2/4
/17
2/1
8/1
7
3/4
/17
3/1
8/1
7
4/1
/17
4/1
5/1
7
4/2
9/1
7
5/1
3/1
7
5/2
7/1
7
6/1
0/1
7
6/2
4/1
7
7/8
/17
7/2
2/1
7
8/5
/17
8/1
9/1
7
9/2
/17
9/1
6/1
7
9/3
0/1
7
10/1
4/1
7
10/2
8/1
7
Downbound Grain Barges Locks 27, 1, and 52
Grain Barges Unloaded in New Orleans
Nu
mb
er o
f b
arges
For the week ending October 28: 546 grain bargesmoved down river, 56 percent higher than last week, 875 grain barges were unloaded in New Orleans,
down 14 percent from last week.

November 2, 2017
Grain Transportation Report 14
The weekly diesel price provides a proxy for trends in U.S. truck rates as diesel fuel is a significant expense for truck grain move-
ments.
Truck Transportation
Table 11
Change from
Region Location Price Week ago Year ago
I East Coast 2.811 0.014 0.336
New England 2.770 0.018 0.268
Central Atlantic 2.938 0.014 0.355
Lower Atlantic 2.729 0.014 0.341
II Midwest2 2.810 0.031 0.367
III Gulf Coast3
2.639 0.025 0.286
IV Rocky Mountain 2.943 0.026 0.402
V West Coast 3.111 0.013 0.345
West Coast less California 3.020 0.005 0.365
California 3.185 0.019 0.330
Total U.S. 2.819 0.022 0.3401Diesel fuel prices include all taxes. Prices represent an average of all types of diesel fuel.
2Same as North Central 3Same as South Central
Source: Energy Information Administration/U.S. Department of Energy (www.eia.doe.gov)
Retail on-Highway Diesel Prices1, Week Ending 10/30/2017(US $/gallon)
Figure 13
Weekly Diesel Fuel Prices, U.S. Average
Source: Retail On-Highway Diesel Prices, Energy Information Administration, Dept. of Energy
1.5
2.0
2.5
3.0
3.5
4.0
05/0
1/1
7
05/0
8/1
7
05/1
5/1
7
05/2
2/1
7
05/2
9/1
7
06/0
5/1
7
06/1
2/1
7
06/1
9/1
7
06/2
6/1
7
07/0
3/1
7
07/1
0/1
7
07/1
7/1
7
07/2
4/1
7
07/3
1/1
7
08/0
7/1
7
08/1
4/1
7
08/2
1/1
7
08/2
8/1
7
09/0
4/1
7
09/1
1/1
7
09/1
8/1
7
09/2
5/1
7
10/0
2/1
7
10/0
9/1
7
10/1
6/1
7
10/2
3/1
7
10/3
0/1
7
Last year Current Year
$ p
er
ga
llo
n
For the week ending October 30: fuel prices increased 2 cents from theprevious week at $2.82 per gallon, 34 cents above the same week last year.

November 2, 2017
Grain Transportation Report 15
Grain Exports
Table 12
U.S. Export Balances and Cumulative Exports (1,000 metric tons)
Wheat Corn Soybeans Total
For the week ending HRW SRW HRS SWW DUR All wheat
Export Balances1
10/19/2017 1,516 560 1,621 1,253 74 5,023 11,576 18,852 35,451
This week year ago 1,855 531 1,734 1,080 101 5,301 15,239 23,286 43,826
Cumulative exports-marketing year 2
2017/18 YTD 4,076 921 2,696 2,268 178 10,139 4,642 9,564 24,344
2016/17 YTD 4,859 855 3,250 1,665 139 10,767 8,039 10,327 29,133
YTD 2017/18 as % of 2016/17 84 108 83 136 128 94 58 93 84
Last 4 wks as % of same period 2016/17 77 107 82 113 92 89 68 83 78
2016/17 Total 11,096 2,285 7,923 4,254 484 26,042 41,864 51,156 119,062
2015/16 Total 5,538 3,057 6,285 3,551 670 19,101 45,564 49,821 114,4861 Current unshipped (outstanding) export sales to date2 Shipped export sales to date; new marketing year now in effect for wheat, corn, and soybeans
Note: YTD = year-to-date. Marketing Year: wheat = 6/01-5/31, corn & soybeans = 9/01-8/31
Source: Foreign Agricultural Service/USDA (www.fas.usda.gov)
Table 13
Top 5 Importers 1 of U.S. Corn
For the week ending 10/19/2017 % change Exports3
2017/18 2016/17 current MY 3-year avg
Current MY Last MY from last MY 2014-2016 - 1,000 mt -
Mexico 7,116 6,884 3 12,297
Japan 2,057 2,870 (28) 11,450
Korea 401 1,508 (73) 4,494
Colombia 1,090 1,390 (22) 4,179
Peru 890 806 10 2,693
Top 5 Importers 11,554 13,458 (14) 35,113
Total US corn export sales 16,217 23,278 (30) 49,308
% of Projected 34% 40%
Change from prior week2
1,288 799
Top 5 importers' share of U.S. corn
export sales 71% 58% 71%
USDA forecast, October 2017 47,074 58,346 (19)
Corn Use for Ethanol USDA
forecast, October 2017 139,065 138,125 1
1Based on FAS Marketing Year Ranking Reports for 2015/16 - www.fas.usda.gov; Marketing year (MY) = Sep 1 - Aug 31.
3FAS Marketing Year Ranking Reports - http://apps.fas.usda.gov/export-sales/myrkaug.htm; 3-yr average
2Cumulative Exports (shipped) + Outstanding Sales (unshipped), FAS Weekly Export Sales Report, or Export Sales
Query--http://www.fas.usda.gov/esrquery/. Total commitments change (net sales) from prior week could include
revisions from previous week's outstanding sales or accumulated sales.
November 2, 2017
Grain Transportation Report 16
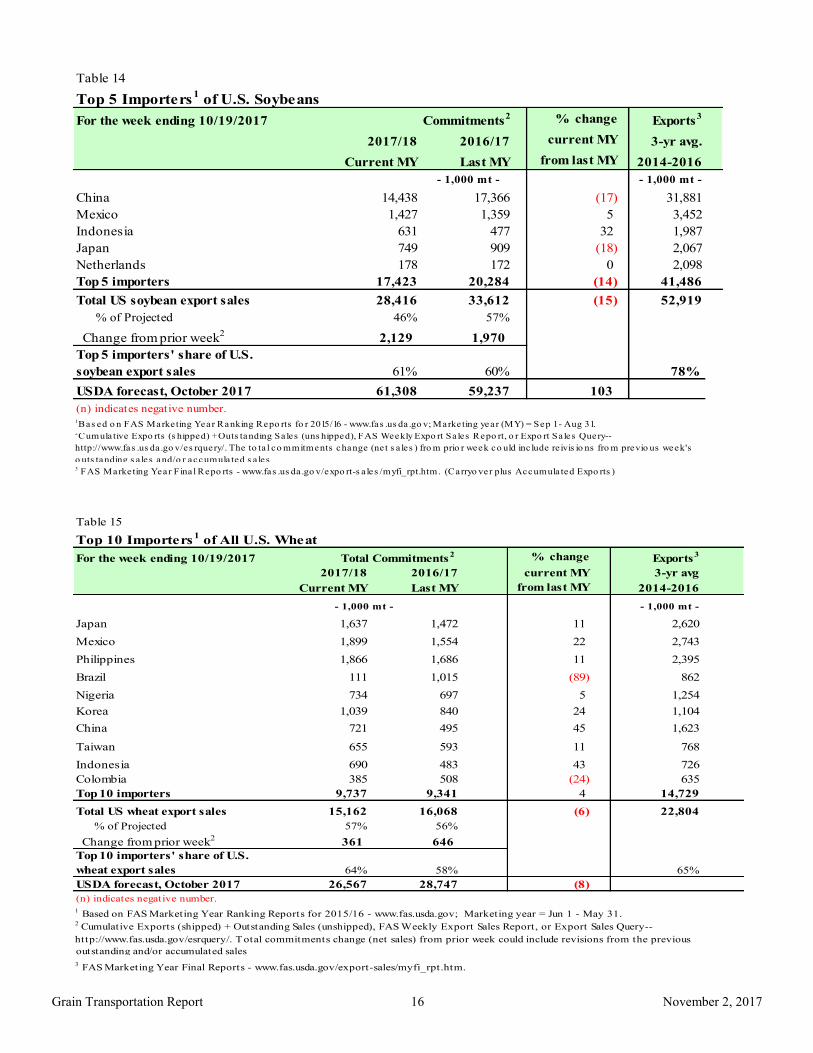
Table 15
Top 10 Importers1 of All U.S. Wheat
For the week ending 10/19/2017 % change Exports3
2017/18 2016/17 current MY 3-yr avg
Current MY Last MY from last MY 2014-2016
- 1,000 mt -
Japan 1,637 1,472 11 2,620
Mexico 1,899 1,554 22 2,743
Philippines 1,866 1,686 11 2,395
Brazil 111 1,015 (89) 862
Nigeria 734 697 5 1,254
Korea 1,039 840 24 1,104
China 721 495 45 1,623
Taiwan 655 593 11 768
Indonesia 690 483 43 726
Colombia 385 508 (24) 635
Top 10 importers 9,737 9,341 4 14,729
Total US wheat export sales 15,162 16,068 (6) 22,804
% of Projected 57% 56%
Change from prior week2
361 646
Top 10 importers' share of U.S.
wheat export sales 64% 58% 65%
USDA forecast, October 2017 26,567 28,747 (8)
1 Based on FAS Marketing Year Ranking Reports for 2015/16 - www.fas.usda.gov; Marketing year = Jun 1 - May 31.
outstanding and/or accumulated sales
Total Commitments2
3 FAS Marketing Year Final Reports - www.fas.usda.gov/export-sales/myfi_rpt.htm.
(n) indicates negative number.
2 Cumulative Exports (shipped) + Outstanding Sales (unshipped), FAS Weekly Export Sales Report, or Export Sales Query--
http://www.fas.usda.gov/esrquery/. Total commitments change (net sales) from prior week could include revisions from the previous
- 1,000 mt -
Table 14
Top 5 Importers1 of U.S. Soybeans
For the week ending 10/19/2017 % change
Exports3
2017/18 2016/17 current MY 3-yr avg.
Current MY Last MY from last MY 2014-2016
- 1,000 mt - - 1,000 mt -
China 14,438 17,366 (17) 31,881
Mexico 1,427 1,359 5 3,452
Indonesia 631 477 32 1,987
Japan 749 909 (18) 2,067
Netherlands 178 172 0 2,098
Top 5 importers 17,423 20,284 (14) 41,486
Total US soybean export sales 28,416 33,612 (15) 52,919
% of Projected 46% 57%
Change from prior week2
2,129 1,970
Top 5 importers' share of U.S.
soybean export sales 61% 60% 78%
USDA forecast, October 2017 61,308 59,237 103
1Bas ed o n FAS Marketing Year Ranking Repo rts fo r 2015/16 - www.fas .us da .go v; Marketing year (MY) = Sep 1 - Aug 31.
Total
Commitments2
3 FAS Marketing Year Fina l Repo rts - www.fas .us da .go v/expo rt-s a les /myfi_rpt.htm. (Carryo ver plus Accumula ted Expo rts )
(n) indicates negative number.
2Cumula tive Expo rts (s hipped) + Outs tanding Sales (uns hipped), FAS Weekly Expo rt Sa les Repo rt, o r Expo rt Sa les Query--
http://www.fas .us da .go v/es rquery/. The to ta l co mmitments change (ne t s a les ) fro m prio r week co uld inc lude re ivis io ns fro m previo us week's
o uts tanding s a les and/o r accumula ted s a les

November 2, 2017
Grain Transportation Report 17
The United States exports approximately one-quarter of the grain it produces. On average, this includes nearly 45 percent of U.S.-grown
wheat, 35 percent of U.S.-grown soybeans, and 20 percent of the U.S.-grown corn. Approximately 58 percent of the U.S. export grain ship-
ments departed through the U.S. Gulf region in 2016.
Table 16
Grain Inspections for Export by U.S. Port Region (1,000 metric tons)
For the Week Ending Previous Current Week 2017 YTD as
10/26/17 Week1
as % of Previous 2016 YTD % of 2016 YTD Last Year Prior 3-yr. avg.
Pacific Northwest
Wheat 117 79 149 12,686 10,488 121 92 75 12,325
Corn 0 0 n/a 10,238 10,515 97 0 0 12,009
Soybeans 1,040 917 113 8,697 9,058 96 21 32 14,447
Total 1,157 996 116 31,621 30,061 105 82 93 38,782
Mississippi Gulf
Wheat 74 68 110 3,776 3,043 124 101 85 3,480
Corn 385 465 83 25,551 26,915 95 56 68 31,420
Soybeans 1,043 1,355 77 23,180 24,059 96 77 88 35,278
Total 1,502 1,888 80 52,507 54,016 97 71 82 70,178
Texas Gulf
Wheat 88 17 512 5,657 4,852 117 68 101 6,019
Corn 12 0 n/a 695 1,419 49 139 170 1,669
Soybeans 72 0 n/a 85 440 19 21 32 1,105
Total 171 17 1,000 6,437 6,711 96 52 78 8,792
Interior
Wheat 21 6 346 1,499 1,270 118 36 56 1,543
Corn 107 149 72 6,918 5,961 116 105 125 7,197
Soybeans 169 157 107 4,241 3,509 121 104 112 4,577
Total 297 313 95 12,658 10,740 118 98 113 13,317
Great Lakes
Wheat 32 10 309 582 892 65 73 76 1,186
Corn 0 0 n/a 173 463 37 0 0 584
Soybeans 86 76 113 615 381 161 123 104 910
Total 118 86 137 1,370 1,736 79 105 90 2,681
Atlantic
Wheat 0 0 n/a 44 235 19 0 0 315
Corn 0 5 0 24 260 9 8 9 294
Soybeans 175 71 245 1,346 1,303 103 128 190 2,269
Total 175 77 228 1,414 1,798 79 75 94 2,878
U.S. total from ports2
Wheat 332 180 185 24,243 20,780 117 77 80 24,867
Corn 504 620 81 43,600 45,533 96 59 71 53,173
Soybeans 2,584 2,577 100 38,165 38,749 98 82 95 58,587
Total 3,420 3,377 101 106,008 105,062 101 76 88 136,6271 Data includes revisions from prior weeks; some regional totals may not add exactly due to rounding.
Source: Grain Inspection, Packers and Stockyards Administration/USDA (www.gipsa.usda.gov); YTD= year-to-date; n/a = not applicable
2 Total only includes regions shown above.
Last 4-weeks as % of:
Port Regions 2016 Total2017 YTD
November 2, 2017
Grain Transportation Report 18
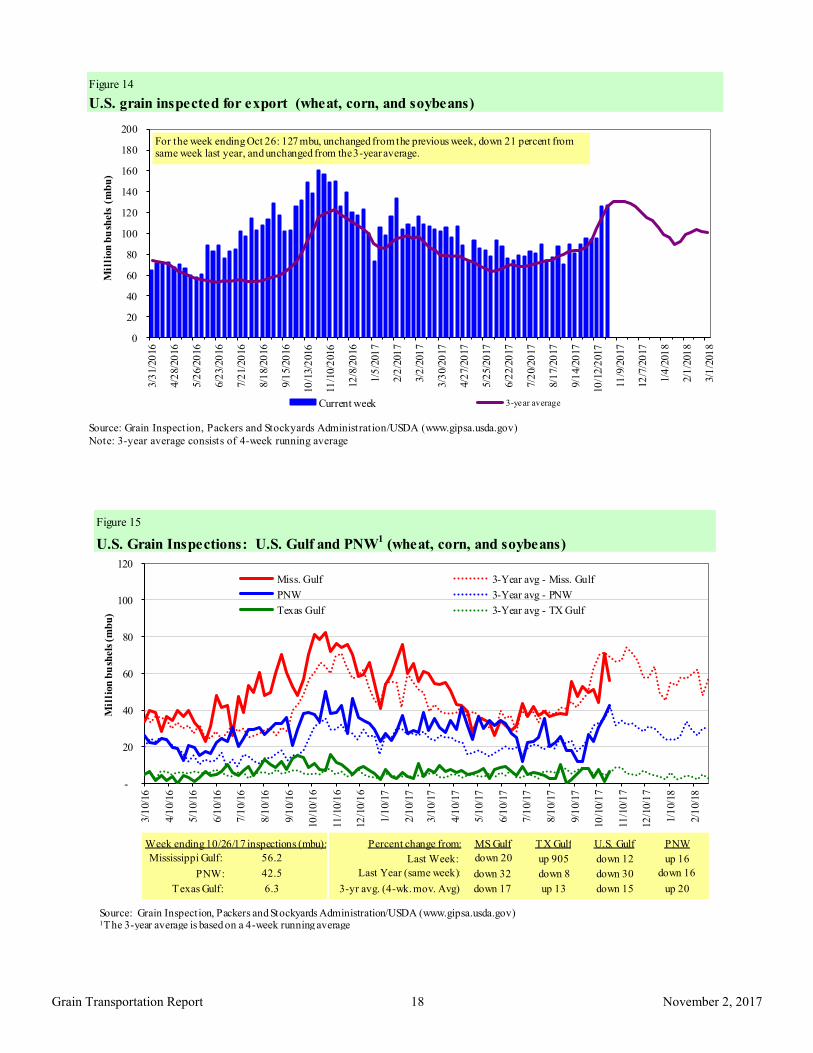
Figure 14
U.S. grain inspected for export (wheat, corn, and soybeans)
Source: Grain Inspection, Packers and Stockyards Administration/USDA (www.gipsa.usda.gov)
Note: 3-year average consists of 4-week running average
0
20
40
60
80
100
120
140
160
180
200
3/3
1/2
016
4/2
8/2
016
5/2
6/2
016
6/2
3/2
016
7/2
1/2
016
8/1
8/2
016
9/1
5/2
016
10/1
3/2
016
11/1
0/2
016
12
/8/2
016
1/5
/201
7
2/2
/201
7
3/2
/201
7
3/3
0/2
017
4/2
7/2
017
5/2
5/2
017
6/2
2/2
017
7/2
0/2
017
8/1
7/2
017
9/1
4/2
017
10/1
2/2
017
11
/9/2
017
12
/7/2
017
1/4
/201
8
2/1
/201
8
3/1
/201
8
Mil
lion
bu
shels
(m
bu
)
Current week 3-year average
For the week ending Oct 26: 127 mbu, unchanged from the previous week, down 21 percent from same week last year, and unchanged from the 3-year average.
Figure 15
U.S. Grain Inspections: U.S. Gulf and PNW1 (wheat, corn, and soybeans)
-
20
40
60
80
100
120
3/1
0/1
6
4/1
0/1
6
5/1
0/1
6
6/1
0/1
6
7/1
0/1
6
8/1
0/1
6
9/1
0/1
6
10/1
0/1
6
11/1
0/1
6
12/1
0/1
6
1/1
0/1
7
2/1
0/1
7
3/1
0/1
7
4/1
0/1
7
5/1
0/1
7
6/1
0/1
7
7/1
0/1
7
8/1
0/1
7
9/1
0/1
7
10/1
0/1
7
11/1
0/1
7
12/1
0/1
7
1/1
0/1
8
2/1
0/1
8
Mil
lion
bu
shels
(m
bu
)
Miss. Gulf 3-Year avg - Miss. Gulf
PNW 3-Year avg - PNW
Texas Gulf 3-Year avg - TX Gulf
Source: Grain Inspection, Packers and Stockyards Administration/USDA (www.gipsa.usda.gov)1The 3-year average is based on a 4-week running average
Last Week:
Last Year (same week):
3-yr avg. (4-wk. mov. Avg):
MS Gulf TX Gulf U.S. Gulf PNW
down 20
down 32
down 17
up 905
down 8
up 13
down 12
down 30
down 15
up 16
down 16
up 20
Percent change from:Week ending 10/26/17 inspections (mbu):
Mississippi Gulf:
PNW:
Texas Gulf:
56.2
42.5
6.3

November 2, 2017
Grain Transportation Report 19
Ocean Transportation
Table 17
Weekly Port Region Grain Ocean Vessel Activity (number of vessels)
Pacific Vancouver
Gulf Northwest B.C.
Loaded Due next
Date In port 7-days 10-days In port In port
10/26/2017 58 35 50 12 n/a
10/19/2017 62 35 46 20 n/a
2016 range (21..62) (27..55) (40..87) (6..27) n/a
2016 avg. 43 40 62 15 n/a
Source: Transportation & Marketing Programs/AMS/USDA
Figure 16
U.S. Gulf Vessel Loading Activity
0
10
20
30
40
50
60
70
06
/08
/20
17
06
/15
/20
17
06
/22
/20
17
06
/29
/20
17
07
/06
/20
17
07
/13
/20
17
07
/20
/20
17
07
/27
/20
17
08
/03
/20
17
08
/10
/20
17
08
/17
/20
17
08
/24
/20
17
08
/31
/20
17
09
/07
/20
17
09
/14
/20
17
09
/21
/20
17
09
/28
/20
17
10
/05
/20
17
10
/12
/20
17
10
/19
/20
17
10
/26
/20
17
Nu
mb
er
of
ve
ssel
s
Loaded Last 7 Days Due Next 10 days Loaded 4 Year Average
Source:Transportation & Marketing Programs/AMS/USDA1U.S. Gulf includes Mississippi, Texas, and East Gulf.
For the week ending October 26 Loaded Due Change from last year -18.6% -35.1%
Change from 4-year avg. -17.2% -32.2%

November 2, 2017
Grain Transportation Report 20
Figure 17
Grain Vessel Rates, U.S. to Japan
Data Source: O'Neil Commodity Consulting
0
5
10
15
20
25
30
35
40
45
50
Oct
. 15
Dec
. 15
Feb.
16
Apr
. 16
June
16
Aug
. 16
Oct
. 16
Dec
. 16
Feb.
17
Apr
. 17
June
17
Aug
. 17
Oct
. 17
US
$/m
etri
c to
n
Spread Gulf vs. PNW to Japan Rate Gulf to Japan Rate PNW to Japan
Gulf PNW Spread Ocean rates for October '17 $42.88 $24.31 $18.56 Change from October '16 38.9% 39.4% 38.2%
Change from 4-year avg. 3.9% 5.5% 1.8%
Table 18
Ocean Freight Rates For Selected Shipments, Week Ending 10/28/2017
Export Import Grain Loading Volume loads Freight rate
region region types date (metric tons) (US$/metric ton)
U.S. Gulf Gulf Heavy Grain Nov 15/25 65,000 43.85
U.S. Gulf China Heavy Grain Nov 10/20 66,000 43.75
U.S. Gulf China Heavy Grain Nov 1/10 66,000 42.00
U.S. Gulf China Heavy Grain Nov 1/10 66,000 41.75
U.S. Gulf China Heavy Grain Nov 1/10 66,000 41.25
U.S. Gulf China Heavy Grain Nov 1/10 66,000 42.00
U.S. Gulf China Heavy Grain Nov 1/10 66,000 41.50
U.S. Gulf China Heavy Grain Oct 23/30 60,000 40.50
U.S. Gulf China Heavy Grain Oct 15/30 66,000 42.50
U.S. Gulf China Heavy Grain Oct 10/20 66,000 41.00
U.S. Gulf China Heavy Grain Oct 1/10 66,000 41.25
U.S. Gulf China Heavy Grain Oct 1/10 66,000 41.50
U.S. Gulf China Heavy Grain Oct 1/10 66,000 38.75
PNW China Heavy Grain Oct 1/10 60,000 25.00
PNW Bangladesh Wheat Sep 29/Oct 9 13,620 58.00*
Brazil China Heavy Grain Nov 1/10 60,000 31.90
Brazil China Heavy Grain Oct 25/Nov 10 60,000 32.50
Brazil China Heavy Grain Oct 6/15 60,000 33.00
Brazil China Heavy Grain Oct 1/10 60,000 32.75
Brazil China Heavy Grain Sep 28/Oct 10 60,000 30.25
Rates shown are per metric ton (2,204.62 lbs. = 1 metric ton), F.O.B., except where otherwise indicated; op = option *50 percent of food aid from the United States is required to be shipped on U.S.-flag vessels.
Source: Maritime Research Inc. (www.maritime-research.com)

November 2, 2017
Grain Transportation Report 21
In 2015, containers were used to transport 8 percent of total U.S. waterborne grain exports. Approximately 64 percent of U.S. wa-
terborne grain exports in 2015 went to Asia, of which 12 percent were moved in containers. Approximately 94 percent of U.S. wa-
terborne containerized grain exports were destined for Asia.
Figure 18
Source: USDA/Agricultural Marketing Service/Transportation Services Division analysis of Port Import Export Reporting
Service (PIERS) data
Note: The following Harmonized Tariff Codes are used to calculate containerized grains movements: 100190, 100200,
100300, 100400, 100590, 100700, 110100, 230310, 110220, 110290, 120100, 230210, 230990, 230330, and 120810.
Top 10 Destination Markets for U.S. Containerized Grain Exports, January-July 2017
Taiwan16%
Indonesia16%
China12%
Thailand11% Korea
10%
Japan6%
Malaysia5%
Philippines3%
Vietnam2%
Bangladesh2%
Other
17%
Figure 19
Monthly Shipments of Containerized Grain to Asia
Source: USDA/Agricultural Marketing Service/Transportation Services Division analysis of Port Import Export Reporting Service (PIERS) data.
Note: The following Harmonized Tariff Codes are used to calculate containerized grains movements: 100190, 100200, 100300, 100400, 100590,
100700, 110100, 110220, 110290, 120100, 120810, 230210, 230310, 230330, and 230990.
05
101520253035404550556065707580
Jan.
Feb
.
Mar
.
Ap
r.
May
Jun
.
Jul.
Au
g
.
Sep
.
Oct
.
Nov
.
Dec
.
Th
ou
san
d
20
-ft
equ
ivale
nt
un
its
2016
2017
5-year avg
Jul 2017: Down 33.7% from last year and 35% lower than
the 5-year average

November 2, 2017
Grain Transportation Report 22
Coordinators
Surajudeen (Deen) Olowolayemo [email protected] (202) 720 - 0119
Pierre Bahizi [email protected] (202) 690 - 0992
Adam Sparger [email protected] (202) 205 - 8701
Weekly Highlight Editors
Surajudeen (Deen) Olowolayemo [email protected] (202) 720 - 0119
April Taylor [email protected] (202) 720 - 7880
Nicholas Marathon [email protected] (202) 690 - 4430
Grain Transportation Indicators
Surajudeen (Deen) Olowolayemo [email protected] (202) 720 - 0119
Rail Transportation
Adam Sparger [email protected] (202) 205 - 8701
Johnny Hill [email protected] (202) 690 - 3295
Jesse Gastelle [email protected] (202) 690 - 1144
Peter Caffarelli [email protected] (202) 690 - 3244
Barge Transportation
Nicholas Marathon [email protected] (202) 690 - 4430
April Taylor [email protected] (202) 720 - 7880
Matt Chang [email protected] (202) 720 - 0299
Truck Transportation
April Taylor [email protected] (202) 720 - 7880
Sergio Sotelo [email protected] (202) 756 - 2577
Grain Exports
Johnny Hill [email protected] (202) 690 - 3295
Ocean Transportation
Surajudeen (Deen) Olowolayemo [email protected] (202) 720 - 0119
(Freight rates and vessels)
April Taylor [email protected] (202) 720 - 7880
(Container movements)
Subscription Information: Send relevant information to [email protected] for an electronic
copy (printed copies are also available upon request).
Preferred citation: U.S. Dept. of Agriculture, Agricultural Marketing Service. Grain Transportation Report.
November 2, 2017. Web: http://dx.doi.org/10.9752/TS056.11-02-2017
Contacts and Links
In accordance with Federal civil rights law and U.S. Department of Agriculture (USDA) civil rights regulations and policies, the USDA, its
Agencies, offices, and employees, and institutions participating in or administering USDA programs are prohibited from discriminating based on
race, color, national origin, religion, sex, gender identity (including gender expression), sexual orientation, disability, age, marital status, family/
parental status, income derived from a public assistance program, political beliefs, or reprisal or retaliation for prior civil rights activity, in any
program or activity conducted or funded by USDA (not all bases apply to all programs). Remedies and complaint filing deadlines vary by pro-
gram or incident.
Persons with disabilities who require alternative means of communication for program information (e.g., Braille, large print, audiotape, American
Sign Language, etc.) should contact the responsible Agency or USDA's TARGET Center at (202) 720-2600 (voice and TTY) or contact USDA
through the Federal Relay Service at (800) 877-8339. Additionally, program information may be made available in languages other than English.
To file a program discrimination complaint, complete the USDA Program Discrimination Complaint Form, AD-3027, found online at How to
File a Program Discrimination Complaint and at any USDA office or write a letter addressed to USDA and provide in the letter all of the infor-
mation requested in the form. To request a copy of the complaint form, call (866) 632-9992. Submit your completed form or letter to USDA by:
(1) mail: U.S. Department of Agriculture, Office of the Assistant Secretary for Civil Rights, 1400 Independence Avenue, SW, Washington, D.C.
20250-9410; (2) fax: (202) 690-7442; or (3) email: [email protected].