grain trade in tanzania after adjustment hkr amani rogier van den brink we maro
TRANSCRIPT

TOLERATING THE PRIVATE SECTOR: GRAIN TRADE I N TANZANIA AFTER ADJUSTMENT
H.K.R. Amani Rog ie r van den B r i n k
W.E. Maro
The Cornell Food and Nutrition Pol icy Program (CFNPP) was created in 1988 within the Division of Nutritional Sciences, Coll ege of Human Ecology, Cornel 1 University, to undertake research, training, and technical assistance in food and nutrition policy with emphasis on developing countries.
CFNPP is served by an advisory committee of faculty from the Division of Nutritional Sciences, College of Human Ecology; the Departments of Agricultural Economics, Nutrition, City and Regional Pl anning, Rural Sociology; and from the Cornel 1 Institute for International Food, Agriculture and Development. Graduate students and faculty from these units sometimes collaborate with CFNPP on specific projects. The CFNPP professional staff includes nutritionists, economists, and anthropologists.
CFNPP is funded by several donors including the Agency for International Development, the World Bank, UNICEF, the Pew Memorial Trust, the Rockefeller and Ford Foundations, The Carnegie Corporation, The Thrasher Research Fund, and individual country governments.
a 1992 Cornel 1 Food and Nutrition Pol icy Program ISBN 1-56401-132-1
This Working Paper series provides a vehicle for rapid and informal reporting of results from CFNPP research. Some of the findings may be preliminary and subject to further analysis.
This document was word processed by Jools Proffitt. The manuscript was edited by Elizabeth Mercado. The text was formatted by Gaudencio Dizon. The cover was produced by Jake Smith.
For information about ordering this manuscript and other working papers in the series contact:
CFNPP Pub1 i cations Department 1400 16th Street NW, Suite 420
Washington, DC 20036 202-822-6500
308 Savage Hall Cornell University Ithaca, NY 14853
607-255-8093
CONTENTS
L I S T OF TABLES
L I S T OF FIGURES
ABBREVIATIONS
1. INTRODUCTION
2 . METHOD
3 . EVOLUTION OF MARKETING STRUCTURE
4. EMPIRICAL ANALYSIS
General Charac te r i s t i c s of Traders in Sample Subject ive Evaluation of the Trading Environment Traded Volumes and Prices Investment
5 . EMERGING PRIVATE INST ITUT IONS
6. POLICY RECOMMENDATIONS AND CONCLUSIONS
REFERENCES

LIST OF TABLES
Traders ' Average Age and t h e Number o f Years o f Operat ion
Gender Di s t r i bu t i on
Educat ion
Maize: E v o l u t i o n o f Average Purchase Vol umes and Purchase P r i c e s
Maize: E v o l u t i o n o f Sale P r i ces
Maize: E v o l u t i o n o f Gross Marke t ing Margins (1985/86-1990/91)
Storage S t r u c t u r e
Storage Behav ior
In tended Use o f P r o f i t s
C o l l e c t i v e Barga in ing Agreement (1989) w i t h Respect t o O f f Loading Charges Between t h e Tandale P o r t e r s Assoc ia t i on and t h e Tandale Vegetable Cooperat ive Soc ie ty
Average D a i l y Income o f P o r t e r i n Tandale Market

LIST OF FIGURES
S u b j e c t i v e E v a l u a t i o n by T raders o f Supp ly C o n d i t i o n s (1980/81-1991/92) 14
S u b j e c t i v e E v a l u a t i o n by T raders o f Demand Cond (1980/81-1991/92)
i ti ons 15
S u b j e c t i v e E v a l u a t i o n by T raders o f Market Cond (1980/81-1991/92)
S u b j e c t i v e Eva1 u a t i on by T raders o f T r a n s p o r t C o n d i t i o n s (1980181-1991/92) 17
T r a d e r s ' R e c a l l o f Real Load ing Costs (1980/81-1991/92) 18
S u b j e c t i v e E v a l u a t i o n by T raders o f NMC Purchases and Sa les (1980181-1991/92) 19
LIST OF MAP
1 - The Regions o f Tanzania
ABBREVIATIONS
CPI - Consumer Price Index
GD P - Gross Domestic Product
NMC - National Milling Corporation
Tsh - Tanzanian Shilling

1. INTRODUCTION
Recent ag r i cu l tu ra l market reforms in Tanzania have focused on price l i b e r a l i z a t i o n and i n s t i t u t i o n a l reform t o improve market performance. Although many scholars , farmers, consumers, and, t o a l e s s e r extent , p o l i t i c i a n s support such reforms, the debate on the appropriate ro le of pr iva te t r ade r s and o f f i c i a l marketing agents continues. The main issue being debated i s whether ce r t a in e f f i c i ency and equity objec t ives would j u s t i f y d i r e c t pub1 ic-sec tor interventions in pricing and marketing. Conversely, could such objec t ives be achieved by a completely l i b e r a l i z e d marketing system?
In t h i s paper, we will argue t h a t there i s a r o l e f o r government, a1 b e i t a f a r more modest and ind i rec t one than in the pas t . So f a r , the government has merely to le ra ted pr iva te t rade a c t i v i t y , even though pr iva te markets have performed remarkably well. When the o f f i c i a l food marketing s t ruc tu re p r a c t i c a l l y collapsed in the ea r ly 1980s, a f l u r r y of pr iva te market a c t i v i t y broke out , and any "vacuum," i f the re was any, was quickly f i l l e d . Food supplies t o urban areas quickly and consis tent ly increased. Moreover, by the l a t e 1980s, t r ade r s had developed t h e i r own market i n s t i t u t i o n s , organizing themselves in to indigenous marketing and c r e d i t cooperatives, concluding c o l l e c t i v e bargaining agreements with por te r s , and using a brokerage system t o f a c i l i t a t e wholesale buying and s e l l ing.
The government's r o l e in supporting the development of these markets was nonexistent , however, and sometimes not even to le ran t of pr iva te t rade . On the contrary, expectat ions of drought in the l a t e 1980s and ea r ly 1990s immediately t r iggered the imposition of local administrat ive r e s t r i c t i o n s on pr iva te grain t r ade . Outdated notions of "food s e c u r i t y , " in which local food exports are t o be avoided a t a l l c o s t , s t i l l seem t o dominate government thinking, and private t r ade r s are s t i l l seen as endangering such "food secur i ty . "
I t was against t h i s background t h a t we undertook a "quick and d i r t y " survey of wholesale grain t r ade r s in August and September of 1991. We hope t h a t t h i s report i s t imely and wil l help f o s t e r a more pro-active r o l e of government and donors with respect t o the pr iva te sec tor in Tanzania. Developing the pr iva te sec to r in Tanzania should not imply merely looking fo r foreign investors to revi t a l i ze the paras ta ta l sec to r . F i r s t and foremost, i t should imply developing Tanzania's own indigenous pr iva te sec to r , which has not received the a t tent ion i t meri ts .
Our main objec t ive i s t o give an i n i t i a l assessment, both nat ional ly and regional ly , of the impact of market 1 iberal iza t ion on grain t r ade r behavior. We have focused on wholesale grain t r a d e r s , i . e . , t r ade r s who buy and s e l l bags of

Nap 1 - The Regions of Tanzania

food grains. ' In order t o do t h i s , we wil l present the t r ade r s ' evaluation of the changing marketing environment of the 1980s and the concurrent changes in traded vol umes, p r i ces , gross marketing margins, and storage and investment behavior and preferences. The paper will a l so shed l i g h t on the nature of the new i n s t i t u t i o n s t h a t have evolved in the pr iva te sec to r , and discuss the current bottlenecks and conditions needed f o r the pr iva te grain t r ade r s t o operate more e f f i c i e n t l y . F ina l ly , we wil l indica te what we think the r o l e of the government in the l i b e r a l i z a t i o n process could be.
In the remainder of the introduction, we wil l b r i e f l y posi t ion the grain t rade in Tanzania's economy and recap i tu la te the s a l i e n t points in i t s h is tory .
The agr i cu l tu ra l sec to r employs about 80 percent of the 2 4 mil l ion people and contr ibutes around 50 percent of G D P and 75 percent of export earnings. Among other th ings , the sec to r i s expected t o supply food a t a low cost t o other sec to r s of the economy, pa r t i cu la r ly those in urban areas . Since independence in 1961, the government of Tanzania has played a dominant r o l e in the production and marketing of ag r i cu l tu ra l commodities and inputs . The main object ives fo r government intervention in the sec tor were t o ensure adequate food supplies t o the urban population a t "reasonable" p r i ces , t o reduce pr ice uncer ta in t ies fo r producers and hence s t a b i l i z e farm incomes, t o protect farmers from exploi ta t ion by p r iva te t r a d e r s , t o ex t rac t agr icul tura l surplus f o r the development of the indus t r i a l and o ther sec tors of the economy, t o guarantee foreign exchange earnings f o r the government, and t o reduce income inequa l i t i e s between rural and urban areas as well as between regions.
To achieve these objec t ives , the government imposed pr ice cont ro ls , suppressed pr iva te t r ade , r e s t r i c t e d internal and external t r ade , and became d i r e c t l y involved in purchasing, s e l l ing, s to r ing , and transport ing produce and inputs . For instance, in 1974 pan- te r r i to r i a l producer and consumer prices fo r food crops were introduced pa r t ly t o encourage production in po ten t i a l ly productive but remote areas and pa r t ly t o bring about a more equitable d i s t r i b u t i o n of welfare. I t was strongly believed t h a t uncontrolled marketing a c t i v i t i e s of pr iva te t r ade r s would not achieve the social object ive of regionally balanced agr i cu l tu ra l growth. I t was f o r the same reasons t h a t f e r t i l i z e r pr ices were subsidized and sold a t pan- te r r i to r i a l pr ices .
Whereas producer pr ices f o r food crops were control led a t low levels in order t o e x t r a c t ag r i cu l tu ra l surplus, consumer prices were control 1 ed and subsidized with the objec t ive of providing cheap food t o poor consumers as well as protect ing consumers from interseasonal and interannual pr ice f luc tua t ions . Moreover, following a standard "pr ice sc i s so r s" argument, provision of cheap food t o nonagricultural sec tors was meant t o encourage indus t r i a l i za t ion by maintaining low wage r a t e s . The suppression of pr iva te t r ade r s together with the r e s t r i c t i o n on the interregional movement of s t ap le gra ins (maize, r i c e , and wheat) t o 30 kilograms per person un t i l 1984 was aimed a t f a c i l i t a t i n g market
1 We have excluded farmers who s e l l 1 arge quan t i t i e s of t h e i r own produce and t r ade r s who buy gra ins in bags, but s e l l in t i n s ( r e t a i l e r s ) .

interventions of official marketing agents by shielding them from competition. In the absence of private traders government also had to involve itself in stockholding to stabilize interannual price variation for food security purposes.
Private grain marketing activities, then, have been out1 awed since 1962. De jure, private traders should not undertake marketing activities even now. De facto, however, private trade operations in grain marketing have always existed underground. This has particularly been the case during food crises. Two food crises are worth mentioning. The first was between 1973174 and 1974175, and the second food crisis took place in 1982183. In both, food shortages were triggered by droughts but compounded by the government's crackdown on private trade. The government blamed private traders for taking advantage of the shortage to enter the food market, hoard food, and charge prices far above the official prices. A1 though the government dealt severely with private traders during both periods, it was unable to totally eradicate their activities. The main reason for the government's failure to totally suppress traders was the inefficiency of the official marketing agent (the National Milling Corporation) both in terms of its purchases from farmers and its sale of adequate food quantities to consumers at government fixed prices. As a result, food shortages persisted, domestic production remained low, and inadequate amounts of food were imported due to a shortage of foreign exchange.
By the early 1980s the costs of food and input subsidies had reached insupportable level s: the losses made by official marketing agents had reached an equivalent of 15 percent of GDP. Costs related to market extension included the cost of trading in remote and unprofitable markets, the cost of transport subsidies and the cost of stockholding. Costs of institutional inefficiencies arose from incompetent management and corruption, which in turn were related to the lack of competition in marketing operations. Lastly, other costs arose from welfare losses caused by misallocation of resources. For instance, distorted price signals induced geographic production patterns that proved unsustainable after the collapse of the official price support system.
Thus, the interventionist policies benefited neither producers nor consumers (Amani, Kapunda, Lipumba, and Ndulu 1988). Prices to producers were too low to provide conditions for a supply response. Poor strata of rural households were in effect penal ized for the benefit of urban consumers. The pol icy of protecting urban consumers also failed: official marketing agencies were not able to provide adequate food supplies, forcing consumers to pay high prices in the para1 1 el markets.
The main factors, then, which eventually led to the adoption of 1 i beral ization programs by the government were the increasing financi a1 imbalances in the formal economy, the huge financial losses within the government-control 1 ed agricultural sector and the clear evidence of fai 1 ure of interventionist policies to achieve their objectives.
Beginning in the 1984185 marketing season, grain marketing was de facto and partially 1 iberal ized. Immediately, the food supply to urban areas such as Dar es Salaam increased considerably (Amani et al. 1988). At the same time, real

consumer prices sharply depreciated. It initially seemed that this supply effect was due mainly to favorable rainfall. However, the more recent years, i .e., 1989/90, l990/9l, and 1991/92, have shown be1 ow-average rainfall , but no reversal of the earlier trends in prices and quantities. Although prices have appreciated, they are nowhere near previous drought levels, and supply to urban areas continues practically unabated.
Some observers see the supply reaction as essentially ephemeral for other reasons than temporary good rainfall. They argue that the supply reaction observed after adjustment is the symmetric reversal of an earl i er perverse supply reaction caused by the contraction of the Tanzanian economy in the early 1980s. During that crisis, the unavailability of incentive goods induced households to reduce work effort, even in the presence of rising prices for own-produced products on the parallel markets. When the import regime was partially liberalized after 1984, the argument goes, the reappearance of consumer incentive goods triggered a one-time supply reaction. Given that it is usually assumed that the observed decline in consumer prices of food grains was accompanied by a parallel decline in producer prices, a perfect symmetry with the earlier perverse supply reaction is now obtained: a positive output effect in the presence of declining producer prices.
However, in this paper we argue that the increase in volumes of food grains marketed has persisted until the present period, and this increase seems to be more fundamental and orthodox than one caused by good rainfall and a jump in the availability of consumer goods. The institutional change from a situation of formal monopsony and black markets in the early 1980s to de facto 1 iberal ized private food grain trade presently, has considerably reduced the transaction costs involved in marketing. Thus, the major urban consumption centers have benefited not only from an increased availability, but also from a reduction in the real consumer price of food. The reduction in transaction costs was such, however, that the decrease in consumer prices did not always imply a concurrent decl ine of producer prices. In fact, in surplus production areas with reasonable transport infrastructure, increased competition between traders resulted in both higher producer prices and lower consumer prices.

2. METHOD
A number o f s t u d i e s on g r a i n t r a d e r s have been undertaken wi th t h e o b j e c t i v e o f e v a l u a t i n g t h e i r impact on producer and consumer w e l f a r e . Such s t u d i e s i n c l ude t h o s e by Seenappa ( l 9 8 7 ) , Gordon ( l 9 8 8 ) , Scarborough ( l 9 8 9 ) , Amani and Kapunda (1990) , Amani and Maro (1991), Coul t e r and Go1 ob (1991) , and Santorum and T i b a i j u k a (1991) . Whereas t h e s e s t u d i e s have shed some l i g h t on t h e performance o f g r a i n t r a d e r s , most o f them have based t h e i r conc lus ions on c r o s s - s e c t i o n a l d a t a f o r a p a r t i c u l a r y e a r . The only excep t ion , perhaps , i s Amani and Maro's s t u d y , which covered two farming seasons . The c u r r e n t s t u d y was des igned t o c o n t r i b u t e t o t h e d e b a t e by c a r r y i n g t h e a n a l y s i s f o r a much l o n g e r pe r iod and o b t a i n i n g c e r t a i n l o n g i t u d i n a l in fo rmat ion . To ach ieve t h i s o b j e c t i v e , t h e s tudy had t o r e l y on t r a d e r r e c a l l , which can a p r i o r i be c r i t i c i z e d on r e l i a b i l i t y grounds.
The s t u d y was conducted between mid-August and December 1991. All 20 r e g i o n s o f mainland Tanzania were covered. Because i t i s d i f f i c u l t t o l o c a t e wholesa le t r a d e r s when t h e y a r e based i n r u r a l a r e a s , t h e s tudy concen t ra ted on t r a d e r s i n urban a r e a s .
In g e n e r a l , t h e number o f wholesale t r a d e r s (and volume o f g r a i n s t r a d e d ) i s a f u n c t i o n o f s i z e o f t h e urban populat ion and i t s l o c a t i o n r e l a t i v e t o main s o u r c e s o f g r a i n s u r p l u s . One w i l l f i n d more wholesale t r a d e r s i n regional h e a d q u a r t e r s than i n d i s t r i c t headquar te r s . Consequently, t h e p ropor t ion o f w h o l e s a l e r s s e l e c t e d f o r i n t e r v i e w was high i n b ig towns and t h e p ropor t ions d e c l i n e d f o r small towns.
A sample of wholesale t r a d e r s was s e l e c t e d from a l l r e g i o n s . In some markets t h e sample was randomly drawn from a l i s t o f wholesale t r a d e r s . However, such a 1 i s t was n o t a v a i l a b l e i n some markets and i t was d i f f i c u l t t o p repare such a l i s t because o f a l a c k o f coopera t ion from t r a d e r s . In such c a s e s , r e s e a r c h e r s in te rv iewed on ly t h o s e whol e s a l e t r a d e r s who were w i l l ing t o c o o p e r a t e , reducing and b i a s i n g t h e o r i g i n a l l y envisaged sample s i z e . The l a c k o f c o o p e r a t i o n from many t r a d e r s had t o do wi th t h e i r f r u s t r a t i o n wi th t h e government 's f a i l u r e t o recognize t h e i r r o l e i n a g r i c u l t u r a l marketing and t o p rov ide them with some form of c o n c r e t e , o f f i c i a l s u p p o r t . A t t h e end o f t h e survey a t o t a l o f 58 whol e s a l e t r a d e r s were in te rv iewed , 53 i n up-country reg ions and 5 i n Dar e s Salaam.
To unders tand what new i n s t i t u t i o n s evolved i n t h e p r i v a t e s e c t o r , we d i d a c a s e s t u d y o f Tandale market , t h e l a r g e s t urban g r a i n market in Dar e s Salaam, a s a c a s e s t u d y . Tandale r e c e i v e s food g r a i n s from s e v e r a l r e g i o n s of t h e coun t ry .

3. EVOLUTION OF MARKETING STRUCTURE
The recent evolution of the marketing structure in Tanzania can be viewed from three main policy periods. First, the single-channel marketing system was in effect before 1984. Second, a quantity-restricted period occurred from 1984 to 1987. Third, the lifting of quantity restrictions in 1987 marked the beginning of the period of de facto liberalization - a policy which has persisted until now.
The period before 1984 was dominated by a single-channel marketing system for a1 most a1 1 agricultural commodities and farm inputs. Only cooperative unions, marketing boards, and crop authorities could undertake marketing functions. A number of important changes in marketing organization were made between independence and 1984, parti cul arl y off i ci a1 marketing arrangements, real location of existing marketing facilities, and official pricing. Private grain traders were el iminated from the market by the 1962 Agricultural Products Act, which institutionalized cooperatives throughout the country. The Act forced some cooperatives with no experience and capacity for procurement to assume the responsi bil i ty of primary marketing. By 1976 many cooperatives were taking financial losses and were perceived as not adequately serving the interests of farmers. However, when marketing boards and crop authorities rep1 aced cooperatives in 1976, the new institutions only compounded the inefficiencies in agricultural marketing. Private traders stepped in where these state institutions failed, and para1 lel markets for food grain emerged.
By 1984 it was apparent to the government that state control of agricultural marketing had not achieved the government's objectives, particularly the one of national food security. The collapse of the formal institutions was obvious, creating pressure for the 1 i beral ization of agricultural marketing. Such pressure was fueled by two observations. First, official price controls for staple grains could not be maintained and hence open market prices became the effective prices. Second, inefficient official marketing agencies had put severe budgetary pressure on the government as the government found it necessary to subsidize their activities.
As of March 1984 the government allowed private traders to purchase and transport up to 500 kilograms of food crops at any one time. There was no condition as to the source of purchase. This policy change slightly eased food shortages. Cooperatives continued to be the main participant in food grain markets.
In 1987 the quantity restriction was removed, but traders were not allowed to purchase directly from farmers. They were obliged to purchase from primary societies or other offici a1 agencies. However, since prices paid by official

agencies were admini stered prices and did not ref1 ect actual economic costs, private traders continued to purchase directly from farmers at para1 1 el marked prices. In 1989 the government reiterated its support for private traders, while reaffirming, however, the restrictive condition on the source of purchase. To date, no official policy statement has relaxed this condition. This situation has created considerable uncertainty among private traders about the seriousness of the government's commitment to full liberalization. Moreover, the government's verbal support for the private sector has not produced any tangible support, e.g., official government assistance in the areas of market infrastructure and credit programs tailored to private grain traders.

4. EMPIRICAL ANALYSIS
GENERAL CHARACTERISTICS OF TRADERS I N SAMPLE
The t r a d e r s have been g rouped i n broad g e o g r a p h i c a l z o n e s . The zone d e s c r i b e d a s t h e Big Four c o m p r i s e s t h e f o u r main maize-producing r e g i o n s s i t u a t e d i n t h e west o f t h e c o u n t r y : Rukwa, Mbeya, I r i n g a , and Ruvuma. The Nor the rn zone i s c o n s t i t u t e d by Arusha , K i l i m a n j a r o , Tanga , and Mara. These f o u r r e g i o n s a l l b o r d e r Kenya. The Wes t ICen t r e zone c o m p r i s e s much o f t h e s e m i a r i d a r e a s o f t h e c o u n t r y (Mwanza, Sh inyanga , Tabora , S i n g i d a ) augmented by Kagera and Kigoma r e g i o n s i n t h e n o r t h w e s t . F i n a l l y , t h e C o a s t a l zone i s compr ised o f C o a s t , Morogoro, Li nd i , and Mtwara. Who1 e s a l e t r a d e r s i n up-count ry r e g i o n s c o n c e n t r a t e d i n i n t r a r e g i o n a l t r a d e b u t a few a r e i n v o l v e d i n i n t e r r e g i o n a l g r a i n t r a d e . I n t e r r e g i o n a l t r a d e t a k e s p l a c e between a c c e s s i b l e food s u r p l u s r e g i o n s ( I r i n g a , Mbeya, Dodoma, Morogoro, Arusha , and Ruvuma) and Dar e s Salaam.
I n t h e e a r l y y e a r s o f t h e a d j u s t m e n t p e r i o d (1984 t h r o u g h 1 9 8 7 ) , t h e e n t r y i n t h e p r i v a t e g r a i n t r a d e a t t h e w h o l e s a l e l e v e l r e q u i r e d c o n s i d e r a b l e dynamism, mobil i t y , and a w i l l i n g n e s s t o t a k e r i s k s . T h i s e x p l a i n s why t h e a v e r a g e t r a d e r i n o u r sample i s r e 1 a t i v e l y young ( s e e Tabl e 1 ) . T r a d e r s i n o u r sample were g e n e r a l l y i n t h e i r m i d - t h i r t i e s , w i t h t h e a v e r a g e a g e b e i n g 35. Moreover , l o o k i n g a t t h e a v e r a g e number o f y e a r s d u r i n g which t h e t r a d e r s were o p e r a t i n g , we o b s e r v e t h a t t r a d e r s i n t h r e e o u t o f f o u r zones have o p e r a t e d on a v e r a g e f o r l e s s t h a n t h e o v e r a l l a v e r a g e o f seven y e a r s . Thus , w h o l e s a l e g r a i n t r a d i n g i s a r e l a t i v e l y new o c c u p a t i o n f o r many o f t h e t r a d e r s . T h i s a1 s o e x p l a i n s why t h e a v e r a g e age and number o f y e a r s o f o p e r a t i o n i n t h e Nor the rn zone i s s o much h i g h e r t h a n i n t h e o t h e r z o n e s . The r e g i o n s i n t h e Nor the rn zone , and i n p a r t i c u l a r Ki l i m a n j a r o and Tanga , have been r e 1 a t i v e l y s h i e l d e d from a c t u a l government e n f o r c e m e n t o f t h e o f f i c i a1 m a r k e t i n g c h a n n e l s . De f a c t o l i b e r a l i z a t i o n o f t h e g r a i n t r a d e o c c u r r e d i n most o f t h e r e s t o f t h e c o u n t r y s i n c e t h e mid-1980s, b u t had b a s i c a l l y been c h a r a c t e r i s t i c o f t h e Nor the rn r e g i o n s s i n c e t h e mid-1970s.
The g e n d e r b f a c t o r s .
who1 e s a l e g r a i n t r a d e i s dominated by men ( s e e Tabl e 2 ) . The c u r r e n t i a s may be t h e r e s u l t o f t h e combined e f f e c t o f r e l i g i o u s and p o l i t i c a l
I s l a m r e s t r i c t s women's m o b i l i t y , and women's l e s s e r p o l i t i c a l power makes i t more d i f f i c u l t f o r them t o o p e r a t e s u c c e s s f u l l y i n ma jo r p a r a l l e l t r a d e a c t i v i t i e s . C u r r e n t l y , t h e main r o l e o f f ema le t r a d e r s , t h e n , i s s i t u a t e d a t t h e r e t a i l l e v e l . However, i n r e c e n t y e a r s , l i b e r a l i z a t i o n h a s r e s u l t e d i n an i n c r e a s e o f e n t r y i n t o t h e w h o l e s a l e t r a d e by f ema le t r a d e r s , even i n p r e d o m i n a n t l y Muslim r e g i o n s such a s Tanga.
Most w h o l e s a l e g r a i n t r a d e r s do n o t have e d u c a t i o n a l q u a l i f i c a t i o n s above t h e p r i m a r y schoo l l e v e l ( T a b l e 3 ) . However, s i n c e t h e Tanzan ian government p o l i c y h a s e x p l i c i t l y b i a s e d a g a i n s t s econda ry e d u c a t i o n r e l a t i v e t o p r imary

T a b l e 1 - T r a d e r s ' Average Age and t h e Number o f Years o f O p e r a t i o n
Years o f Zone Age O p e r a t i o n
Big Four
Nor the rn
Wes t ICen t r e
Coas t
Dar e s Sa laam
T o t a l s a m p l e 34 7
S o u r c e : Computed from s u r v e y d a t a .
Note: The z o n e s a r e c o n s t i t u t e d a s f o l l o w s . Big Four : Rukwa, Ruvuma, Mbeya, and I r i n g a . Nor the rn : Tanga , K i l i m a n j a r o , Arusha and Mara. Wes t ICen t r e : Kigoma, T a b o r a , Mwanza, Kagera , Sh inyanga , S i n g i d a and Dodoma. C o a s t : Morogoro, L i n d i , Mtwara, and C o a s t .

Table 2 - Gender Distribution
Ma1 e Femal e Total
Big Four
Northern
West/Centre
Coast
Dar es Salaam
Total sample 5 0
Source: Computed from survey data.

Table 3 - Education
Level of Education
Zone Primary Technical Secondary Other
B i g Four 9
Northern 9
West/Centre 2 1
Coast 7
Dar es Salaam 5
Total sample 5 1 1 3 3
Source: Computed from survey data.

education in general, it is unl i kely that the 1 ow 1 evel s of education found are in any way indicative of traders' preferences for formal education.
SUBJECTIVE EVALUATION OF THE TRADING ENVIRONMENT
Given our interest in the effect of policy changes on traders' behavior on the one hand and the lack of quantitative data concerning crucial parameters of the marketing environment on the other, we decided to collect qual i tative recall information from the traders. For instance, we asked traders to give us their impression of the level of competition they faced during each year of operation. A very 1 ow 1 evel of competition was assigned a numerical val ue of zero and a very high level of competition was assigned a value of four, and in between we had low, normal, and high; the same ranking applied to other variables. Such questions covered the entire time the trader had been operating. The specific format of the questions that we used had been suggested to us by grain traders themselves during a pretesting of the questionnaire. The questions captured changes in variables that traders thought were crucial. During the interviews, traders generally responded enthusiastically to this format. We present the results in Figures 1, 2, 3, 4, 5, and 6. The figures illustrate the general trends in the marketing environment. A priori, however, one can take issue with the reliability of the data.'
In the beginning of the 1980s Tanzania found itself in a severe economic crisis that had contractionary effects on production. A drought in 1982183 aggravated the situation. Parallel markets for grain trade were illegal and enforcement was at times severe. From the graphs we can see that the crisis had a significant effect on the evaluation of supply and demand conditions by the traders. From 1980181 until 1983184, supply to the parallel grain markets decreases, and purchase prices on these markets increase (see Figure 1). Starting in 1982183, demand for food grains falls, whereas the sale price of food grains on the parallel market increases sharply (see Figure 2).
It is important to understand the re1 ation between the increase in purchase price from 1981182 until 1983184 and the supply situation. First, rainfall was below normal in 1982183. This reduced total supply and directly affected the purchase price at the producer level through an increase of the relative subsistence value of grain.' Second, marketed quantities were affected because of the enactment of economic legislation that banned all parallel market activities. The first reaction of the government to the crisis of 1979 and 1980 had been to postulate that the crisis was the result of an imperfect implementation of soci a1 i st pol icies. The government reasoned that the offici a1 institutions of the planned economy needed to be more rigorously enforced, so they vigorously cracked down on the unofficial economy. The crackdown was known as the "War on Economic Saboteurs" and characterized most of the 1982183 and
However, one should ask oneself whether one would also immediately discard such qual itative information if the sample would have consisted of, say, the impressions of 53 American businessmen.

Figure 1 - Subjective Evaluation by Traders of Supply Conditions (1980/81-1991/92)
Marketing year
--- Supply - Purchase price

Figure 2 - Subjec t ive Eva lua t ion by Traders o f Demand Condit ions (1980/81-1991/92)
Marketing year
------ Demand - Sale price

Figure 3 - Subjec t ive Eva lua t ion by Traders o f Market Condit ions (1980/81-1991/92)
Marketing year
------ Competition - Profits

Figure 4 - S u b j e c t i v e E v a l u a t i o n by T raders o f T r a n s p o r t C o n d i t i o n s (1980/81-1991/92)
I 1 I I I I I I I I I I I
80181 81/82 82/83 83/84 84/85 85/86 86/87 87/88 88/89 89/90 90/91 91/92 Marketing year
- Transport costs - Transport supply

-18-
Figure 5 - T r a d e r s ' Recall o f Real Loading Cos t s (1980/81-1991/92)
Note :
I I I 1 I I I I
8o)ai e l k 2 eve3 83/84 84/85 85/86 86/87 87/88 eeka 89/90 go191 Marketing year
------ On-loading - Off-loading
Cos ts a r e p e r bag of maize i n r e a l terms (CPI d e f l a t e d ) .

Figure 6 - S u b j e c t i v e E v a l u a t i o n by T r a d e r s o f NMC Purchases and S a l e s (1980/81-1991/92)
l 1 I I I I I I I I I I I I
80/81 81/82 82/83 83/84 84/85 85/86 86/87 87/88 88/89 89/90 90/91 91/92 Marketing year
------ NMC purchases - NMC sales

1983/84 seasons. That the crackdown had the e f fec t of ra is ing transaction costs by increasing the r i s k s of the grain trade can be inferred from the decline in t r ader p r o f i t s (see Figure 3 ) .
This s i tua t ion changed in the 1984/85 season, when the c r i s i s forced the government t o reevaluate the basic premises of i t s pol ic ies . Grain t raders were now allowed t o t rade u p t o 500 kilograms a t any one time. We observe a number of changes in the trading environment as a r e s u l t of the change in policy. F i r s t , we see an immediate s t a b i l i z a t i o n of the r e l a t i v e purchase price as evaluated by the t r aders (see Figure 1 ) . Second, even in the presence of stagnant r e l a t i v e producer pr ices , we see a strong supply reaction (see Figure 1 ) . Third, p r o f i t s make a quick and steep one-time r i s e a f t e r which they slowly decrease f o r the remainder of the e n t i r e pos t l ibera l iza t ion period (see Figure 3 ) . The r i s e in p r o f i t s jus t a f t e r 1 iberal izat ion probably r e s u l t s from the abi 1 i t y of the t r aders who were a1 ready operating a t the time of 1 i beral i za t i on, or who immediately entered the market a t t h i s time, t o exploit the re la t ive ly low level of competition. I t i s obvious, however, from the l a t e r trend tha t such p r o f i t s gradually f e l l as competition increased i n l a t e r years.
Competition among wholesale t r aders increased throughout the period under consideration (see Figure 3 ) . According t o the t r aders , however, competition was increasing even before l i b e r a l i z a t i o n , i . e . , before 1984/85. However, the sampled t r aders who could answer questions on the f i r s t half of the 1980s were primarily s i tua ted i n the Northern part of the country, where government control of the t rade was l e s s rigorous than elsewhere. Whereas the reported increase i n competition from 1981/82 unt i l 1984/85 was accompanied by an expected decrease in p r o f i t s from 1981/82 unt i l 1983/84, a temporary upturn i n p r o f i t s took place from 1983/84 t o 1984/85, the f i r s t years of de fac to 1 iberal iza t ion. After these years , the makeup of the sample changes, because t raders i n other regions of the country entered the wholesale t rade . The temporarily high p r o f i t s made in 1984/85 thus a t t r ac ted more t r aders , competition increased, and p rof i t s consequently f e l l .
S ta r t ing in the 1987/88 season, a more s t ab le economic environment s e t i n . While s a l e pr ices s t ab i l i zed (see Figure 2 ) , purchase prices s t a r t ed an upward trend (see Figure 1 ) . The grain trade now entered a period i n which increasing competition between t r aders a t the producer 1 eve1 began t o drive producer prices u p . This would a1 so explain why t raders evaluated r e l a t i v e supply as decreasing in t h i s period (see Figure 1 ) . This hypothesis becomes even more plausible i f we take in to account t h a t r a in fa l l was above average unti l 1990/91, a s i tua t ion which should a p r io r i not be compatible w i t h r i s ing producer pr ices .
Transport c o s t s , according t o the sampled t r aders , were re la t ive ly s table unti 1 1985/86, when they increased signi f i can t ly3 (see Figure 4 ) . However, they
More than 70 percent of t o t a l t r a f f i c i n Tanzania i s carr ied by the road network. The railway i s the second mode of t ranspor t , b u t currently of l i t t l e s igni f icance t o the t ranspor ta t ion of food crops. The t o t a l road network i s
(continued . . . )
were t e m p o r a r i l y reduced i n t h e nex t marke t ing season (1986/87), most l i k e l y because o f t h e inc rease i n a v a i l a b i l i t y o f impor ts (e.g. , spare p a r t s ) under t he own-funded impor t scheme t h a t was launched i n 1986. A f t e r 1986187, g i ven t h e s t r onge r deval u a t i o n s o f t h e para1 1 e l market f o r e i g n exchange r a t e t h a t accompanied t h e deva lua t i ons o f t h e o f f i c i a1 f o r e i g n exchange r a t e , t r a d e r s f e l t t h a t t r a n s p o r t c o s t s con t inued t o inc rease i n r e l a t i v e terms. Traders s t a t e t h a t a f t e r 1987188 they a l s o exper ienced a r e d u c t i o n i n t h e r e l a t i v e supply o f t r a n s p o r t a t i o n . T ranspo r t a t i on con t inues t o be a major bo t t l eneck t o g r a i n market expansion, i nc reas ing i n r e1 a t i v e importance as t h e volume o f t r a d e grows.
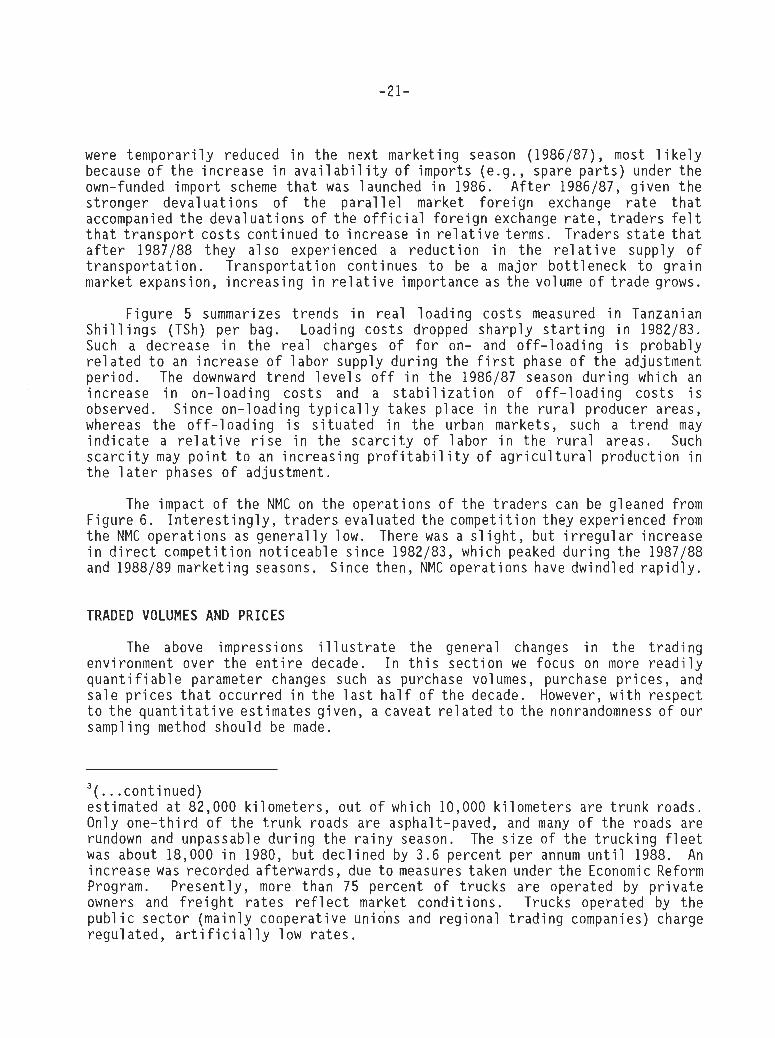
F i gu re 5 summarizes t r ends i n r e a l l o a d i n g cos t s measured i n Tanzanian S h i l l i ngs (TSh) per bag. Loading cos ts dropped sha rp l y s t a r t i n g i n 1982183. Such a decrease i n t h e r e a l charges o f f o r on- and o f f - l o a d i n g i s probably r e l a t e d t o an inc rease o f l a b o r supply d u r i n g t h e f i r s t phase o f t h e adjustment pe r i od . The downward t r e n d l e v e l s o f f i n t h e 1986/87 season d u r i n g which an inc rease i n on- load ing cos t s and a s t a b i l i z a t i o n o f o f f - l o a d i n g cos t s i s observed. S ince on-1 oadi ng t y p i c a l 1 y takes p l ace i n t h e r u r a l producer areas, whereas t h e o f f - l o a d i n g i s s i t u a t e d i n t he urban markets, such a t r e n d may i n d i c a t e a r e l a t i v e r i s e i n t h e s c a r c i t y o f l a b o r i n t he r u r a l areas. Such s c a r c i t y may p o i n t t o an i nc reas ing p r o f i t a b i l i t y o f a g r i c u l t u r a l p roduc t i on i n t h e l a t e r phases o f adjustment.
The impact o f t h e NMC on t h e opera t ions o f t h e t r a d e r s can be gleaned from F igu re 6. I n t e r e s t i n g l y , t r a d e r s eva luated t h e compe t i t i on t hey exper ienced from t h e NMC ope ra t i ons as g e n e r a l l y low. There was a s l i g h t , bu t i r r e g u l a r inc rease i n d i r e c t compe t i t i on n o t i c e a b l e s i nce 1982183, which peaked d u r i n g t h e 1987/88 and 1988189 marke t ing seasons. Since then, NMC opera t ions have dwind led r a p i d l y .
TRADED VOLUMES AND P R I C E S
The above impressions i l l u s t r a t e t he general changes i n t h e t r a d i n g environment over t h e e n t i r e decade. I n t h i s s e c t i o n we focus on more r e a d i l y q u a n t i f i a b l e parameter changes such as purchase volumes, purchase p r i ces , and s a l e p r i c e s t h a t occur red i n t h e l a s t h a l f o f t h e decade. However, w i t h respec t t o t h e q u a n t i t a t i v e es t imates g iven, a caveat r e l a t e d t o t h e nonrandomness o f our sampl ing method should be made.
3 ( . . .cont inued) es t imated a t 82,000 k i l ome te r s , ou t o f which 10,000 k i l ome te r s are t r u n k roads. Only o n e - t h i r d o f t h e t r u n k roads a re asphalt-paved, and many o f t he roads are rundown and unpassable d u r i n g t h e r a i n y season. The s i z e of t h e t r u c k i n g f l e e t was about 18,000 i n 1980, bu t d e c l i n e d by 3.6 percent pe r annum u n t i l 1988. An i nc rease was recorded a f te rwards , due t o measures taken under t h e Economic Reform Program. P resen t l y , more than 75 percent o f t r u c k s a re operated by p r i v a t e owners and f r e i g h t r a t e s r e f l e c t market c o n d i t i o n s . Trucks operated by t he pub1 i c s e c t o r (ma in ly coopera t i ve unions and reg iona l t r a d i n g companies) charge regu la ted , a r t i f i c i a l l y l ow r a t e s .

We investigate trends for clusters of regions since l iberalization can be expected t o affect regions different ly, given certain differentiating factors such as the agroclimate, population density, and transportation infrastructure. The clusters were defined on the basis of a few genera1 characteristics. Data are for the main food grain in Tanzania, i .e . , maize.
In some regions in Tanzania poor roads and the resulting high transportation costs may prevent traders from stepping up the i r ac t iv i t ies . We have grouped such regions under the heading "No Transport." Procurement of grains to the regional capital in t h i s group i s typically from within the same region only. Another group of regions has access to a relatively better transportation network and high re la t ive population densit ies, and they often seems t o function as a "hub" for interregional, or even international grain movements. This cluster i s somewhat euphemi s t ical ly 1 abel 1 ed "Good Transport. " A number of regions produce a considerable maize surplus and have an intermediate qua1 i ty of road infrastructure. Such regions are grouped as "Surplus and Transport." The Dar es Salaam market i s atypical in that although i t i s the largest consumption center in Tanzania, i t i s located within a food-deficit zone. Dar es Salaam thus procures most of i t s food from relatively distant regions.
Tremendous increases in average volumes traded have occurred in the "Good Transport" group (see Table 4 ) . The traders in our sample had increased their volume more than ten-fold within a period of five years. Equally, the traders in the "Surplus and Transport" group as well as the Dar es Salaam market increased the volume traded, a1 though much less dramatically as the previous group. The trade response in the "No Transport" c luster was, as perhaps expected, poor. From 1985186 until 1990191 act ivi ty levels hardly seemed t o increase a t a l l , although the 1990191 season saw a significant r i s e i n average volume purchased. I t should be pointed out that the pan-territorial price system had subsidized the production of maize in the more remote regions. Part of the stagnation observed, then, may be attributed to a simple reversal of an a r t i f i c i a l l y created maize supply in such remote regions.
With respect t o nominal purchase prices, we f i r s t note t h a t the absolute level of the purchase prices underlines the basic differences between the regional groups. A t the beginning of the period under consideration, purchase prices are lowest in the "Surplus and Transport" group and highest in the more densely populated "Good Transport" group. Nominal prices in the "No Transport" group are a t an intermediate level. A t the end of the period, the "No Transport" g r o u p has switched ranks with the "Surplus and Transport" g roup : i t has now the lowest nominal level of purchase prices. Such a trend seems t o confirm our hypothesi s of a broad geographical restructuring induced by market forces.
The developments a f te r 1985186 in terms of real price levels are equally divergent. The "Surplus and Transport" g r o u p has seen the most encouraging response t o the 1 i beral i zat i o n : real producer prices have increased substantially, probably due t o increased competition among traders. The 1990191 increase might have been exaggerated, however, because of expectations of a drought which in the end did n o t materialize. In the No Transport group, we see the fo l l owing pattern: real producer prices i n i t i a l l y decreased, then gradual ly
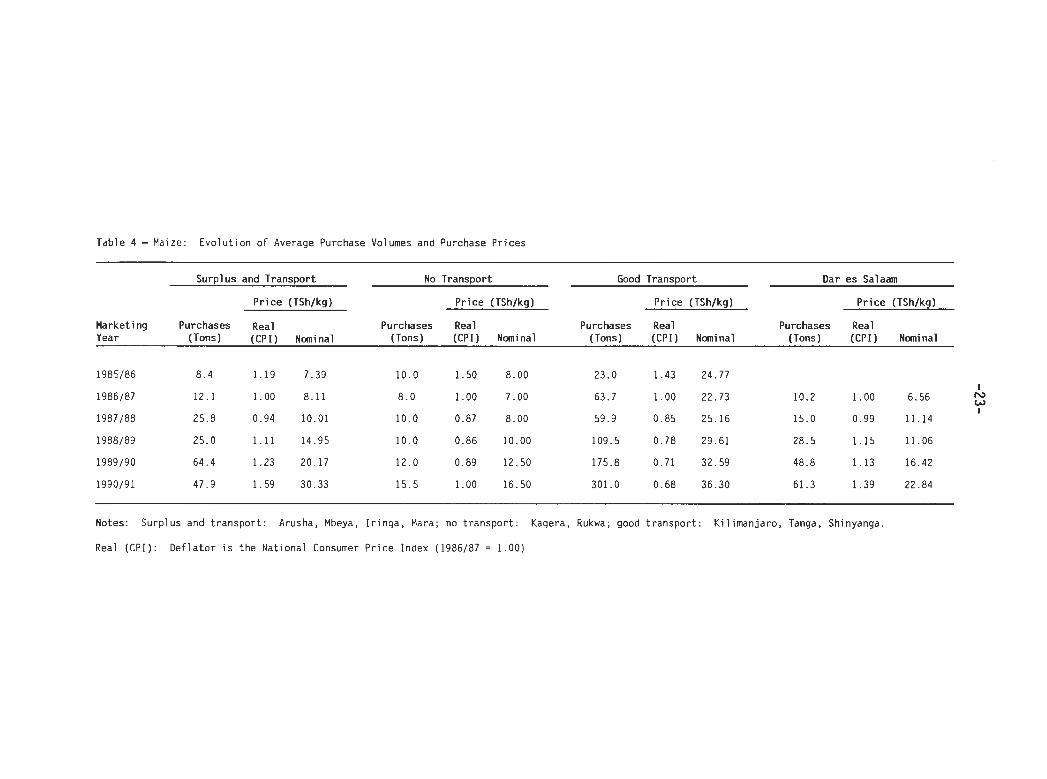
Table 4 - Maize: Evo lu t i on o f Average Purchase Volumes and Purchase Pr ices
- --
Surplus and Transport No Transport Good Transport Oar es Salaam
P r i c e (TSh/kg) P r i c e (TSh/kg) P r i c e (TSh/kg) P r i c e (TSh/kg)
Harket i ng Purchases Real Purchases Real Purchases Real Purchases Real Year (Tons) (CPI) Nominal (Tons) (CPI) Nominal (Tons) (CPI) Nominal (Tons) (CPI) Nominal
Notes: Surplus and t ranspo r t : Arusha, Mbeya, I r i n g a , Mara; no t ranspo r t : Kagera, Rukwa; good t ranspo r t : K i l iman ja ro , Tanga, Shinyanga.
Real (CPI) : D e f l a t o r i s t he Nat ional Consumer P r i c e Index (1986187 = 1.00)

r e t u r n e d t o e a r l i e r l e v e l s . We can hypo thes i ze t h a t t h i s t r e n d was caused by changes i n t h e l e v e l o f c o m p e t i t i o n among t r a d e r s . I n i t i a l l y , b a r g a i n i n g power may have t i l t e d towards t h e t r a d e r s , b u t i nc reased t r a d e r c o m p e t i t i o n s h i f t e d t h e b a r g a i n i n g power back t o t h e p roducers .
Real purchase p r i c e s i n t h e good t r a n s p o r t g roups decreased d u r i n g and a f t e r ad jus tmen t . As a l r e a d y ment ioned, t h e r e g i o n s i n t h i s group ( p a r t i c u l a r l y K i l i m a n j a r o and Tanga) f u n c t i o n as a hub f o r i n t e r r e g i o n a l t r a d e . S u b s t a n t i a l i n c r e a s e s i n marketed supp ly seem t o have d r i v e n purchase p r i c e s down.
Dar es Salaam p r o c u r e s most o f i t s maize f r o m r e l a t i v e l y d i s t a n t s u r p l u s r e g i o n s . Thus, t h e purchase p r i c e s quoted f o l l o w e s s e n t i a l l y t h e t r e n d o f t h e s u r p l u s and t r a n s p o r t g roup.
T u r n i n g t o t h e consumer s i d e (Tab le 5), we see t h a t t h e i n c r e a s e i n p roducer p r i c e s was passed on t o t h e consumers i n a l l g roups. E s p e c i a l l y i n t h e Good T r a n s p o r t g roup, consumers have b e n e f i t e d i n r e a l terms f rom t h e i n c r e a s e d supp ly and compet i t i o n among t r a d e r s .
We have no d i r e c t i n f o r m a t i o n on t h e e x a c t c o m p o s i t i o n o f m a r k e t i n g marg ins : such i n f o r m a t i o n i s d i f f i c u l t t o o b t a i n th rough a survey. We can, however, compare t h e r e l a t i v e d i f f e r e n c e between s a l e and purchase p r i c e ove r t i m e . The r e s u l t i n g t r e n d s a r e g i v e n i n Tab le 6. For a1 1 groups, r e 1 a t i v e marg ins between s a l e and purchase p r i c e have remained a p p r o x i m a t e l y s t a b l e . However, s i n c e t r a n s p o r t c o s t s have c o n t i n u e d t o i nc rease , p r o f i t marg ins must have been reduced. T h i s wou ld be c o n s i s t e n t w i t h t h e p e r c e p t i o n o f t h e t r a d e r s themselves (see F i g u r e 3 ) .
INVESTMENT
The main component o f t h e c a p i t a l necessary t o ope ra te g r a i n t r a d e a t t h e who lesa le l e v e l i s c o n s t i t u t e d by w o r k i n g c a p i t a l i n v e s t e d i n g r a i n s tocks . G iven t h e l a r g e i n c r e a s e s i n average t r a d e d volumes most p r o f i t s made have p r o b a b l y been plowed back i n t o h i g h e r work ing c a p i t a l o u t l a y s .
G iven t h e i l l e g a l i t y wh ich s t i l l sur rounds t h e t r a d e , one shou ld n o t expect t r a d e r s t o i n v e s t i n l a r g e and v i s i b l e permanent s t r u c t u r e s such as s t o r a g e b u i l d i n g s . Nonethe less , s t o r a g e b e h a v i o r has s i g n i f i c a n t l y changed d u r i n g t h e p e r i o d under c o n s i d e r a t i o n . Look ing a t Tab le 7, we see t h a t s to rage behav io r between 1985 and 1991 has b a s i c a l l y changed i n one r e s p e c t : whereas t r a d e r s used t o s t o r e a c o n s i d e r a b l e p a r t o f t h e i r produce i n t h e i r own house (maybe t o a v o i d t o o much a t t e n t i o n ) , t h e y have s h i f t e d t h e produce f r o m t h e i r house t o r e 1 a t i v e l y cheap permanent s t o r a g e s t r u c t u r e s and open a i r s to rage . A d d i t i o n a l l y , t h e average amount o f s t o c k a t any t i m e has i nc reased c o n s i d e r a b l y (see Tab le 8 ) . Not o n l y d i d 41.6 p e r c e n t o f t r a d e r s i n 1991 have g r a i n i n s t o c k when t h e y made t h e i r l a s t purchase, as opposed t o o n l y 16.0 p e r c e n t i n 1985, t h e amount i n s t o r a g e a t t h e t i m e o f t h e i r l a s t purchase i n c r e a s e d more t h a n s i x - f o l d . A t t h e same t i m e , maximum s t o r a g e c a p a c i t y i nc reased by 38 p e r c e n t (see Tab le 8 ) .

Table 5 - Maize: Evolution of Sale Prices
Surplus and Transport No Transport Good Transport Dar es Salaam
Real Real Real Marketing Year (CPI) Nominal (CPI) Nominal (CPI) Nominal Real (CPI) Nominal
(Price (TShfkg)
Notes: Surplus and transport: Arusha, Mbeya, Iringa, Mara; no transport: Kagera, Rukwa; good transport: Kil imanjaro, Tanga, Shinyanga.
Real (CPI): Deflator i s the National Consumer Price Index (1986/87 = 1 .00) .

Table 6 - Maize: Evol u t i o n of Gross Marketing Margins (1985186-1990191)
(Sale - Purchase Price) / Purchase Price
Marketing Surplus and Good Dar es Year Transport No Transport Transport Sal aam Tot a1
To ta l .36 .66 .29 .90 .50
Note: Simple averages over a1 1 traders.

Table 7 - Storage Structure
Iron Roof, Thatched Roof, Open Air Brick Walls, Mud Walls, Earth (Temporary
Year Own House Cement Floor Fl oor Storage) Total
(Count Percent)
Source: Computed from survey data.

Table 8 - Storage Behav io r
D id you have stock Maxi mum remaining a t l a s t Stock remaining storage
Year purchase? a t l a s t purchase capaci ty
Yes N o

To complement our i n q u i r y i n t o investment behavior, we a l so asked what was c a l l e d t h e "TSh 1,000,000" quest ion, o r t h e "$5,000" quest ion. We asked t he t r a d e r s t o i n d i c a t e t o us how they would use TSh 1,000,000 i n p r o f i t s . They had t o d i s t r i b u t e t h e f u l l amount over 20 f i x e d ca tegor ies . The r e s u l t s a re g iven i n Table 9. As expected, 30.1 percent o f such p r o f i t s would be re i nves ted i n work ing c a p i t a l , i.e., used t o increase t h e sca le o f t h e t r ade . More permanent business assets would use o n l y 5.7 percent o f t h e p r o f i t s , whereas r e a l e s t a t e (15.4 percen t ) and farm assets (14.4 percen t ) a re apparen t l y considered d e s i r a b l e investment p r o j e c t s . Note t h a t a r e l a t i v e l y h i gh p r o p o r t i o n o f t h e p r o f i t s i s saved (28.6 percen t ) . Th is may i n d i c a t e t h a t t r a d e r s may be t h i n k i n g about investment p r o j e c t s which s i g n i f i c a n t l y exceed t h e $5,000 l e v e l . The o f t e n heard argument t h a t t r a d i n g p r o f i t s would be spent on more o r l e s s "unproduct ive" investments does n o t f i n d co r robo ra t i on i n our survey r e s u l t s . Other use ca tego r i es combined o n l y a t t r a c t 6.0 o f t h e p r o f i t s .

Table 9 - Intended Use o f P r o f i t s
Sum Percent
Working c a p i t a l 30.1
Buy crops f o r business 23.3
Buy goods f o r r e s a l e 6.8
Business assets 5.7
Buy o r r e p a i r ca r / van / t r uck 1.0
Buy o r improve s to rage s t r u c t u r e s 3.8
Buy o r improve process ing equipment .9
Real e s t a t e 15.4
Buy o r improve own house 13.7
Buy o r improve r e n t a l p r o p e r t y (house o r bus iness) 1.6
Buy o t h e r 1 and . 1
Farm assets 14.4
Buy l i v e s t o c k 4.4
Buy machinery o r imp1 ements f o r farm 6.3
Buy farm 1 and 3.7
Savings 28.6
Keep i t i n t h e house .4
Put i t i n t h e bank o r t h e Post O f f i c e 27.6
Put i t i n a r o t a t i n g sav ings and c r e d i t a s s o c i a t i o n .6
Other 6.0
Lend i t t o o the rs . O
Give i t t o o the rs 1 .1
Buy o r r e p a i r househol d durab l es 1.5
Spend on educa t ion and/or t r a i n i n g o f household o r o t h e r 2 .6
Increase consumption .8
T o t a l 100.0

5. EMERGING PRIVATE INSTITUTIONS
The de facto 1 i beral ization imp1 ied a fundamental transformation of the insti tutional structure involved in grain marketing. Most of the ac t iv i t ies of a government-control led market were rep1 aced by private trade ac t iv i t i e s , which quickly ensured abundant supplies of food grains a t relatively low real prices. 4
Whereas the trade was a risky one, the entry into th i s market was relatively unconstrained given the relatively low levels of in i t i a l capital needed. For instance, even though the transportation infrastructure in Tanzania i s extremely poor, the in i t i a l capital needed t o enter th i s market consists basically only of working capital invested in crop purchases. Moreover, since regionally-based traders trade within the i r region, no substantial capital outlays in transportation or storage assets are needed to enter such markets. I n the case of Dar es Salaam, the transportation costs of i t s interregional procurement of grain are financed by a separate class of traders, i . e . , the brokers used by the traders t o sel l the i r crop. I n other words, even the aspiring long-distance wholesale trader would n o t need exorbitant amounts of in i t i a l capi tal , which would represent significant barriers t o entry.
Capital constraints t o entry had been assumed t o ex is t , however. This assumption was often linked to the fear that the retreat of the government from food marketing would resul t in a new monopolistic domination by Indian and Arab traders, w h o had dominated th i s trade before independence. However, th i s fear proved unjustified. We have n o t come across a single trader of Indian or Arab descent in our survey, nor have we obtained any information t h a t would lead us t o believe t h a t such entry has indeed occurred. Given the absence of such nonindigenous monopolies in the period af te r adjustment, i t might be useful t o point out t h a t the preindependence monopolies of the Arab and Indian trading class , where they existed, were off ic ial monopol i e s , i . e . , formally granted monopolies of the British government, and n o t the result of 1 iberal ized markets.
I n some markets, wholesale traders have begun t o establish their own inst i tut ions so that they can serve the i r interests better. For instance, in Tandale, the largest wholesale market in Dar es Salaam, three formal societies have emerged: an association of traders, an association of brokers (madalali),
I n addition, the monopoly of state-owned crop parastatals (such as the National Milling Corporation) on the production and sale of animal and chicken feed has been broken by new, albei t foreign, private inst i tut ions. These inst i tut ions buy low quality grain from b o t h private traders and parastatal crop bodies and transform i t into animal and chicken feed. Entry into th i s kind of business by indigenous inst i tut ions seems to be constrained by lack of in i t i a l capital .

and an a s s o c i a t i o n o f p o r t e r s . The Mada la l i Assoc ia t i on i s a subset o f t he t r a d e r assoc ia t i on , i .e., one has t o be a member o f t h e t r a d e r s ' assoc ia t i on t o be long t o t h e Madal a1 i group.
The i dea o f e s t a b l i s h i n g an assoc ia t i on o f t r a d e r s o r i g i n a l l y came from the CCM ( t h e r u l i n g p a r t y ) branch i n Tandale and i n 1987, t h e Tandale Vegetable Cooperat ive Soc ie t y was formed. Since g r a i n t r a d e was s t i l l i l l e g a l bu t i n p r a c t i c e t o l e r a t e d , t h e t r a d e r s r e g i s t e r e d as a "Vegetable Assoc ia t ion . " They were u n c e r t a i n as t o whether t h e government would r e g i s t e r them as a Gra in T rad ing Soc ie t y . The i n i t i a l s o c i e t y f a i 1 ed ma in ly because i t s 1 eadership was imposed by t h e l o c a l p a r t y branch. I n 1989, however, a new at tempt was made t o form an independent cooperat i .ve s o c i e t y under t h e same name. The main f u n c t i o n o f t h e s o c i e t y was t o ba rga in f o r reasonable purchase and s a l e p r i c e s on beha l f o f i t s members. The s o c i e t y began w i t h 10 members, evo l v i ng t o 312 members p r e s e n t l y . Out o f t h e c u r r e n t 312 members, 50 a re brokers (mada la l i ) .
An a p p l i c a n t f o r madalal i has t o f u l f i l t h r e e formal cond i t i ons be fo re t he a p p l i c a t i o n i s considered. The formal cond i t i ons are: one has t o be a t r a d e r i n t h e Tandale market; one must be a t l e a s t 18 years o l d ; and one has t o pay t h e a p p l i c a t i o n f e e o f TSh 100. The Soc ie ty ' s Cen t ra l Committee goes through appl i c a t i o n s and i n i t i a l l y se l ec t s those who meet t h e formal c o n d i t i o n s . Meeting those c o n d i t i o n s i s necessary, bu t no t s u f f i c i e n t f o r f i n a l s e l e c t i o n . For t he f i n a l s e l e c t i o n , t h e committee takes i n t o account t h e e x i s t i n g number o f r e g i s t e r e d b rokers and t h e cha rac te r and pas t behav ior o f t h e a p p l i c a n t . Upon acceptance as a member o f t h e soc ie t y , t h e a p p l i c a n t has t o buy f i v e shares o f TSh 1,000 each. An i n i t i a l share o f TSh 1,000 must be p a i d immediately be fo re a c t i v e p a r t i c i p a t i o n i n brokerage. Therea f te r , a b roker pays TSh 100 per g ra i n - loaded t r u c k handled by him. The money from these sources i s p u t i n t h e bank. The money i s used t o a s s i s t s o c i e t y members w i t h genuine f i n a n c i a l problems. I n t e r e s t generated f rom bank depos i t s i s shared among members.
The Tandale Po r t e r s Assoc ia t i on was r e g i s t e r e d i n 1988. Before t h a t , p o r t e r s were work ing as casual employees o f l a r g e t r a d e r s . Since they f e l t g r o s s l y underpaid, they decided t o form t h e i r own o rgan i za t i on . The formal c o n d i t i o n s f o r e n t r y i n t o t h e assoc ia t i on a re t h e payment o f an e n t r y f e e o f TSh 120 once t h e a p p l i c a n t i s accepted, and t h e successfu l complet ion o f a p roba t i on pe r i od . C u r r e n t l y , however, t h e number o f members i s l i m i t e d t o around 160. Membership had increased f rom 100 i n 1989 t o 207 i n 1990, be fo re i t dec l ined t o 157 i n 1991; 50 members were d iscon t inued between 1990 and 1991 f o r va r ious reasons i n c l u d i n g absenteeism and 1 aziness.
I n 1989 a j o i n t meet ing o f p o r t e r s and madal a1 i s d iscussed and f i x e d l oad ing and o f f - l o a d i n g charges. Under t h i s c o l l e c t i v e barga in ing agreement, t h e charges were f i x e d d i f f e r e n t l y f o r d i f f e r e n t crops as shown i n Table 10. These charges have n o t been r e v i s e d a l though p repa ra t i ons a re underway t o do so. For each bag o f f - l oaded , 30 percen t o f t h e income goes t o t h e p o r t e r s ' a s s o c i a t i o n w h i l e t h e remain ing 70 percen t i s shared by a l l members. We have est imated t h e average d a i l y income p e r p o r t e r f rom o f f - 1 oading (Table 11). I n t e r e s t i n g l y , t o compensate f o r t h e nominal f i x i t y o f t h e charge per bag - causing a dec l i n e i n

Table 10 - C o l l e c t i v e Barga in ing Agreement (1989) w i t h Respect t o O f f Loading Charges Between t h e Tandale Po r t e r s Assoc ia t i on and t h e Tandale Vegetable Cooperat ive S o c i e t y
Commodi t y Weight o f Bag (kg) Charge (TSh)
Rice
R ice
Beans
Beans
Maize
F inger M i 11 e t
Round Potatoes
Source: Tandal e Vegetable Cooperat ive Soc ie ty .

Table 11 - Average Daily Income of Porter in Tandale Market
Commod i t v 1989 1990 199 1
Rice 600 1,000 3,000
Maize and other commodities 200 400 2,000
Source: Tandale Vegetable Cooperative Society.

real terms - the number of porters allowed per truck has gone down from 12 in 1989 to 8 1990 and to 4 in 1991.
There are no associations of farmers-cum-traders or transporters in open market food marketing. However, the number of farmers involved in grain trading has increased significantly over time. It is estimated that farmers-cum-traders constitute 50 percent of wholesale traders in the Tandale market and a slightly lower proportion in other urban markets.
In summary, it is important to emphasize at this point that even though the legal framework for market reforms does not yet exist, indigenous private institutions have begun to evolve. If the government would actually legal ize the private sector grain trade and provide a better environment for trade investment, indigenous trade associations and institutions are 1 i kely to mushroom, dealing with a variety of market functions.

6. POLICY RECOMMENDATIONS AND CONCLUSIONS
I n o rde r f o r p r i v a t e t r a d e r s t o operate e f f e c t i v e l y i n market ing o f a g r i c u l t u r a l commodit ies and i npu t s , t he government has t o p rov i de an a t t r a c t i v e business environment. Market ing a c t i v i t i e s o f p r i v a t e t r a d e r s must be l e g a l l y recognized. As o f now, t h e i r a c t i v i t i e s a re o n l y t o l e r a t e d g i ven t h a t t h e 1962 l e g i s l a t i o n , which out1 awed p r i v a t e t r a d e r s f rom involvement i n a g r i c u l t u r a l market ing, has n o t been repealed. Consequently, t r a d e r s a re sometimes harassed by 1 oca l a u t h o r i t i e s . Moreover, t r a d e r s a re concerned about t h e government's ser iousness w i t h r espec t t o f u l l l i b e r a l i z a t i o n o f food marke t ing i n Tanzania. Due t o t h i s u n c e r t a i n t y , p r i v a t e t r a d e r s a re r e l u c t a n t t o i n v e s t i n f i x e d and s p e c i a l i z e d bus iness assets, e.g. , s torage s t r u c t u r e s . Storage s t r u c t u r e s cou ld be b u i l t by t h e government and then leased t o t r a d e r s i n d i v i d u a l l y o r t o genuine t r a d e r coopera t i ves . Traders a re p r e s e n t l y r eques t i ng such investment by t h e government, b u t t h e y a re under t h e impress ion t h a t t h e government seems r e l u c t a n t t o under take any a c t i v i t y t h a t might permanently and f o r m a l l y recognize t h e p r i v a t e g r a i n t r ade .
The government must address i n s t i t u t i o n a l and i n f r a s t r u c t u r a l bo t t l enecks , p a r t i c u l a r l y i n t h e r u r a l areas. These bo t t l enecks i n c l u d e marke t ing s t r uc tu res , feeder roads, and weak research and ex tens ion systems. Addressing those bo t t l enecks i s c r u c i a l f o r c o n s o l i d a t i o n o f t h e p o s i t i v e impacts o f l i b e r a l i z a t i o n measures. Perhaps t he most immediate i n f r a s t r u c t u r a l bo t t l eneck t o be addressed i s t h e poor c o n d i t i o n s o f feeder roads; because o f t h i s s i t u a t i o n p r ima ry marke t ing appears t o be l e s s e f f i c i e n t than secondary market ing as bo th p r i v a t e t r a d e r s and p r ima ry coopera t i ve s o c i e t i e s r e f r a i n f rom t r a d i n g i n remote areas. Cou l t e r and Golob (1991) i n a s tudy i n I r i n g a observed t h a t f o r v i l l a g e s between 15 and 45 k i l ome te r s o f f t h e main highway t h e cos t f o r p r imary market ing (wholesa le assembly) ranges between 9 and 40 t imes t h e c o s t o f secondary market ing. Hence p r i v a t e t r a d e r s do n o t go t o such areas t o buy. I n a d d i t i o n t o improv ing feeder roads, e f f o r t s should a l so be made t o improve reg iona l and t r u n k roads. C u r r e n t l y , poor c o n d i t i o n s o f these roads have kep t t r a n s p o r t cos ts q u i t e h igh; f o r i n t e r r e g i o n a l t r a d e t r a n s p o r t cos t s pe r t r a d e r as a percentage o f purchase p r i c e ranges between 37.8 percen t f o r t h e Morogoro t o Dar es Salaam r o u t e t o 202.6 percen t f o r t h e Rukwa t o Dar es Salaam r o u t e (Santorum and T i b a i j u k a , 1991).
Changing t h e l e g a l framework under which p r i v a t e t r a d e r s operate i s necessary b u t may no t be s u f f i c i e n t t o a t t r a c t investments i n food market ing. Thus i n a d d i t i o n t o 1 egal i z ing p r i v a t e t r ade rs , re forms i n f i n a n c i a l i n s t i t u t i o n s a re u r g e n t l y needed t o make c r e d i t a v a i l a b l e t o t r a d e r s . C u r r e n t l y , on l y coope ra t i ve un ions can ge t c r e d i t f o r c rop purchases. Given t h e ex is tence o f we1 1 -organized ind igenous t r a d e r assoc ia t ions , group-1 ending schemes seem t o ho ld obvious promise. There i s an ongoing exe rc i se t o r e s t r u c t u r e f i n a n c i a l

institutions by introducing private banks, among other things. This will go far in addressing credit requirements of grain traders.
Provision of communication infrastructure should a1 so be the responsi bil i ty of the government. This calls for an improved communications network so that market information could be disseminated promptly for use by all market participants.
The food market 1 i beral i zat i on measures have a1 1 owed private traders to engage in a1 1 food crops and a1 1 agricultural inputs except fertil izer. The main reason for the exclusion of fertil izer is that the government subsidizes the cost of transportation, effectively making fertil izer prices pan-terri tori a1 . To avoid distortion of these prices, the government has appointed cooperatives to distribute fertilizer. However, these cooperatives are reluctant to perform this function because it i s sel dom prof i tab1 e. The government should therefore decontrol fertilizer prices and liberalize fertilizer markets, increasing economies of scope for grain traders.
In conclusion, private grain traders have improved food suppl ies, stabil ized food prices in urban areas, and provided a market to farmers - particularly in accessible areas. Their profit margins have tended to decl ine over time because of increased competition. However, de facto food market liberalization has not been followed by formal legal ization of or active support for the private sector. The resulting uncertainty depresses investment in fixed assets, part i cul arly storage structures. The government has an immediate opportunity to create and/or lease out storage facilities. Moreover, grain traders are constrained by access to credit: formal channels are not interested in lending to them, whereas no appropriate informal credit institutions seem to exist. Given the substantial increase in transport needs, traders also experience a growing scarcity of transportation, which is reflected in an increase in its real cost. Transport and communications networks can be vastly improved.
REFERENCES
Amani, H.K.R., S.M. Kapunda, N. Lipumba, and B.J. Ndulu. 1989. "Impact of Market Liberal ization on Household Food Security in Tanzania." In Household and Na t i ona l Food S e c u r i t y i n Southern A f r i c a . G.D. Mudimu and R.H. 'Bernsten, eds. Harare: University of ZirnbabwelMichigan States University Food Security Research Project, Department of Agricultural Economics.
. 1988. "Effects of Market, Liberalization on Food Security in Tanzania." In Southern A f r i c a : Food S e c u r i t y P o l i c y Opt ions . M. Rukuni and R.H. Bernsten, eds. Harare: University of ZirnbabwelMichigan State University Food Security Research Project , Department of Agricultural Economics.
Amani , H.K.R., and S.M. Kapunda. 1990. "Agricultural Marketing Reform in Tanzania: The Restriction of Private Traders and Its Impact on Food Security." In Food S e c u r i t y P o l i c i e s i n t h e SADCC Region. M. Rukuni, G.D. Mudimu, and T.S. Jayne, eds. Harare: University of ZirnbabwelMichigan State University Food Security Research Project, Department of Agri cul tural Economics.
Amani, H.K.R., and W.E. Maro. 1991. "Household Food Security in Tanzania: Prel iminary Findings from Four Regions. " In Market Reforms, Research P o l i c i e s and SADCC Food S e c u r i t y . M. Rukuni and J.B. Wyckoff, eds. Harare: University of ZimbabweIMichigan State University Food Security Research Project, Department of Agricultural Research.
Berg, E. 1987. "Obstacles to Liberal izing Agricultural Markets in Developing Countries. " In A g r i c u l t u r a l Marke t ing S t ra tegy and P r i c i n g P o l i c y . D. Elz, ed. Washington, DC: The World Bank.
Bond, M. 1983. A g r i c u l t u r a l Responses t o P r i c e s i n Sub-Saharan A f r i c a . IMF Staff Paper 30. Washington, DC: International Monetary Fund, 703-726.
Coulter, J., and P. Golob. 1991. "Liberalization of Cereals Marketing in Sub- Saharan Africa: Implementing Issues." In Report No. 2: Tanzania - A Case Study. Kent, United Kingdom: Natural Resource Institute.
Gordon, H. 1988. Open Markets f o r Maize i n Urban Tanzania: Current Issues and Evidence. Medford, Massachusetts: The Fletcher School, Tufts University.
Santorum, A., and A. Tibaijuka. 1991. Trad ing Responses t o Food Market L i b e r a l i z a t i o n i n Tanzania. Dar es Salaam: Economic Research Bureau, University of Dar es Salaam.

Scarborough, V. 1989. The Current Status of Food Marketing in Tanzania. Kent, United Kingdom: Wye College. '
S e e n a ~ p a , M. 1987. Household Food Security in Tanzania: A Rapid Assessment survey of Few Vi 7 7ages in Shinyanga, ~ t w a r a and Zanzibar. bar es Salaam: UNICEF.