grain boundary segregation and ... -...
TRANSCRIPT

Ceramics International 42 (2016) 11584–11592
Contents lists available at ScienceDirect
Ceramics International
http://d0272-88
n CorrE-m
journal homepage: www.elsevier.com/locate/ceramint
Grain boundary segregation and secondary-phase transitionof (La,Nb)-codoped TiO2 ceramic
Ji-Kang Yan n, Kun-Yong Kang, Jing-Hong Du, Guo-You Gan, Jian-Hong YiFaculty of Materials Science and Engineering, Kunming University of Science and Technology, Kunming 650093, People's Republic of China
a r t i c l e i n f o
Article history:Received 14 February 2016Received in revised form24 March 2016Accepted 7 April 2016Available online 27 April 2016
Keywords:CeramicsCrystal structureGrain boundariesPhase transitionsPoint defects
x.doi.org/10.1016/j.ceramint.2016.04.03442/& 2016 Elsevier Ltd and Techna Group S.r
esponding author.ail address: [email protected] (J.-K. Yan).
a b s t r a c t
The formation and transition of secondary phases in (La, Nb)-codoped TiO2 ceramics were investigatedusing samples prepared by traditional solid-state sintering from anatase TiO2, Nb2O5, and La2O3 oxidepowders. From the microstructure, crystal structure and chemical composition of these samples, asmeasured by SEM, XRD and EDS, the formation mechanism of the secondary phase is determined thoughpoint defect thermodynamical analysis. The results show that LaNbO4 and LaNbTiO6 secondary phasesoriginate from segregation of the point defects NbTi� and La′Ti at grain boundaries, with elastic strainenergy providing the main driving force for this segregation. An increase in sintering temperature causesmore of the LaNbO4 secondary phase to transition to LaNbTiO6. A ternary phase diagram ofLa2O3–Nb2O5–TiO2 was plotted based on binary phase diagrams of La2O3–Nb2O5, Nb2O5–TiO2 andLa2O3–TiO2, which can be used to estimate the relative content of secondary phases in samples sinteredat different temperatures.
& 2016 Elsevier Ltd and Techna Group S.r.l. All rights reserved.
1. Introduction
Titanium dioxide (TiO2) ceramic is an important functionalmaterial in varistors, capacitors and sensors [1]; however, itscrystalline phase composition, microstructure, Schottky barrierstructure and electrical properties can be effectively improved bydoping with metal oxides such as CaO, SrO, Y2O3, BaO, Ta2O5,MnO2, CeO2, Co2O3, Nb2O5, V2O5 and La2O3. The influence of thesedifferent dopants on the physical properties of polycrystalline TiO2
is highly distinguishable [2]; i.e., Nb has an effect on the electricalproperties, Ba and Zr on grain growth, and Al, Ca, and Y on grainboundary segregation behavior. In the case of the latter, Y3þ ionsare an aliovalent dopant that provides both an elastic strain-en-ergy driving force to the grain boundaries for segregation, as wellas an electrostatic driving force for segregation. With regards toelectrical properties, Nb-doping lowers the varistor voltage (V1 mA)and provides a nonlinear coefficient (α) [3], whereas La-dopedTiO2 ceramics possesses a higher V1 mA and α [4]. Thus, in order todevelop TiO2 ceramics with a low V1 mA and high α, both La and Nbcan be co-doped into TiO2.
In addition to the main rutile TiO2 crystalline phase, secondaryphases are often observed in doped-TiO2 ceramics. The chemicalcomposition, microstructure, crystalline phase and crystal latticeof these secondary phases can be characterized using techniques
.l. All rights reserved.
such as SEM, XRD, TEM, EDS and Raman spectroscopy [5–9]. Thishas revealed that the dopant ion Nb5þ is close in radius to Ti4þ ,and so has a high solid solubility in the TiO2 lattice. However, thesolid solubility limit of Y3þ and La3þ dopant ions is very low, asthese have radii far greater than that of Ti4þ . As secondary phasesform when the doping ion concentration is greater than its solidsolubility limit [10,11], their existence is dependent on the size andconcentration of the dopant ion, as well as the sinteringtemperature.
Recent studies have principally focused on formation me-chanisms, measuring methods and secondary phase character-istics, as well as the influence of secondary phases on the structureand properties of the ceramic matrix. This has revealed that sec-ondary phases generally originate from the segregation of dopantsor impurities. That is, the pentavalent cation Nb5þ , which is closein size to Ti4þ , will tend to segregate at Ti sites in the grainboundaries of TiO2 ceramics using electrostatic potential as thedriving force [12,13]. The trivalent cation Y3þ , on the other hand,is much larger than Ti4þ , and so tends to segregate at interstitialsites in the grain boundary using elastic strain energy as thedriving force [11].
Our previous works have demonstrated that the majority ofNb5þ ions dissolve into the TiO2 lattice, with only any remainingcations segregating at the grain boundaries. In contrast, La3þ isalmost completely segregated at the grain boundaries. When theconcentrations of Nb5þ and La3þ at the grain boundaries reach acritical value, there is a chemical reaction between Nb2O5 andLa2O3 that produces a LaNbO4 secondary phase
J.-K. Yan et al. / Ceramics International 42 (2016) 11584–11592 11585
(Nb2O5þLa2O3¼2LaNbO4). With an increase in sintering tem-perature, reactions also occur between LaNbO4 and rutile TiO2 thatproduce an additional secondary phase, LaNbTiO6 [14,15]. As theformation and transition of these secondary phases are relevant tothe type and distribution of point defects segregated at the grainboundaries, further investigation of the grain boundaries and grainboundary segregation is warranted. Mandal developed a novel,simple and nondestructive 3D electron backscatter diffractionmethod that can not only simultaneously measure all five degreesof freedom in grain boundary structures, but also perform segre-gation analysis [16]. Thanks to this, we now know that both thegrain structure and grain boundary structure have an obvious ef-fect on segregation in grain boundaries [17,18]. In addition to ex-perimental methods, density functional theory and ab initio cal-culations can also be used to study grain boundary segregation[19,20]. For example, of the several point defects that exist inpolycrystalline TiO2, oxygen vacancies play a key role in definingthe microstructure and segregation behavior [21–23]. The segre-gation of space charge at grain boundaries can therefore be cal-culated by point defect thermodynamical analysis using defectchemical reaction equations at different oxygen partial pressures[11,12,24]. The driving force for the segregation of (La, Nb)-co-doped TiO2 ceramics, however, has not been explored.
In this study, SEM, EDS, XRD, XPS and phase diagram mea-surements were carried out to investigate the crystal structure,chemical composition, and transition/formation mechanisms ofsecondary phases in (La, Nb)-codoped TiO2 ceramic sintered atdifferent temperatures. The driving force and mechanism of seg-regation was also investigated to determine the correlation be-tween grain boundary segregation and secondary phases.
2. Experiments
Samples of Nb-doped, La-doped, and (La, Nb)-codoped TiO2
ceramics with molar percentage compositions of 98% TiO2þ0.8%Nb2O5, 98% TiO2þ0.7% La2O3 and 98% TiO2þ0.8% Nb2O5þ0.7%La2O3, respectively, were prepared using a traditional electronicceramic procedure and single sintering technique. The raw oxidematerials were analytical-grade TiO2 (99.5%), Nb2O5 (99.5%), SiO2
(99.5%), and La2O3 (99.5%), which were mixed and wet-milled inan agate jar with agate balls for 12 h in deionized water. Themilled powders were dried and granulated with a PVA binder, andthen pressed into discs of 13 mm diameter and 1.0 mm thicknessunder a pressure of 140 MPa. After burning out the PVA at 650 °Cthe discs were placed in Al2O3 crucibles, sintered in air at 1300–1400 °C for 1 h, and then cooled to room temperature auto-matically. Analysis of the phase composition of the samples wasperformed using a Bruker D8 XRD. Microstructure characterizationand chemical composition analysis were performed using a PhilipsXL30-ESEM with an EDS attachment.
3. Results and discussion
3.1. Grain boundary segregation
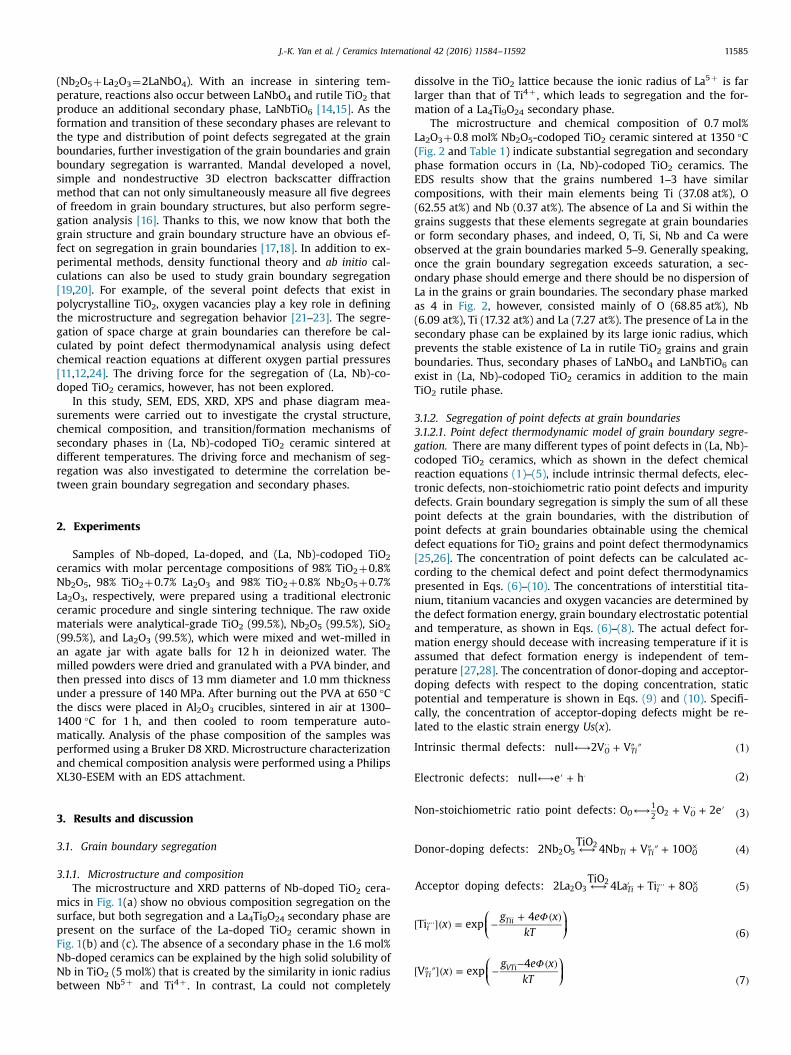
3.1.1. Microstructure and compositionThe microstructure and XRD patterns of Nb-doped TiO2 cera-
mics in Fig. 1(a) show no obvious composition segregation on thesurface, but both segregation and a La4Ti9O24 secondary phase arepresent on the surface of the La-doped TiO2 ceramic shown inFig. 1(b) and (c). The absence of a secondary phase in the 1.6 mol%Nb-doped ceramics can be explained by the high solid solubility ofNb in TiO2 (5 mol%) that is created by the similarity in ionic radiusbetween Nb5þ and Ti4þ . In contrast, La could not completely
dissolve in the TiO2 lattice because the ionic radius of La5þ is farlarger than that of Ti4þ , which leads to segregation and the for-mation of a La4Ti9O24 secondary phase.
The microstructure and chemical composition of 0.7 mol%La2O3þ0.8 mol% Nb2O5-codoped TiO2 ceramic sintered at 1350 °C(Fig. 2 and Table 1) indicate substantial segregation and secondaryphase formation occurs in (La, Nb)-codoped TiO2 ceramics. TheEDS results show that the grains numbered 1–3 have similarcompositions, with their main elements being Ti (37.08 at%), O(62.55 at%) and Nb (0.37 at%). The absence of La and Si within thegrains suggests that these elements segregate at grain boundariesor form secondary phases, and indeed, O, Ti, Si, Nb and Ca wereobserved at the grain boundaries marked 5–9. Generally speaking,once the grain boundary segregation exceeds saturation, a sec-ondary phase should emerge and there should be no dispersion ofLa in the grains or grain boundaries. The secondary phase markedas 4 in Fig. 2, however, consisted mainly of O (68.85 at%), Nb(6.09 at%), Ti (17.32 at%) and La (7.27 at%). The presence of La in thesecondary phase can be explained by its large ionic radius, whichprevents the stable existence of La in rutile TiO2 grains and grainboundaries. Thus, secondary phases of LaNbO4 and LaNbTiO6 canexist in (La, Nb)-codoped TiO2 ceramics in addition to the mainTiO2 rutile phase.
3.1.2. Segregation of point defects at grain boundaries3.1.2.1. Point defect thermodynamic model of grain boundary segre-gation. There are many different types of point defects in (La, Nb)-codoped TiO2 ceramics, which as shown in the defect chemicalreaction equations (1)–(5), include intrinsic thermal defects, elec-tronic defects, non-stoichiometric ratio point defects and impuritydefects. Grain boundary segregation is simply the sum of all thesepoint defects at the grain boundaries, with the distribution ofpoint defects at grain boundaries obtainable using the chemicaldefect equations for TiO2 grains and point defect thermodynamics[25,26]. The concentration of point defects can be calculated ac-cording to the chemical defect and point defect thermodynamicspresented in Eqs. (6)–(10). The concentrations of interstitial tita-nium, titanium vacancies and oxygen vacancies are determined bythe defect formation energy, grain boundary electrostatic potentialand temperature, as shown in Eqs. (6)–(8). The actual defect for-mation energy should decease with increasing temperature if it isassumed that defect formation energy is independent of tem-perature [27,28]. The concentration of donor-doping and acceptor-doping defects with respect to the doping concentration, staticpotential and temperature is shown in Eqs. (9) and (10). Specifi-cally, the concentration of acceptor-doping defects might be re-lated to the elastic strain energy Us(x).
⟷ + ″ ″ ( )⋅⋅Intrinsic thermal defects: null 2V V 1O Ti
⟷ ′ + ( )⋅Electronic defects: null e h 2
⟷ + + ′ ( )⋅⋅Non-stoichiometric ratio point defects: O O V 2e 3O O
12 2
⟷ + ″ ″ + ( )×Donor-doping defects: 2Nb OTiO
4Nb V 10O 4Ti Ti O2 52
⟷ ′ + + ( )×Acceptor doping defects: 2La OTiO
4La Ti 8O 5Ti i O2 32 ....
Φ[ ]( ) = −
+ ( )( )
⎛⎝⎜
⎞⎠⎟x
g e xkT
Ti exp4
6i
Tii....
Φ[ ″ ″]( ) = −
− ( )( )
⎛⎝⎜
⎞⎠⎟x
g e xkT
V exp4
7Ti
VTi
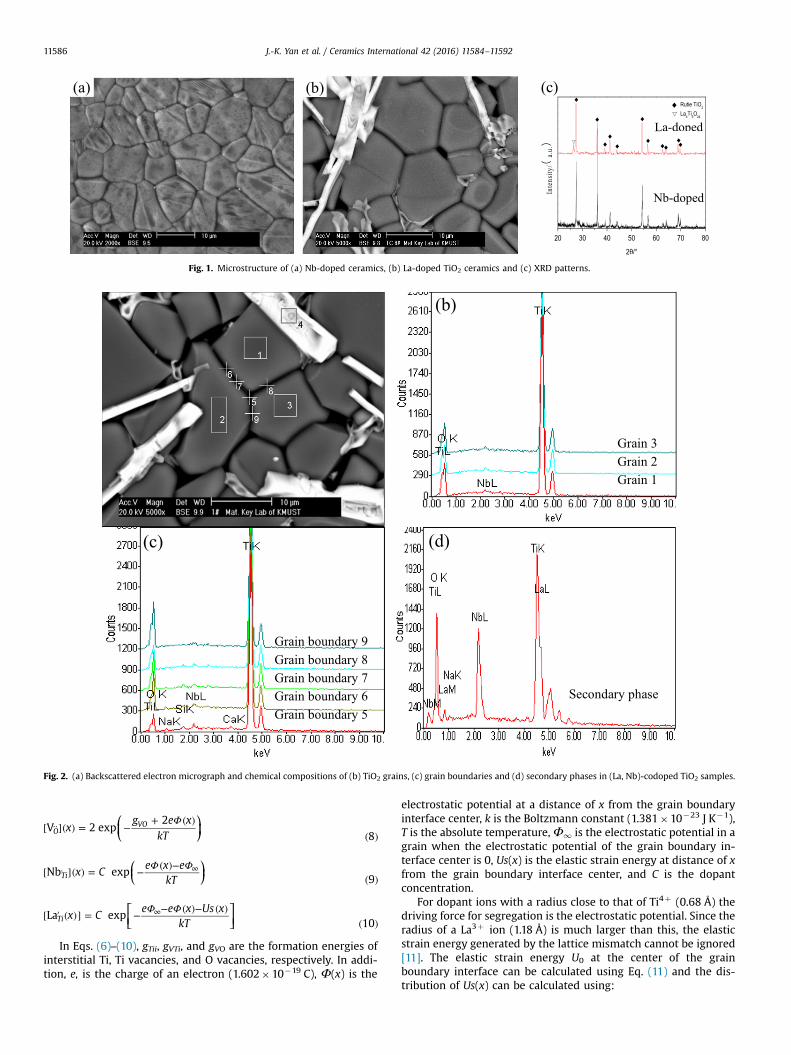
Fig. 1. Microstructure of (a) Nb-doped ceramics, (b) La-doped TiO2 ceramics and (c) XRD patterns.
Grain 3 Grain 2 Grain 1
Grain boundary 9 Grain boundary 8 Grain boundary 7 Grain boundary 6 Grain boundary 5
Secondary phase
Fig. 2. (a) Backscattered electron micrograph and chemical compositions of (b) TiO2 grains, (c) grain boundaries and (d) secondary phases in (La, Nb)-codoped TiO2 samples.
J.-K. Yan et al. / Ceramics International 42 (2016) 11584–1159211586
Φ[ ]( ) = −
+ ( )( )
⎛⎝⎜
⎞⎠⎟x
g e xkT
V 2 exp2
8OVO..
Φ Φ[ ]( ) = − ( )−( )
∞⎜ ⎟⎛⎝
⎞⎠x C
e x ekT
Nb exp9Ti
.
Φ Φ[ ′ ( )] = − − ( )− ( )( )
∞⎡⎣⎢
⎤⎦⎥x C
e e x Us xkT
La exp10Ti
In Eqs. (6)–(10), gTii, gVTi, and gVO are the formation energies ofinterstitial Ti, Ti vacancies, and O vacancies, respectively. In addi-tion, e, is the charge of an electron (1.602�10�19 C), Φ(x) is the
electrostatic potential at a distance of x from the grain boundaryinterface center, k is the Boltzmann constant (1.381�10�23 J K�1),T is the absolute temperature,Φ1 is the electrostatic potential in agrain when the electrostatic potential of the grain boundary in-terface center is 0, Us(x) is the elastic strain energy at distance of xfrom the grain boundary interface center, and C is the dopantconcentration.
For dopant ions with a radius close to that of Ti4þ (0.68 Å) thedriving force for segregation is the electrostatic potential. Since theradius of a La3þ ion (1.18 Å) is much larger than this, the elasticstrain energy generated by the lattice mismatch cannot be ignored[11]. The elastic strain energy U0 at the center of the grainboundary interface can be calculated using Eq. (11) and the dis-tribution of Us(x) can be calculated using:

Table 1Composition of (La, Nb)-codoped TiO2 samples obtained using EDS.
Sites inFig. 2(a)
Element (at%) Remark
O Ti Nb La Si Ca
1 63.65 36.02 00.33 Grain composition2 62.15 37.41 00.44 Grain composition3 61.85 37.81 00.34 Grain composition4 68.85 17.32 06.09 07.27 Second phase
composition5 47.19 49.11 00.83 00.86 00.56 Triple junctions
composition6 65.34 33.23 00.37 00.50 Grain boundary
composition7 65.24 33.05 00.40 00.33 00.19 Grain boundary
composition8 56.30 42.34 00.36 00.40 00.15 Grain boundary
composition9 68.46 30.93 00.27 00.11 Grain boundary
composition
J.-K. Yan et al. / Ceramics International 42 (2016) 11584–11592 11587
= Δ −( )
⎜ ⎟⎛⎝
⎞⎠
⎛⎝⎜
⎞⎠⎟U
rr
T3.45
1700eV
110
2
( )( ) =− ≤
> ( )
⎧⎨⎪⎩⎪
⎡⎣ ⎤⎦U xU x a
x a
1 , 2
0, 2 12s
xa
n0 2
where U0 is the elastic strain energy at the grain boundary inter-face center, r is the radius of Ti4þ in rutile TiO2,Δr is the differencein radius between the dopant ion and Ti4þ , a is the lattice para-meter (taken as the average value of a and c for rutile TiO2), and xis the distance from the grain boundary interface center. Note thatwhen x¼0 it represents the center of the grain boundary, andwhen x¼1 it represents the grain interior where the bulk phaseelectrostatic potential Φ1 is constant. The distribution of grainboundary electrostatic potential Φ(x) can therefore be obtainedusing:
Φ Φ δ( ) = [ − ( − )] ( )∞x x1 exp / 13
In Eq. (13), the Debye length δ is the shielding ability and radiusof the electrostatic potential. It can be calculated using
δ ε ε=∑ ( )
⎡⎣⎢
⎤⎦⎥
kTe N Z 14i i
02 2
1/2
Distance(x/δδ)
Fig. 3. (a) Electrostatic potential and (b) concentration of
where ε0 is vacuum dielectric constant of a vacuum(8.854�10�12 F m�1). The static TiO2 dielectric constant, ε, is 120.The terms Ni and Zi represent respectively the concentration andcharge of each point defect, i, in the bulk phase per cm3. Using Eq.(13), the grain boundary electrostatic potentialΦ(x) is determinedby the Debye length δ and bulk phase electrostatic potential Φ1.The latter is directly related to the defect formation energy, oxygenpartial pressure, dopant concentration and temperature. The De-bye length δ, on the other hand, is determined by the concentra-tion and charge of dopant ions, as well as the temperature. Theconcentration and charge of dopant ions are themselves depen-dent on defect chemistry, oxygen partial pressure, doping andother factors. In this study, point defect concentration distribu-tions at grain boundaries in doped TiO2 were calculated for 1 atmpressure with different sintering temperatures and dopingconcentrations.
3.1.2.2. Donor Nb doping. There are several defect chemistryequations for donor Nb doping in TiO2 ceramics (see Eqs. (1)–(4)),of which the most significant is Eq. (4). The approximate electro-neutrality condition in bulk-phase TiO2 is given by
= ″ ″ ( )·
∞⎡⎣ ⎤⎦ ⎡⎣ ⎤⎦Nb 4 V 15Ti Ti
According to Eqs. (7) and (15), the bulk-phase electrostaticpotential Φ1 can be calculated as
Φ = + ( )∞
⋅∞
⎡⎣ ⎤⎦e
g kT4 4
lnNb
4 16V TiTi
With low doping concentrations, it can be assumed that all Nbions completely dissolve in the TiO2 lattice. In other words, Nb5þ
ions substitute for Ti4þ in the TiO2 lattice and become point de-fects, NbTi. Thus, when 1.6 mol% Nb-doped TiO2 ceramic samplesare sintered at 1350 °C, the [NbTi� ]1 concentration is 1.6 mol%.The bulk phase electrostatic potential Φ1¼0.4319 V can be cal-culated by substituting gVTi¼2.5 eV, [NbTi� ]1, T, and k into Eq. (16)[12], and then used in Eqs. (13) and (14) to calculate the electro-static potential Φ(x) distribution at grain boundaries, as shown inFig. 3(a). The point defect concentration [ ″ ″VTi ](x), [
⋅⋅VO](x), and [NbTi� ](x) can be calculated by substituting the Ti vacancy formationenergy gVTi¼2.5 eV, oxygen vacancy formation energy gVO¼2.2 eV,sintering temperature T¼(1350þ273.15) K, and doping con-centration C¼1.6 mol% into Eqs. (8)–(10). The concentrations ofelectrons n(x) and holes p(x) can be calculated according to theequilibrium constants of Eqs. (2) and (3) at 1350 °C [24,29]. In thisway, we can acquire point defect concentration distributions at
Distance(x/δ)
point defects at grain boundaries in Nb-doped TiO2.
Distance(x/δδ) Distance(x/δ)
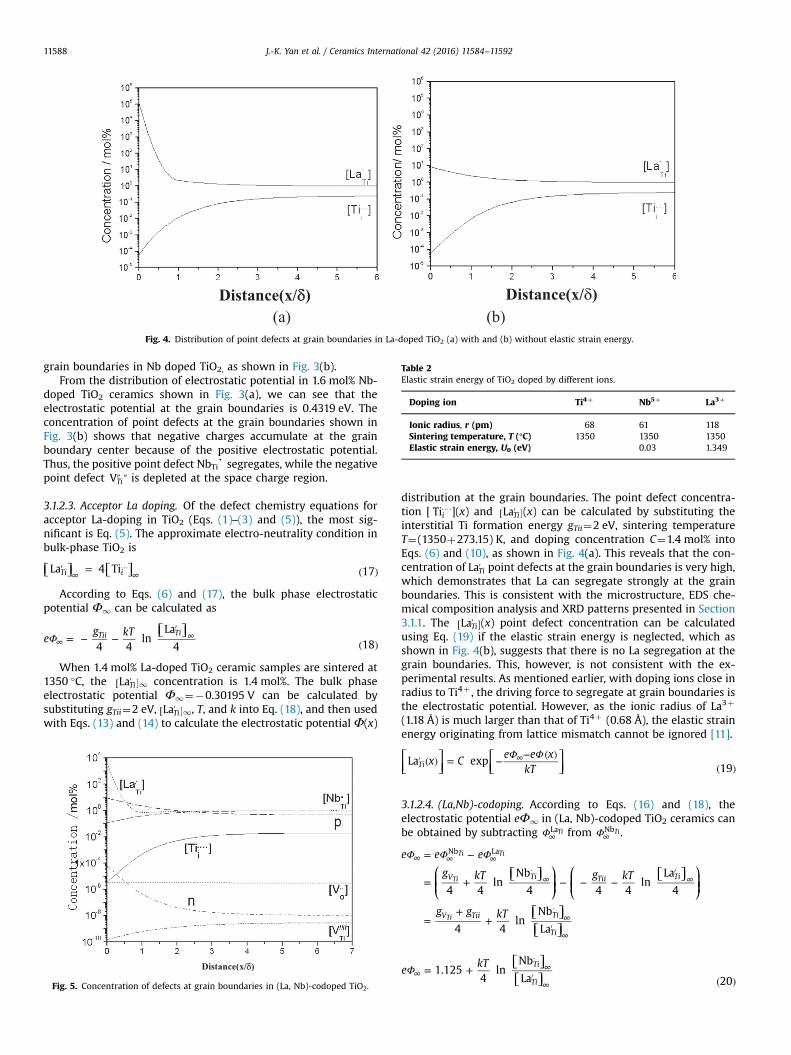
Fig. 4. Distribution of point defects at grain boundaries in La-doped TiO2 (a) with and (b) without elastic strain energy.
Table 2Elastic strain energy of TiO2 doped by different ions.
Doping ion Ti4þ Nb5þ La3þ
Ionic radius, r (pm) 68 61 118Sintering temperature, T (°C) 1350 1350 1350Elastic strain energy, U0 (eV) 0.03 1.349
J.-K. Yan et al. / Ceramics International 42 (2016) 11584–1159211588
grain boundaries in Nb doped TiO2, as shown in Fig. 3(b).From the distribution of electrostatic potential in 1.6 mol% Nb-
doped TiO2 ceramics shown in Fig. 3(a), we can see that theelectrostatic potential at the grain boundaries is 0.4319 eV. Theconcentration of point defects at the grain boundaries shown inFig. 3(b) shows that negative charges accumulate at the grainboundary center because of the positive electrostatic potential.Thus, the positive point defect NbTi� segregates, while the negativepoint defect ″ ″VTi is depleted at the space charge region.
3.1.2.3. Acceptor La doping. Of the defect chemistry equations foracceptor La-doping in TiO2 (Eqs. (1)–(3) and (5)), the most sig-nificant is Eq. (5). The approximate electro-neutrality condition inbulk-phase TiO2 is
′ = ( )∞…
∞⎡⎣ ⎤⎦ ⎡⎣ ⎤⎦La 4 Ti 17Ti i
According to Eqs. (6) and (17), the bulk phase electrostaticpotential Φ1 can be calculated as
Φ = − −′
( )∞∞
⎡⎣ ⎤⎦e
g kT4 4
lnLa
4 18Tii Ti
When 1.4 mol% La-doped TiO2 ceramic samples are sintered at1350 °C, the [ ′ ]LaTi 1 concentration is 1.4 mol%. The bulk phaseelectrostatic potential Φ1¼�0.30195 V can be calculated bysubstituting gTii¼2 eV, [ ′ ]LaTi 1, T, and k into Eq. (18), and then usedwith Eqs. (13) and (14) to calculate the electrostatic potential Φ(x)
Distance(x/δδ)
Fig. 5. Concentration of defects at grain boundaries in (La, Nb)-codoped TiO2.
distribution at the grain boundaries. The point defect concentra-tion [ ⋅⋅⋅⋅Tii ](x) and [ ′ ]LaTi (x) can be calculated by substituting theinterstitial Ti formation energy gTii¼2 eV, sintering temperatureT¼(1350þ273.15) K, and doping concentration C¼1.4 mol% intoEqs. (6) and (10), as shown in Fig. 4(a). This reveals that the con-centration of ′LaTi point defects at the grain boundaries is very high,which demonstrates that La can segregate strongly at the grainboundaries. This is consistent with the microstructure, EDS che-mical composition analysis and XRD patterns presented in Section3.1.1. The [ ′ ]LaTi (x) point defect concentration can be calculatedusing Eq. (19) if the elastic strain energy is neglected, which asshown in Fig. 4(b), suggests that there is no La segregation at thegrain boundaries. This, however, is not consistent with the ex-perimental results. As mentioned earlier, with doping ions close inradius to Ti4þ , the driving force to segregate at grain boundaries isthe electrostatic potential. However, as the ionic radius of La3þ
(1.18 Å) is much larger than that of Ti4þ (0.68 Å), the elastic strainenergy originating from lattice mismatch cannot be ignored [11].
Φ Φ′ ( ) = − − ( )( )
∞⎡⎣⎢
⎤⎦⎥
⎡⎣⎢
⎤⎦⎥x C
e e xkT
La exp19Ti
3.1.2.4. (La,Nb)-codoping. According to Eqs. (16) and (18), theelectrostatic potential eΦ1 in (La, Nb)-codoped TiO2 ceramics canbe obtained by subtracting Φ∞
LaTi from Φ∞NbTi.
Φ Φ Φ= −
= + − − −′
=+
+′
∞ ∞ ∞⋅
∞ ∞
⋅∞
∞
⎛⎝⎜⎜
⎡⎣ ⎤⎦ ⎞⎠⎟⎟
⎛⎝⎜⎜
⎡⎣ ⎤⎦ ⎞⎠⎟⎟
⎡⎣ ⎤⎦⎡⎣ ⎤⎦
e e e
g kT g kT
g g kT
4 4ln
Nb
4 4 4ln
La
4
4 4ln
Nb
La
V Ti Tii Ti
V Tii Ti
Ti
Nb LaTi Ti
Ti
Ti
Φ = +′ ( )
∞
⋅∞
∞
⎡⎣ ⎤⎦⎡⎣ ⎤⎦e
kT1.125
4ln
Nb
La 20
Ti
Ti
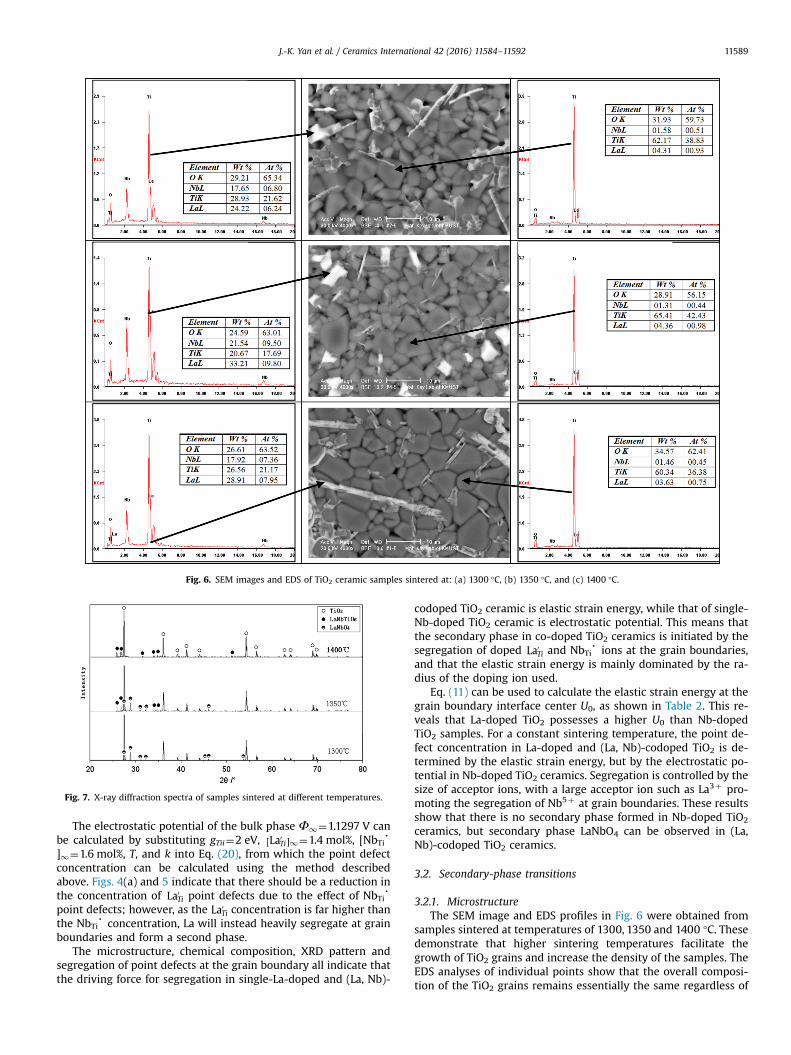
Fig. 6. SEM images and EDS of TiO2 ceramic samples sintered at: (a) 1300 °C, (b) 1350 °C, and (c) 1400 °C.
Fig. 7. X-ray diffraction spectra of samples sintered at different temperatures.
J.-K. Yan et al. / Ceramics International 42 (2016) 11584–11592 11589
The electrostatic potential of the bulk phase Φ1¼1.1297 V canbe calculated by substituting gTii¼2 eV, [ ′ ]LaTi 1¼1.4 mol%, [NbTi�]1¼1.6 mol%, T, and k into Eq. (20), from which the point defectconcentration can be calculated using the method describedabove. Figs. 4(a) and 5 indicate that there should be a reduction inthe concentration of ′LaTi point defects due to the effect of NbTi�point defects; however, as the ′LaTi concentration is far higher thanthe NbTi� concentration, La will instead heavily segregate at grainboundaries and form a second phase.
The microstructure, chemical composition, XRD pattern andsegregation of point defects at the grain boundary all indicate thatthe driving force for segregation in single-La-doped and (La, Nb)-
codoped TiO2 ceramic is elastic strain energy, while that of single-Nb-doped TiO2 ceramic is electrostatic potential. This means thatthe secondary phase in co-doped TiO2 ceramics is initiated by thesegregation of doped ′LaTi and NbTi� ions at the grain boundaries,and that the elastic strain energy is mainly dominated by the ra-dius of the doping ion used.
Eq. (11) can be used to calculate the elastic strain energy at thegrain boundary interface center U0, as shown in Table 2. This re-veals that La-doped TiO2 possesses a higher U0 than Nb-dopedTiO2 samples. For a constant sintering temperature, the point de-fect concentration in La-doped and (La, Nb)-codoped TiO2 is de-termined by the elastic strain energy, but by the electrostatic po-tential in Nb-doped TiO2 ceramics. Segregation is controlled by thesize of acceptor ions, with a large acceptor ion such as La3þ pro-moting the segregation of Nb5þ at grain boundaries. These resultsshow that there is no secondary phase formed in Nb-doped TiO2
ceramics, but secondary phase LaNbO4 can be observed in (La,Nb)-codoped TiO2 ceramics.
3.2. Secondary-phase transitions
3.2.1. MicrostructureThe SEM image and EDS profiles in Fig. 6 were obtained from
samples sintered at temperatures of 1300, 1350 and 1400 °C. Thesedemonstrate that higher sintering temperatures facilitate thegrowth of TiO2 grains and increase the density of the samples. TheEDS analyses of individual points show that the overall composi-tion of the TiO2 grains remains essentially the same regardless of

Fig. 8. Crystal structure of (a) rutile TiO2, (b) LaNbO4, and (c) LaNbTiO6.
Fig. 9. LaNbO4–TiO2 binary phase diagram.
Fig. 10. La2O3–Nb2O5–TiO2 ternary phase diagram.
Fig. 11. Influence of sintering temperature on V1 mA and α.
J.-K. Yan et al. / Ceramics International 42 (2016) 11584–1159211590
sintering temperature; however, the composition of brighter areasin which segregation of La and Nb has occurred is very different.That is, sintering at 1300 °C produces bright regions with 6.8 and6.24 mol% La and Nb, respectively, but this increases to 9.5 and9.8 at 1350 °C and 7.36 and 7.95 at 1400 °C. It should be notedthough that the molar ratio of La to Nb in these brighter areasremains at almost one regardless of the sintering temperature.
3.2.2. Crystal structureTo confirm whether a secondary phase is formed in TiO2
ceramics because of La and Nb segregation, XRD was used to ob-serve the crystal structure. As shown in Fig. 7, peaks correspond-ing to rutile TiO2 were detected, with other crystalline phases such
as LaNbO4 and LaNbTiO6 also being observed. This indicates that asecondary phase was present, though only LaNbO4 was detected inthe sample sintered at 1300 °C, and only LaNbTiO6 was present insamples sintered at 1400 °C. Since, the molar ratio of La:Nb in thechemical composition of both LaNbO4 and LaNbTiO6 secondaryphases is one, this agrees with the EDS analysis in Section 3.2.1.Thus, the XRD, SEM, and EDS results demonstrate that LaNbO4 andLaNbTiO6 secondary phases corresponding to brighter areas inSEM images are formed through the segregation of La and Nb, andthat LaNbO4 changes to LaNbTiO6 at higher temperatures.
The TiO2 raw material used in this study was anatase TiO2,which transforms into rutile TiO2 at about 900 °C. Rutile TiO2 is atetragonal system with lattice parameters of a¼b¼4.594 Å,c¼2.959 Å, and α¼β¼γ¼90°. In contrast, secondary phaseLaNbO4 is a monoclinic system in which a¼5.5735 Å, b¼11.5418 Å,c¼5.2159 Å, α¼90°, β¼94.070°, and γ¼90. The LaNbTiO6 sec-ondary phase is an orthorhombic system, where a¼10.934 Å,b¼7.572 Å, c¼5.446 Å, and α¼β¼γ¼90°. Fig. 8 shows the crystalstructures of rutile TiO2, LaNbO4, and LaNbTiO6. At higher tem-peratures, a chemical reaction similar to Eq. (21) may take place,whereby rutile TiO2 and LaNbO4 produce LaNbTiO6. Fig. 9 presentsa binary phase diagram of LaNbO4–TiO2, which also indicates theformation mechanism of a LaNbTiO6 secondary phase according toEq. (21).
+ → ( )TiO LaNbO LaNbTiO 212 4 6
3.2.3. Phase composition and varistor propertiesIn order to investigate the mechanism of change and relative

J.-K. Yan et al. / Ceramics International 42 (2016) 11584–11592 11591
content of the LaNbO4 and LaNbTiO6 secondary phases, aLa2O3–TiO2–Nb2O5 ternary phase diagram was constructedbased on the binary phase diagrams of La2O3–TiO2,La2O3–Nb2O5, and Nb2O5–TiO2 [30–32]. As shown in Fig. 10, the0.25La2O3–0.72TiO2–0.03Nb2O5 ternary oxide [33] includesLaNbTiO6 (Point C) and La0.64(Ti0.92Nb0.08)O3 (Point F), with thelatter being produced by doping the binary oxide La2/3TiO3
(Point E) with Nb. This gives a La:Nb molar ratio of eight, whichis significantly different to the EDS analysis results in Fig. 7. Itcan therefore be concluded that the current experimentalsamples do not contain any La0.64(Ti0.92Nb0.08)O3, only LaNbO4
or LaNbTiO6. The XRD analysis in Fig. 8 further confirms this.The molar composition of the sample at Point B in Fig. 10 is
0.98TiO2–0.007La2O3–0.008Nb2O5. The main crystal phase in TiO2
ceramic is rutile TiO2, shown as Point A in Fig. 5. The secondaryphases of LaNbO4 and LaNbTiO6 correspond to Points D and C,respectively, in Fig. 10. Thus, the content of different solid phasesin (La, Nb)-codoped TiO2 varistor ceramics can be evaluated usingthe straight line ABCD. According to Fig. 8, only TiO2 and LaNbO4
exist in samples sintered at 1300 °C. Using the ABD line, and basicprinciples of ternary phase diagrams, we get a molar compositionof 97.22% TiO2 as a primary phase and 2.78% LaNbO4 as a sec-ondary phase. At 1400 °C, only TiO2 and LaNbTiO6 exist in quan-tities determined from the line ABC line of 94.48% and 5.52%, re-spectively. At 1350 °C, TiO2, LaNbO4, and LaNbTiO6 phases all co-exist, making their relative contents difficult to evaluate.
The varistor properties presented in Fig. 11 are the result ofinteractions between the secondary phases, point defects andmicrostructure. Increasing the sintering temperature causes TiO2
grains to become larger, reducing both α and V1 mA, but also in-creasing the amount of secondary phase. Given that LaNbO4 is adomain-structured, insulating ferroelastic material with a largeband gap of 4.8 eV [34,35], whereas LaNbTiO6 has a low dielectricconstant and high electrical resistivity [36,37], an increase in in-sulating second phases causes α and V1 mA to rise.
4. Conclusions
Polycrystalline Nb doped, La doped and (La, Nb)-codoped TiO2
samples were prepared by solid-state sintering and found throughSEM and EDS analysis to exhibit composition segregation that doesnot occur in comparable Nb-doped samples. Specifically, whileonly primary-phase rutile TiO2 is observed in Nb-doped samples,La-doping produces a La4Ti9O24 secondary phase. Co-doping withLa and Nb, however, produces both LaNbO4 and LaNbTiO6 sec-ondary phases. Simulation by point defect thermodynamics hasindicated that the electrostatic potential Φ(x) and point defectconcentration in Nb-doped TiO2 is determined by the concentra-tion of Nb, Ti vacancy defect formation energy gVTi
, and sinteringtemperature. The electrostatic potential Φ(x) and point defectconcentration, on the other hand, are mainly influenced by the Ladoping concentration. The formation of secondary phases is in-itiated by La segregation, which in the case of La-doped and (La,Nb)-codoped TiO2 ceramics is driven by elastic strain energy. InNb-doped TiO2 ceramics, however, the driving force is the elec-trostatic potential. Though La and Nb segregation was observed bySEM in La-doped TiO2 and (La, Nb)-codoped TiO2 samples, EDSanalysis revealed that the overall chemical composition of the TiO2
grains remains much the same. In the La and Nb segregation areas,however, the La and Nb content is very different to the TiO2 grains,with a molar ratio of La:Nb of almost one. XRD analysis has shownthat LaNbO4 and LaNbTiO6 secondary phases are formed in (La,Nb)-codoped TiO2 ceramics at different sintering temperatures,with monoclinic LaNbO4 changing to orthorhombic LaNbTiO6 as
the temperature is increased.
Acknowledgment
This work was supported by the National Natural ScienceFoundation of China (Grant Nos. 51362017 and 51262017) and theplan of Yunnan Province Science and Technology Commissionunder Grant No. 2012ZE008. This work was also financially sup-ported by collaborative innovation fund project of Precious Metalsand Advanced Materials Innovation Center (Grant No. 14051708).
References
[1] M. Yan, W. Rhodes, Preparation and properties of TiO2 varistor, Appl. Phys.Lett. 6 (1982) 536–537.
[2] Qinglei Wang, Oomman Varghese, Craig A. Grimes, Elizabeth C. Dickey, Grainboundary blocking and segregation effects in yttrium-doped polycrystallinetitanium dioxide, Solid State Ion. 178 (2007) 187–194.
[3] Yan Jikang, Gan Guoyou, Du Jinghong, Study on the double functional TiO2
varistors ceramic with low breakdown voltage, J. Kunming Univ. Sci. Technol.28 (2003) 30–35.
[4] Luo Jianjun, Fang xiangyi, Wu Mingtang, Study of La2O3 addition on theproperties of TiO2 capacitor-varistor ceramics, J. Xi’ Jiaotong Univ. 31 (1997)62–66.
[5] E. Brzozowski, M.S. Castro, C.R. Foschini, B. Stojanovic, Secondary phases inNb-doped BaTiO3 ceramics, Ceram. Int. 28 (2002) 773–777.
[6] Jianying Li, Shaohua Luo, Weihua Yao, Zhongtai Zhang, Role of second phase in(Nb,Ce,Si,Ca)-doped TiO2 varistor ceramics, Mater. Lett. 57 (2003) 3748–3754.
[7] R. Parra, M.S. Castro, J.A. Varela, Analysis of secondary phases segregated andprecipitated in SnO2-based varistors, J. Eur. Ceram. Soc. 25 (2005) 401–406.
[8] Hong Peng He, Xue Jie Huang, Li. Quan Chen, An effective way to detect thesecondary phase in Sr-doped LaInO3, J. Phys. Chem. Solids 62 (2001) 701–709.
[9] Zhi.-Cheng. Li, Hong Zhang, Xiaodong Zou, Bill Bergman, Synthesis of Sm-doped BaTiO3 ceramics and characterization of a secondary phase, Mater. Sci.Eng. B 116 (2005) 34–39.
[10] Xiangyi Fang, J.T. Oh, Microstructure and electrical properties of Nb2O5 dopedtitanium dioxide, Mater. Sci. Eng. B 136 (2007) 15–19.
[11] Qinglei Wang, Guoda Lian, Elizabeth C. Dickey, Grain boundary segregation inyttrium-doped polycrystalline TiO2, Acta Mater. 52 (2004) 809–820.
[12] Jeri Ann S. Ikeda, Yet.-Ming. Chiang, Space charge segregation at grainboundaries in titanium dioxide: Ⅰ, Relationship between lattice defect chem-istry and space charge potential, J. Am. Ceram. Soc. 76 (1993) 2437–2446.
[13] Ying Pang, Noel T. Nuhfer, Paul Wynblatt, Segregation of Nb to TiO2 grainboundaries, Microsc. Microanal. 11 (Suppl. 2) (2005) 1726–1727.
[14] Yan Jikang, Gan guoyou, Chen Haifang, Zhang Xiaowen, Sun Jialin, Studies ofsecondary phases in(La,Nb)-codoped TiO2 varistors ceramics, Piezoelectectr.Acoustoopt. 30 (2008) 67–70.
[15] J.K. Yan, G.Y. Gan, J.H. Du, J.L. Sun, Second phases of (La,Nb)-codoped TiO2
varistor ceramic, J. Phys.: Conf. Ser. 152 (2009) 12–67.[16] S. Mandal, K.G. Pradeep, S. Zaefferer, D. Raabe, Novel approach to measure
grain boundary segregation in bulk polycrystalline materials in dependence ofthe boundaries’five rotational degrees of freedom, Scr. Mater. 81 (2014) 16–19.
[17] Robert L. González-Romero, Juan J. Meléndez, Yttrium segregation and oxygendiffusion along high-symmetry grain boundaries in YSZ, J. Alloy. Compd. 622(2015) 708–713.
[18] M.V. Sorokin, Z.V. Lavrukhina, A.N. Khodan, D.A. Maltsev, B.S. Bokstein, A.O. Rodin, A.I. Ryazanov, B.A. Gurovich, Effect of subgrain structure on the ki-netics of phosphorus segregation in grain boundaries, Mater. Lett. 158 (2015)151–154.
[19] Daniel Scheiber, Vsevolod I. Razumovskiy, Peter Puschnig, Reinhard Pippan,Lorenz Romaner, Ab initio description of segregation and cohesion of grainboundaries in W–25 at% Re alloys, Acta Mater. 88 (2015) 180–189.
[20] Bin Liu, Valentino R. Cooper, Yanwen Zhang, William J. Weber, Segregationand trapping of oxygen vacancies near the SrTiO3 ∑3 (112)/[110] tilt grainboundary, Acta Mater. 90 (2015) 394–399.
[21] Anders Lindman, Edit E. Helgee, B. Joakim Nyman, G.öran Wahnström, Oxygenvacancy segregation in grain boundaries of BaZrO3 using interatomic poten-tials, Solid State Ion. 230 (2013) 27–31.
[22] Biswajit Choudhury, Amarjyoti Choudhury, Room temperature ferromagnet-ism in defective TiO2 nanoparticles: role of surface and grain boundary oxygenvacancies, J. Appl. Phys. 114 (2013) 203906.
[23] T. Yokoi, M. Yoshiya, H. Yasuda, On modeling of grain boundary segregation inaliovalent cation doped ZrO2: critical factors in site-selective point defectoccupancy, Scr. Mater. 102 (2015) 91–94.
[24] T. BAK, J. Nowotny, M. Rekas, C.C. Sorrell, Defect chemistry and semi-conducting properties of titanium dioxide (Ⅱ): defect diagrams, J. Phys. Chem.Solids 64 (2003) 1057–1067.
[25] Z.G. Zhou, Z.L. Tang, Chemistry and physics of point defects in advancedceramics, J. Inorg. Mater. 24 (2009) 417–426.

J.-K. Yan et al. / Ceramics International 42 (2016) 11584–1159211592
[26] A. Bataille, A. Addad, C. Courtois, T. Duhoo, J. Crampon, Solute and defectsegregation at the space charge layers of Fe-doped fine-grained Al2O3: effecton the creep rate, J. Eur. Ceram. Soc. 28 (2008) 1129–1134.
[27] J. He, R.K. Behera, M.W. Finnis, X. Li, E.C. Dickey, S.R. Phillpot, S.B. Sinnott,Prediction of high-temperature point defect formation in TiO2 from combinedab initio and thermodynamic calculations, Acta Mater. 55 (2007) 4325–4337.
[28] X. Li, M.W. Finnis, J. He, R.K. Behera, S.R. Phillpot, S.B. Sinnott, E.C. Dickey,Energetics of charged point defects in rutile TiO2 by density functional theory,Acta Mater. 57 (2009) 5882–5891.
[29] J.K. Yan, G.Y. Gan, J. Yuan, J.H. Du, J.H. Yi, Defect chemistry and formationmechanism of pores in undoped TiO2 ceramics, Chin. J. Nonferr. Met. 21 (2011)1380–1388.
[30] S.D. Skapin, D. Kolar, D. Suvorov, Phase stability and equilibria in theLa2O3–TiO2 system, J. Eur. Ceram. Soc. 20 (2000) 1179–1185.
[31] N.F. Fedorov, O.V. Mel’nikova, V.A. Saltykova, A.P. Pivovarova, M. Dib, V.I. Strakhov, Zh. Neorg. Khim. 34 (1989) 1316–1319 (Russ. J. Inorg. Chem. (Engl.Transl.) 34(1989)741–744).
[32] E.P. Savchenko, N.A. Godina, E.K. Keler, Solid-phase reactions between pent-oxides of niobium and tantalum and oxides of the rare-earth elements, in: N.
A. Toropov (Ed.), Proceedings of the 2nd All-Union Conference on Chemistry ofHigh-temperature Materials, Consultants Bureau, New York, NY, 1969, pp. 108–113.
[33] Mizuki Mori, Masatomo Yashima, Rowshown Ali, High-resolution synchrotronX-ray powder diffraction study of the orthorhombic–tetragonal phase transi-tion in La0.64Ti0.92Nb0.08O3, ⟨http://pfwww.kek.jp/acr2001pdf/PartB/PF01UR130.pdf⟩.
[34] P.M. Kelly, C.J. Wauchope, The origin of the domain structure in LaNbO4,Mater. Lett. 27 (1996) 7–11.
[35] Y.J. Hsiao, T.H. Fang, Y.S. Chang, Y.H. Chang, C.H. Liu, L.W. Ji, W.Y. Jywe,Structure and luminescent properties of LaNbO4 synthesized by sol–gel pro-cess, J. Lumin. 126 (2007) 866–871.
[36] Tang Rongmei, Gan Guoyou, Yan Jikang, Dong Weixia, Present status andprospect of ReTiNbO6 microwave, dielectric ceramics, J. Ceram. 1 (2008)58–61.
[37] Er-xin Ni, Wan-Xia Tang, Song-Lin Zhang 1, Ji-Kang Yan, Guo-You Gan,Gang Yang, Zhe Shi, Jian-Hong Yi, Study on the second phases of (Y,Nb)-co-doped TiO2 ceramic, Adv. Mater. Res. 833 (2014) 88–92.

本文献由“学霸图书馆-文献云下载”收集自网络,仅供学习交流使用。
学霸图书馆(www.xuebalib.com)是一个“整合众多图书馆数据库资源,
提供一站式文献检索和下载服务”的24 小时在线不限IP
图书馆。
图书馆致力于便利、促进学习与科研,提供最强文献下载服务。
图书馆导航:
图书馆首页 文献云下载 图书馆入口 外文数据库大全 疑难文献辅助工具