grafton group plc investor day/media/files/g/grafton/result-centre/2013/... · andy williams...
TRANSCRIPT
Grafton Group plc
Investor Day
London
Thursday, 7 November 2013
Gavin Slark
Chief Executive Officer
Cautionary Statement
Certain statements made in this presentation are forward-looking statements. Such statements arebased on current expectations and are subject to a number of risks and uncertainties that couldcause actual events or results to differ materially from those expressed or implied by these forwardlooking statements. They appear in a number of places throughout this presentation and includestatements regarding the intentions, beliefs or current expectations of Directors and seniormanagement concerning, amongst other things, the results of operations, financial condition,liquidity, prospects, growth, strategies and the businesses operated by the Group. The Directorsand senior management do not undertake any obligation to update or revise any forward-lookingstatements, whether as a result of new information, future developments or otherwise.
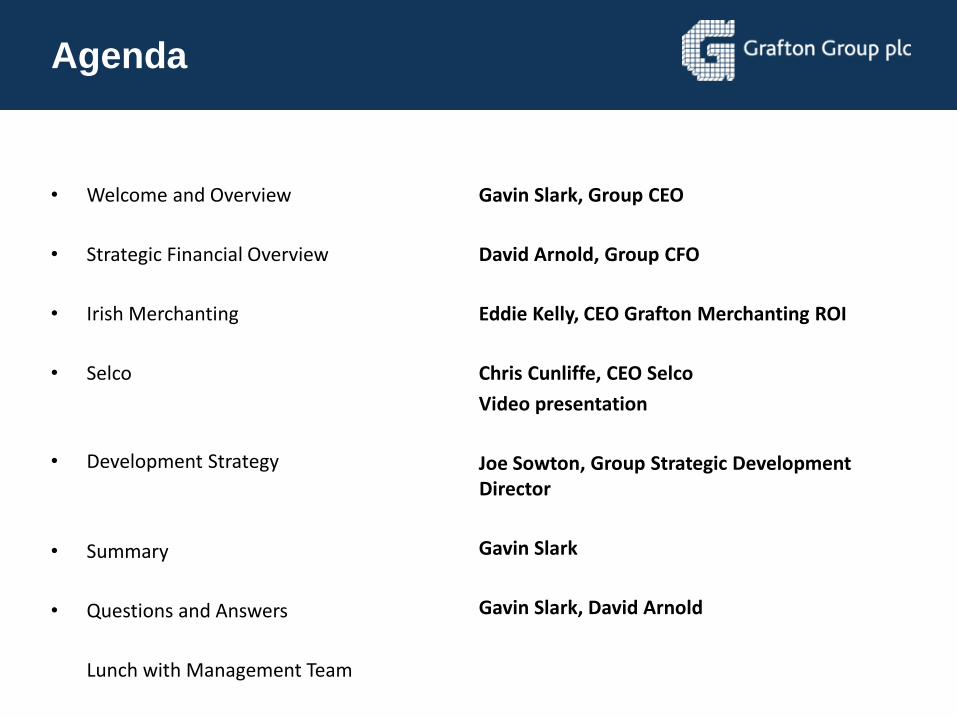
Agenda
• Welcome and Overview
• Strategic Financial Overview
• Irish Merchanting
• Selco
• Development Strategy
• Summary
• Questions and Answers
Lunch with Management Team
Gavin Slark, Group CEO
David Arnold, Group CFO
Eddie Kelly, CEO Grafton Merchanting ROI
Chris Cunliffe, CEO Selco
Video presentation
Joe Sowton, Group Strategic Development Director
Gavin Slark
Gavin Slark, David Arnold
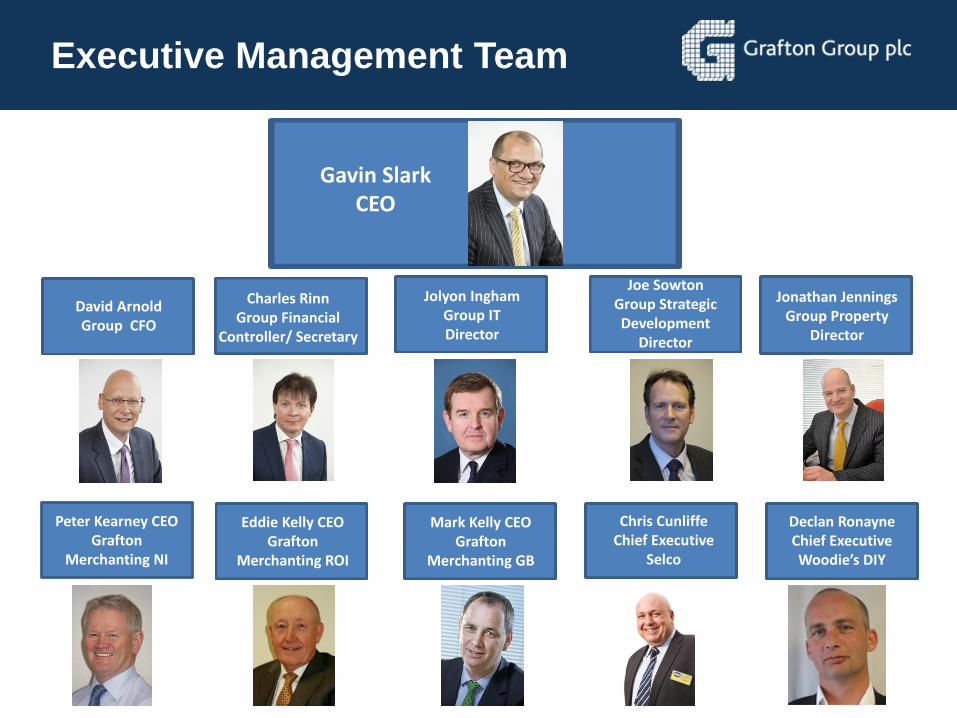
Executive Management Team
Peter Kearney CEO Grafton
Merchanting NI
Gavin SlarkCEO
David ArnoldGroup CFO
Charles RinnGroup Financial
Controller/ Secretary
Jonathan JenningsGroup Property
Director
Eddie Kelly CEO Grafton
Merchanting ROI
Mark Kelly CEO Grafton
Merchanting GB
Chris CunliffeChief Executive
Selco
Declan RonayneChief ExecutiveWoodie’s DIY
Jolyon InghamGroup IT Director
Joe SowtonGroup StrategicDevelopment
Director
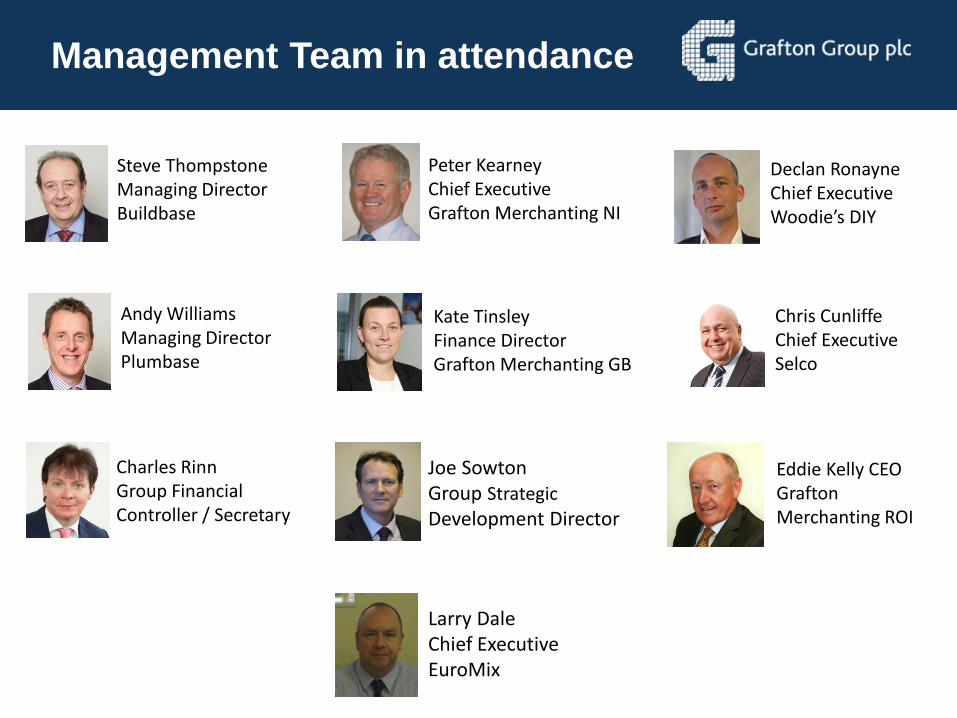
Management Team in attendance
Steve ThompstoneManaging DirectorBuildbase
Andy WilliamsManaging DirectorPlumbase
Kate TinsleyFinance DirectorGrafton Merchanting GB
Peter KearneyChief ExecutiveGrafton Merchanting NI
Declan RonayneChief ExecutiveWoodie’s DIY
Charles RinnGroup Financial Controller / Secretary
Chris CunliffeChief ExecutiveSelco
Joe SowtonGroup Strategic
Development Director
Eddie Kelly CEO Grafton Merchanting ROI
Larry DaleChief ExecutiveEuroMix
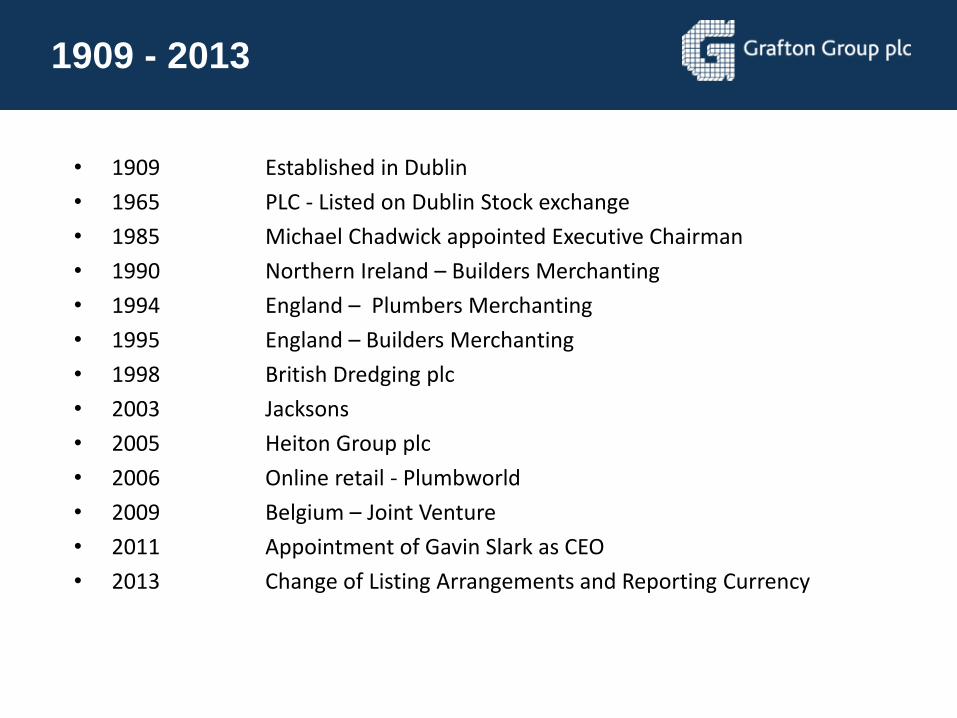
1909 - 2013
• 1909 Established in Dublin
• 1965 PLC - Listed on Dublin Stock exchange
• 1985 Michael Chadwick appointed Executive Chairman
• 1990 Northern Ireland – Builders Merchanting
• 1994 England – Plumbers Merchanting
• 1995 England – Builders Merchanting
• 1998 British Dredging plc
• 2003 Jacksons
• 2005 Heiton Group plc
• 2006 Online retail - Plumbworld
• 2009 Belgium – Joint Venture
• 2011 Appointment of Gavin Slark as CEO
• 2013 Change of Listing Arrangements and Reporting Currency
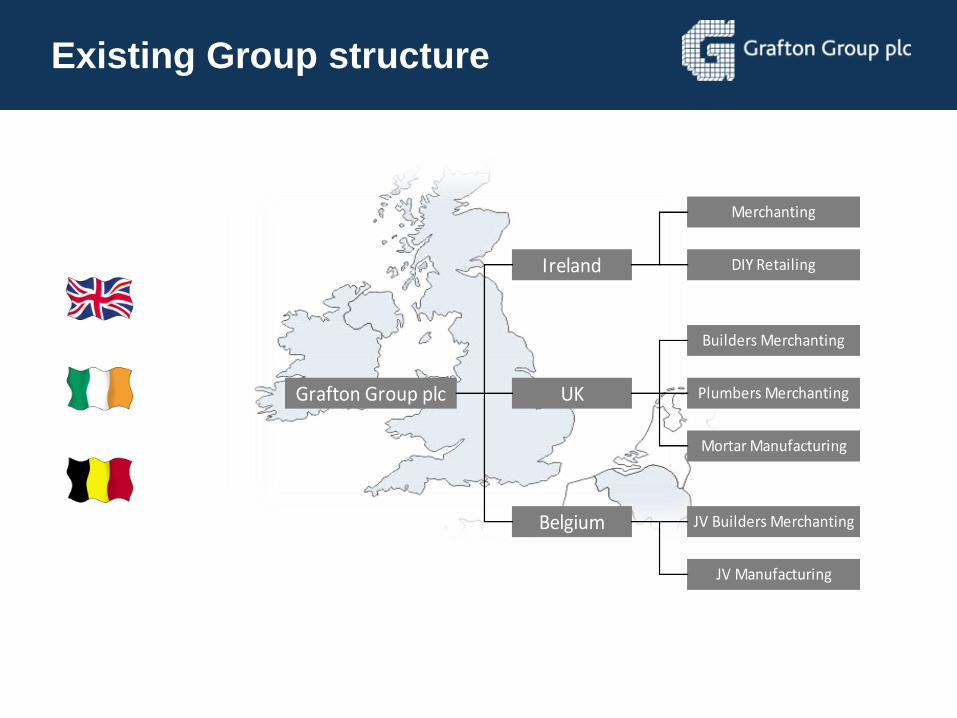
Existing Group structure
Grafton Group plc
Ireland
UK
Belgium JV Builders Merchanting
JV Manufacturing
Merchanting
DIY Retailing
Builders Merchanting
Plumbers Merchanting
Mortar Manufacturing
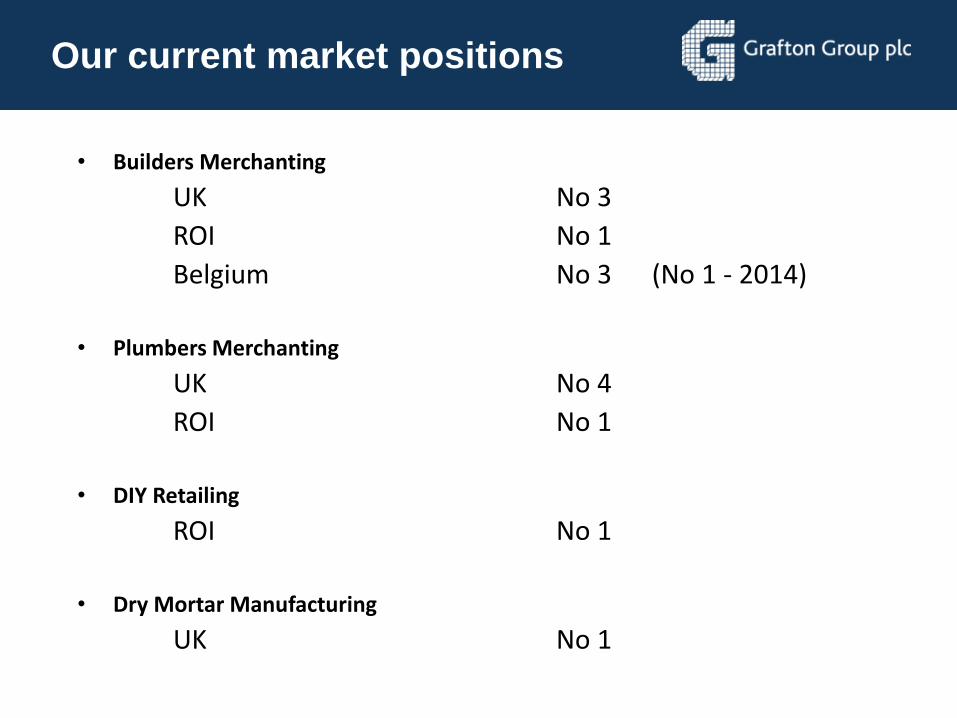
Our current market positions
• Builders Merchanting
UK No 3
ROI No 1
Belgium No 3 (No 1 - 2014)
• Plumbers Merchanting
UK No 4
ROI No 1
• DIY Retailing
ROI No 1
• Dry Mortar Manufacturing
UK No 1
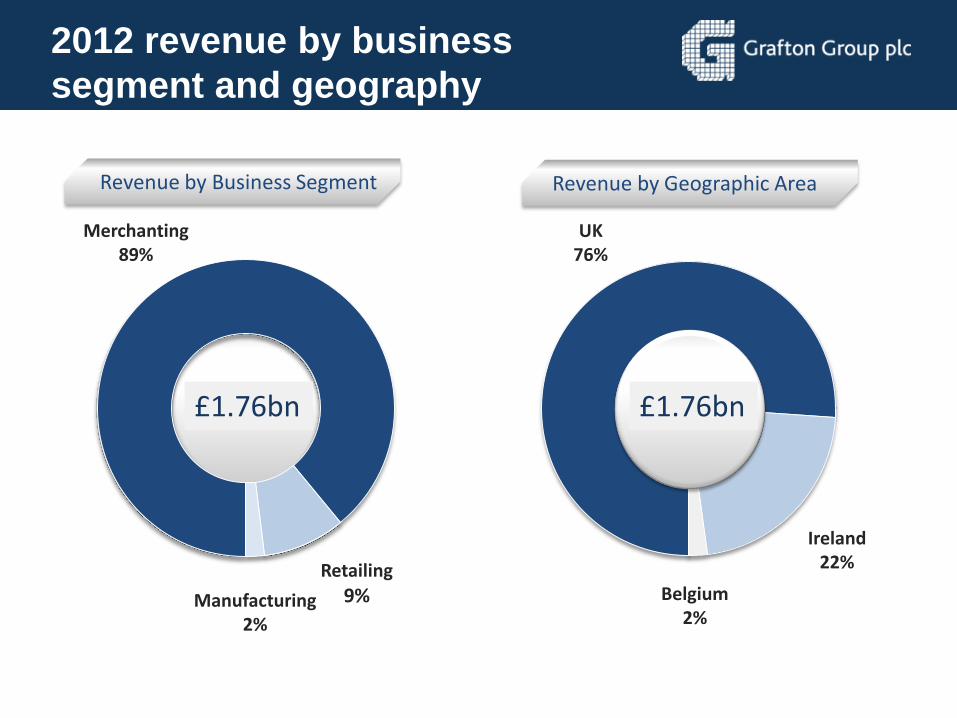
2012 revenue by business
segment and geography
Revenue by Geographic Area Revenue by Business Segment
€2.17bn €2.17bn
Manufacturing2%
Retailing
9%
UK76%
Ireland 22%
Belgium2%
Merchanting 89%
£1.76bn £1.76bn
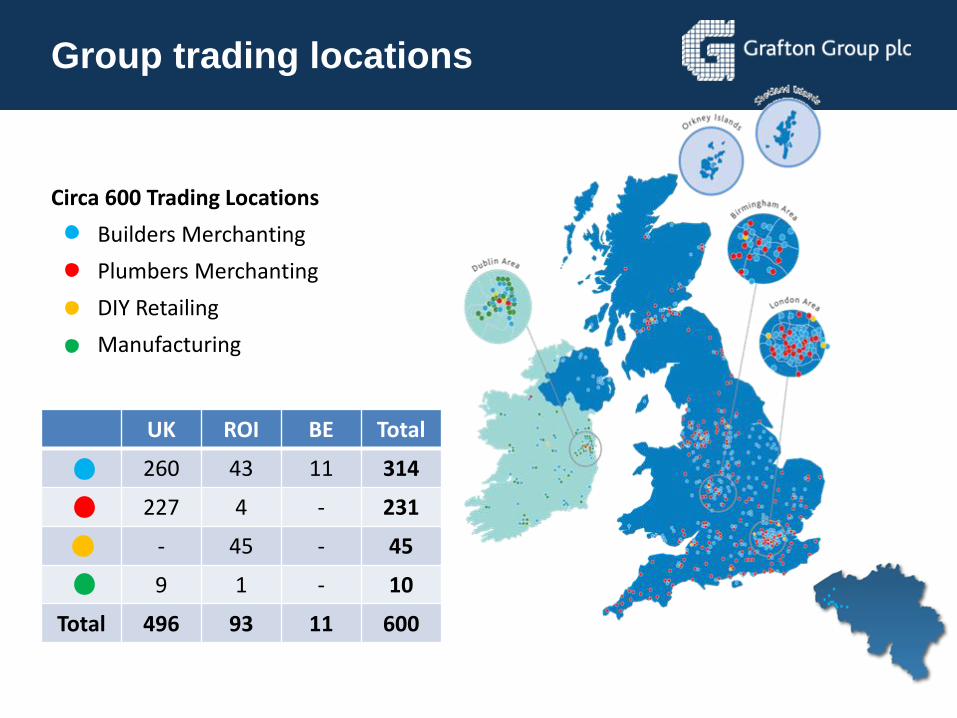
Group trading locations
UK ROI BE Total
260 43 11 314
227 4 - 231
- 45 - 45
9 1 - 10
Total 496 93 11 600
Circa 600 Trading Locations
Builders Merchanting
Plumbers Merchanting
DIY Retailing
Manufacturing
David Arnold
Chief Financial Officer
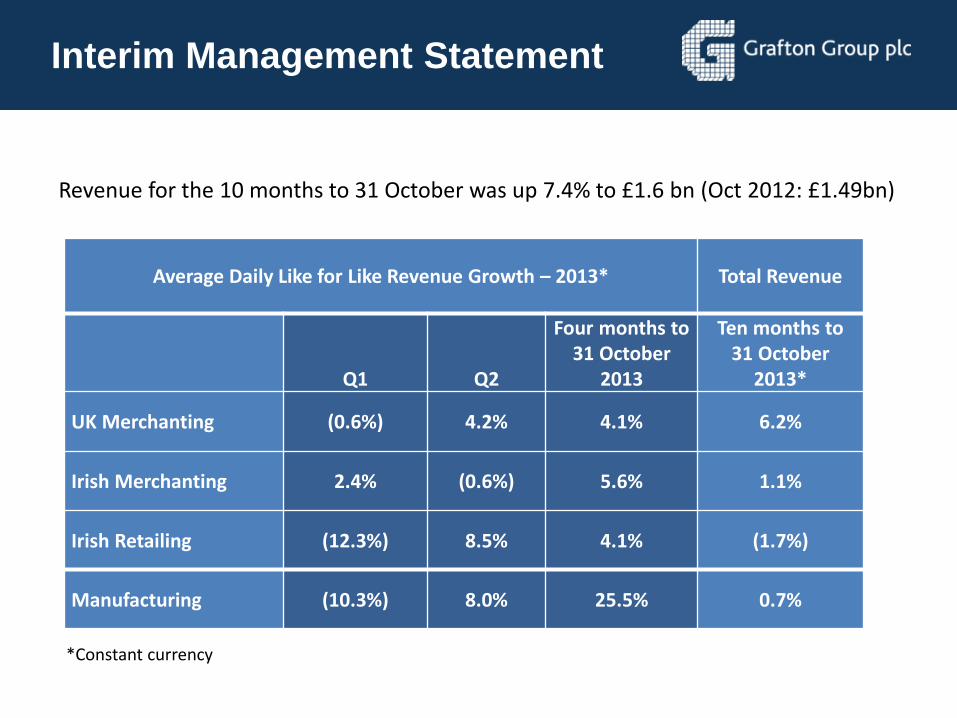
Interim Management Statement
*Constant currency
Average Daily Like for Like Revenue Growth – 2013* Total Revenue
Q1 Q2
Four months to 31 October
2013
Ten months to 31 October
2013*
UK Merchanting (0.6%) 4.2% 4.1% 6.2%
Irish Merchanting 2.4% (0.6%) 5.6% 1.1%
Irish Retailing (12.3%) 8.5% 4.1% (1.7%)
Manufacturing (10.3%) 8.0% 25.5% 0.7%
Revenue for the 10 months to 31 October was up 7.4% to £1.6 bn (Oct 2012: £1.49bn)
UK
• Housing market is benefitting from Government backed initiatives
• Confidence slowly but surely returning
• Positive, though lagged, effect on Grafton as housing transactions and household spending on RMI increases
Ireland
• Consumer confidence has improved and the Merchanting and DIY markets have stabilised at very low levels of activity
Interim Management Statement

Revenue
0
500
1,000
1,500
2,000
2,500
2007 2008 2009 2010 2011 2012
Rev
en
ue
(£
ms)
Belgium
Ireland
UK
• Ireland revenue peaked at €1,227m (£840m) in 2007. 2012 revenue €487m (£395m)
• 2012 UK revenue broadly back to 2007 level (£1.335bn vs £1.353bn)
• Selco more than doubled revenue over this period (£230m v £112m)
• 2012 Belgium revenue €38m (£31m)
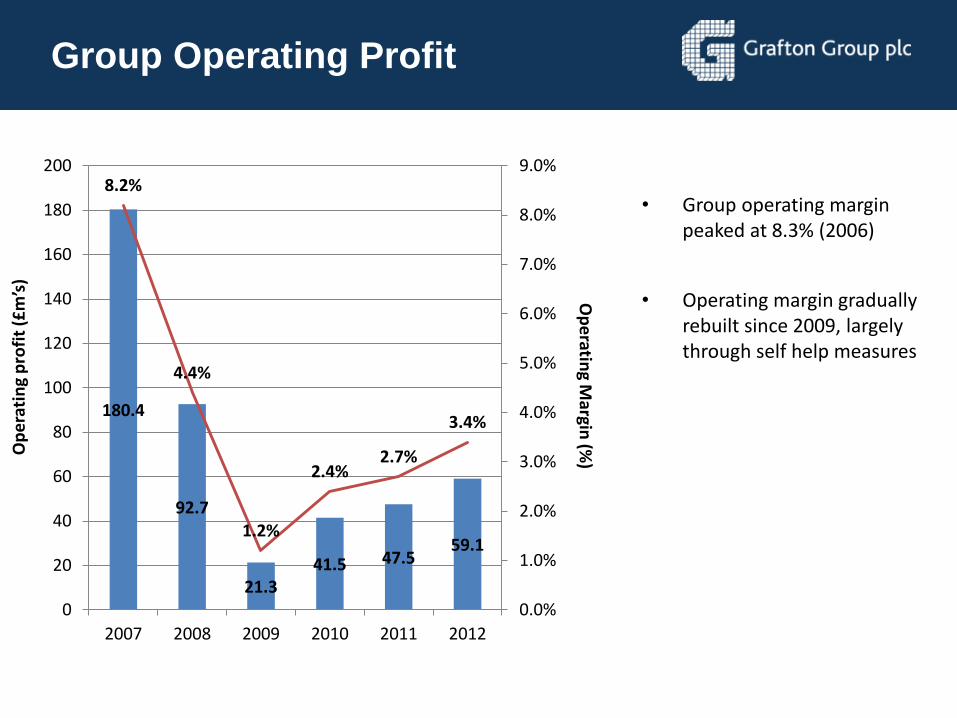
Group Operating Profit
180.4
92.7
21.341.5 47.5
59.1
8.2%
4.4%
1.2%
2.4%2.7%
3.4%
0.0%
1.0%
2.0%
3.0%
4.0%
5.0%
6.0%
7.0%
8.0%
9.0%
0
20
40
60
80
100
120
140
160
180
200
2007 2008 2009 2010 2011 2012
Op
eratin
g Margin
(%)O
pe
rati
ng
pro
fit
(£m
’s)
• Group operating margin peaked at 8.3% (2006)
• Operating margin gradually rebuilt since 2009, largely through self help measures
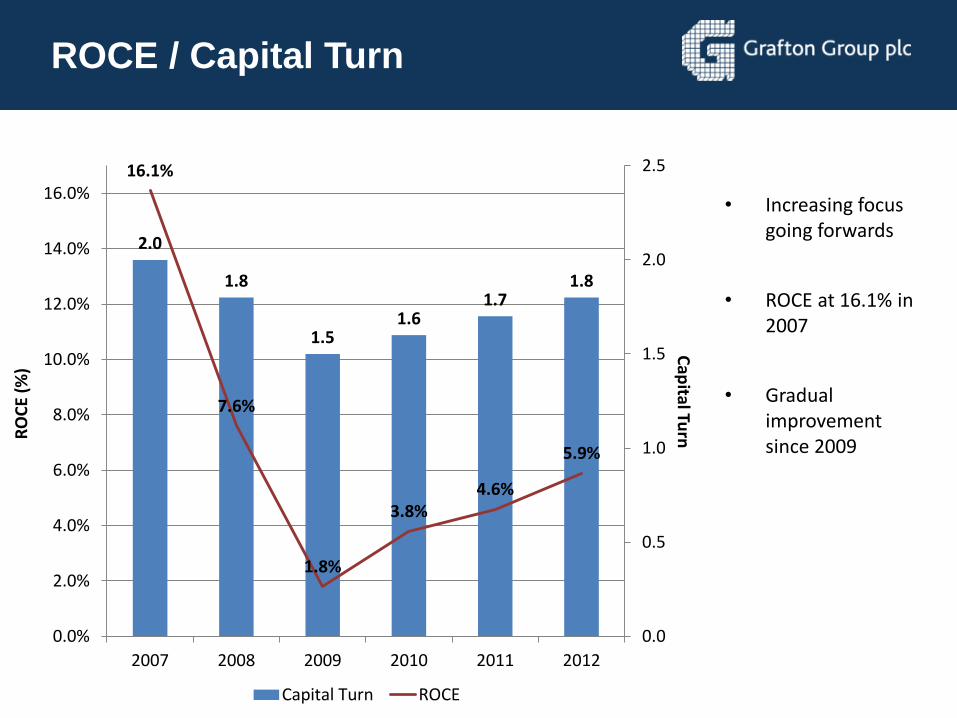
ROCE / Capital Turn
2.0
1.8
1.51.6
1.71.8
16.1%
7.6%
1.8%
3.8%4.6%
5.9%
0.0
0.5
1.0
1.5
2.0
2.5
0.0%
2.0%
4.0%
6.0%
8.0%
10.0%
12.0%
14.0%
16.0%
2007 2008 2009 2010 2011 2012
Cap
ital TurnR
OC
E (%
)
Capital Turn ROCE
• Increasing focus going forwards
• ROCE at 16.1% in 2007
• Gradual improvement since 2009
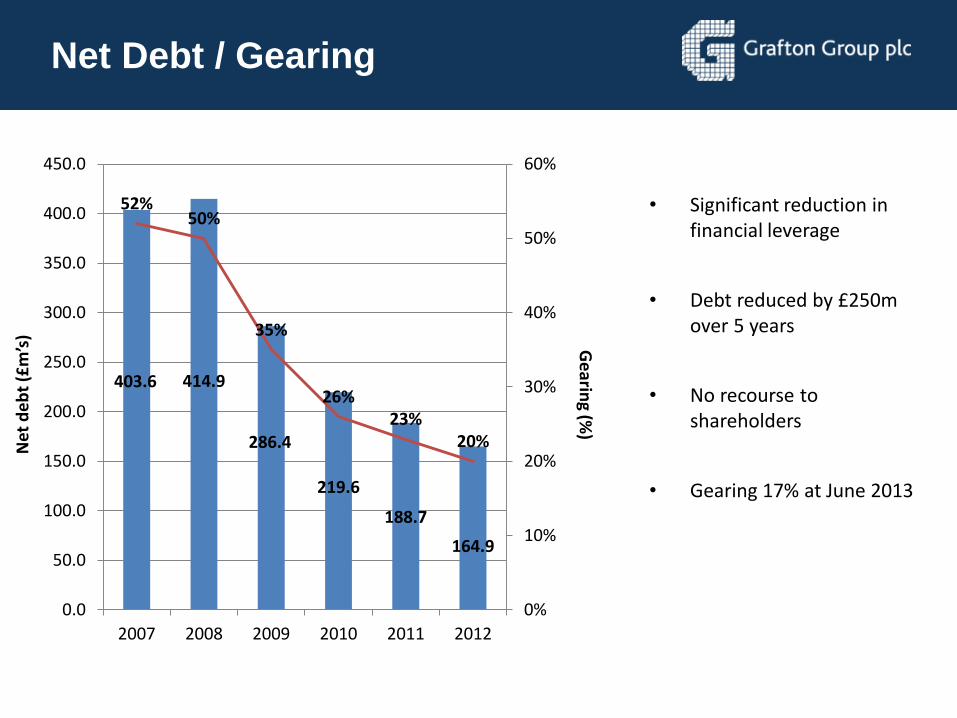
Net Debt / Gearing
403.6 414.9
286.4
219.6
188.7
164.9
52%50%
35%
26%23%
20%
0%
10%
20%
30%
40%
50%
60%
0.0
50.0
100.0
150.0
200.0
250.0
300.0
350.0
400.0
450.0
2007 2008 2009 2010 2011 2012
Ge
aring (%
)
Net
de
bt
(£m
’s)
• Significant reduction in financial leverage
• Debt reduced by £250m over 5 years
• No recourse to shareholders
• Gearing 17% at June 2013
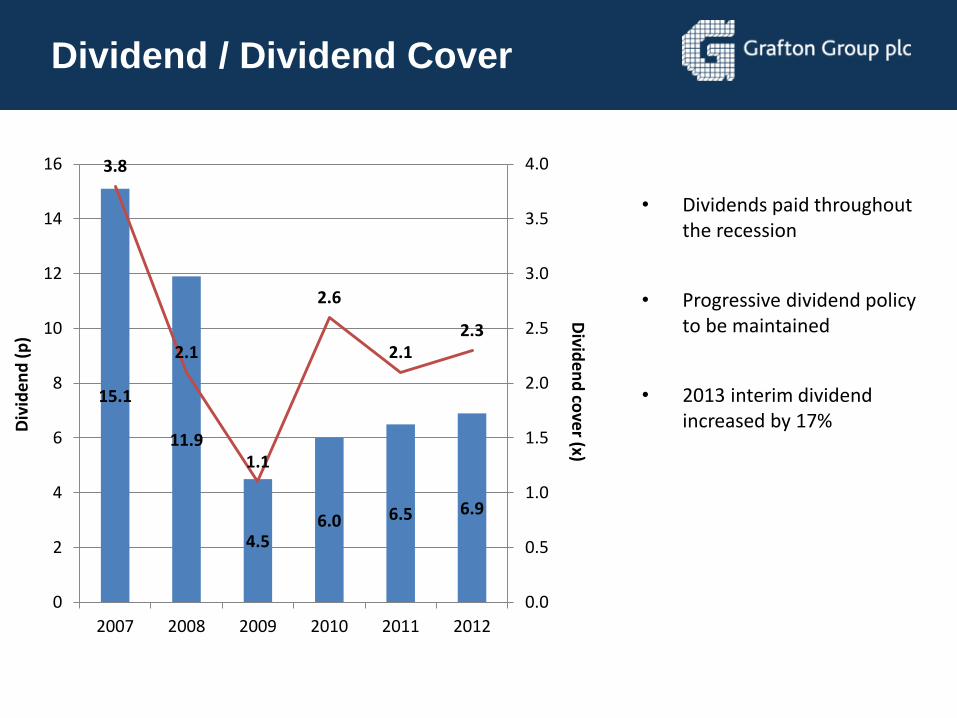
Dividend / Dividend Cover
15.1
11.9
4.56.0 6.5 6.9
3.8
2.1
1.1
2.6
2.12.3
0.0
0.5
1.0
1.5
2.0
2.5
3.0
3.5
4.0
0
2
4
6
8
10
12
14
16
2007 2008 2009 2010 2011 2012
Divid
en
d co
ver (x)
Div
ide
nd
(p
)
• Dividends paid throughout the recession
• Progressive dividend policy to be maintained
• 2013 interim dividend increased by 17%
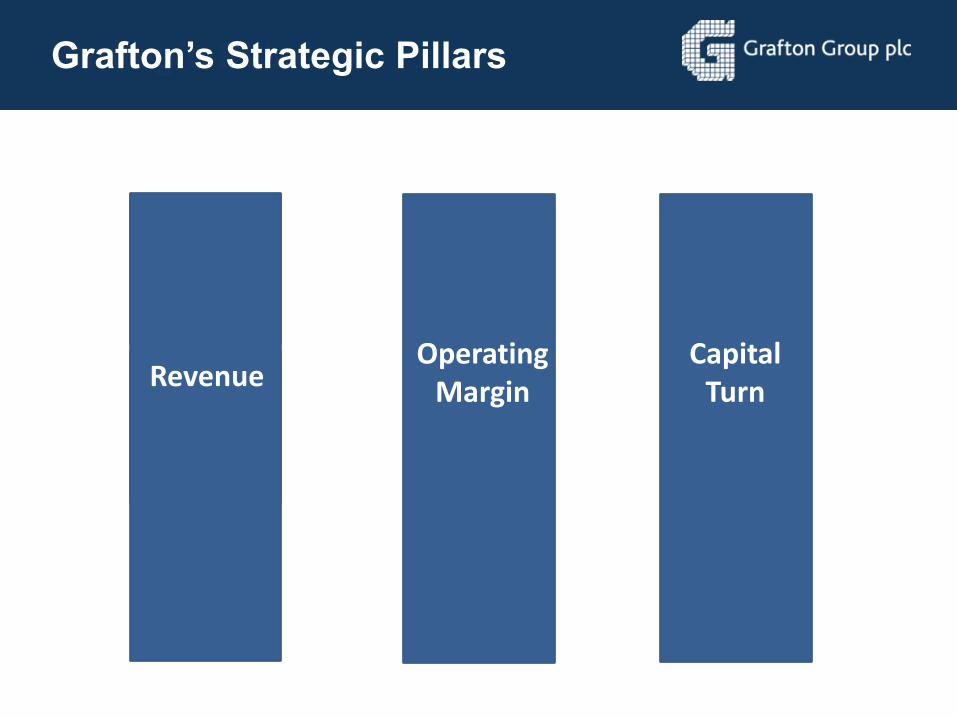
Strategic Pillars
Economic Growth
Organic Growth
RevenueOperating
MarginCapital
Turn
Grafton’s Strategic Pillars
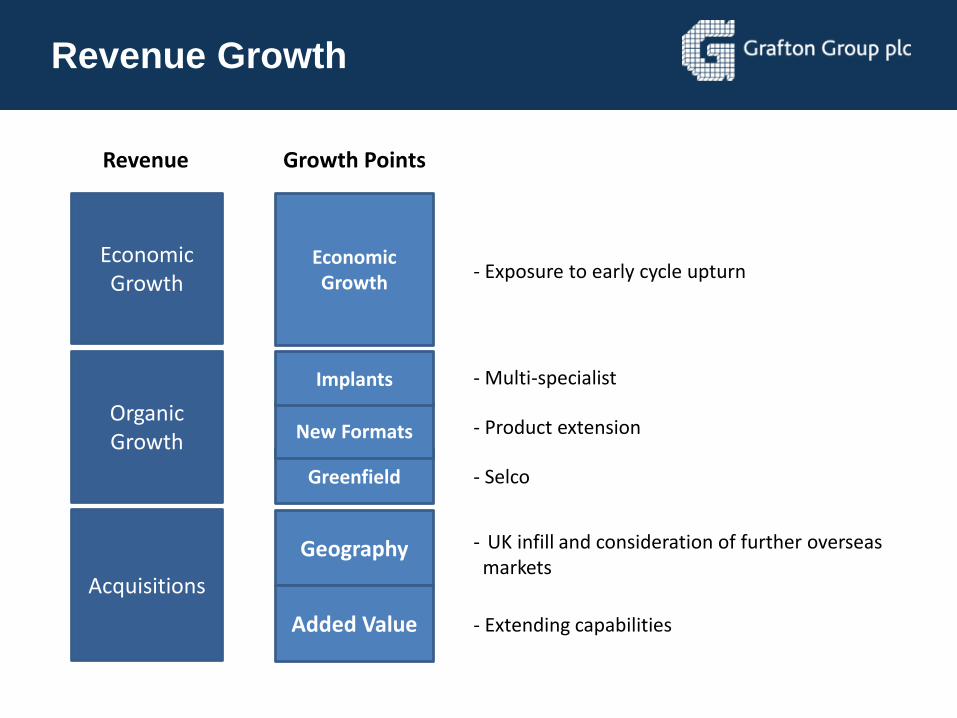
Revenue Growth
Economic Growth
Organic Growth
Acquisitions
Revenue
Greenfield
New Formats
Implants
Geography
Added Value
- Exposure to early cycle upturn
- Multi-specialist
- Product extension
- Selco
- UK infill and consideration of further overseas markets
- Extending capabilities
EconomicGrowth
Growth Points
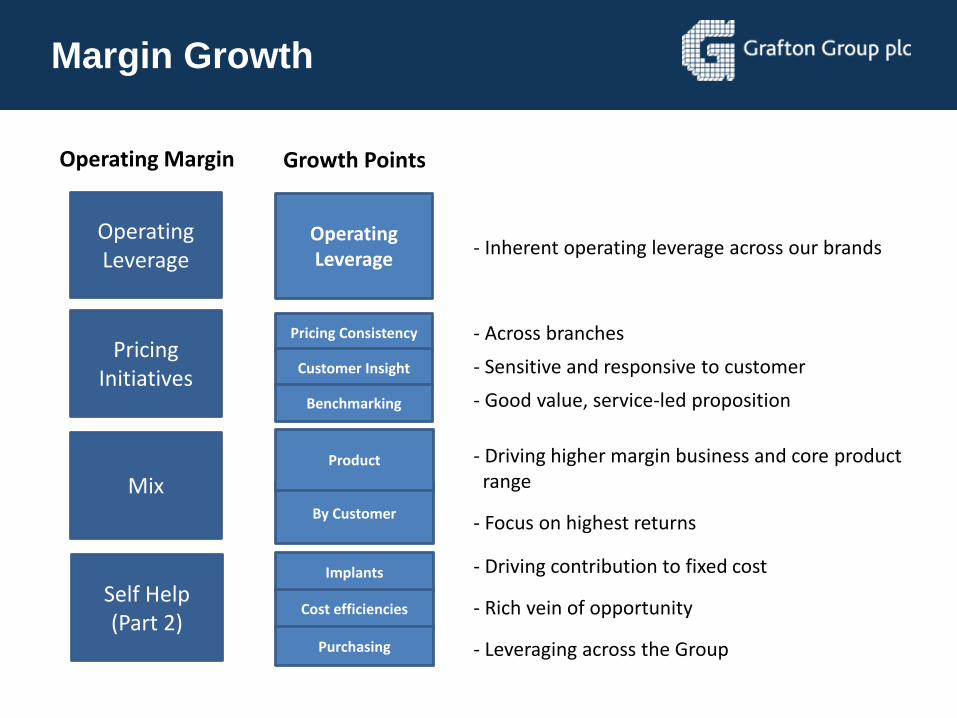
Margin Growth
Operating Leverage
Operating Margin
Pricing Initiatives
Mix
Self Help (Part 2)
Pricing Consistency
Customer Insight
Benchmarking
By Customer
Product
Implants
Cost efficiencies
Purchasing
- Across branches
- Sensitive and responsive to customer
- Good value, service-led proposition
- Driving higher margin business and core product range
- Focus on highest returns
- Driving contribution to fixed cost
- Rich vein of opportunity
- Leveraging across the Group
OperatingLeverage
Growth Points
- Inherent operating leverage across our brands
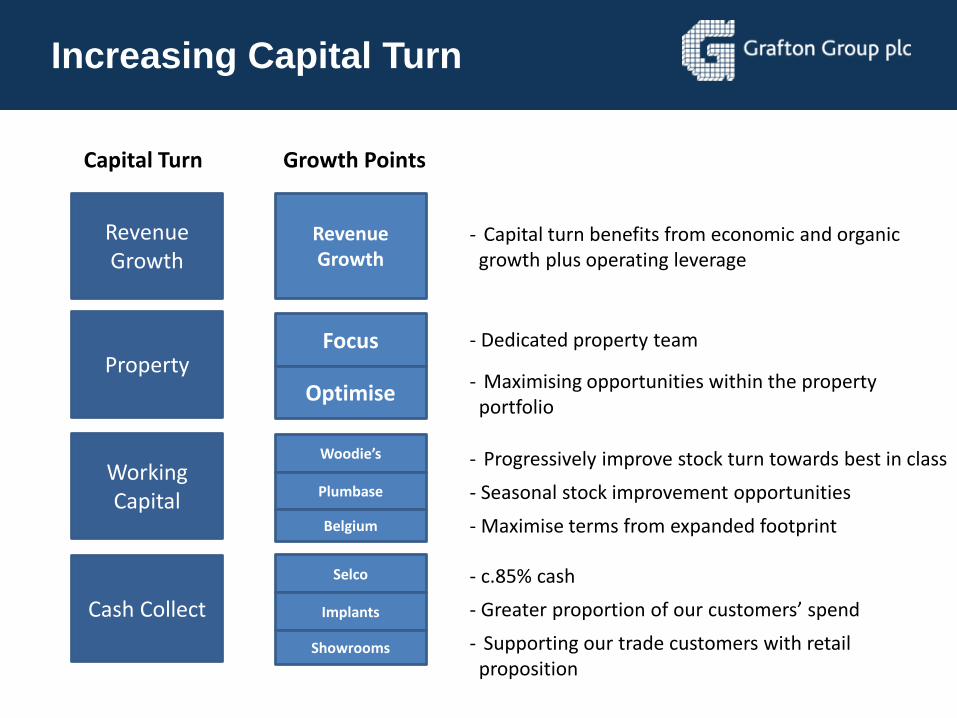
Increasing Capital Turn
Capital Turn
Revenue Growth
Property
Working Capital
Cash Collect
Focus
Optimise
Woodie’s
Plumbase
Belgium
Selco
Implants
Showrooms
- Capital turn benefits from economic and organic growth plus operating leverage
- Dedicated property team
- Maximising opportunities within the property portfolio
- Progressively improve stock turn towards best in class
- Seasonal stock improvement opportunities
- Maximise terms from expanded footprint
- c.85% cash
- Greater proportion of our customers’ spend
- Supporting our trade customers with retail proposition
RevenueGrowth
Growth Points
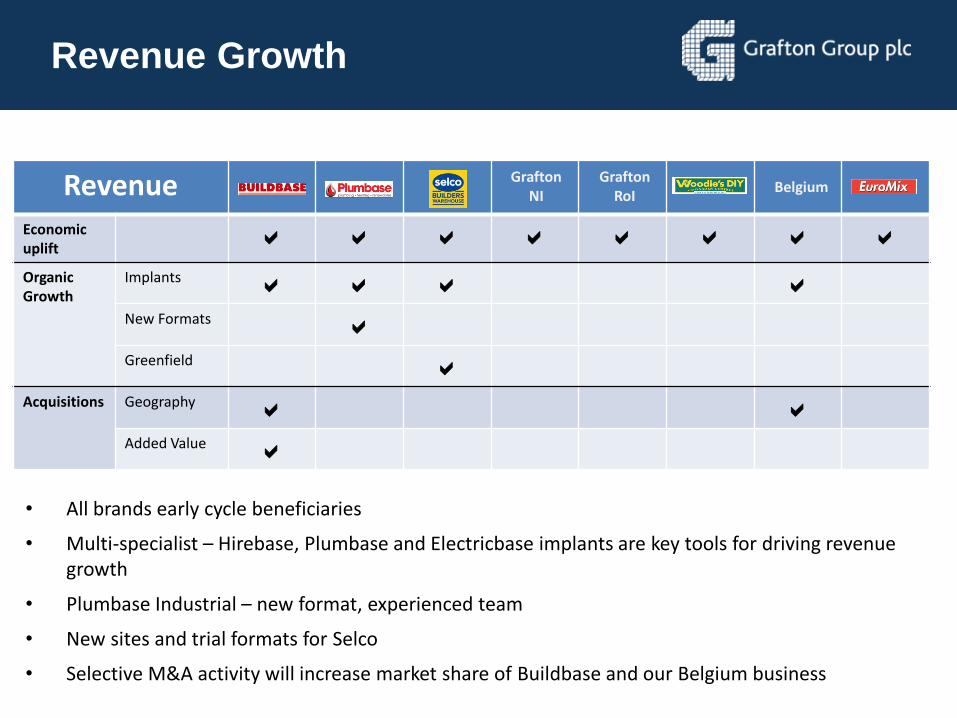
Revenue Growth
RevenueEconomic uplift
a a a a a a a a
Organic Growth
Implants a a a aNew Formats aGreenfield a
Acquisitions Geography a aAdded Value a
Grafton NI
Grafton RoI
Belgium
• All brands early cycle beneficiaries
• Multi-specialist – Hirebase, Plumbase and Electricbase implants are key tools for driving revenue growth
• Plumbase Industrial – new format, experienced team
• New sites and trial formats for Selco
• Selective M&A activity will increase market share of Buildbase and our Belgium business
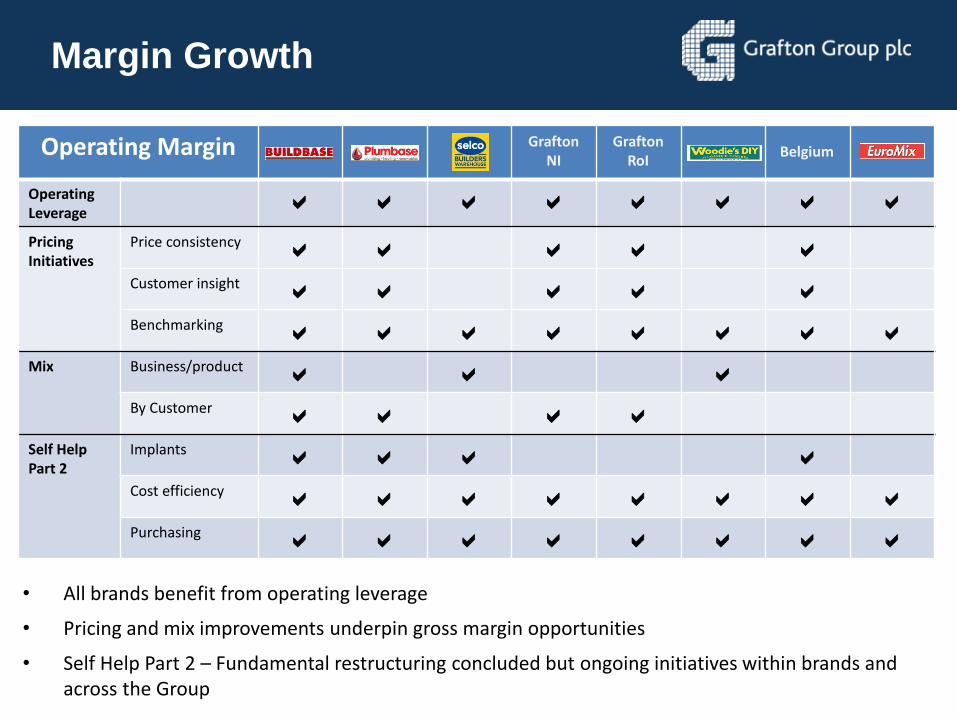
Margin Growth
Operating Margin
Operating Leverage
a a a a a a a a
Pricing Initiatives
Price consistency a a a a aCustomer insight a a a a aBenchmarking a a a a a a a a
Mix Business/product a a aBy Customer a a a a
Self Help Part 2
Implants a a a aCost efficiency a a a a a a a aPurchasing a a a a a a a a
Grafton NI
Grafton RoI
Belgium
• All brands benefit from operating leverage
• Pricing and mix improvements underpin gross margin opportunities
• Self Help Part 2 – Fundamental restructuring concluded but ongoing initiatives within brands and across the Group
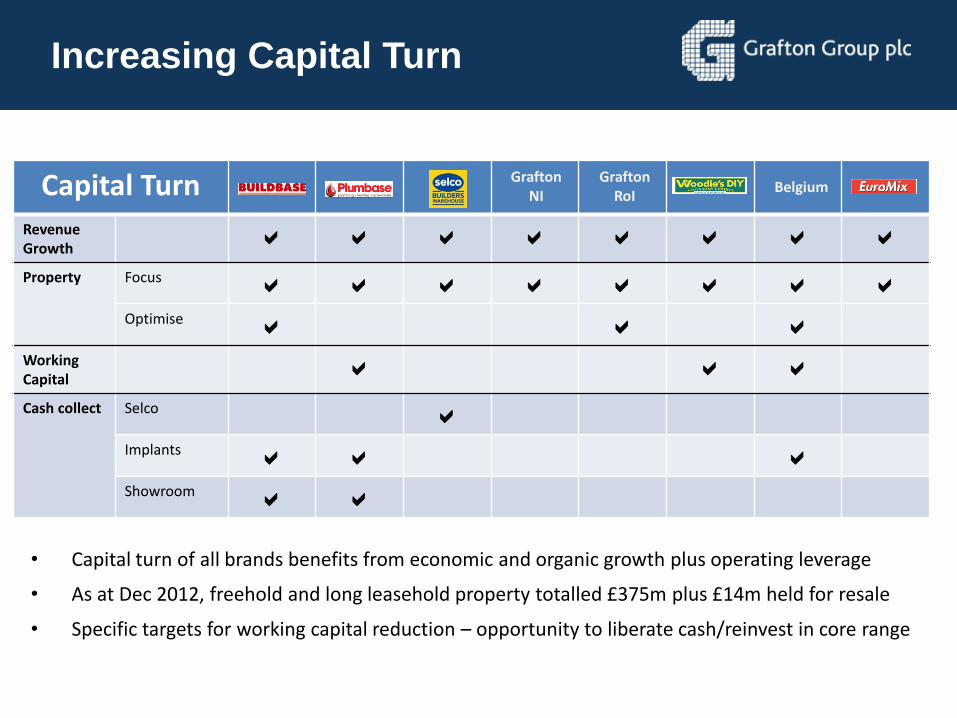
Increasing Capital Turn
Capital TurnRevenue Growth
a a a a a a a a
Property Focus a a a a a a a aOptimise a a a
Working Capital
a a a
Cash collect Selco aImplants a a aShowroom a a
Grafton NI
Grafton RoI
Belgium
• Capital turn of all brands benefits from economic and organic growth plus operating leverage
• As at Dec 2012, freehold and long leasehold property totalled £375m plus £14m held for resale
• Specific targets for working capital reduction – opportunity to liberate cash/reinvest in core range
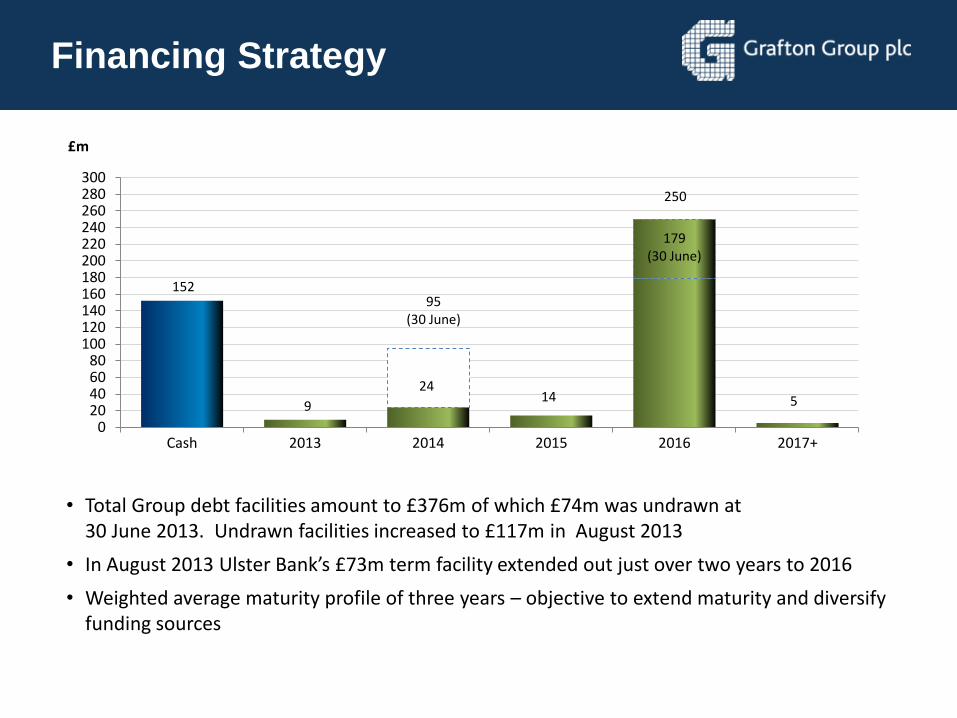
Financing Strategy
15295
(30 June)
9
24
179(30 June)
250
020406080
100120140160180200220240260280300
Cash 2013 2014 2015 2016 2017+
£m
14 5
• Total Group debt facilities amount to £376m of which £74m was undrawn at 30 June 2013. Undrawn facilities increased to £117m in August 2013
• In August 2013 Ulster Bank’s £73m term facility extended out just over two years to 2016
• Weighted average maturity profile of three years – objective to extend maturity and diversify funding sources
Eddie Kelly
CEO
Grafton Merchanting, RoI
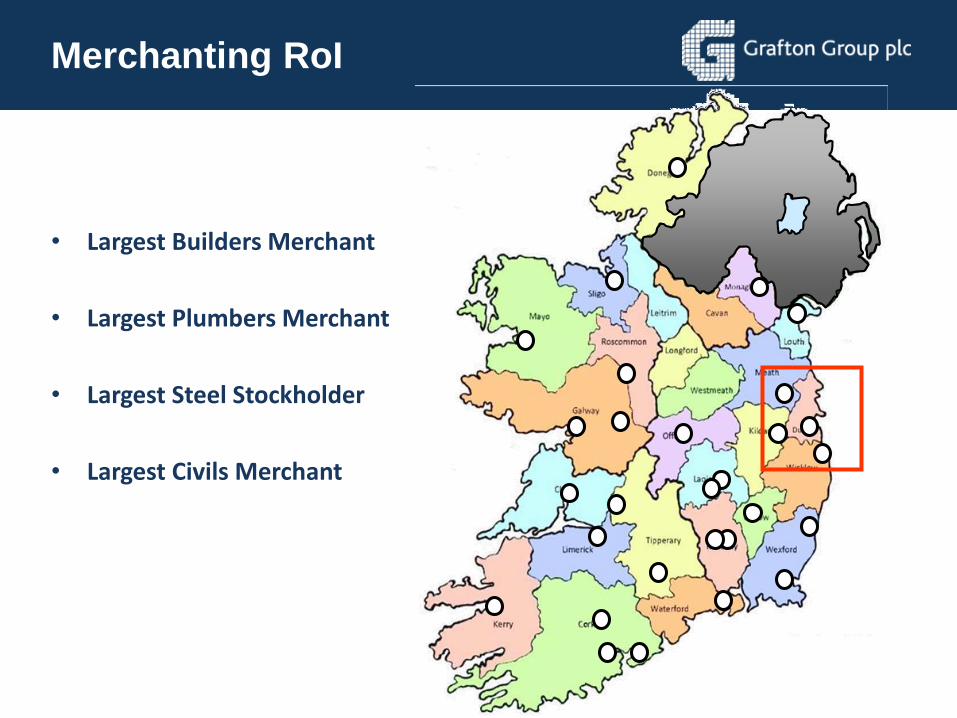
Merchanting RoI
• Largest Builders Merchant
• Largest Plumbers Merchant
• Largest Steel Stockholder
• Largest Civils Merchant

Dublin Area
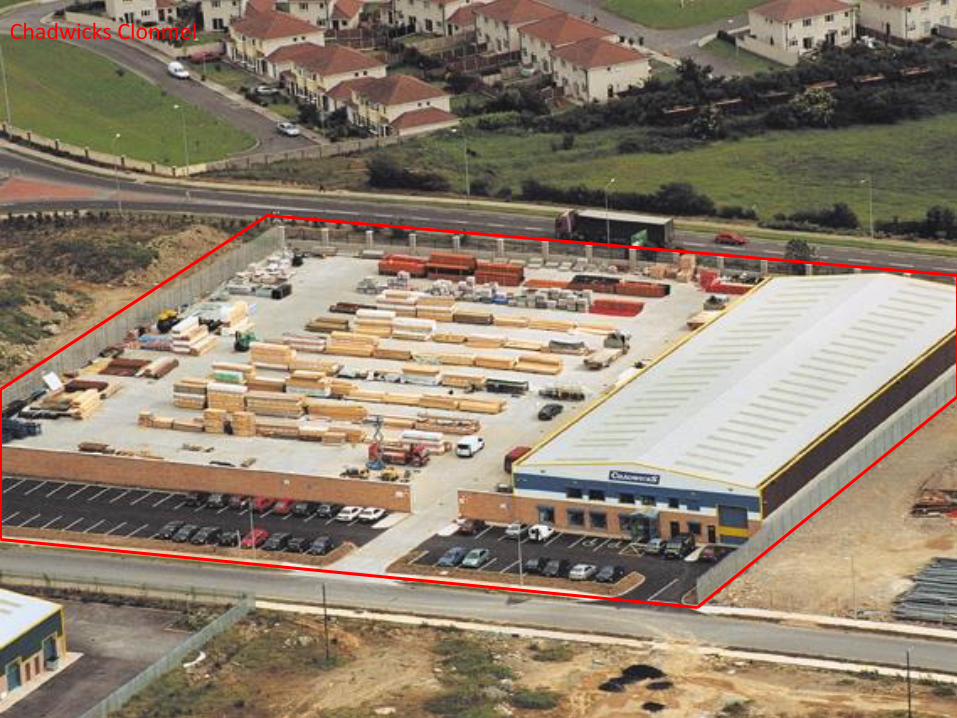
Chadwicks Clonmel
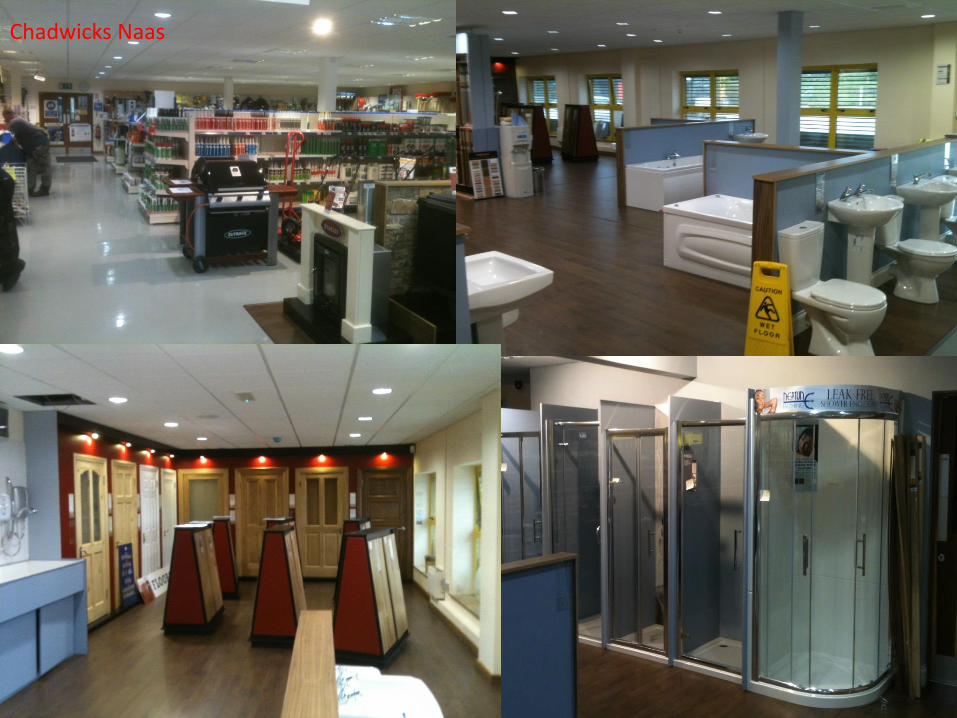
Chadwicks Naas
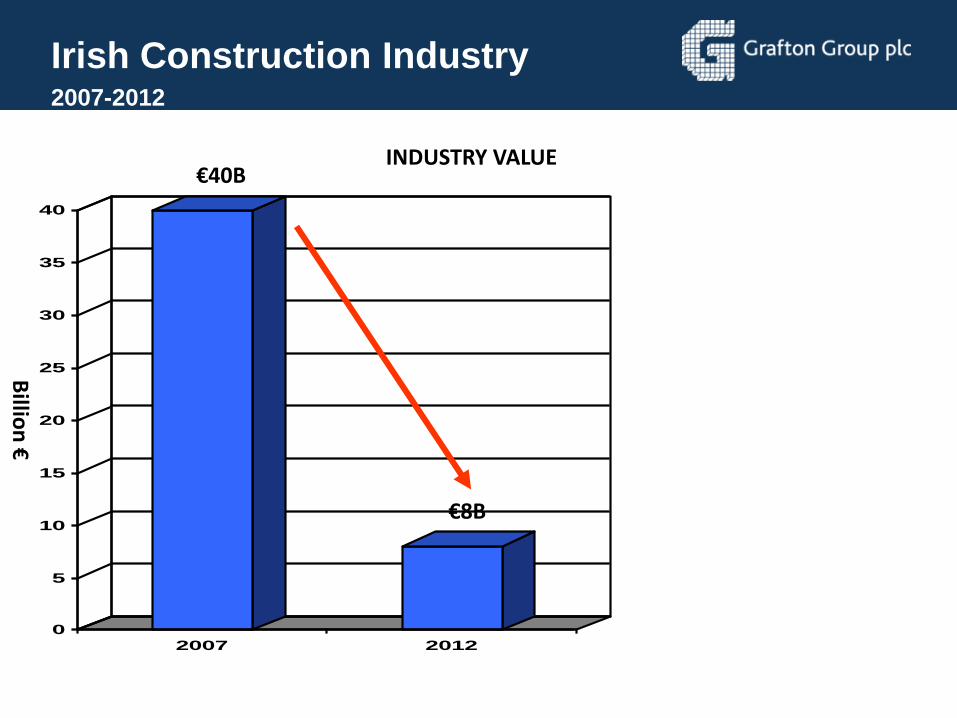
Irish Construction Industry2007-2012
0
5
10
15
20
25
30
35
40
2007 2012
Billio
n €
INDUSTRY VALUE€40B
€8B
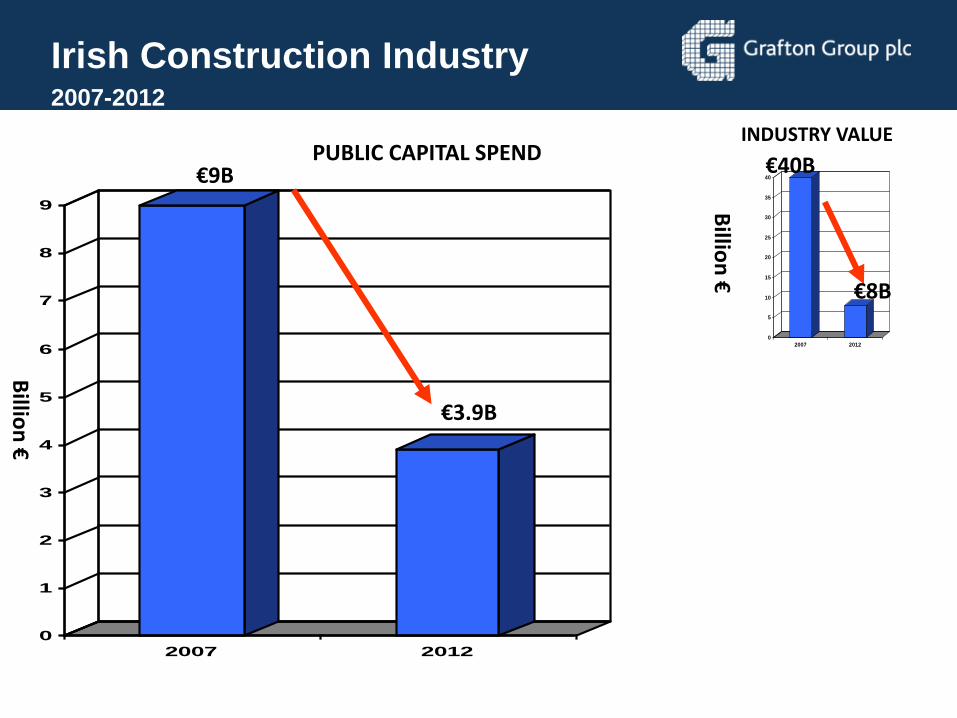
Irish Construction Industry2007-2012
INDUSTRY VALUE
0
5
10
15
20
25
30
35
40
2007 2012
Billio
n €
€40B
€8B
0
1
2
3
4
5
6
7
8
9
2007 2012
Billio
n €
PUBLIC CAPITAL SPEND€9B
€3.9B
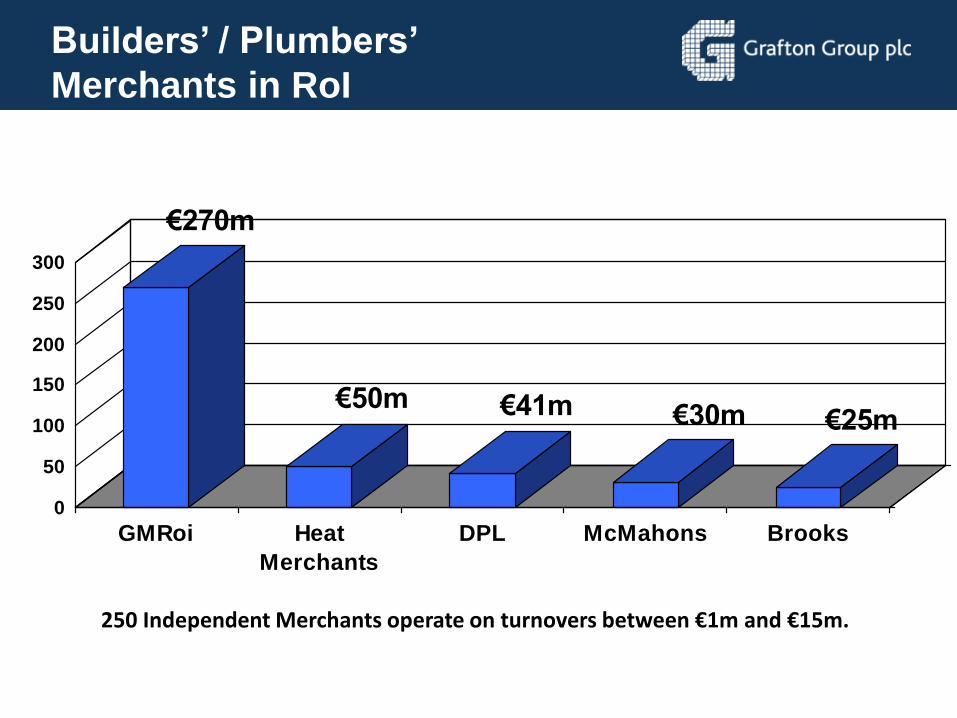
Builders’ / Plumbers’
Merchants in RoI
€270m
€25m€30m€41m€50m
0
50
100
150
200
250
300
GMRoi Heat
Merchants
DPL McMahons Brooks
250 Independent Merchants operate on turnovers between €1m and €15m.
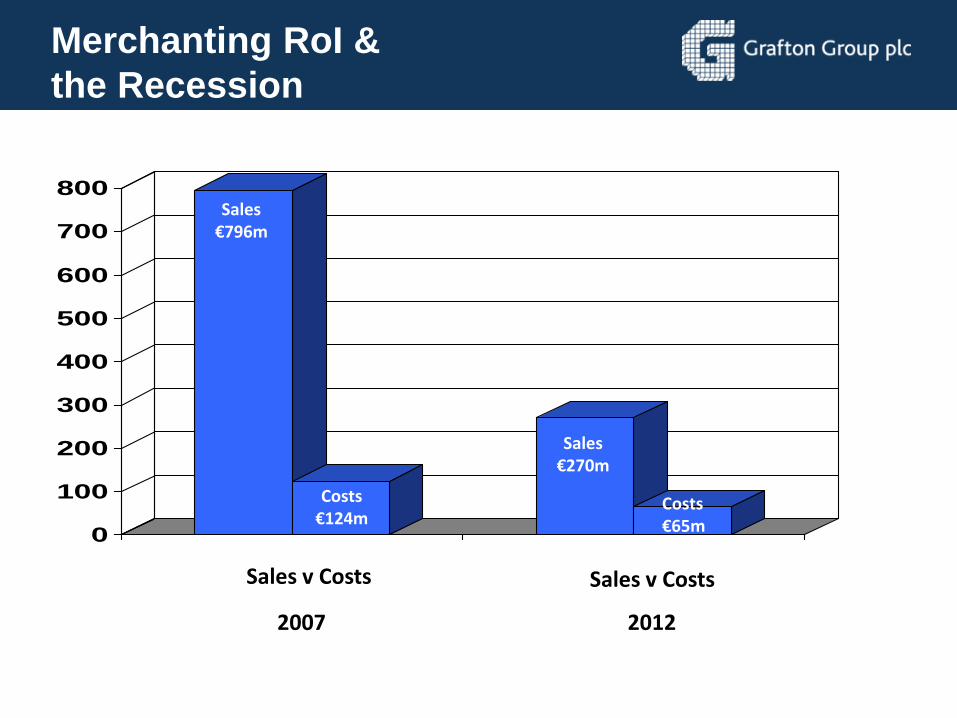
Merchanting RoI &
the Recession
2007 2012
0
100
200
300
400
500
600
700
800Sales
€796m
Sales€270m
Costs€124m
Costs€65m
Sales v Costs Sales v Costs
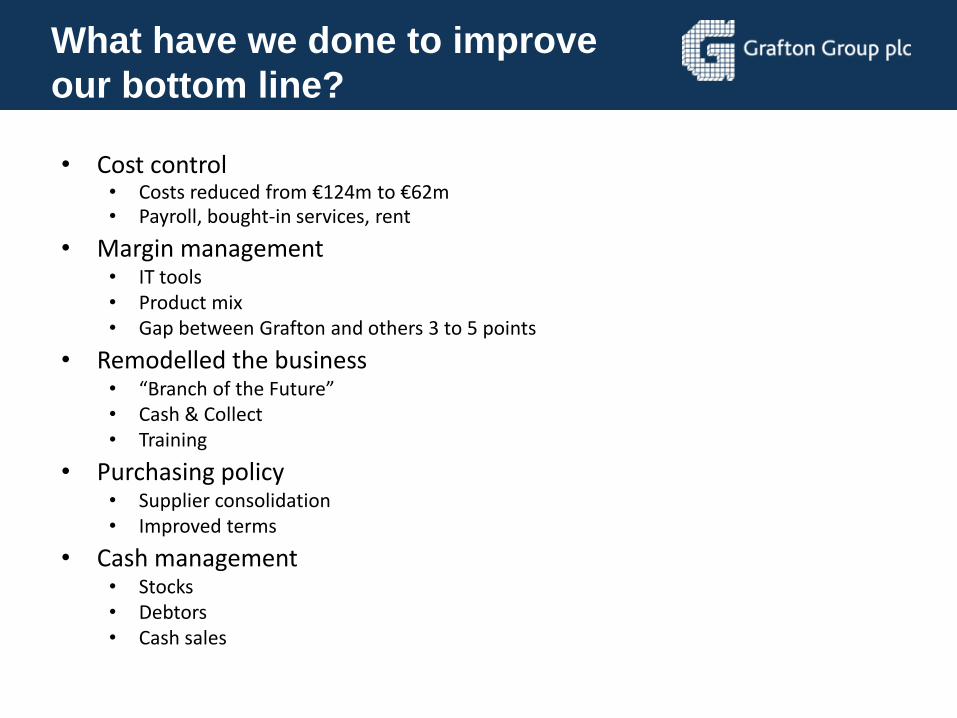
What have we done to improve
our bottom line?
• Cost control• Costs reduced from €124m to €62m• Payroll, bought-in services, rent
• Margin management• IT tools• Product mix• Gap between Grafton and others 3 to 5 points
• Remodelled the business• “Branch of the Future”• Cash & Collect• Training
• Purchasing policy• Supplier consolidation• Improved terms
• Cash management• Stocks• Debtors• Cash sales
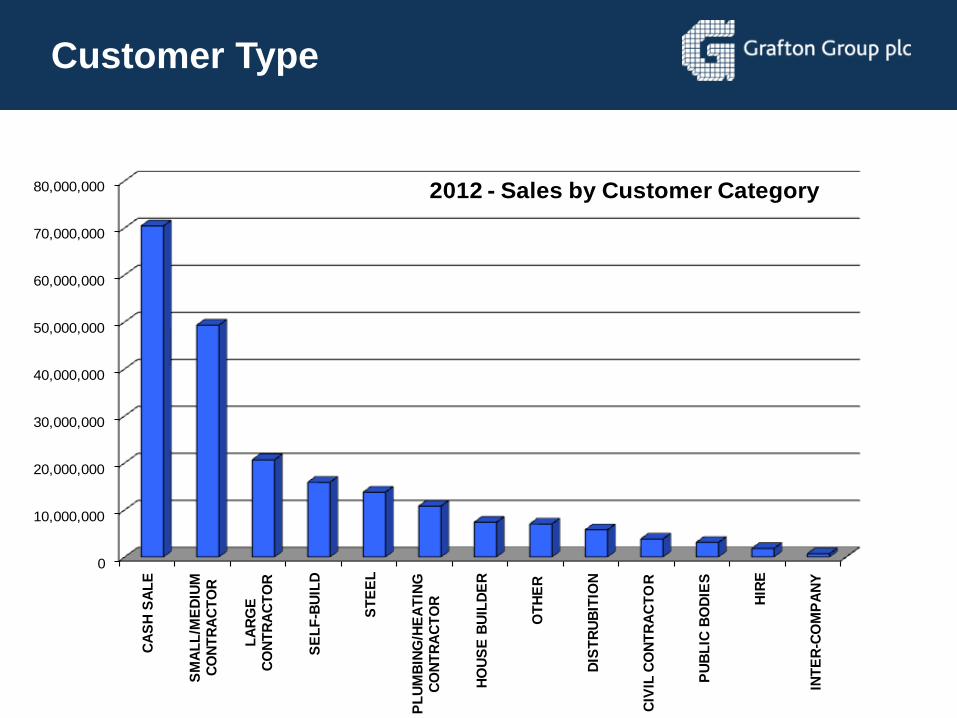
Customer Type
0
10,000,000
20,000,000
30,000,000
40,000,000
50,000,000
60,000,000
70,000,000
80,000,000
CA
SH
SA
LE
SM
AL
L/M
ED
IUM
C
ON
TR
AC
TO
R
LA
RG
E
CO
NT
RA
CT
OR
SE
LF
-BU
ILD
ST
EE
L
PL
UM
BIN
G/H
EA
TIN
G
CO
NT
RA
CT
OR
HO
US
E B
UIL
DE
R
OT
HE
R
DIS
TR
UB
ITIO
N
CIV
IL C
ON
TR
AC
TO
R
PU
BL
IC B
OD
IES
HIR
E
INT
ER
-CO
MP
AN
Y
2012 - Sales by Customer Category
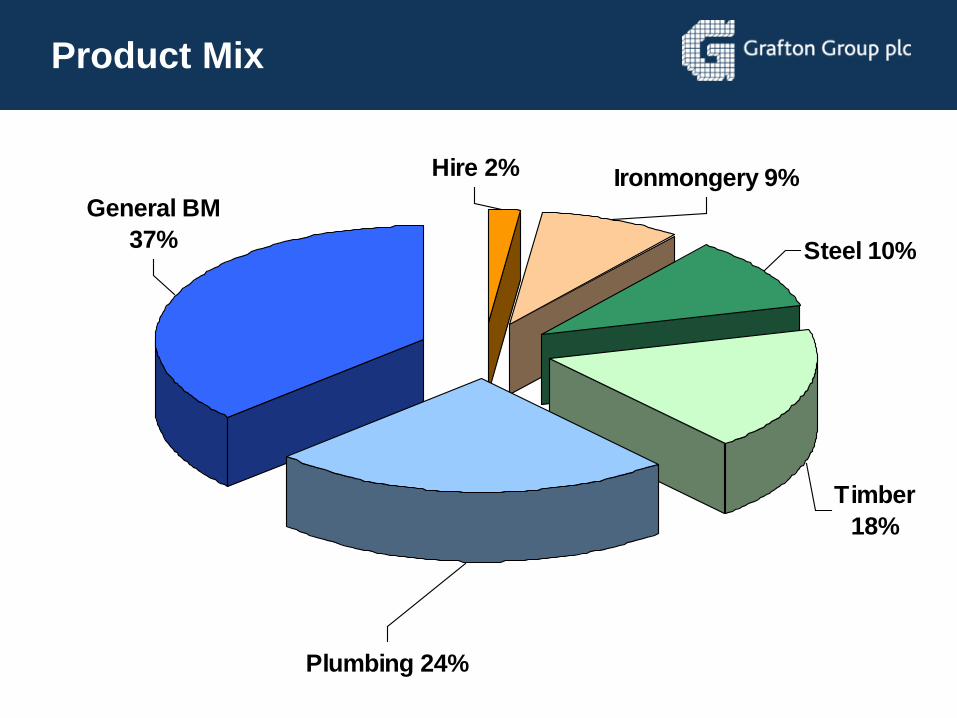
Product Mix
Ironmongery 9%Hire 2%
Timber
18%
Steel 10%
Plumbing 24%
General BM
37%
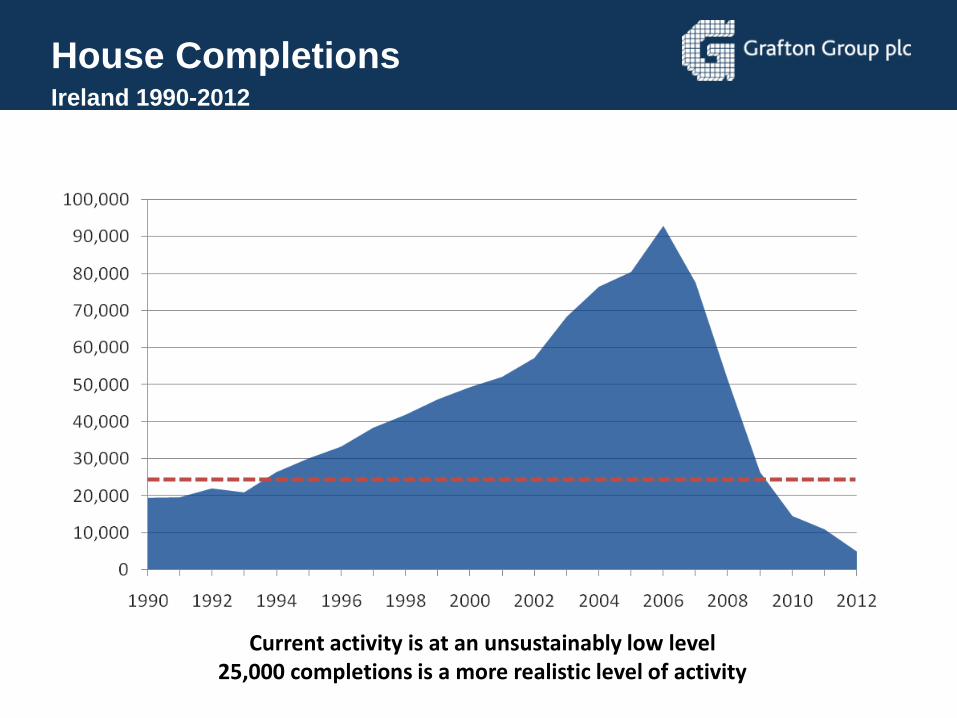
House CompletionsIreland 1990-2012
Current activity is at an unsustainably low level25,000 completions is a more realistic level of activity
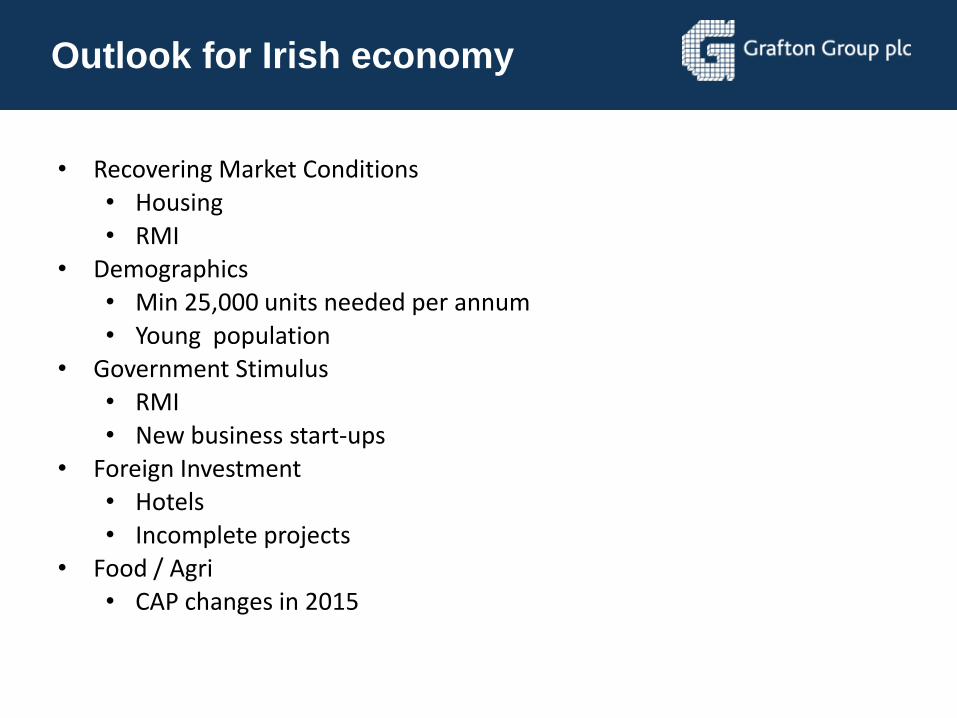
Outlook for Irish economy
• Recovering Market Conditions• Housing
• RMI• Demographics
• Min 25,000 units needed per annum
• Young population• Government Stimulus
• RMI
• New business start-ups• Foreign Investment
• Hotels
• Incomplete projects• Food / Agri
• CAP changes in 2015
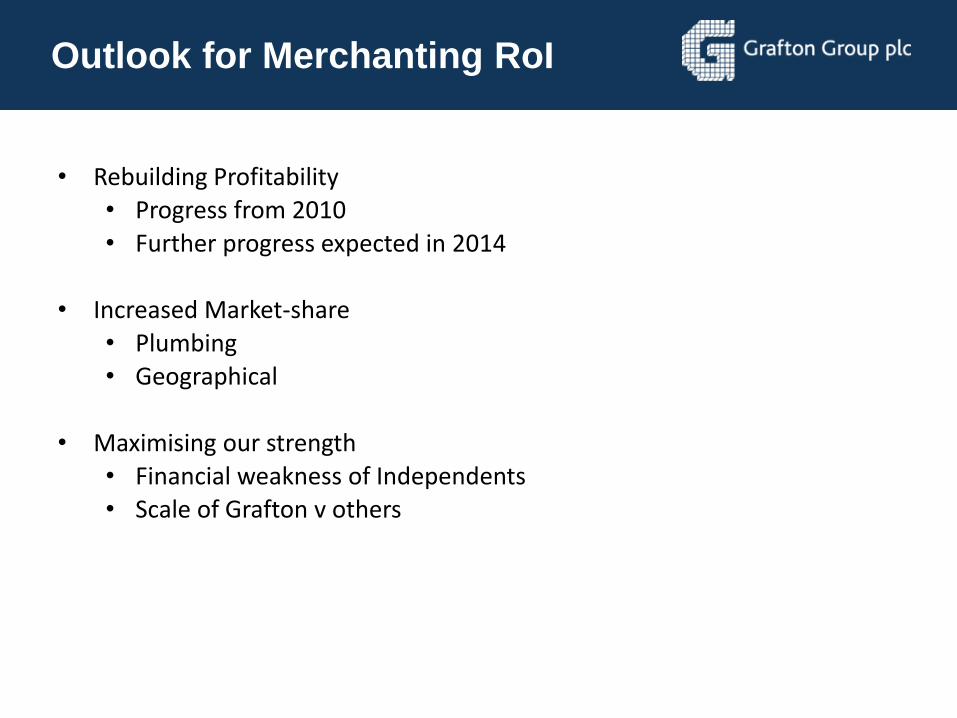
Outlook for Merchanting RoI
• Rebuilding Profitability• Progress from 2010
• Further progress expected in 2014
• Increased Market-share
• Plumbing• Geographical
• Maximising our strength• Financial weakness of Independents• Scale of Grafton v others
Selco video presentation
Joe Sowton
Group Strategic
Development Director
Our Strategy
• A focussed supplier of construction materials
• Active in the UK, Ireland and Belgium
• Our reputation is built on service
• Market leading positions
• To expand both organically and into new markets
What sets Grafton apart?
• We aim to lead not follow the market
• ‘Multi specialist’ stores
• Market leader in Ireland
• Selco – unique model
• Strong local management
• Group structure and disciplines
• High service levels
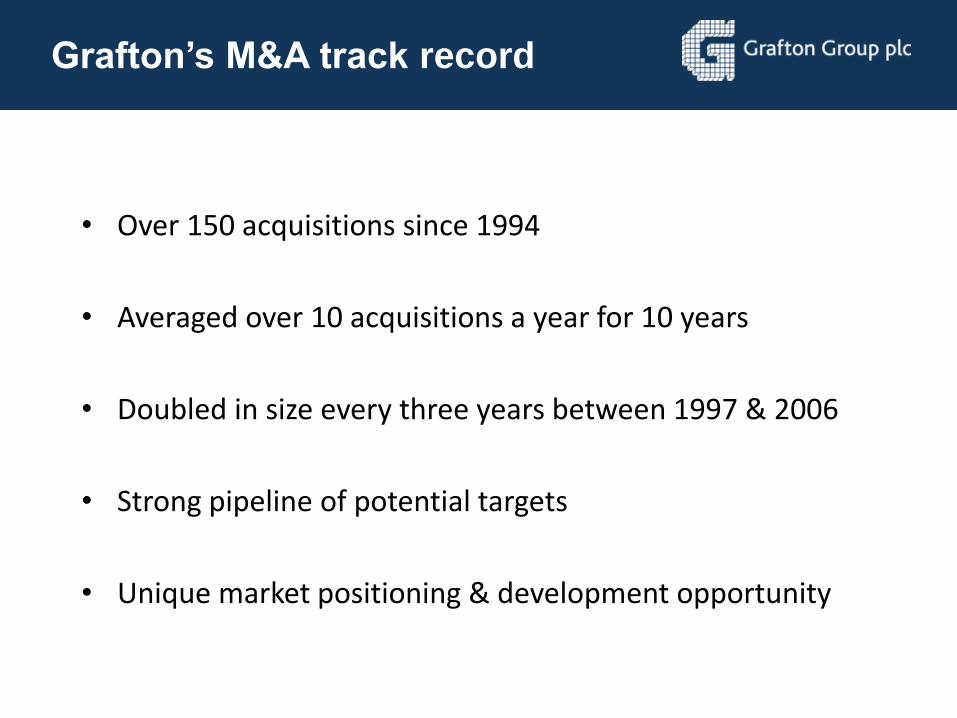
Grafton’s M&A track record
• Over 150 acquisitions since 1994
• Averaged over 10 acquisitions a year for 10 years
• Doubled in size every three years between 1997 & 2006
• Strong pipeline of potential targets
• Unique market positioning & development opportunity
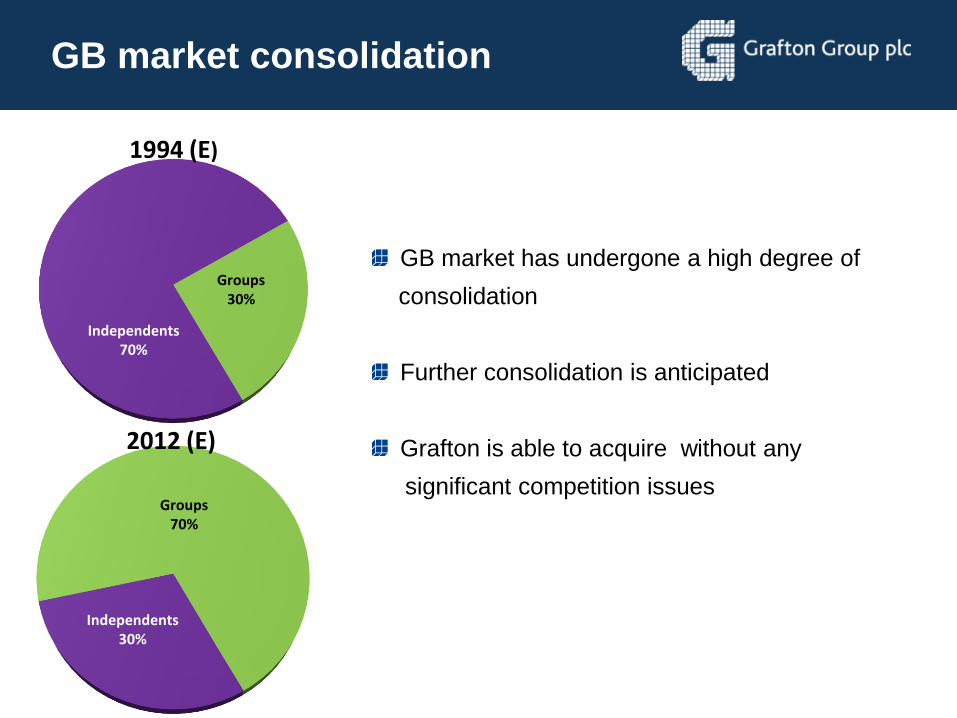
GB market consolidation
Independents70%
Groups30%
Independents30%
Groups70%
1994 (E)
2012 (E)
GB market has undergone a high degree of
consolidation
Further consolidation is anticipated
Grafton is able to acquire without any
significant competition issues
Effect of consolidation
• Rapid growth of largest Groups
• Modern efficient outlets
• IT transforms efficiency and communication
• Wider range of products and services
• Retail custom encouraged
• Industry professionalised
• Buying groups evolved
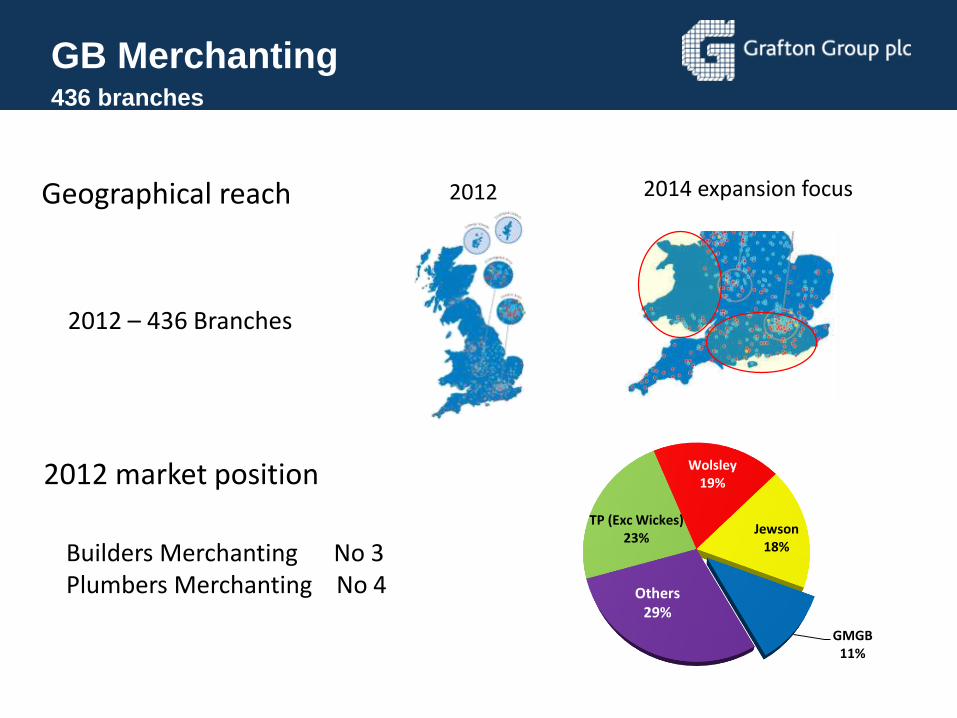
GB Merchanting436 branches
Geographical reach
2012 market position
TP (Exc Wickes)23%
Wolsley19%
Jewson18%
GMGB11%
Others29%
2012 2014 expansion focus
Builders Merchanting No 3Plumbers Merchanting No 4
2012 – 436 Branches
Source: Management data
GB Merchantingfocus on growth
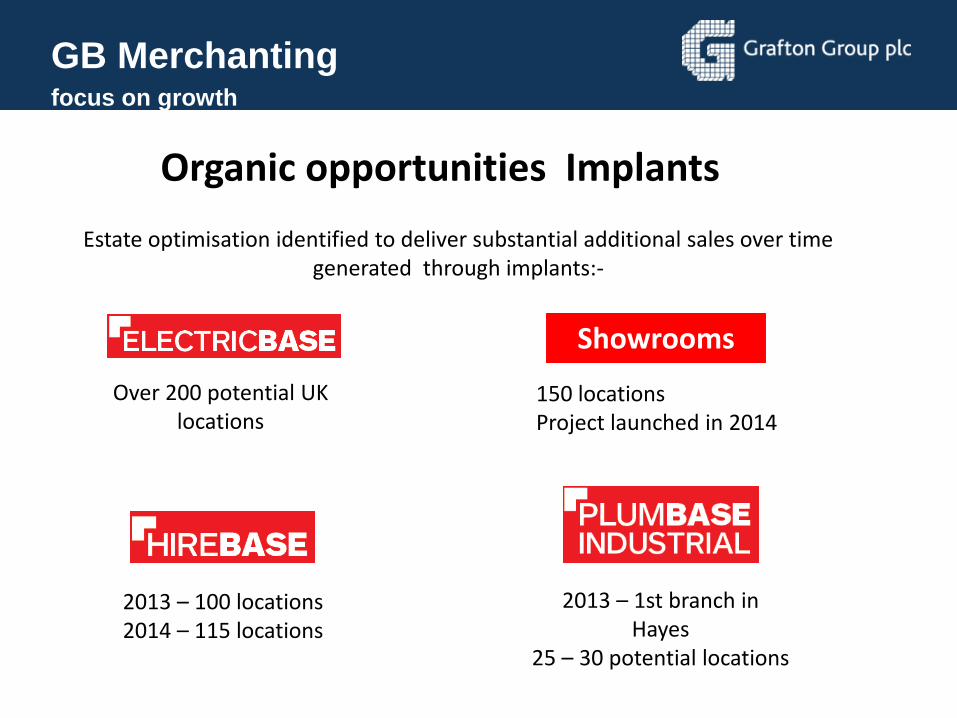
Organic opportunities Implants
Over 200 potential UK locations
150 locationsProject launched in 2014
Estate optimisation identified to deliver substantial additional sales over time generated through implants:-
2013 – 100 locations2014 – 115 locations
Showrooms
2013 – 1st branch in Hayes
25 – 30 potential locations
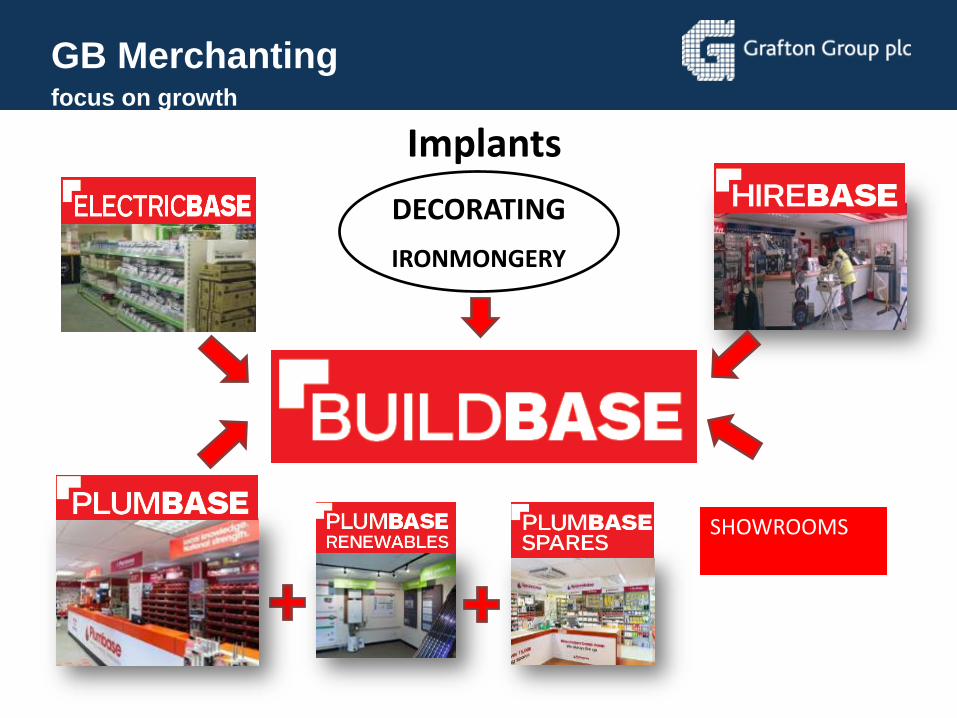
GB Merchantingfocus on growth
Implants
DECORATING
IRONMONGERY
SHOWROOMS
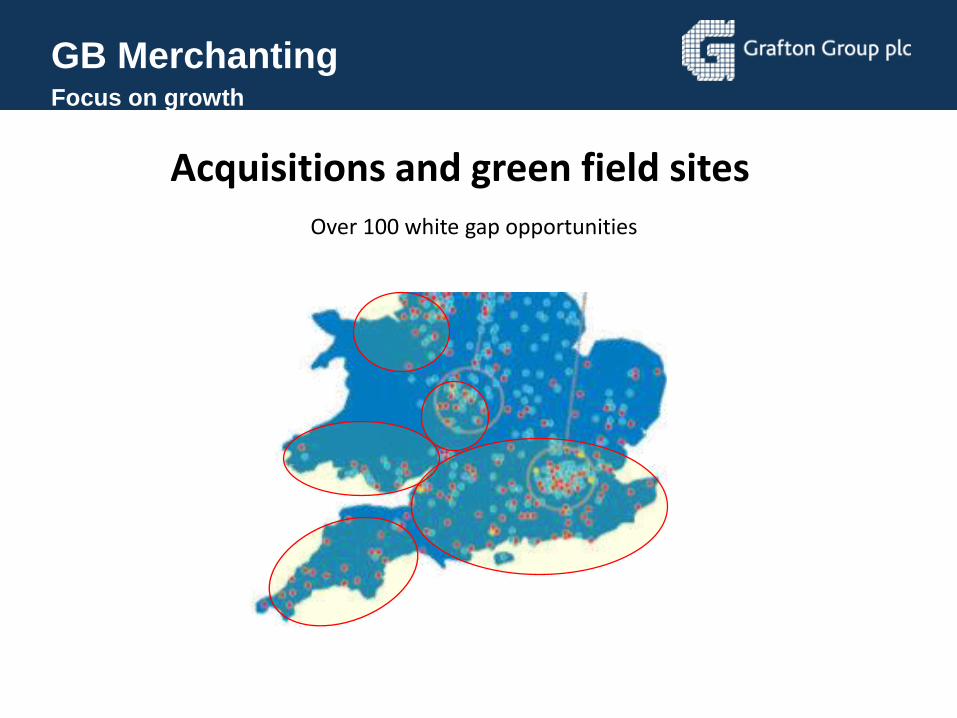
GB MerchantingFocus on growth
Over 100 white gap opportunities
Acquisitions and green field sites
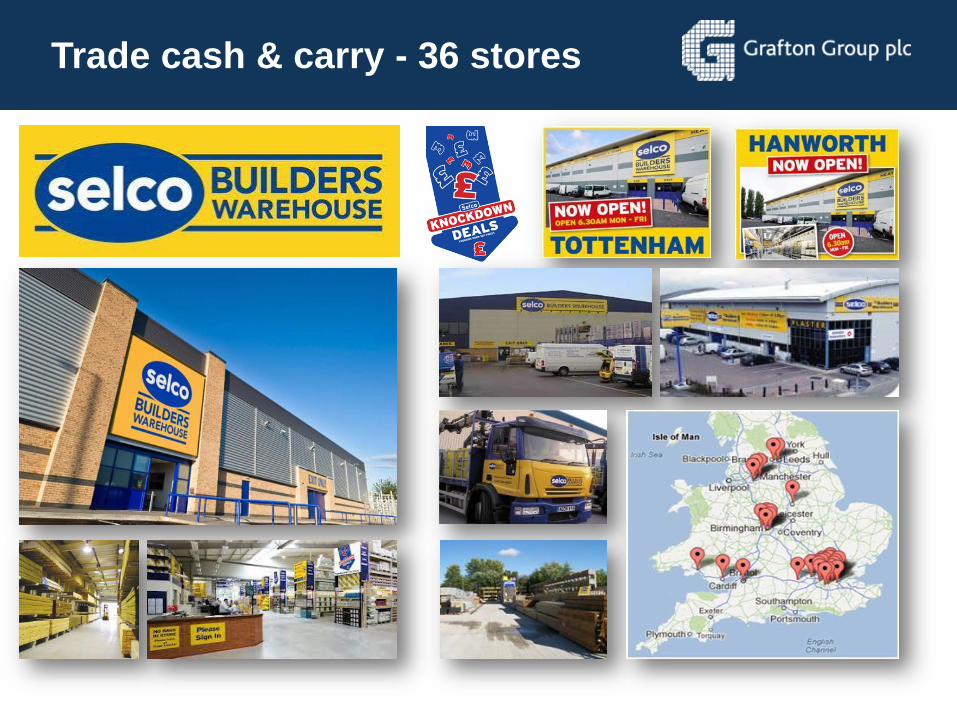
Trade cash & carry - 36 stores
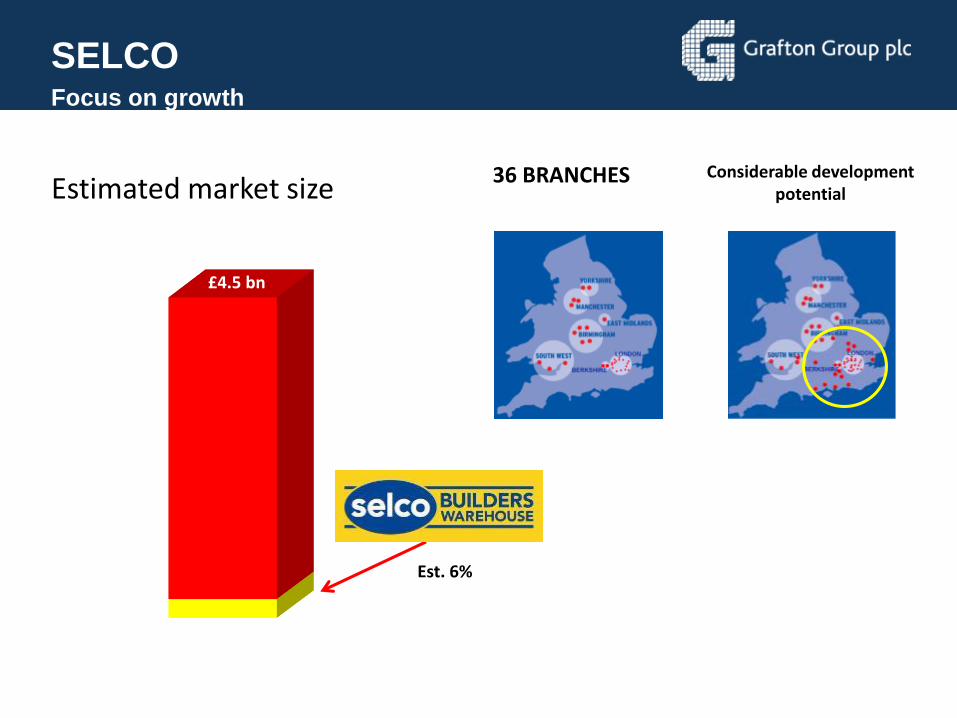
SELCOFocus on growth
36 BRANCHES Considerable development potential
£4.5 bn
Est. 6%
Estimated market size
Source: Management estimate
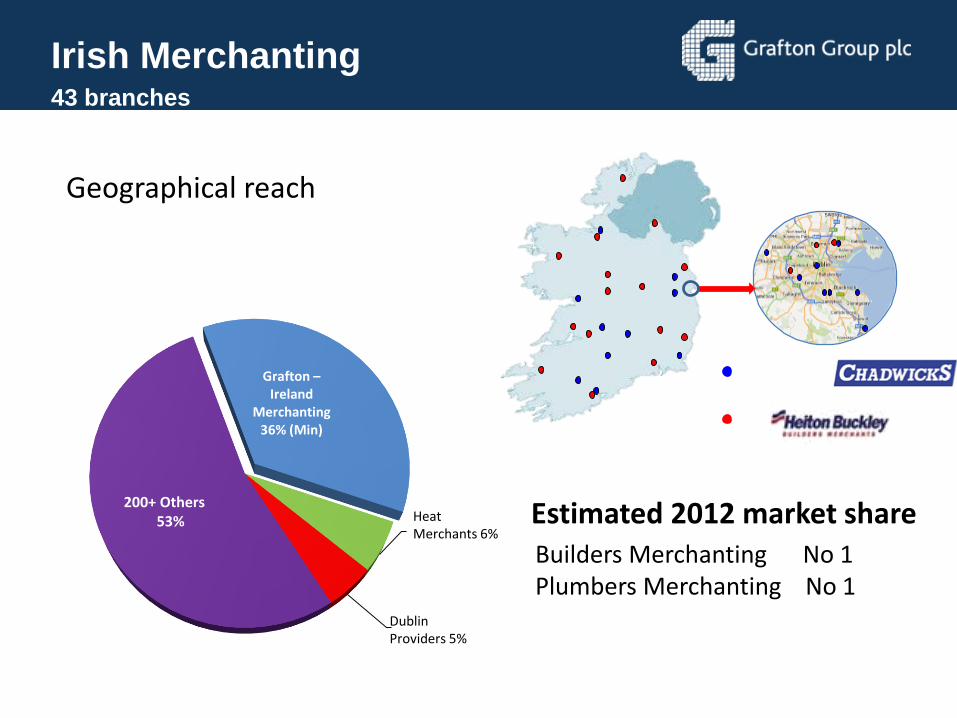
Irish Merchanting43 branches
Estimated 2012 market shareHeat Merchants 6%
Dublin Providers 5%
Grafton –Ireland
Merchanting36% (Min)
200+ Others53% Heat
Merchants 6%
Geographical reach
Builders Merchanting No 1Plumbers Merchanting No 1
DublinProviders 5%
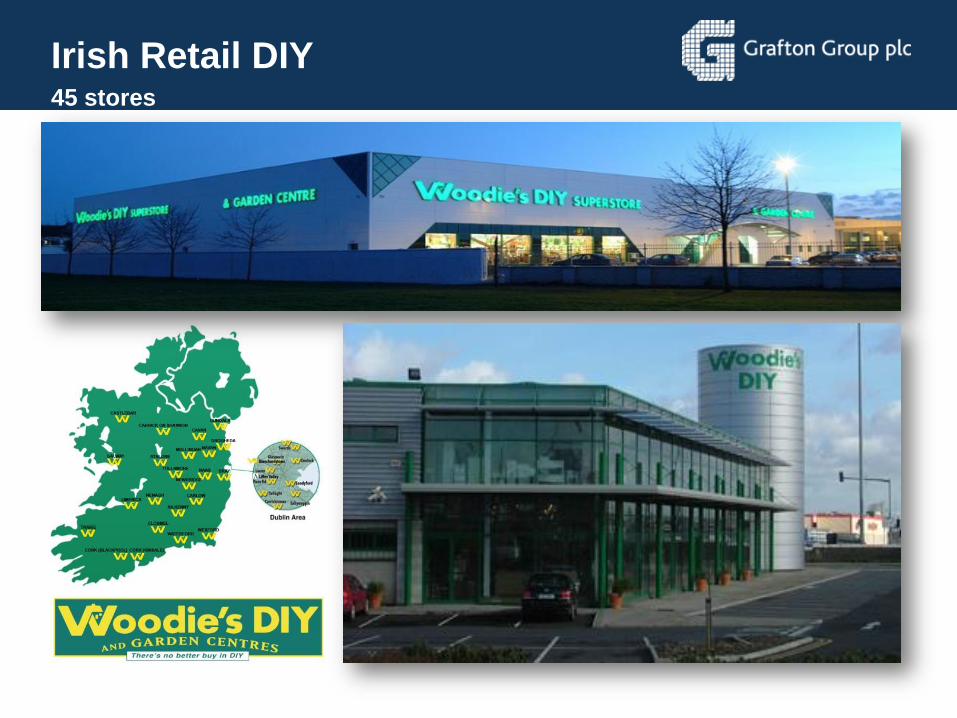
Irish Retail DIY45 stores
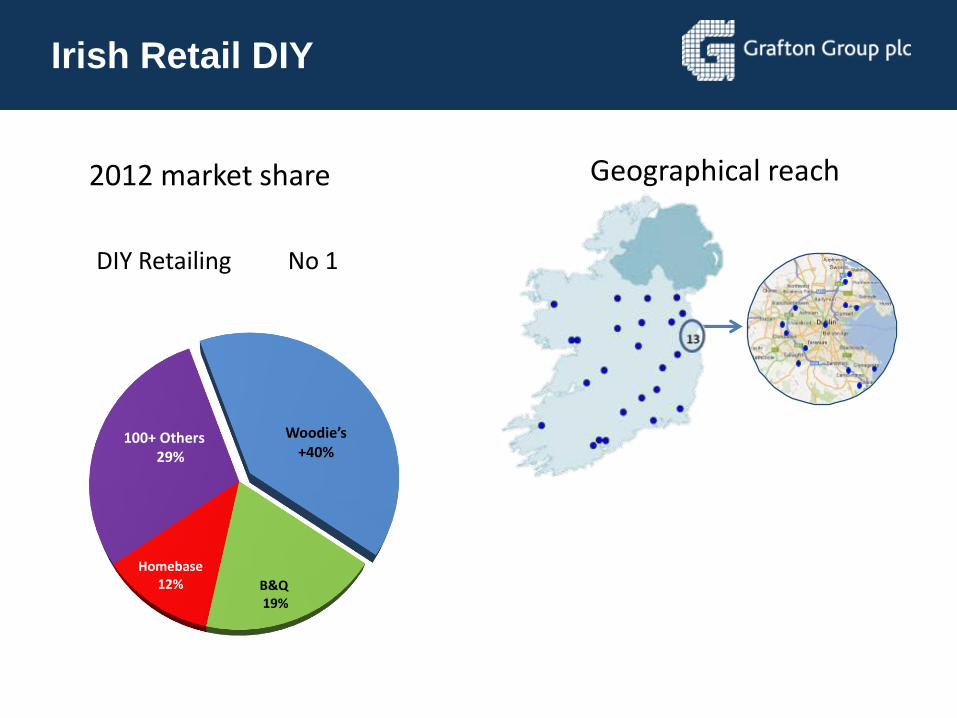
Irish Retail DIY
2012 market share
Woodie’s+40%
B&Q19%
Homebase12%
100+ Others29%
Geographical reach
DIY Retailing No 1
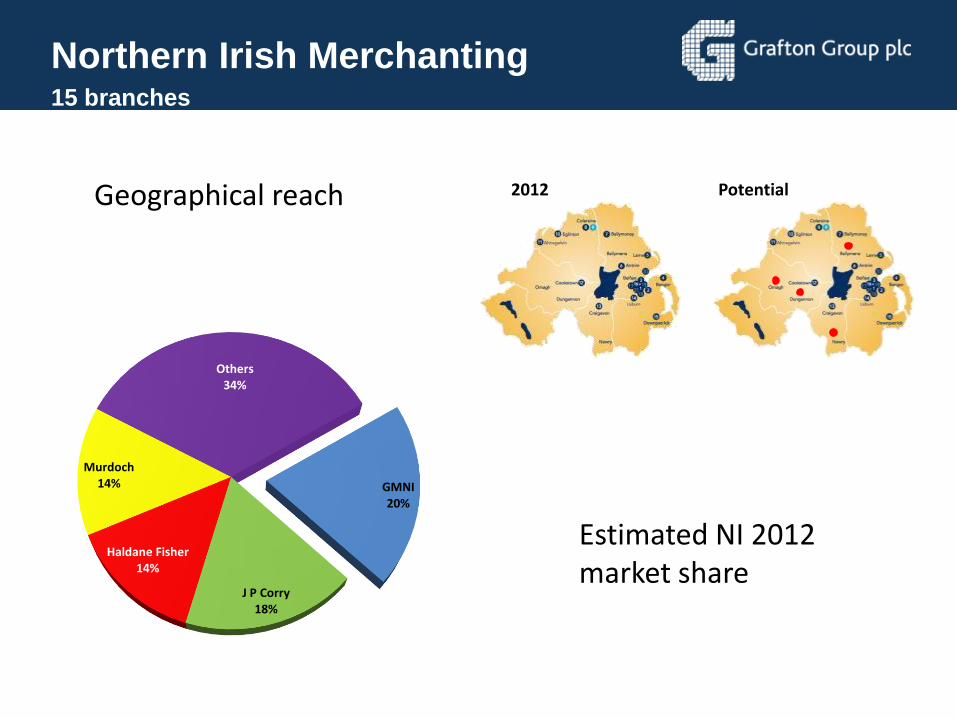
Northern Irish Merchanting15 branches
Estimated NI 2012 market share
GMNI20%
J P Corry18%
Haldane Fisher14%
Murdoch14%
Others34%
2012 PotentialGeographical reach
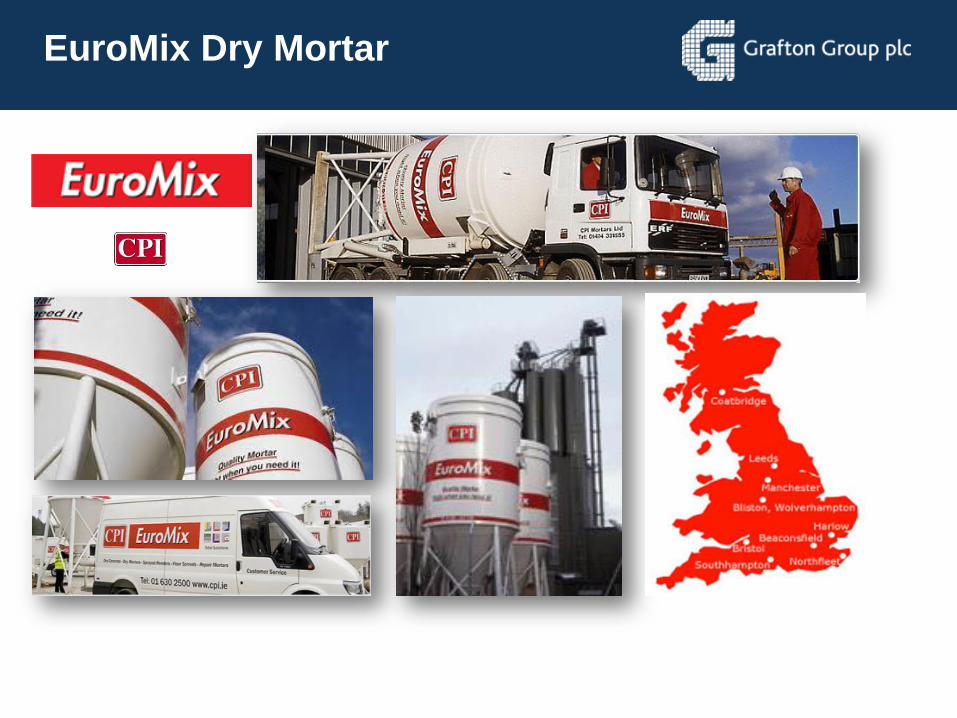
EuroMix Dry Mortar
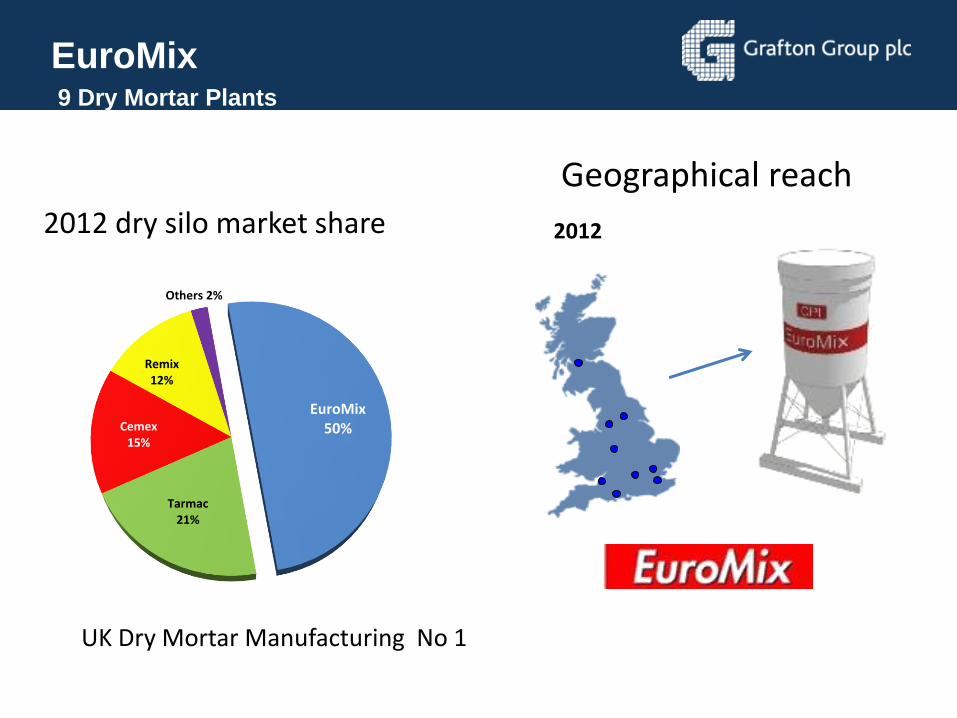
EuroMix9 Dry Mortar Plants
2012 dry silo market share
EuroMix50%
Tarmac21%
Cemex 15%
Remix12%
Others 2%
2012
Geographical reach
UK Dry Mortar Manufacturing No 1
Where can we add value?
• Transferable skills & knowhow
• Synergies
• Experience of growth
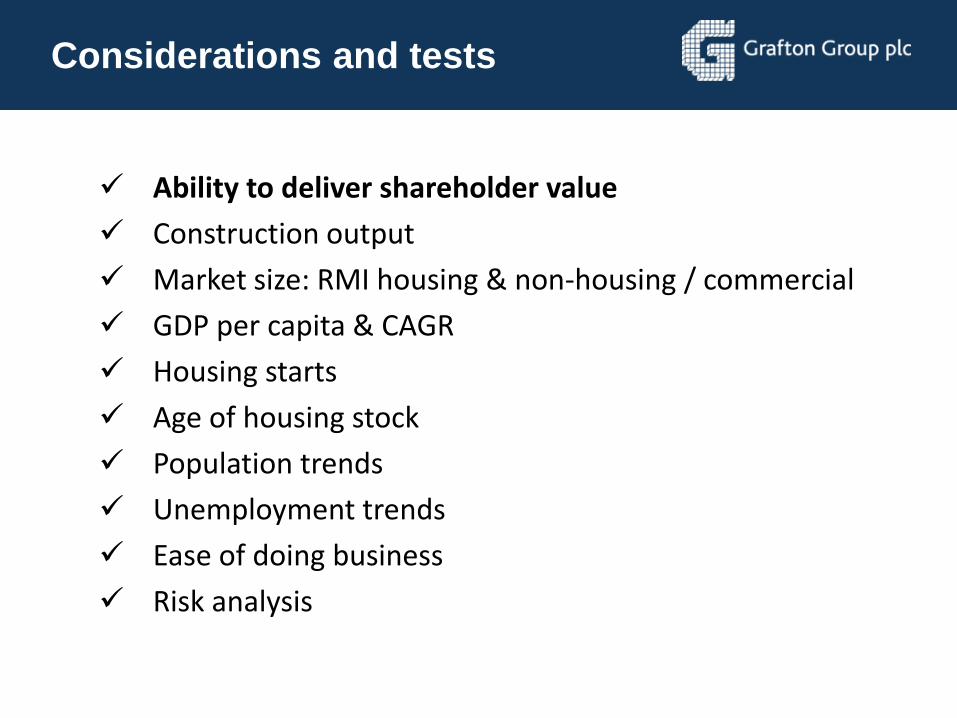
Considerations and tests
Ability to deliver shareholder value
Construction output
Market size: RMI housing & non-housing / commercial
GDP per capita & CAGR
Housing starts
Age of housing stock
Population trends
Unemployment trends
Ease of doing business
Risk analysis
Expansion into Belgium
GRAFTON’S JOINT VENTURE WITH ROUSSEL NV - 2009
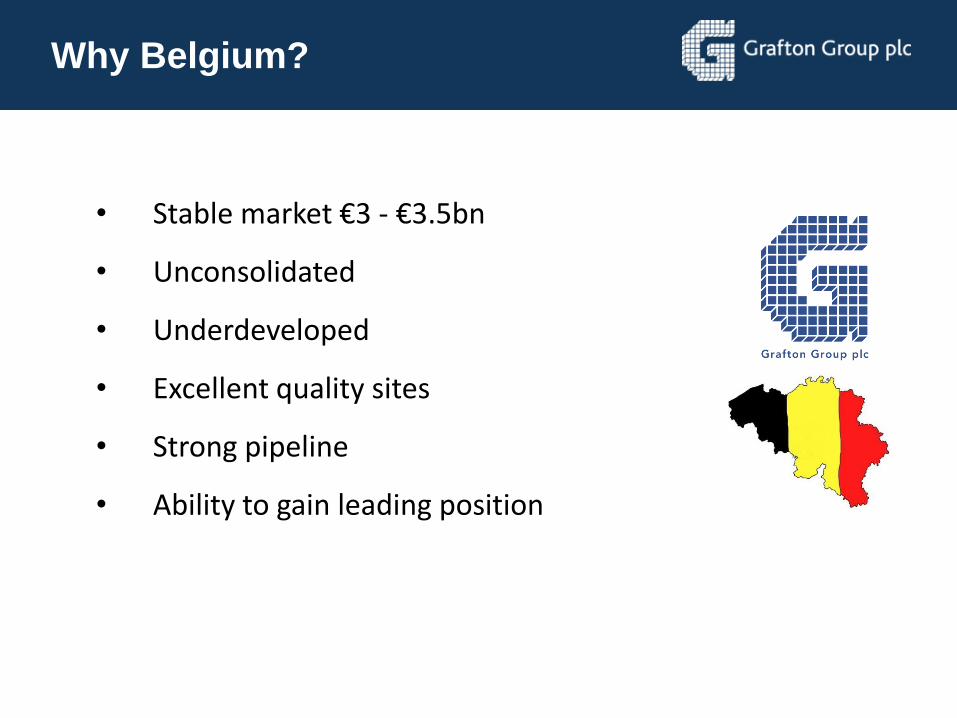
Why Belgium?
• Stable market €3 - €3.5bn
• Unconsolidated
• Underdeveloped
• Excellent quality sites
• Strong pipeline
• Ability to gain leading position
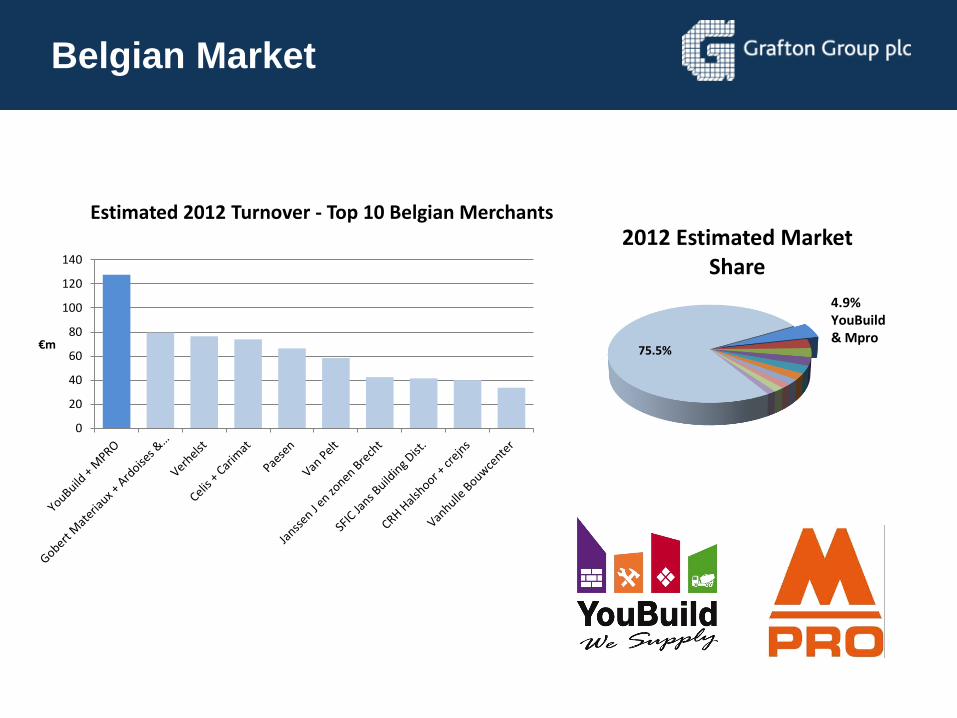
Belgian Market
0
20
40
60
80
100
120
140
€m
Estimated 2012 Turnover - Top 10 Belgian Merchants
75.5%
2012 Estimated Market Share
4.9%YouBuild & Mpro
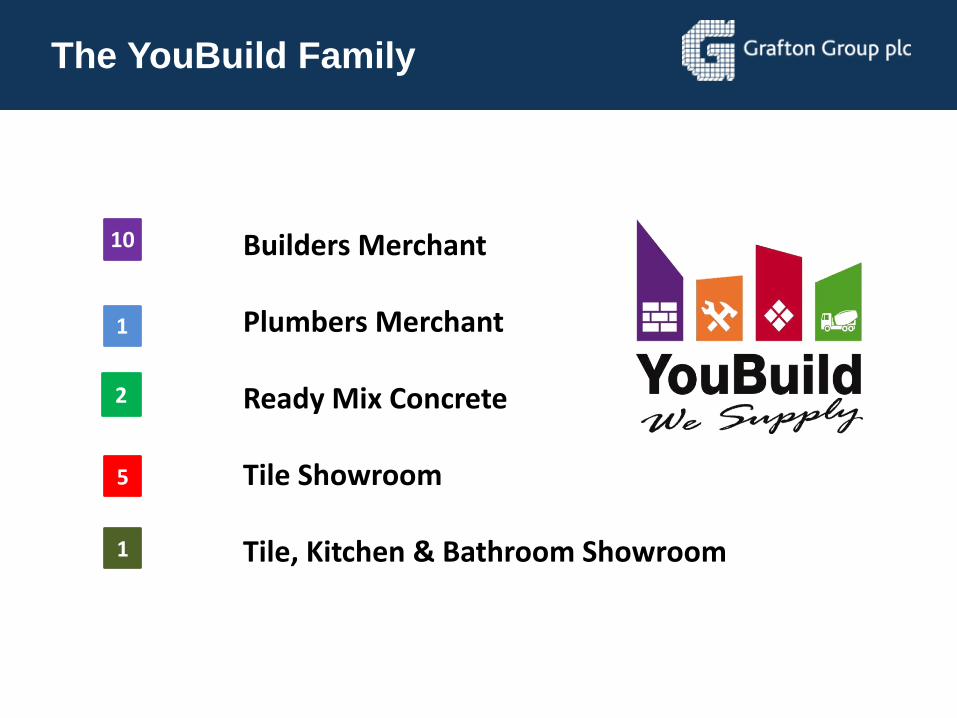
The YouBuild Family
10
2
5
1
1
Builders Merchant
Plumbers Merchant
Ready Mix Concrete
Tile Showroom
Tile, Kitchen & Bathroom Showroom
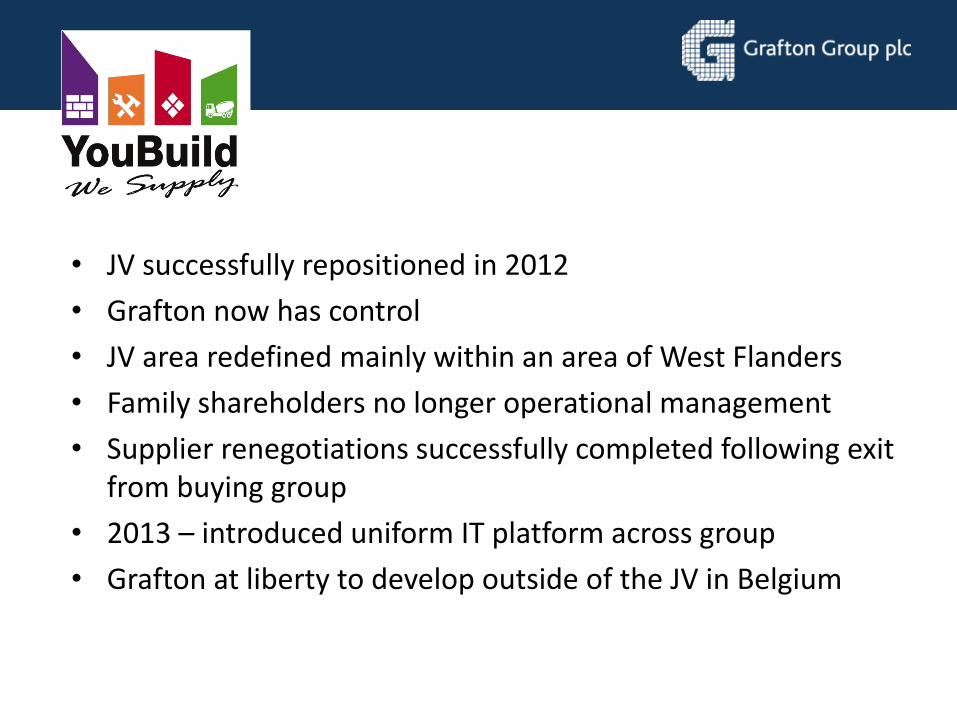
• JV successfully repositioned in 2012
• Grafton now has control
• JV area redefined mainly within an area of West Flanders
• Family shareholders no longer operational management
• Supplier renegotiations successfully completed following exit from buying group
• 2013 – introduced uniform IT platform across group
• Grafton at liberty to develop outside of the JV in Belgium
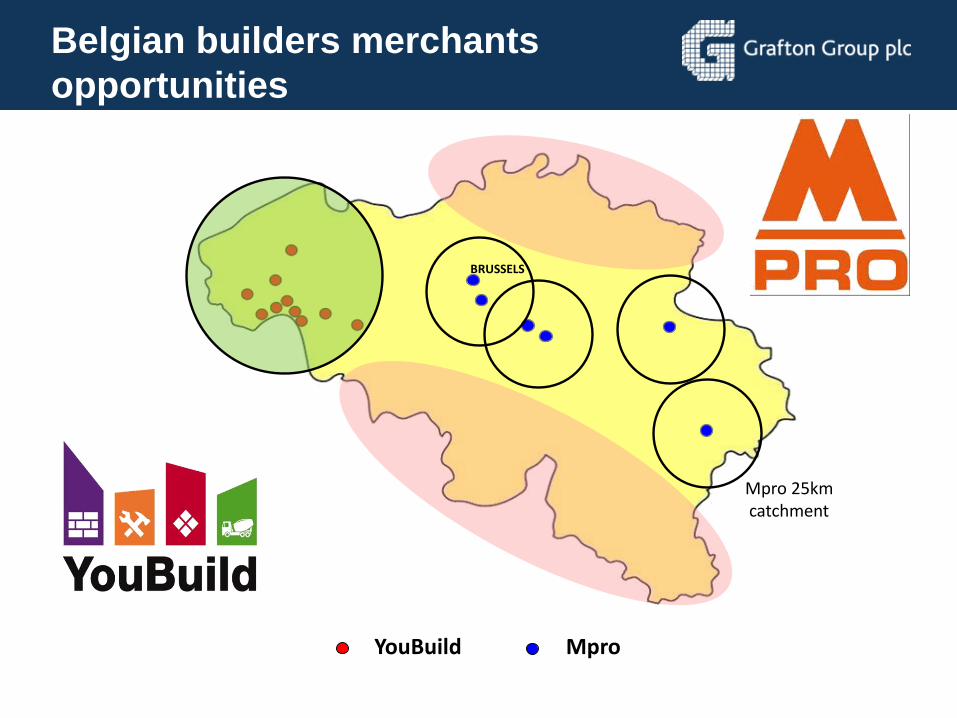
Belgian builders merchants
opportunities
YouBuild Mpro
Mpro 25kmcatchment
BRUSSELS
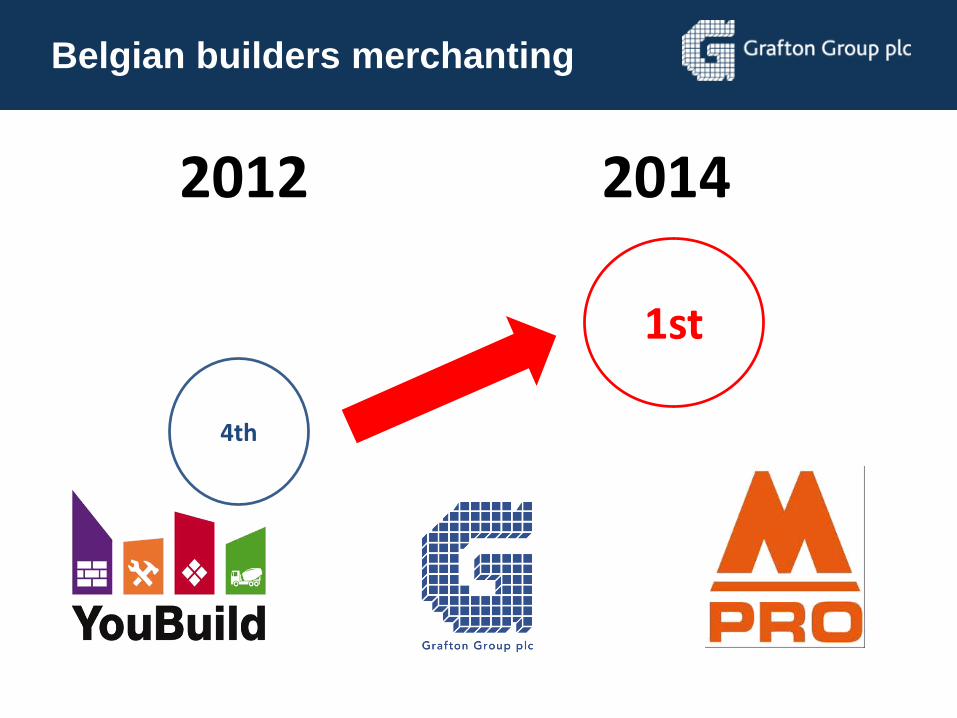
Belgian builders merchanting
1st
4th
2012 2014
Summary
• Key focus on UK growth
• Well positioned in Ireland
• Significant progress in Belgium
• Potential to develop internationally
Gavin Slark
Chief Executive Officer
Outlook and Summary
Outlook - UK
• Economy growing at moderate rate as recovery takes hold
• Clear signs that the housing market has strengthened
• Improving trend in housing transactions and mortgage approvals
• Economic and housing market backdrop supportive of increase in RMI volumes in merchanting market
• Internal developments also providing a platform for growth
• Government help to buy measures will benefit the Group but we anticipate a time delay
Outlook - Ireland
• Domestic economy starting to stabilise – after contracting for five years
• Downturn in housing construction bottoming out
• House price stabilisation expected to become more broadly based geographically
• Housing transactions and mortgage approvals coming off a low base
Summary
• Grafton has managed the recession well
• Experienced Executive management team now in place
• Significant potential for organic growth
• UK acquisition opportunities
• Scope for further international development
Thank you for listening
Questions and answers